Special Administrative Board Of The Transitional School District … · 2019-12-20 · PowerSchool....
124
Special Administrative Board Of The Transitional School District Of The City Of St. Louis (St. Louis Public Schools) Comprehensive Annual Financial Report For The Year Ended June 30, 2019 St. Louis, Missouri Report Submitted by Angie Banks Chief Financial Officer and Treasurer
Transcript of Special Administrative Board Of The Transitional School District … · 2019-12-20 · PowerSchool....

Special Administrative Board Of The Transitional School District Of The City Of St. Louis
(St. Louis Public Schools)
Comprehensive Annual Financial Report
For The Year Ended June 30, 2019
St. Louis, Missouri
Report Submitted by
Angie Banks
Chief Financial Officer and Treasurer

Contents
Page
PART I - INTRODUCTORY SECTION
Letter Of Transmittal ....................................................................... 1 - 12 Principal Officials .................................................................................. 13 Organizational Chart ............................................................................. 14 GFOA Certificate Of Excellence ............................................................ 15 ASBO Award .......................................................................................... 16
PART II - FINANCIAL SECTION
Independent Auditors’ Report ................................................. 17 - 19 Management’s Discussion And Analysis ................................ 20 - 30 Basic Financial Statements:
Government-Wide Financial Statements: Statement Of Net Position - District ........................................... 31 Statement Of Financial Position - Foundation ........................... 32 Statement Of Activities - District ................................................ 33 Statement Of Activities - Foundation ......................................... 34 Fund Financial Statements: Balance Sheet - Governmental Funds ................................. 35 - 36 Reconciliation Of The Balance Sheet Of Governmental Funds To The Statement Of Net Position ............................. 37 Statement Of Revenues, Expenditures And Changes In Fund Balances - Governmental Funds ................................. 38 Reconciliation Of The Statement Of Revenues, Expenditures And Changes In Fund Balances Of Government Funds To The Statement Of Activities ............................................. 39 Statement Of Net Position - Proprietary Fund .......................... 40 Statement Of Revenues, Expenses And Changes In Fund Net Position - Proprietary Fund ............................................ 41 Statement Of Cash Flows - Proprietary Fund ............................ 42 Statement Of Fiduciary Assets And Liabilities - Agency Funds ...................................................................................... 43 Notes To Basic Financial Statements ........................................ 44 - 81
Required Supplementary Information Schedule Of Revenues, Expenditures And Changes In Fund Balance - Budget To Actual - General Fund ............................... 82 Schedule Of Revenues, Expenditures And Changes In Fund Balance - Budget To Actual - Teachers Fund ............................. 83 Schedule Of Revenues, Expenditures And Changes In Fund
Balance - Budget To Actual - Grants Fund Education Fund ............................................................................ 84
Notes To Required Supplementary Information .............................. 85 Schedules Of Selected Pension And OPEB Information ........... 86 - 87

Contents
Page
Supplementary Information Combining And Individual Fund Statements And Schedules: Schedule Of Revenues, Expenditures And Changes In Fund Balance - Budget To Actual - Debt Service Fund ............. 88 Schedule Of Revenues, Expenditures And Changes In Fund Balance - Budget To Actual - Building Fund .................... 89 Schedule Of Revenues, Expenditures And Changes In Fund Balance - Budget To Actual - Capital Settlement Fund ............ 90
Statement Of Changes In Assets And Liabilities - Fiduciary Fund - Agency Fund ..................................................................... 91 Combining Balance Sheet-Grant Funds……………………………….92 Combining Statement Of Revenues, Expenditures And Changes In Fund Balance-Grant Funds………………………………………93
Schedule Of Revenues By Source - All Governmental Funds ..................................................................................... 94 - 95
PART III - STATISTICAL SECTION (UNAUDITED) Net Position By Component .............................................................. 96 Expenses, Program Revenues, And Net Expense (Revenue) ........... 97 General Revenues And Total Changes In Net Position ................... 98 Fund Balances And Governmental Funds ........................................ 99 Governmental Funds Revenues ...................................................... 100 Governmental Funds Expenditures And Debt Service Ratio ........ 101 Other Financing Sources And Uses And Net Change In Fund Balance ............................................................................. 102 Assessed Value And Actual Value Of Taxable Property ................ 103 Direct And Overlapping Property Tax Rates ................................. 104 Principal Property Taxpayers ......................................................... 105 Property Tax Levies And Collections .............................................. 106 Outstanding Debt By Type .............................................................. 107 Direct And Overlapping Governmental Activities Debt ................ 108 Legal Debt Margin Information ...................................................... 109 Demographic And Economic Statistics ........................................... 110 Principal Employers ......................................................................... 111 Full-Time Equivalent District Employees By Type ....................... 112 Level Of Service ............................................................................... 113 School Building Information .................................................. 114 - 115

Part I - Introductory Section

Kelvin R. Adams, Ph.D. Superintendent of Schools
801 N. 11th Street Saint Louis, Missouri 63101 Phone: 314-231-3720 Fax: 314-345-2661
1
December 16, 2019 Members, Board Of Education of the City of St. Louis and Citizens of City of St. Louis, Missouri St. Louis, Missouri Dear Board Members: In compliance with Section 162.641, Revised Statutes of Missouri, 2007, I am submitting the Comprehensive Annual Financial Report (CAFR) for the fiscal year ended June 30, 2019. This report has been prepared to provide you, representatives of financial institutions, the public and other interested parties information concerning the financial performance of the St. Louis Public Schools (“SLPS, the District”). Responsibility for the accuracy, completeness and clarity of this report rests with me, and the Chief Financial Officer/Treasurer. The report was prepared by the Chief Financial Officer/Treasurer, the Fiscal Control Office and the Budget Office. We believe that the data, as presented, is accurate in all material aspects; that it fairly sets forth the financial position and results of operations of the District as measured by the financial activities on a government-wide basis and of its various funds; and that readers have all disclosures necessary to gain an understanding of the District’s financial affairs. This report has three sections - Introductory, Financial and Statistical 1. Introductory section: This transmittal letter, and the District’s organizational chart, the 2018 ASBO
Certificate of Excellence and the 2018 GFOA Certificate of Achievement. 2. Financial section: Government-wide financial statements; fund financial statements, required and
other supplemental information for combined and individual fund financial statements and schedules; the independent auditors’ report on the financial statements; and Management’s Discussion and Analysis. It is designed to be an objective and easily readable analysis of the District’s financial activities.
3. Statistical section: Unaudited tables of both financial and demographic data. This information is for the purpose of presenting social and economic information, financial trends and fiscal capacity of the District presented on a multi-year basis.
The District is required to undergo an annual single audit to conform to the provisions of the Uniform Guidance at 2CFR200, Audits of States, Local Governments and Non-Profit Organizations. Information related to this single audit, including the schedule of expenditures of federal awards, findings and recommendations, and the independent auditors’ reports on internal control and compliance with applicable laws and regulations are included in a separate report.

2
This report includes all funds of the District. The District is a public school system offering full all-day pre-school and kindergarten through grade 12 educational opportunities for all eligible residents within its geographic boundaries. GAAP requires that management provide a narrative introduction, overview, and analysis to accompany the basic financial statements in the form of Management’s Discussion and Analysis (MD&A). This letter of transmittal is designed to complement the MD&A and should be read in conjunction with it. The District’s MD&A can be found in the financial section immediately following the report of the independent auditors.
Summary of Accomplishments and Significant Events in Fiscal Year 2018-2019 Saint Louis Public Schools strives to provide a first-rate, relevant education to every student through high-quality instruction, proper and sufficient resources for schools, and safe and updated school buildings. The District continued to meet these goals during FY2018-2019:
The Academic Office launched a new reading initiative that establishes a culture of literacy-
where reading is the instructional focus-in all schools. Teachers receive comprehensive training on literacy teaching practices, including when and how to intervene to address deficits.
Adams Elementary School pre-kindergarten teacher Dr. Albert J. Sanders, the SLPS 2018 Educator of the Year, was named a 2019 Missouri Regional Teacher of the Year by the Missouri Department of Elementary and Secondary Education.
The District implemented a cohort-model for professional development. Teams of teachers work collaboratively in a Professional Learning Community-style group, writing SMART goals, identifying measurables, determining how and from where they will learn, and working together to improve their learning. As a result, teachers have submitted improved qualitative and quantitative feedback on how Professional Development is meeting their needs and supporting their growth.
In order to ensure all students start their day with a healthy meal, the District launched the Breakfast in the Classroom program at all elementary schools. Breakfast Grab ‘n’ Go Program carts were added to elementary schools (previously only available in middle and high schools), and SLPS rolled out the At-Risk, Afterschool Program, which enables any student to eat a snack and/or supper afterschool for free.
SLPS Virtual School students received more than 1,000 tablets through Sprint’s 1Million Project, Sprint’s initiative to provide 1 million electronic devices (hotspot, smartphone or tablet) to districts nationwide. FY 2018-2019 was the second year of the partnership.
Gateway Michael Elementary was named to the 2018 list of America’s Healthiest Schools by the Alliance for a Healthier Generation, receiving national recognition-Silver Award Level-for its commitment to students’ health and well-being.
SLPS launched new Love of Learning projects, including the Voices of Change video production contest in which students produce a public service announcement (PSA), original music video production, or spoken word video on a social issue.

3
District leadership completed a three-day training session on culturally responsive practices along with follow-up professional development sessions. The pedagogical framework is key to the District’s current strategic plan, Transformation Plan 3.0.
The Finance Department updated its finance software from SAP to BusinessPLUS PowerSchool. The Assessment Department moved from Acuity to Scantron for standardized testing services.
SLPS had two schools in the top 15 ranked by U.S. News and World Report for the state of the Missouri for 2019: Metro Academic & Classical High School and Collegiate School of Medicine and Bioscience.
In support of the District’s Transformation Plan, the St. Louis Public Schools Foundation continued to secure robust funding for early childhood education programs, health and wellness initiatives, the cultivation of school leadership and college and career readiness programs for students.
Corporate and community partners, such as Wells Fargo Advisors, Express Scripts, The Little Bit Foundation, Boeing, Spire and the National Geospatial-Intelligence Agency (NGA), continued-and in many cases expanded-their valuable work in SLPS schools.
Capital Improvement Projects included painting, tuck-pointing, HVAC, door alarms and landscaping. The Operations Team also completed lighting upgrades at SLPS schools.
Aging copiers, printers and iPads were replaced districtwide. The PaperCut print management system was implemented in order to track and monitor usage, eliminate paper waste and allow for secure document printing.
The Transportation Department launched a new GPS tracking system called FirstView by First Student that enables parents/guardians to follow the location of their child’s bus through a smartphone app.
Current Initiatives and Accomplishments
SLPS Transformation Plan: Work continues on the District’s strategic plan, which has been revised to better meet the needs of students and staff. Transformation Plan 3.0 has five key goals: 1) Creating a system of excellent schools for students; 2) Advancing fairness and equity across the system; 3) Cultivating culturally responsive school leaders, teachers and support personnel; 4) Ensuring all students read to lead and succeed; and 5) Establishing community partners that -support the Transformation Plan. The Transformation Plan is the top priority for all District staff. New School Model: The District established the Consortium Partnership Network (CPN) with two pilot elementary schools for the 2019-2020 school year: Meramec and Ashland. The model ensures local control and teacher voice while leveraging district expertise and implementing charter school-like autonomies. District Technology: All SLPS cell phones were migrated to the FirstNet system, a public safety communications platform with extended coverage designed for and with first responders.

4
Gifted Expansion: Columbia Elementary is continuing its transition into the District’s first fully gifted instruction school in North City, expanding this year to serve gifted students in grades PK4, kindergarten, 1st grade, 2nd grade and 3rd grade. System Upgrade: The MyLearningPlan platform used to track professional development was upgraded to Frontline Insights, which allows for unlimited licenses for all District staff. Property Upgrades: Renovations are underway at the Gateway STEM High School athletic field, including upgrades to the locker rooms, concession stand, public restrooms and bleachers, along with track resurfacing. Additional projects districtwide include: asphalt/flatwork repair, painting, tuck-pointing, HVAC, door alarms, landscaping and lighting upgrades.
Year-End Audit and Financial Results The final independent audit for the 2019 fiscal year was completed by RubinBrown LLP in December 2019 and is the basis of the audited financials included in the Financial Section of this CAFR. The District began the year with a $69.7 million General Operating Budget fund surplus and ended the year with an $85.1 million surplus. Additional comments can be found later in the Management’s Discussion and Analysis (MD&A) section of this report. Profile of Government The St. Louis Public School District (the “District”) encompasses approximately 61 square miles and includes the entire corporate limits of the City of St. Louis, Missouri (the “City”). The present estimated population of the City and, therefore, of the District is 302,838. The District operates as the largest public school system in the State of Missouri. The District was initially organized in 1833. In 1838, the Board opened its first school, and in 1853, the Board opened the first coeducational high school west of the Mississippi River. Under a March 22, 2007 decision, the Missouri State Board of Education declared St. Louis Public Schools as unaccredited. In accordance with the laws of the State of Missouri, the governance of the school district was transferred from the divested board, except for auditing and reporting matters, and placed with the Special Administrative Board (SAB) of the Transitional School District. The transitional school district is subject to all laws pertaining to “seven member districts,” as defined in section 160.011, RSMO. The governing board of the transitional school district shall consist of three members: one shall be a chief executive officer nominated by the state board of education and appointed by the governor with the advice and consent of the senate, one shall be appointed by the mayor of the city not within a county and one shall be appointed by the president of the board of aldermen of the city not within a county. The SAB took full control of the operation of the St. Louis Public School District on June 15, 2007. Pursuant to Missouri Revised Statute §162.1100.4, the SAB is empowered to, among other things, (1) create an academic accountability plan, take corrective action in underperforming schools, and seek relief from state-mandated programs; (2) explore alternative forms of governance for the district; (3) contract with nonprofit corporations to provide for the operation of schools; (4) oversee facility planning, construction, improvement, repair, maintenance, and rehabilitation; (5) establish school site councils to facilitate site-based school management and improve the responsiveness of the schools to the needs of the local geographic attendance region of the school; and (6) submit a proposal to the district voters regarding establishment of neighborhood schools.

5
Prior to the transfer of governance to the SAB, the District existed as a metropolitan school district organized and governed pursuant to Sections 162.572 through 162.661 of the Revised Statutes of Missouri, 2007, as amended. The Board was responsible for the supervision and governance of the District. The Board also had final control over all school matters except as limited by state law, the courts, and the will of its citizenry as expressed in elections. The Board’s responsibilities were generally: to set policy for the District, to ensure efficient operations, to select and evaluate the Superintendent of Schools, to adopt an annual budget and its supporting tax rate, and to foster good community relations and communications. In addition, the Board appointed the Superintendent of Schools to carry out the policies set by the Board. With the loss of the District’s accreditation, and the appointment of a chief executive officer, any powers granted to the existing school board on or before August 28, 1998, were vested with the Special Administrative Board of the Transitional School District as long as the Transitional School District exists, except as otherwise provided in section 162.621 Effective July 1, 2019, the seven member elected board resumed governance of the St. Louis Public Schools. The District has 3,570 full-time employees including 1,713 certified teachers and principals, representing 48% of full-time staff. Another 450 substitute and part-time staff support the District for a total staff count of 4,020. Enrollment in the District has declined significantly over the past twenty years. Enrollment totaled 108,770 students and 111,233 students in 1960 and 1970, respectively (kindergarten through 12th grade). The State funded pre-k attendance for unaccredited and provisionally accredited districts in FY2017, including SLPS. Beginning in FY2018, all districts can claim a portion of their eligible pre-k attendance. The average daily attendance in the District over the past ten school years has been:
School Year Average Daily Attendance
2019 20,279 2018 2017
20,354 21,422
2016 21,076 2015 22,709 2014 23,317 2013 23,372 2012 20,608 2011 20,880 2010 22,754
The Missouri State Board of Education voted unanimously to re-classify St. Louis Public Schools as Provisionally Accredited as of October 16, 2012. The Provisional Accreditation vote came following a recommendation by Missouri Department of Elementary and Secondary Education Commissioner Dr. Chris Nicastro, who analyzed multiple years of data and indications of district-wide improvements over the prior five years.

6
In recommending Provisional Accreditation for the District, Commissioner Nicastro requested that the State Board review the District’s progress under the standards of MSIP 5 in September of 2013, and each year thereafter until the District achieves full accreditation. Although enough Annual Performance Result points were earned in FY2015, the Missouri Department of Elementary and Secondary Education (DESE) and the Missouri State Board of Education voted not to recommend Full Accreditation for Saint Louis Public Schools. The District received enough Annual Performance Result points once again in FY2016 and FY2017 for Full Accreditation. A determination on the District’s accreditation status was received from DESE and the Missouri State Board of Education in January 2017. The District has achieved Full Accreditation. The District provides educational programs to students of all ages through its preschool, kindergarten through 12th grades and adult education programs. The District also operates four Community Education Full Service Schools that offer educational and recreational programs to enrollees of all ages. In addition, there are high quality after school programs, which offer tutoring sessions for students. The grade configuration of the District was reorganized in 1980. Prior to that year, the elementary schools served grades K-8 and the secondary schools served grades 9-12. Under the reorganization, middle schools were established for grades 6-8 and elementary schools serve primarily grades K-5. Elementary schools (grades PK-5) offer mathematics, communication arts (reading, writing, speaking and listening), science and social studies. Arts and physical education are also provided. Middle schools (grades 6-8) offer mathematics, communication arts, science and social studies. Additionally, the middle schools offer art, business education (in magnet schools), industrial arts, music (vocal and instrumental), physical education, career awareness and orientation, counseling, remedial reading and remedial mathematics. High schools offer English (complete sequence), mathematics courses (basic mathematics through calculus), science (general science, chemistry and physics), social studies (complete sequence), advanced placement and college readiness courses, career technical education courses, music (vocal and instrumental), physical education, and athletic programs (all sports). At all grade levels there is a range of services for special education and guidance services. In addition, the District operates alternative programs for students with specialized needs. These initiatives include programs for adjudicated students and students with disciplinary problems; special schools for physically challenged students; and tutoring for students who are hospitalized. Included within the District’s elementary, middle and high schools are magnet schools. In addition to a basic curriculum, magnet schools offer a specific focus, which makes it possible to match a student’s unique needs or interests with a compatible teaching method or program.
Economic Condition and Outlook The Board adopted a Fund Balance Policy in fiscal year 2013 with a 10% target of General Fund and Teachers Fund expenditures. The purpose of the policy is to establish guidelines that are necessary to ensure that the SLPS maintains an adequate level of unassigned reserves to mitigate financial risk that can arise from unforeseen revenue fluctuations, unforeseen expenditures and similar circumstances. The District fund balance at the 2019 fiscal year-end is approximately 28%. There have been no other relevant financial policies that have had a significant impact on the current year’s financial statements.

7
The fiscal condition of the St. Louis Public Schools, which serves the residents of the City of St. Louis, is closely linked to the economic health and population trends of the City of St. Louis and the State of Missouri budgetary constraints. The City continues to manage in an environment of long term population declines. The current population estimate for the city is 302,838, down 5% from 2010 and 31% from 1980. Significant reinvestment in the City over the last 15 years has established a base for the City’s future health and growth. St. Louis continues to serve as a regional hub for the healthcare, higher education, manufacturing and finance sectors and further stabilization is provided by the operations of nine Fortune 500 companies including Express Scripts, Inc. which was recently purchased by Cigna Corporation. Additional Fortune 500 companies include The Boeing Company, Wells Fargo Bank, N.A., Centene Corporation, Emerson Electric Company, Graybar Electric Company Inc., Ameren Corporation, and Peabody Energy Corporation. The city is also home to Anheuser-Busch Companies, LLC, BJC Health System and numerous universities, colleges, and technical schools. The city's large tax base will remain relatively stable and diverse given ongoing economic development. Over the past five years, the city's tax base expanded 1.6% on average, despite a 2.6% contraction in fiscal 2019 to $18.1 billion; contraction in non-reassessment years is not uncommon. Preliminary fiscal 2020 taxable values, a reassessment year, indicate a sizable increase to approximately $22 billion. Although preliminary valuations are subject to protest, management expects healthy growth in taxable values for fiscal 2020 primarily driven by residential appreciation and continued development activity. Recent revenue enhancements and a policy change to budget 1.5% of payroll expenses to rebuild reserves are expected to stabilize financial performance over the near term. In addition, improved employment conditions are expected to enhance economic activity tax revenues over the near term as St. Louis remains the employment hub of the greater metro area. City officials report several large development projects are underway including the National Geospatial Intelligence Agency (NGA; $1.75 billion), City Foundry, a $240 million mixed use development housing a movie theatre, multi-restaurant dining hall, and office space, along with several large scale luxury apartment developments headlined by a $130 million, 36-story apartment tower in the city's west-end that will become the city's tallest residential building. In addition, significant educational expansion is underway at SSM Health St. Louis University Hospital ($550 million; 316 bed expansion) and Washington University in St. Louis ($400 million; 7 building expansion). Other recently completed or announced developments focus on revitalization of existing buildings into living spaces and include a number of mixed use and hotel projects. St. Louis Public Schools faces the challenges of many large urban school districts: high poverty rates, declining enrollment, and high infrastructure related costs. Local property taxes, 57% of operating revenues, have increased due to a voter approved operating tax increase on April 5, 2016. The District’s participation in future economic growth is dependent on development activity, assessed values, tax rates, tax abatement and tax increment financing (TIF) projects.

8
State Aid represents only 7.5% of operating revenues and has been declining for years due to decreasing enrollment. The FY2020 K-12 student enrollment is projected at 19,890.
Fiscal Year K‐12 Enrollment
2010 25,046
2011 23,576
2012 22,516
2013 25,200
2014 24,869
2015 24,154
2016 22,506
2017 21,754
2018 20,879
2019 19,778
The District’s financial position has improved considerably over the past ten years, from a significant operating deficit to a positive fund balance. However, challenges remain and the work is not complete. We will continue to give our best efforts to provide the necessary student resources with the support of the community, partners and other stakeholders. Desegregation The St. Louis Public Schools had been involved in desegregation litigation since 1972, resulting in a court-ordered plan of desegregation originally implemented during the 1980-1981 school years, and a Metropolitan Voluntary Desegregation Settlement Plan involving the Board and 23 County School Districts developed and approved by the Court for implementation in 1983-1984. In September 1987, as part of the desegregation litigation, the Court approved, ordered, and implemented a Capital Renovations Plan in the amount of $110,306,671; the State of Missouri to pay half and the Board to pay half. In August 1988, the Court approved a long-range Magnet School Plan. The Plan phased out several magnet schools, relocated and expanded others, and created new and additional magnet schools, bringing the number of magnet seats to 14,000. The Plan also created Unified Funding Formula for all magnet schools. Effective with the 1990-1991 school year, the cost of operating all magnet schools was shared equally by the Board and the State of Missouri. In its orders, the Court authorized an additional $56,043,801 in Capital Improvements for the magnet schools, including construction of three new facilities. The State of Missouri pays 72% of the cost and the Board pays the balance. In March 1999, a settlement was reached and approved by the court in this case. This ended the courts supervision and monitoring of St. Louis Public Schools. The District is obligated to provide continuing remedial educational programs “to ensure that the enjoyment of full equality of opportunity by plaintiff school children is not impaired by the effects of past segregation.” These obligations include maintaining current court-ordered all-day kindergarten, summer school, college prep and preschool programs; and maintaining the magnet school program, with some modifications for at least ten years. The District also agreed to comply with State standards in many areas such as class size, libraries and counselors, and to establish standards or improvement of student outcomes. There are provisions for school improvement and accountability, giving children in a failing school the right to transfer to a successful school.

9
The State agreed to pay the District a total of $180 million for construction of new schools to accommodate any increase in enrollment due to any decrease in the number of transfer students. All county districts, with the exception of Ladue, agreed to continue to accept new students unless written notice was provided prior to the 2008-2009 school year. To economize on transportation costs, attendance zones were established for the transfer students. In the event of any phase-out of the transfer program, all city students then enrolled in county schools will have the right to complete high school in the county. A five-year extension was unanimously approved by the Voluntary Interdistrict Choice Corporation (VICC) Board in June 2007. Then, on October 19, 2012, an additional five-year extension was approved. As a result, new students can continue to be enrolled by participating districts through the 2018-2019 school year. With this extension, in the year 2019-2020, the program will cease accepting any new students, only allowing current students to remain until graduation. In 2031-2032, the program will be terminated. VICC was established to operate the transfer program and State funding was provided to operate the continuing voluntary transfer plan. Subsequent State education funding cuts have reduced the funds available to VICC for the maintenance of the transfer program. These same State funding cuts have reduced the State funding available to the St. Louis Public Schools below the levels agreed to in the 1999 settlement case. As a result, both SLPS and VICC joined in a suit against the State for re-instatement of past due amounts. As of June 30, 2005, the District’s claims amounted to approximately $112 million. In addition, one of the provisions called for in Senate Bill 781 was for the voters in the City of St. Louis to approve a city sales tax. On February 2, 1999 the city voters approved a 2/3rd cent sales tax. As mentioned earlier, during fiscal year 2005, the District secured some flexibility in use of the desegregation funds for Clyde C. Miller and curriculum development. The District was also successful in renegotiating payments to assist with cash flow management. On November 16, 2011, the District reached an agreement with the Plaintiffs in the desegregation lawsuit to use approximately $96 million of previously restricted funds, to eliminate the debt and fund certain academic programs through FY 2014. Another agreement was reached in September 2015 that continues funding many of the existing desegregation programs in addition to Superintendent initiatives for the District’s lowest performing schools. The 2015 agreement will provide over $29 million for FY 2015 through FY 2018 (see additional comments in Note 11). Capital Renovation Status In the fall of 1987, the District started an extensive Capital Renovation project involving 100 school facilities as part of the Desegregation Case. The renovations include envelope work (roofs, masonry, and windows), interior modifications and renovation, 43 gym additions and 2 classroom additions; and construction of 4 new magnet schools and one regular elementary school. Prior to interior renovations, each school was scheduled for asbestos abatement to comply with the 1986 AHERA Regulations. All of the originally scheduled renovations have been completed. In order to lessen the impact of the St. Louis summer heat and humidity and improve learning conditions, the District undertook a program to air condition certain schools beginning in June 2001.

10
Schools to be air-conditioned were initially selected to improve conditions where children were performing below average and those offering “Extended Year” programs. This program was initially funded through an $80 million bond issue approved by St. Louis voters November 7, 2000. Additional funding was provided by a Series 2002 $120 million bond issue, $95 million of which was designated for continuation of air conditioning. A $55 million bond was issued in January of 2006 to continue these improvements. During the fiscal year ended June 30, 2009, the District issued additional bonds in the amount of $39,295,000 to finance the cost of more air conditioning projects for school buildings and related facilities. All schools are now air conditioned with either central or window air conditioning. In June 2009, the District started working on a lead abatement/window replacement project at 25 schools. This project, with a budget of more than $8 million, was substantially completed by August 2010. The goal of the project was to remove the risk of lead hazards in schools with children between 3 - 6 years of age. The average of the District’s instructional facilities is over 75 years of age. The age of each school is included in the Statistical Section on pages 128-129. Capital improvement needs have been estimated at approximately $400 million. In August 2010, the District gained approval of a $155 million no-tax bond to repair and upgrade facilities. The renovations include envelope work (roofs, masonry, and windows), interior modifications and renovations of classrooms, restrooms, auditoriums, computer labs, science labs, kitchens, Pre-K, security, ADA, electrical systems and exterior improvements to playgrounds, parking lots and athletic fields. All projects funded by the bond issue are complete as of June 30, 2016. The Board currently supervises the operation of 74 schools and programs, including 44 elementary schools, 9 middle schools, 13 high schools and 8 special or alternative programs in the District, with an average daily enrollment of over 23,000 preschool-12th grade students. The District will continue to invest in repairs, renovations, improvements and additions as needed to provide safe, well-functioning environments for learning. In fiscal year 2012-2013, as part of an effort to reduce expenses, the District closed two schools. No schools were closed in 2013-14, one was closed in 2014-15, one in 2015-16, and two at the end of 2016-17. The District continues to review facilities and provide recommendations, if appropriate opportunities are available, to close additional buildings or consolidate schools Long-Range Planning The District will continue to take the necessary steps to prevent deficit spending through revenue enhancement measures and cost containment initiatives. The challenge is supporting academic initiatives while addressing the potential for declining enrollment and subsequent losses in State aid. Operating with a leaner budget and resources will require constant vigilance and the elimination of non-essential costs. Monthly cash flow projections, budget to actual reports, utilizing the five-year comprehensive financial planning model, allocating resources to meet the instructional needs of students and forming cost cutting teams are just some of the measures employed by the District as we move toward the goal of sustained financial solvency. Additional plans include efforts to increase the revenue stream through soliciting the support of business leaders; allocating more funds to the classroom; increasing efforts to enroll more students in district schools; and adding more innovative programs that provide for high quality education. St. Louis Public Schools is presently accelerating efforts to continue to improve academic performance of all children in the care of the District.

11
In addition, the District faces the challenge of educating large concentrations of children and youth, many of whom come from economically depressed backgrounds. According to the 2017 US Bureau of Economic Analysis, the per capita personal income for the City was $43,577 and more than 87% of students in the District qualify for free or reduced-price school lunches. Component Unit The St. Louis Public Schools Foundation is reported as a component unit. It is a separate tax exempt entity that is not controlled by the District. The Foundation provides financial support from corporate contributions to assist the District in achieving its objectives, purposes and programs. Charter Schools Charter schools are public, tuition-free schools and receive public money; however, charter schools are not part of St. Louis Public Schools. Each charter school is governed by an independent school board and adheres to rules defined in its charter. This independence allows each school a lot more freedom in how they operate, the curriculum they choose, and how they serve their students. Some schools have themes and/or a geographic enrollment focus. The impact on the District is a loss of students and funding. Internal and Budgetary Controls This report consists of management’s representations concerning the finances of the District. Consequently, the administration of the District is responsible for establishing and maintaining internal controls, which are designed to ensure that the assets of the Board are protected from loss, theft, and misuse. There is also a responsibility to ensure that adequate accounting data are compiled to allow for the preparation of financial statements in conformity with generally accepted accounting principles. Internal control is designed to provide reasonable, but not absolute, assurance that the above objectives are being met. The concept of reasonable assurance recognizes that: 1) the cost of a control should not exceed the benefits likely to be derived and 2) the valuation of costs and benefits requires estimates and judgments by management. Annual budgets are prepared on a basis consistent with generally accepted accounting principles for the activities of the general fund and special revenue funds (operating funds), capital projects and debt service funds. In addition, the District maintains budgetary controls. The objective of these budgetary controls is to ensure compliance with legal provisions embodied in the annual appropriated budget approved by the Board. The District also maintains an encumbrance accounting system as one technique of accomplishing budgetary control. Budgetary control is maintained at the sub-function level for management purposes; however, the legal level of budgetary control is at the fund level for all budgeted funds. Variances from the budget will be reported to the District’s management on a monthly basis. Encumbrances outstanding in special revenue funds and capital projects and expendable trust funds do not lapse at year-end and are reported as reservations of fund balances. Single Audit As a recipient of federal, state and county financial assistance, the District also is responsible for ensuring that an adequate internal control is in place to provide compliance with applicable laws and regulations related to those programs. This internal control structure is subject to continuing periodic evaluation by management.

12
As a part of the District’s single audit, described above, tests are made to determine the adequacy of internal control, including that portion related to federal financial assistance programs, as well as to determine that the District has complied with applicable laws and regulations. The result of the District’s single audit for the fiscal year ended June 30, 2019 is presented in a separate report. Fund Accounting The District maintains its records through the use of fund accounting. This is a system wherein transactions are reported in self-balancing sets of accounts to reflect the results of activities. The funds are accounted for on the modified accrual basis of accounting for all governmental funds types and similar fiduciary fund types. All of the District’s funds are presented in this report. Independent Audit The Revised Statutes of the State of Missouri require an independent annual audit of the books of accounts, financial records, and transactions of all funds of the District. This requirement has been complied with and the independent auditors’ report has been included in this document. Awards The Association of School Business Officials International (ASBO) awarded a Certificate of Excellence in Financial Reporting and the Government Finance Officers Association (GFOA) awarded a Certificate of Achievement for Excellence in Financial Reporting to the Board for its Comprehensive Annual Financial Report for the fiscal year ended June 30, 2018. This was the 35th consecutive year for the ASBO and 31st consecutive year for the GFOA that the District has received these awards. The Certificates indicate that the District published an easily readable and efficiently organized comprehensive annual financial report. Such a report satisfied both generally accepted accounting principles and applicable legal documents. The Certificates are valid for a period of one year only. The District believes that this current CAFR continues to meet both the Certificate programs’ requirements and will be submitted to ASBO and GFOA to determine its eligibility for another certificate. Acknowledgement The preparation of this report could not have been accomplished without the cooperation and efficient and dedicated services of the entire administrative staff of the District. We would especially like to express our appreciation to the Board members for their interest and support in the financial affairs of the St. Louis Public Schools during the 2018-2019 fiscal year. Respectfully Submitted,
Kelvin R. Adams, Ph.D. Superintendent of Schools
Angela Banks Chief Financial Officer/Treasurer

PRINCIPAL OFFICIALS
13
Special Administrative Board
Mr. Rick Sullivan Ms. Darnetta Clinkscale Mr. Richard K. Gaines
Senior Administration
Kelvin R. Adams, Ph.D., Superintendent of Schools Angela Banks, Chief Financial Officer / Treasurer
Elected Board
Ms. Dorothy Rohde-Collins, President
Ms. Natalie Vowell, Vice President Dr. Joyce Roberts, Secretary
Ms. Susan Jones Mr. Adam Layne Ms. Donna Jones Ms. Tracee Miller

14
Dr. Kelvin AdamsSuperintendent
Charles BurtonChief Human Resource Officer
Superintendent Office Organizational Chart
2018-19
Special Administrative BoardRichard Sullivan
Darnetta ClinkscaleRichard Gaines
Jeff St. OmerLegal Counsel
Paula KnightDeputy Superintendent
Academics
Lori WillisDeputy Superintendent
Institutional Advancement
Cheryl VanNoyDeputy Superintendent
Accountability and Technology
Roger CayCeDeputy Superintendent
Operations
LaQonda StunsonAdministrative Assistant
Pamela BellExecutive Administrative
Assistant
Michael BrownDeputy Superintendent
Student Support Services
Ernest ClarkDirector, Compliance and Internal
Audit
Rose HowardChief of Staff
Ruth Lewis Executive Assistant to the
Board of Education
Angie BanksChief Financial Officer/Treasurer
15

16

Part II - Financial Section

Page 17
RubinBrown LLP Certified Public Accountants &
Business Consultants
One North Brentwood Saint Louis, MO 63105
T 314.290.3300 F 314.290.3400
W rubinbrown.com E [email protected]
Independent Auditors’ Report To the Honorable Mayor, and Members of the Board of Education of the City of St. Louis Report On The Financial Statements We have audited the accompanying financial statements of the governmental activities, the discretely presented component unit, each major fund, and the aggregate remaining fund information of the Special Administrative Board of the Transitional School District of the City of St. Louis (the District) as of and for the year ended June 30, 2019, and the related notes to the financial statements, which collectively comprise the District’s basic financial statements as listed in the table of contents. Management’s Responsibility For The Financial Statements Management is responsible for the preparation and fair presentation of these financial statements in accordance with accounting principles generally accepted in the United States of America; this includes the design, implementation, and maintenance of internal control relevant to the preparation and fair presentation of financial statements that are free from material misstatement, whether due to fraud or error. Auditors’ Responsibility Our responsibility is to express opinions on these financial statements based on our audit. We did not audit the financial statements of St. Louis Public Schools Foundation, the discretely presented component unit, as described in Note 1. Those financial statements were audited by other auditors, whose report has been furnished to us, and our opinion, insofar as it relates to the amounts included for the discretely presented component units, is based solely on the report of the other auditor. We conducted our audit in accordance with auditing standards generally accepted in the United States of America and the standards applicable to financial audits contained in Government Auditing Standards issued by the Comptroller General of the United States. Those standards require that we plan and perform the audit to obtain reasonable assurance about whether the financial statements are free from material misstatement. The financial statements of St. Louis Public Schools Foundation were not audited in accordance with Government Auditing Standards. An audit involves performing procedures to obtain audit evidence about the amounts and disclosures in the financial statements. The procedures selected depend on the auditors’ judgment, including the assessment of the risks of material misstatement of the financial statements, whether due to fraud or error. In making those risk assessments, the auditor considers internal control relevant to the entity’s preparation and fair presentation of the financial statements in order to design audit procedures that are appropriate in the circumstances, but not for the purpose of expressing an opinion on the effectiveness of the entity’s internal control. Accordingly, we express no such opinion. An audit also includes evaluating the appropriateness of accounting policies used and the reasonableness of significant accounting estimates made by management, as well as evaluating the overall presentation of the financial statements.

To the Honorable Mayor, and Members of the Board of Education Of the City of St. Louis
Page 18
We believe that the audit evidence we have obtained is sufficient and appropriate to provide a basis for our audit opinions. Opinions In our opinion, based on our audit and the reports of other auditors, the financial statements referred to above present fairly, in all material respects, the respective financial position of the governmental activities, the discretely presented component unit, each major fund, and the aggregate remaining fund information of the Special Administrative Board of the Transitional School District of the City of St. Louis as of June 30, 2019, and the respective changes in financial position and, where applicable, cash flows thereof for the year then ended in accordance with accounting principles generally accepted in the United States of America. Other Matters Required Supplementary Information Accounting principles generally accepted in the United States of America require that the Management’s Discussion and Analysis, Budgetary Comparison Information, Schedules of Selected Pension Information, and the Schedule of Selected Other Post Employment Benefits Information, as listed in the table of contents be presented to supplement the basic financial statements. Such information, although not a part of the basic financial statements, is required by the Governmental Accounting Standards Board, who considers it to be an essential part of financial reporting for placing the basic financial statements in an appropriate operational, economic, or historical context. We have applied certain limited procedures to the required supplementary information in accordance with auditing standards generally accepted in the United States of America, which consisted of inquiries of management about the methods of preparing the information and comparing the information for consistency with management’s responses to our inquiries, the basic financial statements, and other knowledge we obtained during our audit of the basic financial statements. We do not express an opinion or provide any assurance on the information because the limited procedures do not provide us with sufficient evidence to express an opinion or provide any assurance.

To the Honorable Mayor, and Members of the Board of Education Of the City of St. Louis
Page 19
Other Information Our audit was conducted for the purpose of forming opinions on the financial statements that collectively comprise the District’s basic financial statements. The introductory section, combining and individual non major fund financial statements and schedules, and statistical section are presented for purposes of additional analysis and are not a required part of the basic financial statements. The combining and individual nonmajor fund financial statements and schedules are the responsibility of management and were derived from and relate directly to the underlying accounting and other records used to prepare the basic financial statements. Such information has been subjected to the auditing procedures applied in the audit of the basic financial statements and certain additional procedures, including comparing and reconciling such information directly to the underlying accounting and other records used to prepare the basic financial statements or to the basic financial statements themselves, and other additional procedures in accordance with auditing standards generally accepted in the United States of America. In our opinion, the combining and individual nonmajor fund financial statements and schedules are fairly stated, in all material respects, in relation to the basic financial statements as a whole. The introductory section and statistical section have not been subjected to the auditing procedures applied in the audit of the basic financial statements and, accordingly, we do not express an opinion or provide any assurance on them. Other Reporting Required By Government Auditing Standards In accordance with Government Auditing Standards, we have also issued our report dated December 16, 2019 on our consideration of the District’s internal control over financial reporting and on our tests of its compliance with certain provisions of laws, regulations, contracts, grant agreements and other matters. The purpose of that report is to describe the scope of our testing of internal control over financial reporting and compliance and the results of that testing, and not to provide an opinion on the internal control over financial reporting or on compliance. That report is an integral part of an audit performed in accordance with Government Auditing Standards in considering the District’s internal control over financial reporting and compliance.
December 16, 2019

SPECIAL ADMINISTRATIVE BOARD OF THE TRANSITIONAL SCHOOL DISTRICT OF THE CITY OF ST. LOUIS
(ST. LOUIS PUBLIC SCHOOLS)
Page 20
MANAGEMENT’S DISCUSSION AND ANALYSIS (MD&A) For The Fiscal Year Ended June 30, 2019
INTRODUCTION As management of the St. Louis Public Schools (the District), we are providing an overview of the District’s financial position and results of operations for the fiscal year ended June 30, 2019. It should be read in conjunction with the District’s financial statements. The Management’s Discussion and Analysis (MD&A) is a required component of the reporting model compiled in accordance with the Governmental Accounting Standards Board (GASB) Statements No. 34, 37 and 38. The MD&A provides you, the reader, with a brief discussion of the basic financial statements, a summary of the financial information in the statements, events concerning capital assets and long-term debt, and disclosures of known future events that may have a material impact on the future finances of the District. Comparative information between the current year and the prior year is required to be presented in the MD&A for the government-wide financial statements. FINANCIAL HIGHLIGHTS Prior to the end of fiscal year 2012 the District had been designated by the Department of
Elementary and Secondary Education (DESE) as financially stressed under the provisions of Section 161.520, RSMO for nine consecutive years. In the State of Missouri, a school district has to have a combined unrestricted balance remaining in the incidental and teachers funds of less than 3% of the amount expended from those funds during the year to be designated as financially stressed. In previous years, the District had depleted its unrestricted general operating fund balance, and thus had been classified as financially stressed. However, as noted below and in the notes section, the recent 2011 Desegregation Agreement, which provided funding to restore the unassigned fund balance, along with other cost savings/containment initiatives, has proven to be a significant step toward improving the District’s financial condition, both in the near term and in the long-term. In fiscal year 2012, the District generated its first unassigned surplus in nine years, in the amount of $3.3 million. As of June 30, 2013, unassigned fund surplus in the Incidental Fund was approximately $17.9 million, an increase of $14.6 million over fiscal year 2012. Fiscal year 2014 yielded more positive results with an additional $7.2 million Incidental Fund increase to the unassigned fund balance of $25.1 million. During fiscal year 2015 the unassigned fund balance decreased by $6.7 million to $18.4 million due to charter school legal settlements and capital improvements funded from the Incidental fund. As of fiscal year 2016 the unassigned fund balance increased by $2.4 million to $19.2 million due to expenses coming in under budget. At the end of fiscal year 2017 the unassigned fund balance increased by $30 million to $49.2 million mainly due to the tax rate increase and expenses coming in under budget. As of fiscal year 2018 the unassigned fund balance increased by $20.5 million to $69.7 million due to revenues exceeding budget and expenses coming in under budget. As of fiscal year 2019 the unassigned fund balance increased by $15.4 million to $85.1 million due to revenues exceeding budget and expenses coming in under budget.

To the Honorable Mayor, and Members of the Board of Education Of the City of St. Louis
Page 21
In fiscal year 2013, the District capitalized on historically low interest rates in the bond market by refunding approximately $75 million in outstanding debt. The interest savings to be realized is approximately $5 million. No bonds were issued or refunded in fiscal year 2014 or 2015. In fiscal year 2016 the District refunded approximately $24.1 million in outstanding debt. The interest savings to be realized is approximately $1.2 million. No bonds were issued or refunded in fiscal year 2017. In fiscal year 2018 the District refunded approximately $63.4 million in outstanding debt. The interest savings to be realized is approximately $3.3 million. There were no refundings in fiscal year 2019.
Pooled cash reserves provided adequate funds for day-to-day operations such that we did not need to use Tax Anticipation Notes (TANS) during the 2018-19 fiscal year. The assets and deferred outflows of resources for the District exceeded liabilities and deferred inflows by negative $271.3 million on the government-wide financial statements. Of this amount, there is a negative $413.8 million in unrestricted net position, compared to negative $300 million in unrestricted net position in FY 2018. The District’s total net position, when compared to fiscal year 2018, decreased by $85.1 million. The main reason for this decrease was continued significant pension expense.
On the fund financial statements, the net change in fund balances was $13.8 million as compared to a $43.5 million from fiscal year 2018. This can be attributed to significant other financing sources in 2018 from refunding. The total fund balance reported for the District’s total governmental funds was $151.3 million.
The largest portion of the District’s net position reflects a net investment of $78.2 million in capital assets (i.e. land, buildings, and equipment), less any related outstanding debt used to acquire those assets. Although the District’s investment in its capital assets is reported net of related debt, it should be noted that the resources needed to repay this debt must be provided from other sources, since the capital assets themselves cannot be liquidated to pay for these liabilities. The second largest portion of the District’s net position is debt service at $48.2 million.
As in prior years, the District continues to monitor the potential for lost revenues as a result of enrollment shifts associated with a transient student population and increasing charter school enrollments.
The voters of the City of St. Louis at the June 1993 election approved an indefinite waiver of a tax rollback. The voters of the City of St. Louis at the April 2016 election approved a tax rate increase of $0.75 for general operating expenses. Assessed valuation of $4.202 billion represents an increase from the preceding year. The increase was due mainly to increases in residential and personal property valuations. The tax levy, per $100 assessed valuation of tangible taxable property, for each of the District’s last two calendar years was as follows:
2017 2018 Change General fund $ 4.4131 $ 4.5160 $.1029 Debt service fund .6211 .6211 — $ 5.0342 $ 5.1371 $.1029

To the Honorable Mayor, and Members of the Board of Education Of the City of St. Louis
Page 22
Our financial statements provide further insights into the results of this year’s operations. OVERVIEW OF THE FINANCIAL STATEMENTS The MD&A is intended to serve as an introduction to the District’s basic financial statements. The basic financial statements are comprised of three components: 1) government-wide financial statements, 2) fund financial statements, and 3) notes to the financial statements. This report also contains other supplementary information in addition to the basic financial statements. Government-Wide Financial Statements All of the District’s activities, except the fiduciary activities, are reported in the government-wide financial statements, including instruction, building services, administration, instructional support, non-instructional support, transportation and food and community services. Property taxes, state aid, interest and investment earnings finance most of these activities. In addition, depreciation on all capital assets and interest expense on debt financing activities are reported here. Fund Financial Statements A fund is a grouping of related accounts that is considered a separate accounting entity with self-balancing accounts. It is used to maintain control over resources that have been segregated for specific objectives or activities. The District, similar to other state and local governments, uses fund accounting to ensure and demonstrate compliance with various finance related legal requirements. All of these funds can be divided into three categories: governmental funds, proprietary funds, and fiduciary funds. Governmental Funds Governmental funds are used to account for the functions reported as governmental activities in the government-wide financial statements. However, unlike the government-wide financial statements, governmental fund financial statements focus on near-term inflows and outflows of spendable resources, as well as on balances of spendable resources available at the end of the fiscal year. Such information may be useful in evaluating the District’s near-term financing requirements. Since the governmental fund financial statements are presented on a modified accrual basis, and the government-wide statements on an accrual basis of accounting, reconciliation information detailing the differences is provided. The major funds required for presentation are the general fund, teachers’ fund, grants funds, debt service fund, and the capital settlement fund. Information on the non-major funds is combined under the caption Other Governmental Funds.

To the Honorable Mayor, and Members of the Board of Education Of the City of St. Louis
Page 23
Proprietary Funds The District has one proprietary fund (Internal Service). Proprietary funds account for activities similar to the private sector. The proprietary fund financial statements provide information for the District’s services established to accumulate and provide resources for the payment of health and welfare benefits primarily on behalf of and for the benefit of the District’s employees, retirees and their dependents and to account for the costs of the District’s self-insurance program. Provided are the Statement of Net Position; Statement of Revenues, Expenses and Changes in Fund Net Position; and a Statement of Cash Flows. These statements use the accrual basis of accounting, similar to the government-wide statement. Fiduciary Funds The District has one fund used to report activity in which the District acts in a fiduciary capacity for another party (agency fund). The resources from these funds are not available to support District operations. Therefore, fiduciary activities are not included in the government-wide statements. Notes to Financial Statements The Notes to Financial Statements complement the financial statements by describing qualifying factors and changes throughout the fiscal year. Required Supplementary Information In addition to the basic financial statements and accompanying notes, certain required supplementary information (RSI) can be found following the Notes. Supplementary Information The combining and individual fund statements and schedules are presented immediately following the required supplementary information.

To the Honorable Mayor, and Members of the Board of Education Of the City of St. Louis
Page 24
GOVERNMENT–WIDE ANALYSIS This is the sixteenth year for government-wide financial statements using the full accrual basis of accounting. A comparative analysis with the data from the prior year is being provided in this section.
2018 2019 Change
Assets and Deferred Outflows of Resources
Current and other assets $191.2 $211.5 $20.3
Capital assets, net 335.4 316.0 (19.4)
Total Assets 526.6 527.5 0.9
Deferred outflows on bond refunding 5.0 3.9 (1.1)
Deferred outflows related to assumption changes OPEB 0.8 1.7 0.9
Deferred outflows related to pension contribution 18.4 18.2 (0.2)
Difference between expected and actual experience - pension 2.5 1.2 (1.3)
Deferred amount related to assumption changes 245.7 154.1 (91.6)
Deferred amount for difference between projected and actual
investment earnings for pension 40.7 54.9 14.2
Total Deferred Outflows of Resources 313.1 234.0 (79.1)
Total Assets and Deferred Outflows of Resources 839.7 761.5 (78.2)
Liabilities and Deferred Inflows of Resources
Current liabilities 27.4 31.6 4.2
Long-term liabilities 944.9 977.1 32.2
Total Liabilities 972.3 1008.7 36.4
Difference between actual and expected experience-pension 7.0 15.3 8.3
Change in proportional share-pension 8.8 8.8 0.0Deferred amount for difference between projected and actual investment earnings for pension 37.8 0.0 (37.8)
Total Deferred Inflows of Resources 53.6 24.1 (29.5)
Total Liabilities and Deferred Inflows of Resources 1,025.9 1,032.8 6.9
Net Position
Net investment in capital assets 49.5 78.2 28.7
Restricted for capital projects 5.3 4.6 (0.7)
Restricted for debt service 50.8 48.2 (2.6)
Restricted for desegregation settlement program 7.4 7.9 0.5
Restricted for endowments, nonexpendable 0.4 0.4 0.0
Restricted for workers compensation escrow 0.0 3.2 3.2
Unrestricted (299.6) (413.8) (114.2)
Total Net Position ($186.2) ($271.3) ($85.1)
Governmental Activities
June 30,

To the Honorable Mayor, and Members of the Board of Education Of the City of St. Louis
Page 25
Total net position for the District decreased $85.1 million from the prior year due primarily to lower expenses. Current and other assets increased by $20.3 million as cash has decreased. Capital assets decreased by $19.4 million due to additional depreciation. Current liabilities increased by $4.2 million as a result of increases in accounts payable. Total long-term liabilities increased $32.2 million, primarily due to the increase in other post employee benefits liability and the net pension liability. The District is able to report positive balances in the following categories of net position for the government as a whole: (1) net investment in capital assets and (2) restricted net position.
2018 2019 Change
Revenues
Program Revenues:
Charges for services $0.6 $0.5 ($0.1)
Operating grants and contributions 80.0 75.1 (4.9)
Capital grants and contributions 0.6 0.5 (0.1)
Total Program Revenues 81.2 76.1 (5.1)
General Revenues:
Taxes 285.7 290 4.3
Federal and state aid not restricted to specific purposes 29.8 19.3 (10.5)
Earnings on investments 1.6 3.2 1.6
Miscellaneous 5.2 4.9 (0.3)
Total General Revenues 322.3 317.4 (4.9)
Total Revenues 403.5 393.5 (10.0)
Expenses
Instruction 308.4 279.2 (29.2)
Building services 42.0 38.3 (3.7)
School administration 35.3 33 (2.3)
Instructional support 31.6 42.1 10.5
Non-instructional support 16.3 15.7 (0.6)
Transportation 27.0 28.0 1.0
Food and community services 34.8 34.4 (0.4)
Interest expense 6.6 7.9 1.3
Bond issuance costs 0.6 0 (0.6)
Total Expenses 502.6 478.6 (24.0)
Change In Net Position (99.1) (85.1) 14.0
Net Position - Beginning Of Year 22.8 (186.2) (209.0)
Prior Period Adjustment - Effect of GASB 75 Adoption (58.2) 0.0 58.2Prior Period Adjustment - Capital assets and AccumulatedDepreciation, net (51.7) 0.0 51.7
Net Position - End Of Year ($186.2) ($271.3) ($85.1)
Changes in Net Position from Operating Results (In Millions)
For The Years Ended June 30,

To the Honorable Mayor, and Members of the Board of Education Of the City of St. Louis
Page 26
Total revenues decreased by $10 million of which local tax revenue increased by $4.3 million while operating grants and state and federal revenue decreased $10.5 million. Expenses decreased by $24 million mainly due to decreases in instruction. FUND STATEMENTS The following schedule represents a summary of the revenue and other financial sources for the governmental funds for the period ended June 30, 2019. It also depicts the amount and percentage increases and decreases in relation to prior year revenues and other financial sources from fiscal year 2018.
Revenue Source Percentage
(In Millions) Increase Increase
2018 2019 (Decrease) (Decrease)
Amount Amount Over 2018 Over 2018
Local $292.3 $297.8 $5.5 1.9
County 4.0 3.8 (0.20) (5.00)
State 51.9 40.4 (11.5) (22.2)
Federal 54.4 52.1 (2.3) (4.2)
Total $402.6 $394.1 ($8.5) (2.1)
Local revenues increased by $5.5 million due to higher property tax collections. State revenues decreased by $11.5 million due to lower basic formula revenue because of lower enrollment. Federal revenue decreased by $2.3 million due to reduction in Title I appropriation.

To the Honorable Mayor, and Members of the Board of Education Of the City of St. Louis
Page 27
The following schedule represents a summary of the expenditures for the governmental funds by function for the period ended June 30, 2019. It also depicts the amount and percentage increases and decreases in relation to prior year amount.
Percentage
Percent Percent Increase Increase
2018 Of 2019 Of (Decrease) (Decrease)
Amount Total Amount Total From 2018 From 2018
Instruction 170.3$ 44.2 154.1$ 40.4 ($16.2) (9.5)
Building service 39.1 10.1 37.3 9.8 (1.8) (4.6)
Administration 35.2 9.1 32.6 8.6 (2.6) (7.4)
Instructional support 33.2 8.6 44.8 11.8 11.6 34.9
Non-instructional support 16.3 4.2 15.7 4.1 (0.6) (3.7)
Transportation 27.0 7.0 28.0 7.3 1.0 3.7
Food and community 34.8 9.0 34.4 9.0 (0.4) (1.1)
Capital outlay 1.2 0.3 3.2 0.8 2.0 166.7
Debt service 28.6 7.4 31.1 8.2 2.5 8.7
Total 385.7$ 100.0 381.2$ 100.0 ($4.5) (1.2)
Expenditures (In Millions)
The District experienced an overall expenditure decrease of $4.5 million from the prior year. Individual fund information is as follows:
General Fund The General Fund is the chief operating fund of the District. At the end of the current fiscal year, the unassigned fund balance of the General Fund was $85.1 million. Expenses increased by $8.8 million. Instruction increased by $429.1 thousand. Building services decreased by $416 thousand. Administration decreased by $1.3 million due to iPads purchases in the prior year. Instructional support increased by $8.6 million due to certificated teachers’ salaries recoded and professional and technical services recoded. Non-instructional support increased by $5 thousand. Transportation increased by $1.6 mission due to higher transportation costs. Food and community services programs increased by $114.3 thousand due to purchases of computers. Capital outlays decreased by $223 thousand. Debt Service Fund The Debt Service Fund expenditures exceeded revenues by nearly $2.6 million in 2019 and by $1.4 million in 2018. This is primarily due to federal sequestration that reduced the interest subsidy on the Proposition S bonds payments and the $1.2 million in interest on the crossover bonds that are held in escrow until the crossover date.

To the Honorable Mayor, and Members of the Board of Education Of the City of St. Louis
Page 28
Capital Settlement Fund The Capital Settlement Fund is a restricted capital project funds set up in connection with the Capital Settlement Agreement and transferred approximately $71 million to the general fund for the restoration of fund balance, payout of debt, and the funding for specific programs in 2012. Another Desegregation Settlement Agreement began in fiscal year 2015 and extended through fiscal year 2018 expending most of the funds. $3.8 million of unspent funds from the 2015 Agreement were returned to the Capital Settlement fund. The Capital Settlement Fund ended fiscal year 2019 with a $7.9 million fund balance. Teachers’ Fund The Teachers’ Fund is supplemented by the General Fund and therefore maintains a zero fund balance. Revenue decreased by $11.5 million. The school district trust fund revenue decreased by $0.7 million due to lower tax collections. Basic formula revenue decreased by $10.6 million as we had a decline in student enrollment. Expenses decreased by $9.7 million. Instruction decreased by $11.9 million due to recoding of certified teachers’ salaries and benefits and purchased instructional services. School Administration increased by $1.5 million. Instructional Support decreased by $1.7 million. Food and community service increased by $0.2 million due to certified teachers’ salaries and benefits recoded. Grant Funds The Grants Funds are used to account for financial resources and expenditures for federal and state funded services. Revenues were $58.2 million. Expenses were $57.2 million. This is a new fund grouping this year.
CAPITAL ASSETS
At June 30, 2019, the District had $316 million invested in a broad range of capital assets, including land, building and improvements, and equipment.
June 30, 2018 Additions And Deletions And June 30, 2019
Balance Transfers In Transfers Out Balance
Land 24,314$ —$ —$ 24,314$
Construction in progress 461 2,547 (2,055) 953
Impaired assets 12,323 — (872) 11,451
Building and non-movable equipment 759,528 2,049 — 761,577
Movable equipment 15,319 668 — 15,987
Total Capital Assets 811,945 5,264 (2,927) 814,282
Less: Accumulated depreciation 476,508 21,725 — 498,233
Totals 335,437$ (16,461)$ (2,927)$ 316,049$

To the Honorable Mayor, and Members of the Board of Education Of the City of St. Louis
Page 29
Additional information on capital assets can be found in Note 4 to the Basic Financial Statements. LONG-TERM DEBT As of June 30, 2019, the District had $279.7 million in debt compared to $303.8 million last year.
2018 2019 Change
Changes In Long-Term Debt (In Thousands)
Compensated absences 1,822$ 1,971$ 149$
Claims payable 10,257 9,660 (597)
Remediation liability 743 761 18
General obligation school building and refunding bonds 280,799 258,829 (21,970)
Less: Capital appreciation to maturity on bonds 1,840 1,148 (692)
Plus: Unamortized premium on bonds 11,997 9,673 (2,324)
Totals $ 303,778 $ 279,746 $ (24,032)
For The Years Ended June 30,
Additional information on long-term debt can be found in Note 5 to the Basic Financial statements. BUDGET REQUIREMENTS AND VARIANCES The District’s practice for amending the original budget is governed by District policy that states, “All requests for additional appropriations require Board approval…” District policy also states, “any transfer of appropriations between funds shall require approval of the Board.”
Increase(Decrease)
Original Final Over Original
Revenue $256.3 $256.3 —$
Expenses 151.8 147.2 (4.6)
The general fund original and final budgets revenue stayed the same. The expense budget was decreased by $4.6 million due to the transfer to other funds for the reading initiative and athletic fields. General fund actual revenues were $6.1 million higher than the final budget. General fund actual expenditures were lower by $6.7 million as compared to the final budget. REQUEST FOR INFORMATION This financial report is designed to provide citizens, taxpayers, parents, students, investors and creditors with a general overview of the District’s finances.

To the Honorable Mayor, and Members of the Board of Education Of the City of St. Louis
Page 30
Questions concerning any of the information provided in this report or requests for additional information should be addressed to:
St. Louis Public Schools Chief Financial Officer
801 N. 11th St. St. Louis, MO 63101

Basic Financial Statements

SPECIAL ADMINISTRATIVE BOARD OF THE TRANSITIONAL SCHOOL DISTRICT OF THE CITY OF ST. LOUIS
(ST. LOUIS PUBLIC SCHOOLS)
See the notes to basic financial statements. Page 31
STATEMENT OF NET POSITION June 30, 2019
Governmental
ActivitiesAssets
Cash and short-term investments 123,826,267$ Investments 41,230,230Receivables (net):
Grants 25,599,558Taxes 18,294,294Other 2,498,958
Prepaid assets 3,750Capital assets:
Land 24,313,740 Construction in progress 952,641 Impaired assets 11,451,497 Depreciable buildings, movable and
nonmovable equipment, net 279,330,810 Total Assets 527,501,745
Deferred Outflows Of ResourcesDeferred amount on bond refunding 3,890,909 Deferred amount related to assumption changes-OPEB 1,653,524Deferred amount related to pension contributions 18,170,867 Difference between expected and actual experience-pension 1,222,071 Deferred amount related to assumption changes-pension 154,111,970 Deferred amount for difference between projected and actual
investment earnings for pension 54,908,895 Total Deferred Outflows Of Resources 233,958,236
LiabilitiesAccounts payable 20,182,387Accrued interest 1,717,605Unearned revenue 7,768,349Deposits and escrow funds 1,907,726Long-term liabilities:
Due within one year 29,241,184Due in more than one year 250,504,605Net pension liability 621,206,680 Net OPEB liability 76,207,000
Total Liabilities 1,008,735,536
Deferred Inflows
Deferred Inflows Of ResourcesDifference between actual and expected experience-pension 15,272,340 Change in proportional share-pension 8,798,651
Total Deferred Inflows Of Resources 24,070,991
Net PositionNet investment in capital assets 78,184,903 Restricted:
Expendable:Capital projects 4,568,190 Debt service 48,216,804 Desegregation settlement programs 7,926,189
Endowments, nonexpendable 352,344 Workers compensation escrow 3,158,095
Unrestricted (413,753,071)
Total Net Position (271,346,546)$

ST. LOUIS PUBLIC SCHOOL FOUNDATION A Discretely Presented Component Unit Of St. Louis Public Schools
See the notes to basic financial statements. Page 32
STATEMENT OF FINANCIAL POSITION June 30, 2019
Assets
TotalCurrent Assets
Cash and cash equivalents 524,669$ Investments 2,955,914 Unconditional promises to give 498,137 Prepaid expenses 3,924
Total Current Assets 3,982,644
Unconditional Promises To Give 135,000 Property And Equipment 2,317
Total Assets 4,119,961$
Liabilities And Net AssetsCurrent Liabilities
Accounts payable 136,051$ Accrued expenses 43,433 Due to District —
Total Current Liabilities 179,484
Net Assets Without donor restrictions
Available for general activities 674,251 Board designated 57,335
Total net assets without donor restrictions 731,586
With donor restrictions 3,208,891 Total Net Assets 3,940,477
Total Liabilities And Net Assets 4,119,961$

SPECIAL ADMINISTRATIVE BOARD OF THE TRANSITIONAL SCHOOL DISTRICT OF THE CITY OF ST. LOUIS
(ST. LOUIS PUBLIC SCHOOLS)
See the notes to basic financial statements. Page 33
STATEMENT OF ACTIVITIES For The Year Ended June 30, 2019
Net (Expense) Revenue And
Program Revenues Changes In Net PositionOperating Capital
Charges For Grants And Grants And GovernmentalFunctions Expenses Services Contributions Contributions Activities
Governmental ActivitiesInstruction 279,226,947$ 122$ 26,822,055$ 465,509$ (251,939,261)$ Building services 38,349,233 — 132,640 — (38,216,593) School administration 32,968,117 2 613,006 — (32,355,109) Instructional support 42,088,514 — 14,532,700 — (27,555,814) Noninstructional support 15,703,754 13,741 631,013 — (15,059,000) Transportation 27,973,761 — 7,271,292 — (20,702,469) Food and community services 34,413,078 456,803 25,162,971 — (8,793,304) Interest expense 7,910,358 — — — (7,910,358)
Total Governmental Activities 478,633,762$ 470,668$ 75,165,677$ 465,509$ (402,531,908)
General RevenuesProperty taxes levied for:
General purposes 210,814,732 Debt service 26,709,302
Sales taxes 52,437,286 Federal and state aid not restricted to
specific purposes 19,288,287 Earnings on investments 3,183,472 Other revenues 4,941,764
Total General Revenues 317,374,843
Change In Net Position (85,157,065)
Net Position - Beginning Of Year (186,189,481)
Net Position - End Of Year (271,346,546)$

ST. LOUIS PUBLIC SCHOOL FOUNDATION A Discretely Presented Component Unit Of St. Louis Public Schools
See the notes to basic financial statements. Page 34
STATEMENT OF ACTIVITIES For The Year Ended June 30, 2019
Without Donor With DonorRestrictions Restrictions Totals
Operating ActivitiesRevenue, gains and other support
Contributions —$ 1,093,475$ 1,093,475$ Grants 1,077,125 1,322,444 2,399,569 Special events 120,951 — 120,951 In-kind contributions 14,004 — 14,004 Investment income 100,948 — 100,948 Other 41,031 — 41,031 Net assets released from restrictionsSatisfaction of time and usage restrictions 4,121,188 (4,121,188) —
Total Revenue, Gains AndOther Support 5,475,247 (1,705,269) 3,769,978
ExpensesProgram services 5,042,977 — 5,042,977 Supporting activities
Management and general 134,069 — 134,069 Fundraising 210,503 — 210,503
Total Supporting Activities 344,572 — 344,572 Total Expenses 5,387,549 — 5,387,549
Change In Net Assets 87,698 (1,705,269) (1,617,571)
Net Assets - Beginning Of Year 643,888 4,914,160 5,558,048
Net Assets - End Of Year 731,586$ 3,208,891$ 3,940,477$

SPECIAL ADMINISTRATIVE BOARD OF THE TRANSITIONAL SCHOOL DISTRICT OF THE CITY OF ST. LOUIS
(ST. LOUIS PUBLIC SCHOOLS)
See the notes to basic financial statements. Page 35
BALANCE SHEET - GOVERNMENTAL FUNDS Page 1 Of 2
June 30, 2019
Capital Projects
Non-major TotalDebt Capital Permanent Governmental
General Teachers Grants Service Building Settlement Fund FundsAssets
Cash and investments:Cash and short-term
investments 72,336,682$ 168$ 13,412,882$ 11,624,294$ 116,468$ 7,926,189$ —$ 105,416,683$ Other investments — — — 25,761,667 — — 4,920,534 30,682,201 Investments held for bonded
indebtedness by trustee — — — 10,548,029 — — — 10,548,029 Total Cash And
Investments 72,336,682 168 13,412,882 47,933,990 116,468 7,926,189 4,920,534 146,646,913
Receivables:Grants 3,214,516 — 22,385,042 — — — — 25,599,558 Taxes 20,892,747 — — 2,184,754 — — — 23,077,501 Other 587,041 — 236,531 57,755 — — — 881,327
Total Receivables 24,694,304 — 22,621,573 2,242,509 — — — 49,558,386
Due from other funds 20,822,740 6,489,140 — — 270,149 — — 27,582,029 Prepaid items — — 3,750 — — — — 3,750
Total Assets 117,853,726$ 6,489,308$ 36,038,205$ 50,176,499$ 386,617$ 7,926,189$ 4,920,534$ 223,791,078$

SPECIAL ADMINISTRATIVE BOARD OF THE TRANSITIONAL SCHOOL DISTRICT OF THE CITY OF ST. LOUIS
(ST. LOUIS PUBLIC SCHOOLS)
See the notes to basic financial statements. Page 36
BALANCE SHEET - GOVERNMENTAL FUNDS Page 2 Of 2
June 30, 2019
Capital ProjectsNon-major Total
Debt Capital Permanent GovernmentalGeneral Teachers Grants Service Building Settlement Fund Funds
Liabilities, Deferred Inflows Of Resources And Fund Balances
LiabilitiesAccounts payable 10,179,467$ 6,489,308$ 2,432,180$ —$ 386,617$ —$ —$ 19,487,572$ Due to other funds 6,759,289 — 20,822,740 — — — — 27,582,029 Deposits and escrow funds 1,907,726 — — — — — — 1,907,726 Unearned revenue — — 7,768,349 — — — — 7,768,349
Total Liabilities 18,846,482 6,489,308 31,023,269 — 386,617 — — 56,745,676
Deferred Inflows Of ResourcesProperty taxes 13,895,823 — — 1,857,374 — — — 15,753,197
Fund BalancesNonspendable
Permanent fund principal — — — — — — 352,344 352,344 Total Nonspendable — — — — — — 352,344 352,344
Restricted for:Bonded indebtedness — — — 48,319,125 — — — 48,319,125 Capital projects — — — — — 7,926,189 4,568,190 12,494,379
Total Restricted — — — 48,319,125 — 7,926,189 4,568,190 60,813,504
Assigned to:Grants — — 5,014,936 — — — — 5,014,936
Unassigned 85,111,421 — — — — — — 85,111,421 Total Fund Balances 85,111,421 — 5,014,936 48,319,125 — 7,926,189 4,920,534 151,292,205
Total Liabilities, Deferred Inflows ofResources and Fund Balances 117,853,726$ 6,489,308$ 36,038,205$ 50,176,499$ 386,617$ 7,926,189$ 4,920,534$ 223,791,078$

SPECIAL ADMINISTRATIVE BOARD OF THE TRANSITIONAL SCHOOL DISTRICT OF THE CITY OF ST. LOUIS
(ST. LOUIS PUBLIC SCHOOLS)
See the notes to basic financial statements. Page 37
RECONCILIATION OF THE BALANCE SHEET OF GOVERNMENTAL FUNDS TO THE STATEMENT OF NET POSITION
June 30, 2019
Total Fund Balance - Governmental Funds 151,292,205$
Amounts reported for governmental activities in the statement of net position are different because:
Capital assets used in governmental activities are not financial resources and, therefore, are not reported in the funds. The cost of the assets is $814,282,712 and the accumulated depreciation is $498,234,024. 316,048,688
Certain changes in the net pension liability are amortized over time and are not reported in the funds 204,342,812
Certain changes in the net OPEB liability are amortized over time and are not reported in the funds 1,653,524
Some of the District's property taxes will be collected after the 60-day availability period and are deferred inflows of resources in the fund financial statements. However, revenue for this amount is recognized in the government-wide financial statements, net of allowance for uncollectible amounts totaling $4,783,207. 10,969,990
Internal service funds are used by management to charge the costs of certain insurance and other employee benefits to individual funds. The assets and liabilities of the internal service funds are included in governmental activities in the statement of net position. 9,672,607
Long-term liabilities applicable to the District's governmental activities are not due and payable in the current period and, accordingly, are not reported as liabilities within the fund financial statements. Interest on long-term debt is not accrued in governmental funds, but rather is recognized as an expenditure when due. All liabilities - both current and long-term - are reported on the government-wide statement of net position. Bond discounts and premiums are reported in the governmental fund financial statements when the debt was issued whereas these amounts are deferred and amortized over the life of the debt as an adjustment to interest expense on the government-wide financial statements.
Balances as of June 30, 2019 are:Accrued interest on outstanding debts (1,717,605) Bonds and notes payable (257,680,597) Unamortized deferred outflow on bond refunding 3,890,909 Unamortized bond premium (9,673,169) Accrued compensated absences (1,971,498) Other post-employment benefits liability (76,207,000) Remediation liability (760,732) Net pension liability (621,206,680)
Total Net Position - Governmental Activities (271,346,546)$

SPECIAL ADMINISTRATIVE BOARD OF THE TRANSITIONAL SCHOOL DISTRICT OF THE CITY OF ST. LOUIS
(ST. LOUIS PUBLIC SCHOOLS)
See the notes to basic financial statements. Page 38
STATEMENT OF REVENUES, EXPENDITURES AND CHANGES IN FUND BALANCES - GOVERNMENTAL FUNDS For The Year Ended June 30, 2019
Non-major TotalDebt Capital Permanent Governmental
General Teachers Grants Service Building Settlement Fund FundsRevenues
Local:Current taxes 231,363,589$ 24,770,006$ —$ 25,590,012$ —$ —$ —$ 281,723,607$
Delinquent taxes 7,716,090 — — 1,115,125 — — — 8,831,215 Investment income (loss) 1,828,071 — 15,690 1,448,406 8,058 3,894 (168,011) 3,136,108 Other 2,200,713 — 1,937,994 — 21,250 — (2,723) 4,157,234
County 3,069,564 258,134 — 426,331 — — — 3,754,029 State:
Basic formula — 19,483,118 — — — — — 19,483,118 Categorical aid 12,021,251 — 7,001,485 — — — — 19,022,736 Other 1,483,458 — 443,957 — — — — 1,927,415
Federal 2,702,691 531,249 48,802,759 — — — — 52,036,699 Total Revenues 262,385,427 45,042,507 58,201,885 28,579,874 29,308 3,894 (170,734) 394,072,161
ExpendituresCurrent:
Instruction 18,677,215 118,287,926 17,077,232 — — — 31,548 154,073,921 Building service 36,976,019 205,287 77,688 — — — — 37,258,994 School administration 18,804,321 13,443,360 405,227 — — — — 32,652,908 Instructional support 21,720,131 11,732,415 11,358,983 — — — — 44,811,529 Noninstructional support 14,564,635 912,160 226,651 — — — — 15,703,446 Transportation 25,547,036 — 2,426,142 — — — — 27,973,178 Food and community services 4,168,542 5,119,056 25,123,360 — — — — 34,410,958
Capital outlay — — 477,172 — 2,672,658 — 4,014 3,153,844 Debt service:
Principal retirement — — — 21,970,000 — — — 21,970,000 Interest charges — — — 9,216,137 — — — 9,216,137
Total Expenditures 140,457,899 149,700,204 57,172,455 31,186,137 2,672,658 — 35,562 381,224,915
Excess (Deficiency) Of RevenuesOver Expenditures 121,927,528 (104,657,697) 1,029,430 (2,606,263) (2,643,350) 3,894 (206,296) 12,847,246
Other Financing Sources (Uses)Transfers in 27,566,437 104,657,697 388,725 — 1,718,420 — — 134,331,279 Transfers out (134,046,026) — (255,152) — — — (30,101) (134,331,279) Proceeds from sale of capital assets — — — — 906,838 — — 906,838
Total Other Financing Sources (Uses) (106,479,589) 104,657,697 133,573 — 2,625,258 — (30,101) 906,838
Net Change In Fund Balances 15,447,939 — 1,163,003 (2,606,263) (18,092) 3,894 (236,397) 13,754,084
Fund Balances - Beginning Of Year 69,663,482 — 3,851,933 50,925,388 18,092 7,922,295 5,156,931 137,538,121
Fund Balances - End Of Year 85,111,421$ —$ 5,014,936$ 48,319,125$ —$ 7,926,189$ 4,920,534$ 151,292,205$
Capital Projects

SPECIAL ADMINISTRATIVE BOARD OF THE TRANSITIONAL SCHOOL DISTRICT OF THE CITY OF ST. LOUIS
(ST. LOUIS PUBLIC SCHOOLS)
See the notes to basic financial statements. Page 39
RECONCILIATION OF THE STATEMENT OF REVENUES, EXPENDITURES AND CHANGES IN FUND BALANCES OF GOVERNMENT FUNDS
TO THE STATEMENT OF ACTIVITIES For The Year Ended June 30, 2019
Net Change In Fund Balances - Total Governmental Funds 13,754,084$ Amounts reported for governmental activities in the statement of activities are different because:
Governmental funds report capital outlays as expenditures. However, in the statement of activities, assets with an initial, individual cost of more than $5,000 are capitalized and the cost is allocated over their estimated useful lives and reported as depreciation expense. This is the amount by which capital outlay exceeded depreciation in the current period.
Capital outlay 3,288,869$ Depreciation expense (21,725,112)
(18,436,243) In the statement of activities, the gain or loss on the sale or disposal of capital assets and any impairment loss is recognized. The fund financial statements recognize only the proceeds from these sales. (952,000)
Some expenses reported in the statement of activities do not require the use of current financial resources and therefore are not reported as expenditures in governmental funds. These amounts presented represent the change in these accrued liabilities for the current year.
Accrued compensated absences (149,216) Remediation liability (17,793)
The issuance of long-term debt provides current financial resources to governmental funds, while the repayment of the principal of long-term debt consumes the current financial resources of governmental funds. Neither transaction, however, has any effect on net position. Also, governmental funds report the effect of premiums and discounts and similar items when debt is first issued, whereas these amounts are deferred and amortized for governmental activities. This amount is the net effect of these differences in the treatment of long-term debt and related items.
Repayment of bond principal 21,970,000 Accrued interest - general obligation bonds 802,962 Amortization of premium, deferred outflow on bond refunding and
capital appreciation bonds 502,817 OPEB expense (1,570,098) Pension expense (103,236,167)
(81,530,486) Revenues in the statement of activities (net of allowance for uncollectible amounts) that do not provide current financial resources are not reported as revenues in the fund financial statements. (597,665)
Internal service funds are used by the District to charge the costs of insurance to individual funds. The net income of the internal service funds is reported with governmental activities. 2,772,254
Change In Net Position Of Governmental Activities (85,157,065)$

SPECIAL ADMINISTRATIVE BOARD OF THE TRANSITIONAL SCHOOL DISTRICT OF THE CITY OF ST. LOUIS
(ST. LOUIS PUBLIC SCHOOLS)
See the notes to basic financial statements. Page 40
STATEMENT OF NET POSITION - PROPRIETARY FUND June 30, 2019
GovernmentalActivity
InternalService
AssetsCurrent Assets:
Cash 18,409,584$ Receivables-other 1,617,631
Total Assets 20,027,215
LiabilitiesCurrent Liabilities:
Accounts payable 694,815Claims payable 3,650,119
Total Current Liabilities 4,344,934
Noncurrent Liabilities:Claims payable 6,009,674
Total Liabilities 10,354,608
Net PositionUnrestricted 9,672,607$

SPECIAL ADMINISTRATIVE BOARD OF THE TRANSITIONAL SCHOOL DISTRICT OF THE CITY OF ST. LOUIS
(ST. LOUIS PUBLIC SCHOOLS)
See the notes to basic financial statements. Page 41
STATEMENT OF REVENUES, EXPENSES AND CHANGES IN FUND NET POSITION
PROPRIETARY FUND For The Year Ended June 30, 2019
GovernmentalActivity
InternalService
Operating RevenuesInterfund services provided 51,362,306$
Operating ExpensesClaims 3,000,201Insurance premiums 45,637,214
Total Operating Expenses 48,637,415
Operating Income 2,724,891
Nonoperating RevenueInterest 47,363
Change In Net Position 2,772,254
Net Position - Beginning Of Year 6,900,353
Net Position - End Of Year 9,672,607$

SPECIAL ADMINISTRATIVE BOARD OF THE TRANSITIONAL SCHOOL DISTRICT OF THE CITY OF ST. LOUIS
(ST. LOUIS PUBLIC SCHOOLS)
See the notes to basic financial statements. Page 42
STATEMENT OF CASH FLOWS - PROPRIETARY FUND For The Year Ended June 30, 2019
GovernmentalActivity
InternalService
Cash Flows From Operating ActivitiesCash receipts from interfund services
provided 50,867,546$ Cash payments to suppliers for goods and
services (49,162,132) Net Cash Provided By Operating Activities 1,705,414
Cash Flows Provided By Investing ActivitiesCash from interest received 47,363
Net Increase In Cash 1,752,777
Cash - Beginning Of Year 16,656,807
Cash - End Of Year 18,409,584$
Reconciliation Of Operating Income To Net Cash Provided By Operating Activities
Operating income 2,724,891$ Change in assets and liabilities:
Increase in accounts receivable (494,760) Decrease in accounts payable 72,637 Increase in claims payable (597,354)
Net Cash Provided By Operating Activities 1,705,414$

SPECIAL ADMINISTRATIVE BOARD OF THE TRANSITIONAL SCHOOL DISTRICT OF THE CITY OF ST. LOUIS
(ST. LOUIS PUBLIC SCHOOLS)
See the notes to basic financial statements. Page 43
STATEMENT OF FIDUCIARY ASSETS AND LIABILITIES AGENCY FUNDS
June 30, 2019
AssetsCash and short-term investments 21,878,120$ Prepaid expenses 111
Total Assets 21,878,231$
LiabilitiesAccounts payable 575,337$ Unexpended balance of grants 664,826 Deposits and escrow funds 20,638,068
Total Liabilities 21,878,231$

SPECIAL ADMINISTRATIVE BOARD OF THE TRANSITIONAL SCHOOL DISTRICT OF THE CITY OF ST. LOUIS
(ST. LOUIS PUBLIC SCHOOLS)
Page 44
NOTES TO BASIC FINANCIAL STATEMENTS June 30, 2019
1. Summary Of Significant Accounting Policies The Special Administrative Board of the Transitional School District of the City of St. Louis (the District) is a metropolitan school district created by Missouri state statute as a separate governmental entity for the express purpose of supervising and governing the public schools’ property within the boundaries of the City of St. Louis, Missouri.
As discussed in Note 11 to the basic financial statements, one of the provisions of Senate Bill 781 was the possible appointment of a three (3) member board if the school district failed to receive accreditation from the state. This Special Administrative Board (SAB) would take over the authority granted to the elected Board of Education for the operation of all or part of the duties. Effective June 15, 2007, the SAB became the governing body of the District. On April 16, 2019, the Missouri State Board of Education unanimously voted to return governance of the Saint Louis Public School District (SLPS) to the voter-elected St. Louis City Board of Education, effective July 1, 2019. The District receives significant financial assistance from the State of Missouri (the State) under various State programs established to support public education at school districts throughout the State. Resources appropriated for this purpose are administered by the Missouri Department of Elementary and Secondary Education (the Department). The District is subject to various reporting and compliance requirements in order to obtain and retain continued funding from the Department. The accounting policies of the District conform to generally accepted accounting principles applicable to governmental entities. The following is a summary of the more significant accounting policies:
Reporting Entity: The District defines its financial reporting entity in accordance with the provisions of GASB Statement No. 14, The Financial Reporting Entity, as amended by GASB Statement No. 39, Determining Whether Certain Organizations are Component Units - an amendment of GASB Statement No. 14 and GASB Statement No. 61, the Financial Reporting Entity - Omnibus. The requirements for inclusion of component units are based primarily upon whether the District’s governing body is considered financially accountable for the potential component units. The District is financially accountable if it appoints a voting majority of a potential component unit’s governing body and is able to impose its will on that potential component unit, or there is the potential for the potential component unit to provide specific financial benefits to, or impose specific financial burdens on, the District.

SPECIAL ADMINISTRATIVE BOARD OF THE TRANSITIONAL SCHOOL DISTRICT OF THE CITY OF ST. LOUIS (ST. LOUIS PUBLIC SCHOOLS)
Notes To Basic Financial Statements (Continued)
Page 45
The Saint Louis Public Schools Foundation (the Foundation) is a legally separate tax-exempt entity which meets the criteria set forth for component units under GASB Statement No. 39. The Foundation provides financial support for the objectives, purposes, and programs of the District. Although the District does not control the timing, purpose, or amount of receipts from the Foundation, the resources (and income thereon) which the Foundation holds and invests are restricted to the activities of the District. Because these resources held by the Foundation can only be used by, or for the benefit of, the District, the Foundation is considered a component unit of the District and is discretely presented in the District’s financial statements. The Foundation is a private nonprofit organization that reports under generally accepted accounting principles set forth by the Financial Accounting Standards Board (FASB) standards. As such, certain revenue recognition criteria and presentation features are different from Governmental Accounting Standards Board revenue recognition criteria and presentation features. No modifications have been made to the Foundation’s financial information in the District’s financial report for these differences. The Foundation’s significant notes are summarized in Note 14. During the year ended June 30, 2019, the Foundation distributed $3,935,818 to the District for restricted and unrestricted purposes. Complete financial statements can be obtained by sending a written request to: Saint Louis Public Schools Foundation, 801 N. 11th Street, Third Floor, Saint Louis, MO 63101. Basis Of Presentation: The District’s basic financial statements consist of government-wide statements, which include a statement of net position and a statement of activities and fund financial statements, which provide a more detailed level of financial information. Government-Wide Financial Statements: The government-wide financial statements (i.e., the statement of net position and the statement of activities) report information on all of the nonfiduciary activities of the District. The effect of interfund activity has been removed from these statements to minimize the duplication of internal activities with the exception of interfund services provided and used. The statement of activities demonstrates the degree to which the direct expense of a given function or segment is offset by program revenues. Direct expenses are those that are clearly identifiable with a specific function. Program revenues include 1) charges to students or applicants who purchase, use, or directly benefit from goods, services, or privileges provided by a given function and 2) grants and contributions that are restricted to meeting the operational or capital requirements of a particular function. Taxes and other items not properly included among program revenues are reported instead as general revenues.

SPECIAL ADMINISTRATIVE BOARD OF THE TRANSITIONAL SCHOOL DISTRICT OF THE CITY OF ST. LOUIS (ST. LOUIS PUBLIC SCHOOLS)
Notes To Basic Financial Statements (Continued)
Page 46
Fund Financial Statements: Following the government-wide financial statements are separate financial statements for governmental funds, a proprietary fund (internal service), and fiduciary funds (agency). The activity of the fiduciary funds is excluded from the government-wide financial statements while the activity of the internal service fund is included. Major individual governmental funds are reported as separate columns in the fund financial statements. All other governmental funds are reported in one column labeled “Non-major Governmental Funds.” Fund Accounting: The accounts of the District are organized on the basis of funds, each of which is considered a separate accounting entity with self-balancing accounts that comprise its assets, liabilities, fund balances, revenues, and expenditures or expenses. The various funds are summarized by type in the basic financial statements. A description of the activities of the various major governmental funds is provided below. Governmental Funds: Governmental funds are those through which most governmental functions of the District are financed. The acquisition, use, and balances of the District’s expendable financial resources and the related liabilities (except those accounted for in proprietary funds) are accounted for through governmental funds. The measurement focus is upon determination of and changes in financial position rather than upon net income. The following are the District’s major funds:
General - To account for all financial resources except those required to be accounted for in another fund.
Teachers - This is a special revenue fund used to account for financial resources and expenditures for certified employees involved in administration and instruction. It includes revenues restricted by the State of Missouri and taxes allocated to the fund based on the District’s tax levy to be used for the payment of teachers’ salaries, related benefits and tuition for students.
Grants - This is a special revenue fund used to account for financial resources and expenditures for various grant related programs. It includes revenues funded by the Federal government, the State of Missouri and local contributors to be used for the payment of eligible expenditures.
Debt Service - Used to account for the accumulation of resources for, and the payment of, general long-term debt principal, interest and related costs.
Building - This is a Capital Settlement fund used to account for financial resources and expenditures related to the acquisition or improvement of land, buildings and equipment.
Capital Settlement - This is a Capital Settlement fund used to account for financial resources and expenditures related to the Capital Settlement Vocational Education Plan, court approved on March 12, 1999 and separately related to the court approved Settlement Plan Agreement with the State of Missouri for construction and site acquisition costs to accommodate any reasonable anticipated net enrollment increase caused by the elimination of the Desegregation Plan. The State has paid specified sums to the District starting on July 1, 1999 and ending July 1, 2009. (See Note 11 for additional information).

SPECIAL ADMINISTRATIVE BOARD OF THE TRANSITIONAL SCHOOL DISTRICT OF THE CITY OF ST. LOUIS (ST. LOUIS PUBLIC SCHOOLS)
Notes To Basic Financial Statements (Continued)
Page 47
The other governmental funds of the District are considered nonmajor. They are permanent funds which account for specific financial resources and expenditures.
Additionally, the District reports the following fund types: Proprietary Fund Types:
Proprietary funds are used to account for ongoing organizations and activities, which are similar to those often found in the private sector. An Internal Service Fund is used to account for costs of the District’s limited self-insurance program using a flow of economic resources measurement focus and an accrual basis of accounting and to account for the activities of the St. Louis Public Schools Health Benefits Trust, which accumulates resources for the payment of health and welfare benefits primarily on behalf of and for the benefit of the District’s employees, retirees and their dependents.
Fiduciary Fund Type: Agency Fund - This fund is used to account for transactions related to amounts received in an agency capacity on behalf of individuals, private organizations, and other governmental units. The District has no equity interest in this fund. This fund applies the accrual basis of accounting. The District’s agency fund is used to account for monies placed in escrow that represent the District’s retirement contribution to the Public School Retirement System of the City of St. Louis.
Measurement Focus, Basis Of Accounting And Financial Statement Presentation:
The government-wide financial statements are reported using the economic resources measurement focus and the accrual basis of accounting. Revenues are recorded when earned and expenses are recorded when a liability is incurred, regardless of the timing of related cash flows. Property taxes are recognized as revenues in the year for which they are levied. Grants and similar items are recognized as revenue as soon as all eligibility requirements imposed by the provider have been met. Governmental fund financial statements are accounted for using a current financial resources measurement focus and the modified accrual basis of accounting. With this measurement focus, only current assets and current liabilities generally are included on the balance sheet. The statement of revenues, expenditures and changes in fund balances reports on the sources (i.e., revenues and other financing sources) and uses (i.e., expenditures and other financing uses) of current financial resources. This approach differs from the manner in which the governmental activities of the government-wide financial statements are prepared. Governmental fund financial statements therefore include a reconciliation with brief explanations to better identify the relationship between the government-wide statements and the statements for governmental funds.

SPECIAL ADMINISTRATIVE BOARD OF THE TRANSITIONAL SCHOOL DISTRICT OF THE CITY OF ST. LOUIS (ST. LOUIS PUBLIC SCHOOLS)
Notes To Basic Financial Statements (Continued)
Page 48
Like the government-wide financial statements, the proprietary fund is accounted for using the flow of economic resources measurement focus. Agency funds have no measurement focus. The proprietary fund uses the accrual basis of accounting. With this measurement focus, all assets and all liabilities associated with the operation of this fund are included in the statement of net position. The proprietary fund type operating statement presents increases (i.e., revenues) and decreases (i.e., expenses) in total net position. Revenues and expenses for the proprietary fund are divided into operating and non-operating items. Operating revenues generally result from providing services in connection with the operations of the District’s internal service fund. The principal operating revenue of the internal service fund is the interfund services provided associated with providing unemployment, workers’ compensation, health and welfare insurance on behalf of employees and retirees to other departments and funds. Operating expenses include the costs associated with unemployment and workers’ compensation claims, health and welfare benefits and administrative expenses. All revenues and expenses not meeting these definitions are reported as nonoperating revenues and expenses. Revenue resulting from exchange transactions, in which each party gives and receives essentially equal value, is recorded on the accrual basis when the exchange takes place. On a modified accrual basis, revenue is recorded in the year in which the resources are measurable and become available. Available means that the resources will be collected within the current year or are expected to be collected soon enough thereafter to be used to pay liabilities of the current year. Nonexchange transactions, in which the District receives value without directly giving equal value in return, include property taxes, grants, entitlements and donations. On an accrual basis, revenue from property taxes is recognized in the year for which the taxes are levied (Note 3). Revenue from grants, entitlements and donations is recognized in the year in which all eligibility requirements have been satisfied. Eligibility requirements include timing requirements, which specify the year when the resources are required to be used or the year when use is first permitted, matching requirements, in which the District must provide local resources to be used for a specified purpose, and expenditure requirements, in which the resources are provided to the District on a reimbursement basis. On a modified accrual basis, revenue from nonexchange transactions must also be available before it can be recognized. For the District, available means expected to be received within 60 days of year end for property taxes and 120 days for grants. Under the modified accrual basis, the following revenue sources are considered to be both measurable and available at year end: property taxes, state monies, tuition, fees, interest, grants and rentals.

SPECIAL ADMINISTRATIVE BOARD OF THE TRANSITIONAL SCHOOL DISTRICT OF THE CITY OF ST. LOUIS (ST. LOUIS PUBLIC SCHOOLS)
Notes To Basic Financial Statements (Continued)
Page 49
Unearned Revenue: Unearned revenue arises when assets are recognized before revenue recognition criteria have been satisfied and when certain grants received before eligibility requirements are met are reported as unearned revenues. Expenses/Expenditures: On the accrual basis of accounting, expenses are recognized at the time they are incurred. The measurement focus of governmental fund accounting is on decreases in net financial resources (expenditures) rather than expenses. Expenditures are generally recognized in the accounting period in which the related fund liability is incurred, if measurable. However, principal and interest on general long-term debt, and compensated absences, which have not matured are recognized when paid. Allocations of cost, such as depreciation and amortization, are not recognized in governmental funds. When both restricted and unrestricted resources are available for use, it is the District’s policy to use restricted resources first, then unrestricted resources as they are needed.
Cash And Investments: The District employs a cash management program whereby available cash resources of all funds, except certain Capital Settlement, the debt service fund and the permanent fund, are combined to form pools of cash and investments that are managed by the Treasurer of the District. Such investments consist primarily of cash equivalents, such as money market mutual funds, insured cash sweep accounts, banker’s acceptances, and short-term U.S. government securities. Interest income earned on pooled funds is distributed to the appropriate funds based on the average daily balance of the cash and investments of each fund. Investments of the permanent fund consist of marketable equity securities, which are carried at fair value. Short-term investments of the general, teachers, Capital Settlement, grants and debt service funds consist of short-term U.S. Government Treasury and Agency securities, money market mutual funds, and commercial paper, which are carried at net asset value, contract value or amortized cost, which approximates fair value, or fair value in accordance with GASB Statement 72, Fair Value Measurement and Application as amended by GASB 79, Certain External Investment Pools and Pool Participants. The District invests in various investment securities. Investment securities are exposed to various risks such as interest rate, market, and credit risks. Due to the level of risk associated with certain investment securities, it is at least reasonably possible that changes in the values of investment securities will occur in the near term and that such changes could materially affect the amounts reported in the statement of net position (See Note 2).
Restricted Investments Held For Bonded Indebtedness: Certain proceeds of the District’s bond issuances, as well as certain resources set aside for their repayment, are classified in restricted assets in accordance with the bond indentures.

SPECIAL ADMINISTRATIVE BOARD OF THE TRANSITIONAL SCHOOL DISTRICT OF THE CITY OF ST. LOUIS (ST. LOUIS PUBLIC SCHOOLS)
Notes To Basic Financial Statements (Continued)
Page 50
Inventories: Inventories are recorded at cost on the first-in, first-out basis. Governmental fund types use the consumption method for inventory which means it is recorded as an expenditure when it is used rather than when purchased. Prepaid Items: Payments made to vendors for services that will benefit periods beyond the fiscal year-end are recorded as prepaid items on the purchase method. Prepaid items are recorded as expenditures when purchased rather than when consumed. Capital Assets: Capital assets, which include land, buildings, building improvements and equipment, are reported in the governmental activities column of the government-wide statement of net position but are not reported in the fund financial statements. All capital assets are capitalized at cost (or estimated historical cost) and updated for additions and retirements during the year. Donated capital assets, donated works of art and similar items, and capital assets received in a service concession arrangement are recorded at their acquisition value as of the date received. The District maintains a capitalization threshold of $5,000. The District does not possess any infrastructure. Improvements are capitalized and the cost of normal maintenance and repairs that do not add to the value of the asset or materially extend an asset’s life are expensed. All reported capital assets except land, impaired assets, and construction in progress are depreciated. Improvements are depreciated over the remaining useful lives of the related capital assets. Depreciation is computed using the straight-line method over the following useful lives:
Description Years Buildings and improvements 20 - 40 Furniture and equipment 5 - 15
The District reviews its capital assets for impairment whenever events or changes in circumstances indicate that the carrying value of such property may not be recoverable. Recoverability is measured by a comparison of the carrying amount of the property to the standard market value of the property. If the property is considered to be impaired, the impairment to be recognized is measured at the amount by which the carrying amount of the property exceeds the fair value of such property. Compensated Absences: Vacation benefits are available to all salaried employees paid on a 12-month basis. Vacation benefits are recorded as earned. Vacation may be carried over from year to year up to a maximum accumulation of 36 accrued vacation days. Unused vacation days in excess of the 36 carryover days will be lost. Therefore, a liability for accrued vacation is recorded for full accrual purposes in the government-wide financial statements. However, for governmental fund financial statement purposes a liability for these amounts is reported only if the amount is due at fiscal year-end and payable with current resources. Vacation benefits include salary related payments.

SPECIAL ADMINISTRATIVE BOARD OF THE TRANSITIONAL SCHOOL DISTRICT OF THE CITY OF ST. LOUIS (ST. LOUIS PUBLIC SCHOOLS)
Notes To Basic Financial Statements (Continued)
Page 51
The District’s sick leave policy allows employees to take up to twelve sick days per year. The number of allowable sick days depends on when an employee was hired and how many months a year they are employed. Unused sick time can be carried over from year to year up to a maximum accumulation of 130 days. Upon retirement, employees have the option of receiving $100 per day for exempt employees or $50 per day for non-exempt employees for unused sick time or employees have the option of converting it to time worked for the retirement plan calculation. Such time is only considered to be vested, and thus accrued, upon retirement. Long-Term Liabilities: In the government-wide financial statements, long-term debt and other long-term obligations are reported as liabilities in the statement of net position. Bond premiums and discounts and deferred amounts on refunding bonds, are deferred and amortized over the life of the bonds using the straight-line method. Bonds payable are reported net of capital appreciation to maturity and applicable bond premiums and discounts. In the fund financial statements, governmental funds recognize bond premiums, discounts, and bond issuance costs, during the current period. The face amount of debt issued is reported as other financing sources. Premiums received on debt issuances are reported as other financing sources while discounts on debt issuances are reported as other financing uses. Issuance costs, whether or not withheld from the actual debt proceeds received, are reported as debt service expenditures. Payments of bond proceeds made to an escrow agent for refunding bonds are reported as other financing uses. The general, teachers’, and grant funds are typically used to liquidate long-term liabilities other than debt, including compensated absences and pension liability based upon where the related salaries are recognized.
Deferred Outflows And Inflows Of Resources: In addition to assets and liabilities, the statement of net position will sometimes include separate sections for deferred outflows and inflows of resources. These separate financial statement elements represent the use or acquisition of net position that applies to a future period or periods and will not be recognized as an outflow or inflow of resources until then. The District has deferred outflows and inflows of resources in the statement of net position that relate to deferred loss on bond refunding, and other postemployment benefits and pension related deferrals required by the implementation of GASB Statement No. 75 and 68, respectively. In the governmental fund financial statements, receivables that will not be collected within the available period have been reported as deferred inflows of resources. Pensions: Pension-related expenses, liabilities, deferred outflows of resources and deferred inflows of resources have been determined on the same basis as they are reported by the Public School Retirement System of the City of St. Louis (the System). For this purpose, benefit payments are recognized when due and payable in accordance with the benefit terms. Investments are reported at fair value.

SPECIAL ADMINISTRATIVE BOARD OF THE TRANSITIONAL SCHOOL DISTRICT OF THE CITY OF ST. LOUIS (ST. LOUIS PUBLIC SCHOOLS)
Notes To Basic Financial Statements (Continued)
Page 52
Fund Balances And Net Position: The governmental fund financial statements present fund balances based on classifications that comprise a hierarchy that is based primarily on the extent to which the District is bound to honor constraints on the specific purposes for which amounts in the respective governmental funds can be spent. The classifications used in the governmental fund financial statements are as follows:
• Nonspendable Fund Balance - Includes amounts not in spendable form, such as
inventory, or prepaids, or amounts required to be maintained intact legally or contractually (principal balance of endowment).
• Restricted Fund Balance - Includes amounts constrained for a specific purpose by external parties (e.g. Debt Service, Capital Settlement, Grant Funds) and amounts imposed by law through constitutional provisions or enabling legislation (must be legally enforceable).
• Committed Fund Balance - Includes amounts constrained for a specific purpose through formal action by the governments highest level of decision making authority. Fund Balance of the District may be committed for a specific source by resolution of the Special Administrative Board. Amendments or modifications of the committed fund balance must also be approved by formal action of the Special Administrative Board.
• Assigned Fund Balance - Includes amounts constrained for a specific purpose by a governing board or by a committee or official that has been delegated authority from the governing body to assign amounts. By adopted Board policy, assignments are made by the Special Administrative Board.
• Unassigned Fund Balance - The residual fund balance for the general fund. The unassigned fund may include a negative unassigned fund balance in other governmental funds if expenditures incurred for specific purposes exceed the amounts restricted, committed, or assigned to those purposes.
The District’s policy in circumstances where an expenditure is to be made for a purpose for which amounts are available in multiple fund balance classifications, the order in which resources will be expended is as follows: restricted fund balance, followed by committed fund balance, assigned fund balance, and lastly, unassigned fund balance. In the government-wide financial statements net position are classified as follows:
Net investment in capital assets - the component of net position that reports the difference between capital assets less both the accumulated depreciation and the outstanding balance of debt, excluding unexpended proceeds, that is directly attributable to the acquisition, construction or improvement of those assets. Restricted for specific purposes - the component of net position that reports the difference between assets and liabilities of the certain programs that consists of assets with constraints placed on their use by either external parties and/or enabling legislation.

SPECIAL ADMINISTRATIVE BOARD OF THE TRANSITIONAL SCHOOL DISTRICT OF THE CITY OF ST. LOUIS (ST. LOUIS PUBLIC SCHOOLS)
Notes To Basic Financial Statements (Continued)
Page 53
Unrestricted - the difference between the assets and liabilities that are not reported in net position - net investment in capital assets or net position - restricted for specific purposes.
Interfund Balances And Activity: Transfers of resources from a fund receiving revenue to the fund through which the resources are to be expended are recorded as other financing sources (uses).
In the process of aggregating data for the statement of net position and the statement of activities, some amounts reported as interfund activity and balances in the funds were eliminated or reclassified. Interfund receivables and payables were eliminated to minimize the “grossing up” effect on assets and liabilities within the governmental activities column. The District charges indirect costs to certain Federal grant programs as permitted under the terms of the grant agreements. The costs of the District’s self-insurance and benefit programs are also charged to various governmental funds by application of a premium rate to gross salary expenditures. These interfund transactions are recorded as interfund services provided or used and are not eliminated because they would be treated as revenues and expenditures or expenses if they involved organizations external to the District. Accordingly, charges for indirect costs and the cost of the District’s self-insurance programs are recorded as revenue in the general fund and internal service fund, respectively, and expenditures in the funds charged. Statement Of Cash Flows: The proprietary fund type considers all highly liquid investments with a maturity of three months or less, when purchased, to be cash equivalents. Management’s Use Of Estimates: The preparation of financial statements in conformity with accounting principles generally accepted in the United States requires management to make estimates and assumptions that affect the reported amounts of assets and liabilities and the disclosure of contingent assets and liabilities at the date of the financial statements. These also affect the reported amounts of revenues and expenditures during the reporting period. Actual results could differ from those estimates.

SPECIAL ADMINISTRATIVE BOARD OF THE TRANSITIONAL SCHOOL DISTRICT OF THE CITY OF ST. LOUIS (ST. LOUIS PUBLIC SCHOOLS)
Notes To Basic Financial Statements (Continued)
Page 54
2. Deposits And Investments
A summary of cash and investments as of June 30, 2019 is as follows:
Fair CarryingCost Value Value
Primary Government:Cash (11,520,756)$ (11,520,756)$ (11,520,756)$ Insured cash sweep account 23,522,414 23,522,414 23,522,414 Money market mutual funds 10,547,998 10,547,998 10,547,998 MOSIP liquid series investments
pool 37,566,681 37,566,681 37,566,681 MOSIP term investments 17,520,000 17,520,000 17,520,000 Commercial paper 21,131,400 21,131,400 21,131,400 Federal Home Loan Bank DN 23,366,490 23,443,281 23,443,281 Equity securities (endowment) 1,716,532 4,920,534 4,920,534 US Treasury Bills 33,962,578 34,041,398 34,041,398 US Treasury Notes 25,599,072 25,761,667 25,761,667
183,412,409$ 186,934,617$ 186,934,617$
Cash and investments are presented in the financial statements as follows:
Government-wide:Cash and short-term:
investments 123,826,267$ Investments 41,230,230
Fiduciary fund:Cash and short-term
investment 21,878,120
186,934,617$
Investment Policy
General
The District does not have a formal investment policy. The District’s investment activity is conducted in accordance with Missouri State Statutes and investment guidelines outlined therein. These guidelines apply to the District’s investments that are not held by a trustee in connection with bond indentures or endowments. These guidelines permit the District to invest in obligations of the State of Missouri, obligations of the United States of America, obligations issued or guaranteed by certain agencies of the federal government, certain collateralized repurchase agreements and certificates of deposit, bankers’ acceptances, and commercial paper.

SPECIAL ADMINISTRATIVE BOARD OF THE TRANSITIONAL SCHOOL DISTRICT OF THE CITY OF ST. LOUIS (ST. LOUIS PUBLIC SCHOOLS)
Notes To Basic Financial Statements (Continued)
Page 55
Investment Type And Maturities
State Statutes limit maturities for investments in bankers’ acceptances and commercial paper to not more than 180 days from the date of purchase of which the District is in compliance. All other investments shall mature and become payable not more than five years from the date of purchase. Weighted average maturity limitations should not exceed three years, with the exception of those related to bond indentures, and should be consistent with investment objectives. Because of the inherent difficulties in accurately forecasting cash flow requirements, the District allocates a significant portion of the portfolio in readily available funds such as bank deposits, money market funds or insured cash sweep accounts to ensure that appropriate liquidity is maintained to meet ongoing obligations. Interest Rate Risk
Interest rate risk is the risk that changes in interest rates will adversely affect the fair value of an investment. As a means of ensuring the safety of principal invested, the District’s policy is to diversify investments so as to minimize the potential loss on individual securities. The maturities are structured to meet cash flow needs of the District, thereby avoiding the need to sell securities in the open market prior to maturity. Callable securities are restricted to securities callable at par only. All investments are set to mature within one year as of June 30, 2019. Credit Risk
The following table provides information on the credit ratings associated with the District’s investments in debt securities, excluding obligations of the U.S. government or obligations explicitly guaranteed by the U.S. government, at June 30, 2019.
S&P Moody’s Fair Value
Missouri Direct Deposit Program - Money Market Funds AAAm Aaa 10,547,998$
Commercial paper A-1+ P-1 21,131,400 Missouri Securities Investment Program - Liquid
Series Investment Pool AAAm Unavailable 37,566,681 Insured cash sweep account Unrated Unrated 23,522,414 Missouri Securities Investment Program - Term
Investments AAAf Unavailable 17,520,000 Federal Home Loan Bank DN A-1+ Aaa/Prime1 23,443,281

SPECIAL ADMINISTRATIVE BOARD OF THE TRANSITIONAL SCHOOL DISTRICT OF THE CITY OF ST. LOUIS (ST. LOUIS PUBLIC SCHOOLS)
Notes To Basic Financial Statements (Continued)
Page 56
Concentration Of Credit Risk
State Statutes place no limit on the amount the District may invest in any one issuer with respect to U.S. Treasury Securities and collateralized time and demand deposits. Obligations with agencies of the U.S. Government and government-sponsored enterprises are limited to 60% of the portfolio. Those securities that are collateralized repurchased agreements, commercial paper, and bankers’ acceptances are limited to 50% of the total portfolio. U.S. Government agency callable securities are limited to 30% of the total portfolio. Securities greater than 5% are:
Percent Of TotalInvestments
Missouri Direct Deposit Money Market Funds 5.32%Federal Home Loan Bank DN 11.81%Insured cash sweep account 11.85%Commercial paper 10.65%
Custodial Credit Risk
For investments, custodial credit risk is the risk that in the event of the failure of the counterparty to a transaction, the District will not be able to recover the value of the investments or collateral securities that are in the possession of an outside party. In accordance with State Statutes, the District addresses custodial risk by pre-qualifying institutions with which the District places investments, diversifying the investment portfolio, and maintaining a standard of quality for investments. For deposits, custodial credit risk is the risk that in the event of bank failure, the District’s deposits may not be returned. Protection of the District’s deposits is provided by the Federal Deposit Insurance Corporation, by eligible securities pledged by the financial institution, by surety company bonds or by a single collateral pool established by the financial institution. Fair Value Measurement And Application
The District categorizes its fair value measurements within the fair value hierarchy established by generally accepted accounting principles pursuant to GASB Statement No. 72. The hierarchy is based on the valuation inputs used to measure the fair value of the asset. Level 1 inputs are quoted prices in active markets for identical assets; Level 2 inputs are significant other observable inputs; Level 3 inputs are significant unobservable inputs. The District has the following recurring fair value measurements as of June 30, 2019:
Money market mutual funds of $10,547,998 are valued using market transactions involving identical or similar groups of assets. (Level 2 Inputs)

SPECIAL ADMINISTRATIVE BOARD OF THE TRANSITIONAL SCHOOL DISTRICT OF THE CITY OF ST. LOUIS (ST. LOUIS PUBLIC SCHOOLS)
Notes To Basic Financial Statements (Continued)
Page 57
Federal Home Loan Bank Discount Notes of $23,443,281 are valued using benchmark curves, benchmarking of like securities, sector grouping, and matrix pricing approaches to measuring fair value prices. These approaches consider relevant information generated by market transactions involving identical or similar assets or groups of assets. (Level 2 inputs)
Missouri Securities Investment Program (MOSIP) Term Series Investments of $17,520,000 are measured at net asset value (NAV) per share (or its equivalent). MOSIP Term Series offers investors fixed-term investments with a minimum maturity of 60 days to a maximum maturity of up to 180 days. The investment strategy of MOSIP Term Series is to match the cash flows required to meet investors’ planned redemptions, including the projected dividend, with the cash flows of the portfolio. A penalty applies if the investment is redeemed before maturity. The fair values of the investment have been determined using the NAV per share (or its equivalent) of the investment.
Equity securities of $4,920,534 are valued using quoted market prices. (Level 1 inputs)
US Treasury Bills and US Treasury notes of $34,041,398 and $25,761,667, respectively, are valued through government auctions. (Level 2 inputs)
MOSIP Liquid Series Investment Pool and Commercial Paper are not measured at fair value under GASB Statement No. 72 and 79, but are measured at amortized cost or cost.
3. Property Taxes
Property taxes attach as an enforceable lien on property as of January 1. Taxes are levied on November 1 and payable by December 31. The Collector of Revenue for the City of St. Louis collects the property tax and remits it to the District. As of June 30, 2019, property taxes receivable by the District includes uncollected taxes assessed as of January 1, 2018 or earlier. Delinquent property tax receivables less an allowance for uncollectable taxes totaling $4,783,207 are recognized as revenue in the government-wide financial statements. Only the portion of property taxes receivable that meets the modified-accrual revenue recognition criteria is reported as revenue in the fund financial statements. Assessed values are established by the Board of Equalization of the City of St. Louis at 19% and 32% of the estimated market value of residential real property and commercial/industrial property, respectively. Personal property is assessed at 33.3% of its value. The assessed valuation of the tangible taxable property for purposes of local taxation was $4,201,814,836.

SPECIAL ADMINISTRATIVE BOARD OF THE TRANSITIONAL SCHOOL DISTRICT OF THE CITY OF ST. LOUIS (ST. LOUIS PUBLIC SCHOOLS)
Notes To Basic Financial Statements (Continued)
Page 58
The tax levy per $100 of assessed valuation of tangible taxable property for purposes of local taxation for each of the last two calendar years was as follows:
2018 2017
General fund 4.5160$ 4.4131$ Debt service 0.6211 0.6211
5.1371$ 5.0342$
The receipts of local current property taxes during the fiscal year ended June 30, 2019 aggregated 100% of the current assessed valuation, computed on the basis of the levy as shown above.
4. Capital Assets
Capital asset activity for the year ended June 30, 2019 is as follows:
Additions DeletionsBalance - And And Balance -June 30, Transfers Transfers June 30,
2018 In Out 2019Governmental activities:
Capital assets not being depreciated: Land 24,313,740$ —$ $ — 24,313,740$ Construction in progress 460,521 2,547,370 (2,055,250) 952,641 Impaired assets 12,323,334 — (871,837) 11,451,497
Total capital assets not being depreciated 37,097,595 2,547,370 (2,927,087) 36,717,878
Capital assets being depreciated: Buildings and improvements 759,528,921 2,048,172 — 761,577,093 Movable equipment 15,319,326 668,415 — 15,987,741
Total capital assets being depreciated 774,848,247 2,716,587 — 777,564,834
Less accumulated depreciation for:Buildings and improvements 463,013,844 21,324,466 — 484,338,310 Movable equipment 13,495,068 400,646 — 13,895,714
Total accumulated depreciation 476,508,912 21,725,112 — 498,234,024
Total capital assets being depreciated, net 298,339,335 (19,008,525) — 279,330,810
Governmental activities capital assets, net 335,436,930$ (16,461,155)$ (2,927,087)$ 316,048,688$

SPECIAL ADMINISTRATIVE BOARD OF THE TRANSITIONAL SCHOOL DISTRICT OF THE CITY OF ST. LOUIS (ST. LOUIS PUBLIC SCHOOLS)
Notes To Basic Financial Statements (Continued)
Page 59
As of June 30, 2019, the District has twenty three total impaired school buildings, six of which are currently closed and seventeen that are closed and currently being held for sale under a listing agreement. Two buildings that were impaired during fiscal year 2018, were sold in the current year. There were no new school buildings deemed to be impaired and written down to fair value during 2019. Four of the school buildings that are closed are currently being held for sale under a listing agreement, while two of the school buildings are currently being leased for rent amounts significantly below market value. Fair value for the available-for-sale buildings was determined by reference to the offering prices per the listing agreement, which was less than carrying value. Depreciation expense was charged to functions as follows:
Governmental activities:Instruction 20,346,761$ Building services 1,207,472 School administration 165,992 Food and community services 2,120 Transportation 583 Noninstructional support 308 Instructional support 1,876
Total governmental activities depreciation expense 21,725,112$
5. Long-Term Obligations
Long-term obligations of the District consist of general obligation school building and refunding bonds, claims payable, remediation and personnel related liabilities. During the fiscal year ended June 30, 2019, the following changes occurred in long-term obligations:
Balance - Balance -June 30, June 30, Due Within
2018 Additions Reductions 2019 One YearGovernmental Activities
Compensated absences 1,822,281$ 2,014,415$ 1,865,198$ 1,971,498$ 1,360,333$ Claims payable 10,257,147 3,093,677 3,691,031 9,659,793 3,650,119Remediation liability 742,939 226,082 208,289 760,732 760,732General obligation school building and refunding
bonds, Series 2004, 2007A, 2010A,2010B, 2011A, 2012, 2013A, 2013B, 2016 and 2017 280,799,000 — 21,970,000 258,829,000 23,470,000
293,621,367$ 5,334,174$ 27,734,518$ 29,241,184$
Less: Capital appreciation to maturity on bonds 1,148,403 Add: Unamortized premium on bonds 9,673,169
267,353,766
Total Long-Term Obligations 279,745,789$

SPECIAL ADMINISTRATIVE BOARD OF THE TRANSITIONAL SCHOOL DISTRICT OF THE CITY OF ST. LOUIS (ST. LOUIS PUBLIC SCHOOLS)
Notes To Basic Financial Statements (Continued)
Page 60
General Obligation School Building And Refunding Bonds Obligation Balance - Balance - Due WithinBonds June 30, 2018 Additions Reductions June 30, 2019 One Year
2004 Series 9,210,000$ —$ 9,210,000$ —$ —$ 2007A Series 28,340,000 — 2,750,000 25,590,000 12,090,000 2010A Series 56,644,000 — — 56,644,000 — 2010B Series 25,000,000 — — 25,000,000 — 2011A Series 35,000,000 — — 35,000,000 — 2012 Series 33,150,000 — 1,615,000 31,535,000 1,600,000 2013A Series 7,945,000 — 1,410,000 6,535,000 1,440,000 2013B Series 1,055,000 — — 1,055,000 1,055,000 2016 Series 22,510,000 — 6,960,000 15,550,000 7,260,000 2017 Series 61,945,000 — 25,000 61,920,000 25,000
Total General Obligation School
Building And Refunding Bonds 280,799,000$ —$ 21,970,000$ 258,829,000$ 23,470,000$
During the fiscal year ended June 30, 2018, the District issued $61,945,000 in General Obligation Refunding Bonds (Series 2017), with interest rates ranging from 2% to 4%, to refund $63,355,000 of outstanding General Obligation Refunding Bonds. The refunding includes an advance refunding and a crossover component. The advance refunding applies to Series 2011B General Obligation Bonds maturing at various dates through 2027 and the crossover component applies to the refunding of the Series 2010B General Obligation Bonds maturing at various dates through 2030. Refunding bond proceeds for the crossover refunding of Series 2010B were placed in an escrow account to be liquidated on the crossover refunding date of April 1, 2021 and will be removed from the District’s long-term liabilities at that date. The total cash flow savings to the District attributable to the refunding of these bonds is $3,976,572 with an economic gain or net present value savings of approximately $3,279,229.
During the fiscal year ended June 30, 2016, the District issued $23,535,000 General Obligation Refunding Bonds (Series 2016), with interest rates ranging from 3% to 5% to refund $24,135,000 of outstanding General Obligation Refunding Bonds (Series 2006A and 2009). The bonds are scheduled to mature at various dates through 2021. As a result of the refunding, the District decreased its total debt service requirements by $1,200,763, which resulted in an economic gain of $1,171,867. During the fiscal year ended June 30, 2013, the District issued $35,990,000 General Obligation Refunding Bonds (Series 2012), net of $1,820,610 capital appreciation with interest rates ranging from 2% to 4% to advance refund $33,750,000 of outstanding General Obligation Refunding Bonds (Series 2006A). The bonds are scheduled to mature at various dates through April 2024. As a result of the refunding, the District decreased its total debt service requirements by $2,009,641, which resulted in an economic gain of $1,794,051.

SPECIAL ADMINISTRATIVE BOARD OF THE TRANSITIONAL SCHOOL DISTRICT OF THE CITY OF ST. LOUIS (ST. LOUIS PUBLIC SCHOOLS)
Notes To Basic Financial Statements (Continued)
Page 61
During the fiscal year ended June 30, 2013, the District issued $14,620,000 General Obligation Refunding Bonds (Series 2013A) with interest rates ranging from 2% to 4% to advance refund $15,130,000 of outstanding General Obligation Refunding Bonds (Series 2003A). The bonds are scheduled to mature at various dates through April 2023. As a result of the refunding, the District decreased its total debt service requirements by $2,253,566, which resulted in an economic gain of $2,077,139. During the fiscal year ended June 30, 2013, the District issued $20,210,000 Taxable General Obligation Refunding Bonds (Series 2013B) with interest rates ranging from 1% to 4% to advance refund $20,295,000 of the outstanding General Obligation Refunding Bonds (Series 2004). The bonds are scheduled to mature at various dates through April 2020. As a result of the refunding, the District decreased its total debt service requirements by $791,030, which resulted in an economic gain of $749,199. During the fiscal year ended June 30, 2012, the District issued Qualified Zone Academy Bonds in the amount of $35,000,000 (Series 2011A) with interest rates ranging from 4.6% to 4.75%. The bond proceeds are being used to finance the cost of constructing, renovating, repairing and improving buildings and related facilities in the District. The bonds are scheduled to mature at various dates through April 2029. During the fiscal year ended June 30, 2011, the District issued Qualified School Construction Bonds in the amount of $56,644,000 (Series 2010A) with interest rates ranging from 5.65% to 6.45%. The bond proceeds are being used to finance the cost of constructing, renovating, repairing and improving buildings and related facilities in the District. The bonds are scheduled to mature at various dates through April 2028. During the fiscal year ended June 30, 2011, the District issued Build America Bonds in the amount of $25,000,000 (Series 2010B) with interest rates ranging from 6.55% to 6.6%. The bond proceeds are being used to finance the cost of constructing, renovating, repairing and improving buildings and related facilities in the District. The bonds were scheduled to mature April 2030 but will be refunded at the crossover date of April 1, 2021 with proceeds from the Series 2017 Bonds. During the fiscal year ended June 30, 2007, the District issued General Obligation Refunding Bonds in the amount $28,147,782, net of $467,218 capital appreciation (Series 2007A), with interest rates ranging from 4% to 5% and maturing at various dates through April 2021. The bond proceeds were used to advance refund maturities of various bond issuances. During the fiscal year ended June 30, 2005, the District issued General Obligation Refunding Bonds in the amount $44,115,000 (Series 2004) with interest rates ranging from 2.5% to 5.25%. The bond proceeds were used to advance refund maturities of various bond issuances. A portion of these bonds were advanced refunded in 2013 with the Series 2013B issuance. The remaining bonds matured as scheduled in April 2019.

SPECIAL ADMINISTRATIVE BOARD OF THE TRANSITIONAL SCHOOL DISTRICT OF THE CITY OF ST. LOUIS (ST. LOUIS PUBLIC SCHOOLS)
Notes To Basic Financial Statements (Continued)
Page 62
In prior years, the District has defeased various bond issuances by creating separate irrevocable trust funds. New debt has been issued and the proceeds were used to purchase U.S. government securities that were placed in trust funds. The investments and fixed earnings from the investments are sufficient to fully service the defeased debt until the debt has matured and, therefore, the defeased debt was removed as a liability from the District’s financial statements. As of June 30, 2019, the amount of prior years’ defeased debt outstanding, but removed from the financial statements amounted to $124,525,000. There were no unspent bond proceeds at June 30, 2019. Principal And Interest Requirements To Maturity
Obligations related to the general obligation school building and refunding bonds are payable in varying amounts through 2030. The District receives federal interest subsidies of approximately 91.5% on the Series 2010A Qualified School Construction Bonds, 35% on the Series 2010B Build America Bonds and 97.5% on the Series 2011A Qualified Zone Academy Bonds. These federal subsidies are netted against interest expense. In March 2013, pursuant to the Balanced Budget and Emergency Deficit Control Act of 1985, as amended, the overall interest rate subsidy was reduced by 8.7%. On September 30, 2013, a revision was made amending the interest subsidy reduction by 7.2%. This rate reduction became effective on October 1, 2013. On October 1, 2014, a revision was made amending the interest subsidy reduction by 7.3%. This rate reduction became effective on October 1, 2014. On August 5, 2015, a revision was made amending the interest subsidy reduction by 6.8%. This rate reduction became effective on October 1, 2015. On October 1, 2016, a revision was made amending the interest subsidy reduction by 6.9%. This rate reduction became effective on October 1, 2016. The Internal Revenue Service announced a decrease in the sequestration rate for refundable credit amounts from 6.9% to 6.6% for payments processed after October 1, 2017 and on or before September 30, 2018. In 2019, the Internal Revenue Service announced a decrease in the sequestration rate for refundable credit amounts from 6.6% to 6.2% for payments processed after October 1, 2018 and on or before September 30, 2019.

SPECIAL ADMINISTRATIVE BOARD OF THE TRANSITIONAL SCHOOL DISTRICT OF THE CITY OF ST. LOUIS (ST. LOUIS PUBLIC SCHOOLS)
Notes To Basic Financial Statements (Continued)
Page 63
Annual principal and interest requirements to maturity (including capital appreciation to maturity of $1,148,403 on the general obligation school building and refunding bonds as of June 30, 2019 are as follows:
Year Ending June 30, Principal Interest Total
2020 23,470,000$ 12,652,100$ 36,122,100$ 2021 25,340,000 9,952,900 35,292,900 2022 20,540,000 8,751,300 29,291,300 2023 20,250,000 8,006,600 28,256,600 2024 20,525,000 7,142,600 27,667,600 2025-2029 119,214,000 19,553,450 138,767,450 2030-2034 29,490,000 579,600 30,069,600
258,829,000$ 66,638,550$ 325,467,550$
General Obligation School Building And Refunding Bonds
Remediation Liability
The District has a pollution remediation obligation as a result of the District commencing renovation projects at various SLPS campuses, as identified in the Proposition S Bond Program. Projects include asbestos abatement, lead based paint removal, removal of hazardous chemicals and mold/indoor air quality remediation. Federal law in the form of the Asbestos Hazard Emergency Response Act provides guidance for asbestos abatement projects. Lead based paint removal projects are subject to Missouri statutes RSMo 701.300 through 701.338 and the Code of State Regulations 19 CSR 30-70-630. Hazardous material removal is subject to guidance provided by the US EPA Resource Conservation and Recovery Act. At June 30, 2019, the District had entered into pollution remediation contracts or committed to obligations totaling $760,732 which was accrued as a liability as of June 30, 2019. The District expects that the majority of those projects will be completed in fiscal year 2020. The District utilized actual contract costs to determine an accurate measurement of the District’s pollution remediation liability, which includes all remediation work, that the government expects to perform.

SPECIAL ADMINISTRATIVE BOARD OF THE TRANSITIONAL SCHOOL DISTRICT OF THE CITY OF ST. LOUIS (ST. LOUIS PUBLIC SCHOOLS)
Notes To Basic Financial Statements (Continued)
Page 64
6. Retirement Plan General Information About The Pension Plan
Plan description. Benefit eligible employees of the District are provided with pensions through the Public School Retirement System of the City of St. Louis (the System) - a cost-sharing multiple-employer defined benefit pension plan. The System issues an annual Comprehensive Annual Financial Report (CAFR), a publicly available financial report that can be obtained at www.psrsstl.org.
Benefits provided. The System provides retirement, disability, death and survivor benefits for employees of St. Louis Public Schools, employees of the System, and employees of the Charter Schools located within St. Louis. The specific benefit provisions are set forth in RSMo. Chapters 169.410-.540 and general provisions are set forth in RSMo. Chapters 169.560-.597 and 105.660-.691. The statutes assign responsibility for the administration of the system to an 11-member Board of Trustees. Upon retirement at age 65, or at any age if age plus years of created service equals or exceed 80 (Rule of 80), and after 5 years of service, members receive monthly payments for life of yearly benefits equal to years of credit service multiplied by 2% of average final compensation, but not to exceed 60% of average final compensation for members hired before January 1, 2018. For employees hired on or after January 1, 2018, members receive monthly payments for life of yearly benefits equal to years of credit service multiplied by 1.75% of average final compensation, but not to exceed 60% of average final compensation. Early retirement can occur at age 60 with 5 years of service. The service retirement allowance is reduced five ninths of one percent for each month of commencement prior to age 65 or the age at which the Rule of 80 would have been satisfied had the employee continued working until that age, if earlier. Contributions. Employees in the System are required to contribute 5.0 percent of their annual covered salary and the District is required to contribute a percentage of its employees’ covered compensation as determined annually by an actuarial valuation of the System. Beginning January 1, 2018, the employee contribution percentage shall increase one-half of one percent annually until such time as the percentage equals nine percent. For any member hired for the first time on or after January 1, 2018, a 9.0 percent contribution of covered salary is required. The District’s required contribution rate from July 1, 2018 through December 31, 2018, was 19.10%, and from January 1, 2019 through June 30, 2019 was 17.72%. The District’s contributions for the fiscal year ended June 30, 2019 were $37,458,981 including sick leave conversion of $192,404. These contributions were 100% of the requirement contributions for the current year.
Pension Liabilities, Pension Expense, And Deferred Outflows Of Resources And Deferred Inflows Of Resources Related To Pensions
At June 30, 2019, the District reported a liability of $621,206,680 as its proportionate share of the net pension liability. The net pension liability was measured as of December 31, 2018, and the total pension liability used to calculate the net pension liability was determined by an actuarial valuation as of January 1, 2018.

SPECIAL ADMINISTRATIVE BOARD OF THE TRANSITIONAL SCHOOL DISTRICT OF THE CITY OF ST. LOUIS (ST. LOUIS PUBLIC SCHOOLS)
Notes To Basic Financial Statements (Continued)
Page 65
The District’s proportion of the net pension liability was based on the District’s actual employer’s compensation relative to the actual compensation of all participating employers for the System’s plan year ended December 31, 2018. At December 31, 2018, the District’s portion was 74.05 percent, a decrease from its proportional share of 74.74 percent used to allocate the liability as of December 31, 2017. For the year ended June 30, 2019, the District recognized pension expense of $103,236,167. At June 30, 2019, the District reported deferred outflows of resources related to pensions from the following sources:
Deferred DeferredOutflows Inflows
Of Resources Of Resources
Differences between expected and actual experience 1,222,071$ 15,272,340$ Net difference between projected and actual earnings
on pension plan investments 54,908,895 — Changes in assumptions 154,111,970 — Amount related to change in proportional share — 8,798,651 District contributions subsequent to the
measurement date of December 31, 2018 18,170,867 —
Total 228,413,803$ 24,070,991$
Deferred outflows of resources of $18,170,867 resulting from District contributions subsequent to the measurement date will be recognized as a reduction of the net pension liability in the year ended June 30, 2020. Other amounts reported as deferred outflows of resources and deferred inflows of resources related to pensions will be recognized in pension expense in the District’s fiscal year following the System’s fiscal year as follows:
Year Amount
2020 103,751,320$ 2021 64,208,1432022 2,165,9882023 16,046,494
186,171,945$
Amortization Schedule

SPECIAL ADMINISTRATIVE BOARD OF THE TRANSITIONAL SCHOOL DISTRICT OF THE CITY OF ST. LOUIS (ST. LOUIS PUBLIC SCHOOLS)
Notes To Basic Financial Statements (Continued)
Page 66
Actuarial assumptions. The total pension liability as of the measurement date of December 31, 2018, was determined using the following actuarial assumptions, applied to all periods included in the measurement:
Inflation 2.75 percent, approximate
Salary increases 5.0 percent annually for the first five years and 3.5 percent annually after that, average
Investment rate of return
7.5 percent per year, compounded annually, net after investment expenses and including 2.75% allowance for inflation year
Mortality rates were based on the RP-2014 combined healthy mortality table (rolled back to 2006) for active members, and deferred vested members, projected fully generationally using projection scale MP-2015. RP-2014 combined healthy mortality table (rolled back to 2006) for inactive members receiving benefits adjusted by an additional 10% to account for the higher mortality experienced by the plan, projected fully generationally using projection scale MP-2015. The actuarial assumptions used in the January 1, 2018 valuation were based on the results of actual experience of the System.
The following is the System’s target allocation policy:
Asset Class Policy Allocation
U.S. Equity 22.0%Non-U.S. Equity 19.0%Global Equity 5.0%Fixed Income 21.0%Real Estate 7.0%Private Markets 9.0%Hedge Funds 7.0%Global Asset Allocation 10.0%
Total 100.0%

SPECIAL ADMINISTRATIVE BOARD OF THE TRANSITIONAL SCHOOL DISTRICT OF THE CITY OF ST. LOUIS (ST. LOUIS PUBLIC SCHOOLS)
Notes To Basic Financial Statements (Continued)
Page 67
The long-term expected rate of return is determined by discounting 30 Year Nominal returns with a 3% 30-year US CPI assumption. The capital market assumptions as of December 31, 2018 are as follows:
Long-Term Expected
Asset Class Rate Of Return
U.S. Equity 6.2%Non-U.S. Equity 7.4%Global Equity 6.7%Fixed Income 1.9%Real Estate 4.4%Private Markets 7.6%Hedge Funds 3.9%Global Asset Allocation 3.7%
Discount rate. The discount rate used to measure the total pension liability was 4.78 percent. The projection of cash flows used to determine the discount rate assumed that employee contributions will be made at the current contribution rate and that contributions from employers will be made at required rates, actuarially determined. Based on those assumptions, the pension plan’s fiduciary net position was projected to be insufficient to make all projected future benefit payments of current active and inactive employees. Therefore, benefit payments projected to be made from that point forward are discounted using a high-quality municipal bond interest rate. The blended rate is a single equivalent rate that reflects the investment rate of return of 7.5 percent and the high-quality municipal bond interest rate of 3.64 percent. The blended long-term expected rate of return on pension plan investments was applied to all periods of projected benefit payments to determine the total pension liability. Sensitivity of the District’s proportionate share of the net pension liability to changes in the discount rate. The following presents the District’s proportionate share of the net pension liability calculated using the discount rate of 4.78 percent, as well as what the District’s proportionate share of the net pension liability would be if it were calculated using a discount rate that is 1-percentage-point lower (3.78 percent) or 1-percentage-point higher (5.78 percent) than the current rate:
Current Discount1% Decrease Rate 1% Increase
(3.78%) (4.78%) (5.78%)District's proportionate shareof the net pension liability 769,014,807$ 621,206,680$ 498,480,048$
Sensitivity of the District's proportionate share of the NPL
Pension plan fiduciary net position. Detailed information about the pension plan’s fiduciary net position is available in the separately issued System financial report.

SPECIAL ADMINISTRATIVE BOARD OF THE TRANSITIONAL SCHOOL DISTRICT OF THE CITY OF ST. LOUIS (ST. LOUIS PUBLIC SCHOOLS)
Notes To Basic Financial Statements (Continued)
Page 68
Payables To The Pension Plan
The District did not report any payables to the System for June 30, 2019. 7. Other Postemployment Benefits
Plan Description
The Public School Retirement System of the City of St. Louis (the System) provides other postemployment benefits other than pensions (OPEB) to retirees of the District who meet certain criteria. The District, through the System, provides medical, dental and vision benefits to eligible retirees and their dependents through an agent multiple-employer plan. The Revised Statues Chapter 169.476 of the State of Missouri (the Statutes) assign the authority to establish administer and amend plan provisions to the System’s Board of Trustees. All active employees who retire directly from the District and meet the eligibility criteria may participate. To be eligible under normal retirement the employee must be at least 65 or any age with 80 points (age plus years of service) or if eligible for early retirement an employee must be at least age 60. Dependents are also eligible to receive benefits. Survivor benefits are available but the District does not participate in cost sharing. Retirees who elect to participate must pay the premium in effect for the current plan year or any subsequent year at the premium rates in effect at that time, less contributions made by the District. Since retirees pay only the portion of the premium not paid directly by the District each year, the remaining share of any premium cost to the District is determined on the basis of a blended rate or implicit rate subsidy calculation. At the beginning of each enrollment period, the District defines the total costs of benefits for every coverage level and benefit plan. The District’s maximum contributions consist of $80 per month for medical, $5.95 per month for Dental and $3.15 per month for Vision. A stand-alone financial report is not available regarding the OPEB benefits provided. The District’s annual other postemployment benefit (OPEB) cost (expense) is calculated based on an actuarial valuation prepared in accordance with the parameters of GASB Statement No. 75. No assets are accumulated in a trust that meets the criteria in paragraph 4 of Statement 75. Employees Covered by Benefit Terms. As of June 30, 2019, the following employees were covered by the benefit terms:
Active employees eligible for coverage 3,307 Inactive employees or beneficiaries
currently receiving benefits 3,294
6,601
Net OPEB Liability. The District’s net OPEB liability of $76,207,000 was measured as of June 30, 2019, and was determined by an actuarial valuation as of July 1, 2017.

SPECIAL ADMINISTRATIVE BOARD OF THE TRANSITIONAL SCHOOL DISTRICT OF THE CITY OF ST. LOUIS (ST. LOUIS PUBLIC SCHOOLS)
Notes To Basic Financial Statements (Continued)
Page 69
For the year ended June 30, 2019, the District recognized OPEB expense of $1,570,098. At June 30, 2019, the District reported deferred outflows of resources related OPEB from the following sources:
Deferred DeferredOutflows Inflows
Of Resources Of Resources
Changes in assumptions 1,653,524$ —$
Deferred outflows of resources of $1,653,524 related to OPEB will be recognized in OPEB expense in the District’s fiscal year following the System’s fiscal year as follows:
Year Amount
2020 605,299$ 2021 605,2992022 428,8002023 14,126
1,653,524$
Amortization Schedule
Actuarial Assumptions and Methods. The net OPEB liability in the July 1, 2017 actuarial valuation was determined using the following actuarial assumptions and other inputs, applied to all periods included in the measurement, with certain adjustments made to reflect the discount rate rolled forward to the end of the fiscal year:
Discount Rate 2.79%
Annual Wage Increases 2.75%
Healthcare cost trend rates 7% for 2019, decreasing to an ultimate rate of4.5% for 2029 and later years
Discount Rate. The District’s plan is pay as you go and there is not a trust set up to hold plan assets, therefore the long-term expected rate of return is not a factor in determining the discount rate. The discount rate reflects the yield or index rate for 20-year municipal bonds rate, to the extent that the conditions for use of the long-term expected rate of return are not met. The source of the index rate used for the actuarial valuation is the S&P Municipal Bond 20 Year High Grade Rate Index. Mortality rates were based are from the RP-2014 Combined Health Mortality Tables, which have been scaled back to 2006 using Scale MP-2014 and projected from 2006 using Scale MP-2015.

SPECIAL ADMINISTRATIVE BOARD OF THE TRANSITIONAL SCHOOL DISTRICT OF THE CITY OF ST. LOUIS (ST. LOUIS PUBLIC SCHOOLS)
Notes To Basic Financial Statements (Continued)
Page 70
The actuarial assumptions used in the July 1,2017, valuation were based on the results on 2015 experience study. Changes in the Net OPEB Liability:
Balance at June 30, 2018 73,815,442$
Service cost 3,483,558 Interest cost 2,233,225 Changes in Assumptions 1,426,759 Net benefits paid by employer (4,751,984)
Net Change 2,391,558
Balance at June 30, 2019 76,207,000$
The following changes of assumptions are in accordance with GASB 75:
The discount rate as of the end of the fiscal year changed from 2.98% to 2.79% based on the change in 20-year municipal bond yields.
Sensitivity Results. The following presents the net OPEB liability of the District as of June 30, 2019, as well as what the District’s net OPEB liability would be if it were calculated using a discount rate that is 1-percentage-point lower (1.79%) or 1-percentage-point higher (3.79%) than the current rate:
Current Discount1% Decrease Rate 1% Increase
(1.79%) (2.79%) (3.79%)District's proportionate share of the
net OPEB liability 84,416,525$ 76,207,000$ 69,188,893$

SPECIAL ADMINISTRATIVE BOARD OF THE TRANSITIONAL SCHOOL DISTRICT OF THE CITY OF ST. LOUIS (ST. LOUIS PUBLIC SCHOOLS)
Notes To Basic Financial Statements (Continued)
Page 71
The following presents the net OPEB liability of the District as of June 30, 2019, as well as what the District’s net OPEB liability would be if it were calculated using a health care trend rate that is 1-percentage-point lower or 1-percentage-point higher than the current rate.
The current health care trend rate is 7% decreasing by 0.25% annually to an ultimate rate of 4.5%
The 1% decrease in health care trend rate would be 6% decreasing by 0.5% annually to an ultimate rate of 3.5%
The 1% increase in health care trend rate would be 8% decreasing by 0.5% annually to an ultimate rate of 5.5%
Current Trend1% Decrease Rate 1% Increase
(6.0%) (7.0%) (8.0%)District's proportionate share of the
net OPEB liability 72,663,966$ 76,207,000$ 80,292,452$ Payables to the OPEB Plan
As of June 30, 2019, the District had no payables of outstanding healthcare premiums related to the OPEB.
8. Insurance Programs
The District is exposed to various types of risks of loss, including property and equipment, employee performance, workers’ compensation, athletics, general liabilities and unemployment of which the majority of these risks are covered through the District’s purchase of commercial insurance. The remainder is self-insured.
The District is self-insured with respect to its obligation to provide workers’ compensation and unemployment compensation benefits to its employees. The estimated liability for payment of incurred (both reported and unreported) but unpaid claims relating to these matters are recorded in the government-wide and internal service fund financial statements. The District obtains periodic funding valuations from the claims-servicing companies managing the self-insurance programs and adjusts the charges to the various funds as required to maintain the appropriate level of estimated claims liabilities. Revenue in the internal service fund represents interfund charges as a percentage of payroll to each fund. The District also maintains excess liability insurance coverage for workers’ compensation claims. Settled claims did not exceed commercial coverage for the past three fiscal years. At June 30, 2019, the District’s total estimated liability for payment of incurred (both reported and unreported) but unpaid claims for workers’ compensation and unemployment benefits were $9,422,530 and $237,263, respectively.

SPECIAL ADMINISTRATIVE BOARD OF THE TRANSITIONAL SCHOOL DISTRICT OF THE CITY OF ST. LOUIS (ST. LOUIS PUBLIC SCHOOLS)
Notes To Basic Financial Statements (Continued)
Page 72
Changes in the self-insured claims liabilities at June 30, 2019 and 2018 were as follows:
TotalWorkers’ Self-Insured
Compensation Unemployment Liabilities
Balance - June 30, 2017 7,951,654$ 207,347$ 8,159,001$
Current year claims and changes in estimate 5,658,485 220,890 5,879,375
Claim payments (3,596,997) (184,232) (3,781,229)
Balance - June 30, 2018 10,013,142 244,005 10,257,147
Current year claims and changes in estimate 2,913,034 180,643 3,093,677
Claim payments (3,503,646) (187,385) (3,691,031)
Balance - June 30, 2019 9,422,530$ 237,263$ 9,659,793$
9. Interfund Balances And Transfers
A summary of amounts due to or from individual funds are summarized as follows:
Interfund InterfundDue From/Due To Receivables Payables
Governmental
General 20,822,740$ 6,759,289$ Teachers 6,489,140 — Building 270,149 — Grants — 20,822,740
27,582,029$ 27,582,029$
The amounts due to or from individual funds represent interfund borrowings that arise in the normal course of business and are due to either timing differences or to the elimination of negative pooled cash balances within various funds.

SPECIAL ADMINISTRATIVE BOARD OF THE TRANSITIONAL SCHOOL DISTRICT OF THE CITY OF ST. LOUIS (ST. LOUIS PUBLIC SCHOOLS)
Notes To Basic Financial Statements (Continued)
Page 73
A summary of amounts transferred to or from individual funds are summarized as follows:
Transfers TransfersTransfers In/Transfers Out In Out
General fund 27,566,437$ 134,046,026$ Teachers 104,657,697 — Grants 388,725 255,152 Building Fund 1,718,420 — Permanent — 30,101
134,331,279$ 134,331,279$
The transfers between the General fund to the Building fund were made to cover excess expenditures in the Building fund. The transfers between the General fund to the Teachers fund were made to cover excess expenditures and adjust the Teachers fund balance to zero. The transfers between the General fund to the Grants funds were made to cover disallowed grant expenditures and adjust negative fund balances relating to the Grant fund. The transfers between the Permanent fund and Building fund were made to reclassify activity.
10. Pending Litigation The District is the defendant in various other lawsuits involving personal injury, employee grievances, and a variety of other matters, including being named as a potentially responsible party in relation to an environmental remediation case. Each case is being vigorously contested by the District. The District is uninsured with respect to the major portion of liabilities, which may be incurred as a result of these matters. Neither the District nor its legal counsel is able to make a determination, based on the information available, as to the likelihood of these claims resulting in a material liability for the District. Because of these uncertainties, no provision for this litigation has been made in the accompanying financial statements. However, in the event of an unfavorable outcome in one or more of these matters, the impact could be material to the District’s financial position or operating results.

SPECIAL ADMINISTRATIVE BOARD OF THE TRANSITIONAL SCHOOL DISTRICT OF THE CITY OF ST. LOUIS (ST. LOUIS PUBLIC SCHOOLS)
Notes To Basic Financial Statements (Continued)
Page 74
11. Commitments And Contingencies
Desegregation Agreements
The District has been involved in desegregation litigation since 1972, when the parents of five black students filed a federal lawsuit, Liddell v. Board of Education of St. Louis, alleging schools in their neighborhoods were inferior to ones in white neighborhoods. In 1977, the plaintiffs lost the lawsuit, but a federal court appeals panel overturned the lower court’s decision. The result was a sizeable court-ordered desegregation plan for area schools.
The desegregation plan was originally implemented during the 1980-1981 school years, and a Metropolitan Voluntary Desegregation Settlement Plan involving the Board of Education and 23 county school districts was developed and approved by the Court for implementation in 1983-1984.
A significant result of the desegregation plan was busing, including the busing of some black city students to some county schools and the busing of some non-black county students to city magnet schools, commonly called the St. Louis Student Transfer Program.
In September 1987, the Court approved a $110,306,671 capital renovations project involving 100 school facilities as part of the desegregation litigation; the State of Missouri to pay half and the Board to pay half.
In August 1988, the Court approved a long-range Magnet School Plan. The plan phased out several magnet schools, relocated and expanded others, and created new and additional magnet schools. The plan also created the Unified Funding Formula for all magnet schools. Effective with the 1990-1991 school year, the cost of operating all magnet schools was shared equally by the Board and the State of Missouri.
In its orders, the Court authorized an additional $56,043,801 in capital improvements for the magnet schools, including construction of three new facilities; the State of Missouri to pays 72% of the cost and the Board to pay the balance.
In August 1998, the Missouri Legislature passed Senate Bill 781. The bill was the first step in an attempt to resolve the desegregation litigation. The bill called for:
1) The restructuring of the existing elected Board of Education from 12 members elected city-wide to seven members elected city-wide;
2) A requirement that the City of St. Louis hold a referendum before March 15, 1999, on a tax measure to aid the District with revenues when the desegregation case is settled;
3) The creation of a special “overlay” board to put the tax and other measures on the ballots;
4) The appointment of a three-member governing board if the District fails to receive accreditation from the state in March of 1999; and

SPECIAL ADMINISTRATIVE BOARD OF THE TRANSITIONAL SCHOOL DISTRICT OF THE CITY OF ST. LOUIS (ST. LOUIS PUBLIC SCHOOLS)
Notes To Basic Financial Statements (Continued)
Page 75
5) The possibility of the appointment of a special administrative board to take over the authority granted to the Board of Education for the operation of all or part of the duties.
On Feb. 2, 1999, city voters approved a 2/3rd cent sales tax. On March 12, 1999, the Court approved a settlement agreement relating to the desegregation plan. This ended the courts supervision and monitoring of St. Louis Public Schools. Under the agreement, the District received certain amounts of additional funding for the construction of new schools and-for a specified period of time-to continue various programs, which were required under the desegregation plan. These included remedial education programs, all-day kindergarten, summer school, college prep and preschool programs, and the magnet school program, with some modifications for at least 10 years. The District also agreed to comply with state standards in many areas, such as class size, libraries and counselors, and to establish standards or improvement of student outcomes. There are provisions for school improvement and accountability, giving children in a failing school the right to transfer to a successful school. The state agreed to pay the District $180 million for construction of new schools to accommodate any increase in enrollment due to any decrease in the number of transfer students. All county districts, with the exception of Ladue, agreed to continue to accept new students unless written notice was provided prior to the 2008-2009 school year. To economize on transportation costs, attendance zones were established for transfer students. In the event of any phase-out of the transfer program, all city students then enrolled in county schools had the right to complete high school in the county. In 2003, the District entered into a settlement agreement with Caldwell/NAACP, Liddell Plaintiffs, the U.S. Department of Justice, and the State of Missouri regarding the District’s planned borrowing from the Capital Account (1999 desegregation settlement fund). The agreement, as amended in January of 2005, allowed the District to borrow up to $49.5 million during FY 2004 and to repay these funds over a six-year period, starting in FY 2007. However, the repayment schedule was delayed to 2008 due to the District being designated as “financially stressed” by DESE in 2007. In addition, the District was allowed to continue borrowing from the desegregation funds in future fiscal years, as long as the borrowed funds were repaid by the end of the fiscal year in which they were borrowed.

SPECIAL ADMINISTRATIVE BOARD OF THE TRANSITIONAL SCHOOL DISTRICT OF THE CITY OF ST. LOUIS (ST. LOUIS PUBLIC SCHOOLS)
Notes To Basic Financial Statements (Continued)
Page 76
The amended agreement also stated the District could borrow additional funds prior to June 30, 2006, of up to $10 million for additional expenditures as outlined in the agreement. Approximately $47.1 million was borrowed during the fiscal year ended June 30, 2004. However, the amended agreement allowed the District to use up to $10.6 million from the desegregation funds to fund construction of Clyde C. Miller Career Academy, previously paid for by the District, which reduced the amount borrowed from the desegregation funds pursuant to the agreement to approximately $36.5 million. During FY 2007, the Missouri State Board of Education declared the District as unaccredited. In accordance with the laws of the State of Missouri, the governance of the school district was transferred from the divested board, except for auditing and reporting matters, and placed with the Special Administrative Board of the Transitional School District. The SAB took full control of the operation of the District on June 15, 2007. Also in June 2007, a five-year extension was unanimously approved by the Voluntary Interdistrict Choice Corporation (VICC) Board to continue the St. Louis Student Transfer Program. VICC had been established to operate the transfer program and state funding was provided to operate the continuing voluntary transfer plan. Subsequent state education funding cuts have reduced the funds available to VICC for the maintenance of the transfer program. These same cuts have reduced the state funding available to SLPS below the levels agreed to in the 1999 settlement case. The fund financial statements at June 30, 2011, showed a $54.7 million deficit in the General Operating Fund due to accumulated deficits from previous years. However, the District reached an additional agreement with the Plaintiffs in the desegregation lawsuit to dedicate approximately $95 million from the 1999 desegregation settlement fund that restored the deficit fund balance, including the forgiveness of the $36.5 million in borrowings, the transfer of $18.2 million to eliminate the remainder of the accumulated deficit, and $40,182,200 to fund certain academic programs through FY 2014. On November 16, 2011, the District reached an agreement with the Plaintiffs in the desegregation lawsuit to use approximately $96 million of previously restricted funds, to eliminate the debt and fund certain academic programs. These programs included early childhood classroom education, early childhood before and after care, high-quality principal leadership initiatives, magnet school transportation, the Parent Infant and Initiative Program, the St. Louis Plan, technology support, and the Pilot One-to-One Computing Program. Specifically, up to $16,277,400, $12,777,400 and $11,127,400 could be allocated for fiscal years 2012, 2013 and 2014, respectively. In 2012, the District became a provisionally accredited school district.

SPECIAL ADMINISTRATIVE BOARD OF THE TRANSITIONAL SCHOOL DISTRICT OF THE CITY OF ST. LOUIS (ST. LOUIS PUBLIC SCHOOLS)
Notes To Basic Financial Statements (Continued)
Page 77
In October , 2012, an additional five-year extension was approved for the St. Louis Student Transfer Program. As a result, new students could continue to be enrolled by participating districts through the 2018-2019 school year. In FY 2019-2020, the program stopped accepting any new students, only allowing current students to remain until graduation. In 2031-2032, the program will be terminated. In September 21, 2015, a consent judgment was granted to appropriate $29,636,443 from the settlement fund for additional programs over a four-year period beginning in 2015. These programs include early childhood classrooms, early childhood before and after care, the Parent Infant and Initiative Program, principal leadership initiatives, technology support, the St. Louis Plan, the Deseg Task Force, the extended teacher workday, additional support services, additional reading and math facilitators, and additional community specialists. In January 2017, the District became fully accredited. The remaining unspent funds at June 30, 2018 totaled $4,575,327. The District transferred the unspent funds from the general fund to the Capital Settlement fund during fiscal year 2018. The balance in the Capital Settlement fund at June 30, 2019 is $7,926,189. Construction In Progress
The District has entered into five binding contract obligations totaling approximately $3,059,449 for ongoing construction projects that are currently in progress.
Operating Leases
On July 1, 2013 the District entered into a noncancellable Document Services Agreement to lease equipment. The original lease was for a 12-month period with 4 annual renewal terms. The agreement also includes a variety of services including maintenance, on-site personnel, training and support related to all document reproduction needs of the District. The lease was renewed effective July 1, 2018 with an end date no later than June 30, 2023. The agreed upon renewal amount is $3,872,736. Future minimum lease payments at June 30, 2019 were:
Year Amount
2020 968,184$ 2021 968,184 2022 968,184 2023 968,184
3,872,736$

SPECIAL ADMINISTRATIVE BOARD OF THE TRANSITIONAL SCHOOL DISTRICT OF THE CITY OF ST. LOUIS (ST. LOUIS PUBLIC SCHOOLS)
Notes To Basic Financial Statements (Continued)
Page 78
St. Louis Public Schools has entered into several operating leases for vehicles. These leases will expire on various dates through fiscal year 2022. Future minimum lease payments at June 30, 2019 were:
Year Amount
2020 593,092$ 2021 327,657 2022 38,130
958,879$
Escrow Agreement
During fiscal year 2019, St. Louis Public Schools established an escrow account to replace the Letter of Credit that was previously required relating to workers’ compensation. At June 30, 2019, the escrow account contains a balance of $3,158,095 as required for the Districts Workers’ Compensation activities being self- funded. Federal And State Grants
Revenues received from federal and state governments in the current and prior years are subject to audits by the granting agencies. The District believes that adjustments, which may arise from these audits, if any, will not be significant.
12. Tax Abatements
During 2017, the District implemented the disclosure requirements of GASB Statement No. 77, Tax Abatement Disclosures.
Tax Abatements Entered Into By Other Governments
As of June 30, 2019, the District’s property tax revenues were reduced by five programs that are utilized by the City of St. Louis (the “City”), as follows:
The Urban Redevelopment Corporations Law provides real property tax abatement to encourage the redevelopment of blighted areas throughout the State under Chapter 353 of the Revised Statutes of Missouri, as amended. The amount abated under this program totaled $9,005,308.

SPECIAL ADMINISTRATIVE BOARD OF THE TRANSITIONAL SCHOOL DISTRICT OF THE CITY OF ST. LOUIS (ST. LOUIS PUBLIC SCHOOLS)
Notes To Basic Financial Statements (Continued)
Page 79
Under Section 99.700 to 99.715 of the Revised Statutes of Missouri, as amended, the Land Clearance for Redevelopment Authority (the “Authority”) was created to assist with the redevelopment of blighted or insanitary areas for residential, recreational, commercial, industrial, or public uses. Real property taxes are abated by setting the assessed value when the agreement is entered into, and requiring the payment of tax based on the agreed upon assessed value. The amount abated under this program totaled $9,043,446.
Under Section 135.950 to 135.973 of the Revised Statutes of Missouri, as amended, the Enhanced Enterprise Zone Incentive Program provides real property tax abatements to new or expanding businesses in certain specified geographic areas designated by local governments and certified by the Missouri Department of Economic Development. The amount abated under this program totaled $1,804,703.
The City is authorized to issue Industrial Development Bonds (also referred to as “Chapter 100 Bonds”) under Article VI, Section 27(b) of the Missouri Constitution and Sections 100.010 to 100.200 of the Revised Statutes of Missouri, as amended. The bonds finance industrial development projects for private corporations, partnerships and individuals (“the recipient”). The types of projects that can be financed include the costs of warehouses, distribution facilities, research and development facilities, office industries, agricultural processing industries, service facilities which provide interstate commerce, industrial plants, and facilities for other commercial purposes, including land, buildings, fixtures and machinery. The recipient coveys to the City fee simple title to the site, improvements, and/or equipment related to the industrial development project. At the same time, the City will lease the site, improvements, and/or equipment back to the recipient pursuant to a lease agreement. The lease agreement requires the recipient to use the proceeds of the bonds to purchase and construct the project or equipment. The recipient is obligated to make lease payments in amounts that are sufficient to pay the principal and interest on the bonds as they become due. Thus, the City acts as a conduit for the financing. Because the City has ownership of the project, no real and/or personal property taxes are owed. The amount abated under this program totaled $1,242,793.
Under Missouri’s TIF Act included under Section 99.800 to 99.865 of the Revised Statutes of Missouri, the Tax Incremental Financing (TIF) - Payments in Lieu of Taxes provides real property tax abatements to incentivize entities to improve blighted areas, conservation areas, or to increase and/or preserve economic development. The amount abated under this program totaled $14,679,316.
In total, the amount of City property taxes effecting the District abated by these arrangements during the year ended June 30, 2019 was approximately $35,775,566.

SPECIAL ADMINISTRATIVE BOARD OF THE TRANSITIONAL SCHOOL DISTRICT OF THE CITY OF ST. LOUIS (ST. LOUIS PUBLIC SCHOOLS)
Notes To Basic Financial Statements (Continued)
Page 80
13. St. Louis Public Schools Foundation The following pertains to the District’s discretely presented component unit- the Foundation.
Organization
St. Louis Public Schools Foundation (the “Foundation”) is a nonprofit organization founded in 1998 to fund projects and activities that will have a measurable impact on academic achievement, high school graduation rates, and successful transition to post-secondary goals, such as college or entry into the work force, for students in the St. Louis Public Schools. The Foundation is a discretely presented component unit of the District.
Basis Of Presentation
The accompanying financial statements have been prepared in accordance with the provisions of Financial Accounting Standards Board (“FASB”), Accounting Standards Codification (the “FASB ASC”), which is the source of authoritative, non-governmental accounting principles generally accepted in the United States of America (“GAAP”). All references to authoritative accounting guidance contained in our disclosures are based on the general accounting topics within the FASB ASC. Net assets and revenues, expenses, gains, and losses are classified based on the existence or absence of donor-imposed restrictions. Accordingly, net assets of the Foundation and changes therein are classified into three categories of net assets, as applicable, and reported as follows: Net assets without donor restrictions - Net assets that are not subject to donor-imposed stipulations. Board designated funds are established by the Board of Directors and represent net assets without donor restrictions that have been set aside for future expenses. Net assets with donor restrictions - Net assets subject to donor-imposed stipulations that may be satisfied by specific activities or the passage of time, or are required to be maintained in perpetuity by the Organization. The income earned on any related investments may be subject to donor-imposed stipulations. Investments
A summary of the cost and fair value of the Foundation’s investments as of June 30, 2019 is as follows:
Amortized Unrealized Unrealized FairCost Gains Losses Value
Certificates of deposit 2,951,000$ 4,914$ —$ 2,955,914$

SPECIAL ADMINISTRATIVE BOARD OF THE TRANSITIONAL SCHOOL DISTRICT OF THE CITY OF ST. LOUIS (ST. LOUIS PUBLIC SCHOOLS)
Notes To Basic Financial Statements (Continued)
Page 81
Net Assets With Donor Restrictions
Net assets with donor restrictions are available for the following purposes or periods at June 30, 2019 as follows:
Purpose RestrictionsCollege and career readiness 1,430,503$ Early childhood education 189,813 School leadership 300,001 Health and wellness — School funds 655,437
Total Purpose Restrictions 2,575,754
Time RestrictionsYear ended June 30, 2020 498,137 Year ended June 30, 2021 130,000 Year ended June 30, 2022 5,000
Total Time Restrictions 633,137
Total Temporary Restrictions of Net Assets 3,208,891$
Net assets released from restrictions are as follows:
Satisfaction of purpose restrictions 4,111,188$ Satisfaction of time restrictions 10,000
4,121,188$

Required Supplementary Information

SPECIAL ADMINISTRATIVE BOARD OF THE TRANSITIONAL SCHOOL DISTRICT OF THE CITY OF ST. LOUIS
(ST. LOUIS PUBLIC SCHOOLS)
See the notes to required supplementary information. Page 82
SCHEDULE OF REVENUES, EXPENDITURES AND CHANGES IN FUND BALANCE - BUDGET TO ACTUAL - GENERAL FUND
For The Year Ended June 30, 2019
Variance WithFinal Budget -
Budgeted Amounts Actual PositiveOriginal Final Amounts (Negative)
Revenues
Local:
Current taxes 226,426,301$ 226,426,301$ 231,363,589$ 4,937,288$
Delinquent taxes 8,100,533 8,100,533 7,716,090 (384,443)
Investment income 259,054 259,054 1,828,071 1,569,017
Other 1,621,934 1,621,934 2,200,713 578,779
County 3,377,275 3,377,275 3,069,564 (307,711)
State:
Categorical aid 11,709,331 11,709,331 12,021,251 311,920
Other 1,358,000 1,358,000 1,483,458 125,458
Federal 3,439,063 3,439,063 2,702,691 (736,372)
Total Revenues 256,291,491 256,291,491 262,385,427 6,093,936
Expenditures
Current:
Instruction 20,927,720 19,166,083 18,677,215 488,868
Building service 40,132,923 39,067,788 36,976,019 2,091,769
School administration 18,821,644 18,111,470 18,804,321 (692,851)
Instructional support 23,839,682 26,856,823 21,720,131 5,136,692
Noninstructional support 15,137,704 14,383,184 14,564,635 (181,451)
Transportation 29,965,594 25,969,098 25,547,036 422,062
Food and community services 2,978,988 3,594,249 4,168,542 (574,293)
Total Expenditures 151,804,255 147,148,695 140,457,899 6,690,796
Excess (Deficiency) Of Revenues Over Expenditures 104,487,236 109,142,796 121,927,528 12,784,732
Other Financing Sources (Uses)
Transfers in — — 27,566,437 27,566,437
Transfers out (101,371,172) (109,123,901) (134,046,026) (24,922,125)
Total Other Financing Sources (Uses) (101,371,172) (109,123,901) (106,479,589) 2,644,312
Net Change In Fund Balance 3,116,064$ 18,895$ 15,447,939 15,429,044$
Fund Balances - Beginning Of Year 69,663,482
Fund Balances - End Of Year 85,111,421$

SPECIAL ADMINISTRATIVE BOARD OF THE TRANSITIONAL SCHOOL DISTRICT OF THE CITY OF ST. LOUIS
(ST. LOUIS PUBLIC SCHOOLS)
See the notes to required supplementary information. Page 83
SCHEDULE OF REVENUES, EXPENDITURES AND CHANGES IN FUND BALANCE - BUDGET TO ACTUAL - TEACHERS FUND
For The Year Ended June 30, 2019
Variance WithFinal Budget -
Budgeted Amounts Actual PositiveOriginal Final Amounts (Negative)
RevenuesLocal:
Current taxes 24,950,195$ 24,950,195$ 24,770,006$ (180,189)$ County 220,000 220,000 258,134 38,134 State:
Basic formula 20,713,310 20,713,310 19,483,118 (1,230,192) Federal — — 531,249 531,249
Total Revenues 45,883,505 45,883,505 45,042,507 (840,998)
ExpendituresCurrent:
Instruction 115,201,430 122,036,369 118,287,926 3,748,443 Building service 273,473 273,473 205,287 68,186 School administration 13,220,485 13,244,016 13,443,360 (199,344) Instructional support 12,552,884 12,913,342 11,732,415 1,180,927 Noninstructional support 822,776 819,926 912,160 (92,234) Food and community services 4,117,429 3,545,978 5,119,056 (1,573,078)
Total Expenditures 146,188,477 152,833,104 149,700,204 3,132,900
Excess (Deficiency) Of RevenuesOver Expenditures (100,304,972) (106,949,599) (104,657,697) 2,291,902
Other Financing Sources Transfers in 99,679,972 106,324,599 104,657,697 (1,666,902)
Net Change In Fund Balance (625,000)$ (625,000)$ — 625,000$
Fund Balances - Beginning Of Year — Fund Balances - End Of Year —$
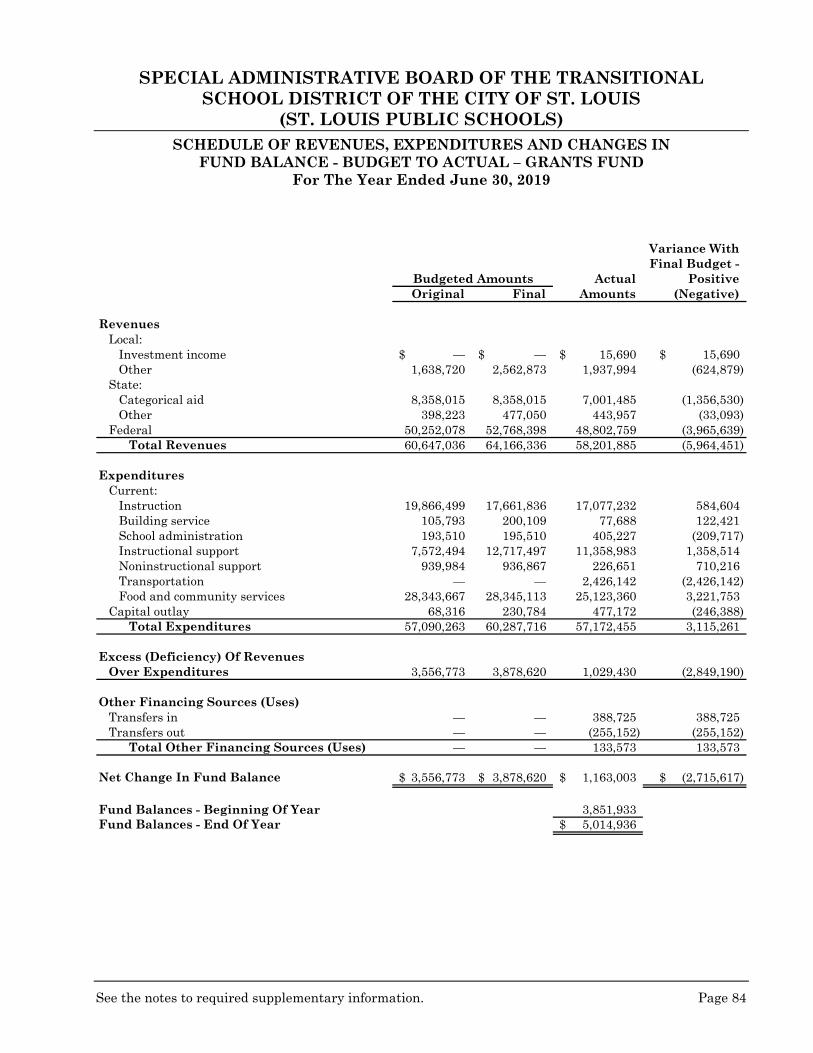
SPECIAL ADMINISTRATIVE BOARD OF THE TRANSITIONAL SCHOOL DISTRICT OF THE CITY OF ST. LOUIS
(ST. LOUIS PUBLIC SCHOOLS)
See the notes to required supplementary information. Page 84
SCHEDULE OF REVENUES, EXPENDITURES AND CHANGES IN FUND BALANCE - BUDGET TO ACTUAL – GRANTS FUND
For The Year Ended June 30, 2019
Variance WithFinal Budget -
Budgeted Amounts Actual PositiveOriginal Final Amounts (Negative)
RevenuesLocal:
Investment income —$ —$ 15,690$ 15,690$ Other 1,638,720 2,562,873 1,937,994 (624,879)
State:Categorical aid 8,358,015 8,358,015 7,001,485 (1,356,530) Other 398,223 477,050 443,957 (33,093)
Federal 50,252,078 52,768,398 48,802,759 (3,965,639) Total Revenues 60,647,036 64,166,336 58,201,885 (5,964,451)
ExpendituresCurrent:
Instruction 19,866,499 17,661,836 17,077,232 584,604 Building service 105,793 200,109 77,688 122,421 School administration 193,510 195,510 405,227 (209,717) Instructional support 7,572,494 12,717,497 11,358,983 1,358,514 Noninstructional support 939,984 936,867 226,651 710,216 Transportation — — 2,426,142 (2,426,142) Food and community services 28,343,667 28,345,113 25,123,360 3,221,753
Capital outlay 68,316 230,784 477,172 (246,388) Total Expenditures 57,090,263 60,287,716 57,172,455 3,115,261
Excess (Deficiency) Of RevenuesOver Expenditures 3,556,773 3,878,620 1,029,430 (2,849,190)
Other Financing Sources (Uses)Transfers in — — 388,725 388,725 Transfers out — — (255,152) (255,152)
Total Other Financing Sources (Uses) — — 133,573 133,573
Net Change In Fund Balance 3,556,773$ 3,878,620$ 1,163,003$ (2,715,617)$
Fund Balances - Beginning Of Year 3,851,933 Fund Balances - End Of Year 5,014,936$

SPECIAL ADMINISTRATIVE BOARD OF THE TRANSITIONAL SCHOOL DISTRICT OF THE CITY OF ST. LOUIS
(ST. LOUIS PUBLIC SCHOOLS)
Page 85
NOTES TO REQUIRED SUPPLEMENTARY INFORMATION June 30, 2019
1. Budgetary Data
The District’s budgetary practices are intended to conform to Chapter 67 of Revised Missouri State Statutes and are prepared on a basis consistent with accounting principles generally accepted in the United States of America. The following procedures are used in establishing the budgetary data reflected in the financial statements.
A. The Administration prepares and submits to the SAB a proposed annual operating
budget for all current governmental funds for the subsequent fiscal year prior to July 1 each year. Certain operating funds called the “General Operating Budget (GOB)” are monitored on a combined basis. The GOB consists of the General, Teachers’, Building, Capital Settlement, and Grants funds.
B. Public budget and tax rate hearings are conducted and the proposed budget is available
for public review at the District offices.
C. Revisions to the annual operating budget subsequent to its formal adoptions are made throughout the fiscal year subject to the following limitations: a. The total amount of appropriations by fund may not be increased without the
approval of the governing body. b. All transfers of appropriations between funds require approval of the governing
body.
D. For management purposes only, budgetary control over appropriations is exercised at the sub-function level for all governmental funds providing significant sources of revenue for the District. However, the legal level of control at which actual expenditures may not exceed budgeted appropriations is established by state statute at the fund level. Budgeted amounts as reflected in the financial statements are as originally adopted and as revised by the SAB.
E. All appropriations lapse at fiscal year end for the general and special revenue -
operating funds. Unencumbered appropriations lapse at fiscal year-end for all other special revenue funds.

SPECIAL ADMINISTRATIVE BOARD OF THE TRANSITIONAL SCHOOL DISTRICT OF THE CITY OF ST. LOUIS
(ST. LOUIS PUBLIC SCHOOLS)
Page 86
SCHEDULE OF SELECTED PENSION INFORMATION
Measurement date 2018 2017 2016 2015 2014
District's proportion of the net pension liability 74.05% 74.74% 76.47% 78.05% 79.13%District's proportionate share of the net pension liability 621,206,680$ 567,306,445$ 317,871,856$ 251,514,787$ 209,748,023$ District's covered payroll 173,914,543 175,741,386 173,412,355 175,851,589 173,926,365 District's proportionate share of net pension liability
as a percentage of its covered payroll 357.19% 322.81% 183.30% 143.03% 120.60%Plan fiduciary net position as a percentage of the total
pension liability 49.41% 54.63% 67.16% 72.94% 77.95%
Schedule of District's Contributions
Fiscal year 2019 2018 2017 2016 2015
Required contribution 37,458,981$ 30,701,207$ 30,220,928$ 31,722,987$ 31,072,850$ Contributions in relation to the required contribution 37,458,981 30,701,207 30,220,928 31,722,987 31,072,850 Districts' covered payroll 180,920,883 178,544,973 183,444,217 180,325,734 183,083,926 Contributions as a percentage of covered payroll 20.70% 17.20% 16.47% 17.59% 16.97%
Notes: Above schedules are intended to show information for 10 years. Additional yearswill be displayed as they become available.
Changes of Benefit Terms Or AssumptionsNone.
As Of December 31: Measurement Date
Fiscal year ending June 30:

SPECIAL ADMINISTRATIVE BOARD OF THE TRANSITIONAL SCHOOL DISTRICT OF THE CITY OF ST. LOUIS
(ST. LOUIS PUBLIC SCHOOLS)
Page 87
SCHEDULE OF SELECTED OTHER POSTEMPLOYMENT BENEFITS INFORMATION
2019 2018
Service cost 3,483,558$ 3,390,849$ Interest cost 2,233,225 2,074,164 Changes in Benefit Terms — 6,484,761 Changes in Assumptions 1,426,759 1,084,204 Net benefits paid by employer (4,751,984) (4,157,774) Net change in total OPEB liability 2,391,558 8,876,204 Total OPEB liability - beginning of year 73,815,442 64,939,238
Total OPEB liability - end of year 76,207,000$ 73,815,442$
Covered payroll 132,939,935 147,334,881
Total OPEB liability as a percentage ofcovered payroll 57.33% 50.10%
Fiscal Year End Fiscal Year EndAs Of June 30, As Of June 30
2019 2018
Required contribution 4,751,984$ 4,157,774$ Less: Contributions in relation to the required contribution 4,751,984 4,157,774
District's covered payroll 132,939,935 147,334,881 Contributions as a percentage of covered payroll 3.57% 2.82%
Notes: Above schedules are intended to show information for 10 years.Additional years will be displayed as they become available.
Changes In AssumptionsThe discount rate as of the end of the fiscal year changed from 2.98% to 2.79% based on the change in 20 year municipal bond yields.
Schedule Of Contributions
Schedule Of District's Of OPEB Liability
Schedule Of Selected Other Postemployment Benefits Information
Measurement DateAs Of June 30,

Supplementary Information
Combining and Individual Fund
Statements and Schedules

SPECIAL ADMINISTRATIVE BOARD OF THE TRANSITIONAL SCHOOL DISTRICT OF THE CITY OF ST. LOUIS
(ST. LOUIS PUBLIC SCHOOLS)
Page 88
SCHEDULE OF REVENUES, EXPENDITURES AND CHANGES IN FUND BALANCE - BUDGET TO ACTUAL - DEBT SERVICE FUND
For The Year Ended June 30, 2019
Original Final PositiveBudget Budget Actual (Negative)
RevenuesLocal:
Current taxes 24,827,921$ 24,827,921$ 25,590,012$ 762,091$ Delinquent taxes 1,214,891 1,214,891 1,115,125 (99,766) Investment income 318,459 318,459 1,448,406 1,129,947
County 480,000 480,000 426,331 (53,669) Total Revenues 26,841,271 26,841,271 28,579,874 1,738,603
ExpendituresDebt service:
Principal retirement 18,146,942 21,970,000 21,970,000 — Interest charges 9,935,027 8,005,371 8,005,371 —
Total Expenditures 28,081,969 29,975,371 29,975,371 —
Excess (Deficiency) Of Revenues OverExpenditures (1,240,698) (3,134,100) (1,395,497) 1,738,603
Net Change In Fund Balance (1,240,698)$ (3,134,100)$ (1,395,497) 1,738,603$
Nonbudgeted Activity (1,210,766)
Net Change in Fund Balances - GAAP Basis (2,606,263)
Fund Balances - Beginning Of Year 50,925,388
Fund Balances - End Of Year 48,319,125$

SPECIAL ADMINISTRATIVE BOARD OF THE TRANSITIONAL SCHOOL DISTRICT OF THE CITY OF ST. LOUIS
(ST. LOUIS PUBLIC SCHOOLS)
Page 89
SCHEDULE OF REVENUES, EXPENDITURES AND CHANGES IN FUND BALANCE - BUDGET TO ACTUAL - BUILDING FUND
For The Year Ended June 30, 2019
Variance WithFinal Budget -
Original Final PositiveBudget Budget Actual (Negative)
RevenuesLocal:
Investment income —$ —$ 8,058$ 8,058$ Other — — 21,250 21,250
Total Revenues — — 29,308 29,308
ExpendituresCurrent:
Capital outlay 1,891,200 2,999,302 2,672,658 326,644 Total Expenditures 1,891,200 2,999,302 2,672,658 326,644
Excess (Deficiency) Of Revenues OverExpenditures (1,891,200) (2,999,302) (2,643,350) 355,952
Other Financing Sources Transfers in 1,691,200 2,799,302 1,718,420 (1,080,882) Proceeds from sale of capital assets — — 906,838 906,838
Total Other Financing Sources 1,691,200 2,799,302 2,625,258 (174,044)
Net Change In Fund Balance (200,000)$ (200,000)$ (18,092) 181,908$
Fund Balances - Beginning Of Year 18,092
Fund Balances - End Of Year —$

SPECIAL ADMINISTRATIVE BOARD OF THE TRANSITIONAL SCHOOL DISTRICT OF THE CITY OF ST. LOUIS
(ST. LOUIS PUBLIC SCHOOLS)
Page 90
SCHEDULE OF REVENUES, EXPENDITURES AND CHANGES IN FUND BALANCE - BUDGET TO ACTUAL
CAPITAL SETTLEMENT FUND For The Year Ended June 30, 2019
Variance WithFinal Budget -
Original Final PositiveBudget Budget Actual (Negative)
RevenuesLocal:
Investment income —$ 4,000$ 3,894$ (106)$
Net Change In Fund Balance —$ 4,000$ 3,894 (106)$
Nonbudgeted Activity —
Net Change In Fund Balances - GAAP Basis 3,894
Fund Balances - Beginning Of Year 7,922,295
Fund Balances - End Of Year 7,926,189$

SPECIAL ADMINISTRATIVE BOARD OF THE TRANSITIONAL SCHOOL DISTRICT OF THE CITY OF ST. LOUIS
(ST. LOUIS PUBLIC SCHOOLS)
Page 91
STATEMENT OF CHANGES IN ASSETS AND LIABILITIES FIDUCIARY FUND - AGENCY FUND
For The Year Ended June 30, 2019
Balance - Balance -July 1, 2018 Additions Deductions June 30, 2019
AssetsCash and short-term investments 26,223,225$ 116,168,381$ 120,513,375$ 21,878,231$
LiabilitiesAccounts payable 542,399$ 575,226$ 542,399$ 575,226$ Deposits and escrow funds 24,964,565 72,276,632 76,456,591 20,784,606 Unexpended grant balances 716,261 — 197,862 518,399
Total Liabilities 26,223,225$ 72,851,858$ 77,196,852$ 21,878,231$

SPECIAL ADMINISTRATIVE BOARD OF THE TRANSITIONAL SCHOOL DISTRICT OF THE CITY OF ST. LOUIS
(ST. LOUIS PUBLIC SCHOOLS)
Page 92
COMBINING BALANCE SHEET GRANT FUNDS
For The Year Ended June 30, 2019
Incidental Certificated Capital
Grants Grants Grants TotalAssets
Cash and short-term investments 13,058,273$ 280,356$ 74,253$ 13,412,882$
Receivables:Grants 10,622,328 11,676,058 86,656 22,385,042 Other 187,291 45,593 3,647 236,531
Prepaid expenses 3,750 — — 3,750
Total Assets 23,871,642$ 12,002,007$ 164,556$ 36,038,205$
Liabilities And Fund BalancesLiabilities:
Accounts payable 2,296,441$ —$ 135,739$ 2,432,180$ Due to other funds 9,059,711 11,734,212 28,817 20,822,740 Unearned revenue 7,500,554 267,795 — 7,768,349
Total Liabilities 18,856,706 12,002,007 164,556 31,023,269
Fund balances:Assigned 5,014,936 — — 5,014,936
Total Liabilities And Fund Balances 23,871,642$ 12,002,007$ 164,556$ 36,038,205$

SPECIAL ADMINISTRATIVE BOARD OF THE TRANSITIONAL SCHOOL DISTRICT OF THE CITY OF ST. LOUIS
(ST. LOUIS PUBLIC SCHOOLS)
Page 93
COMBINING STATEMENT OF REVENUES, EXPENDITURES AND CHANGES IN FUND BALANCE - GRANT FUNDS For The Year Ended June 30, 2019
Incidental Certificated CapitalGrants Grants Grants Total
RevenuesLocal:
Investment income 15,690$ —$ —$ 15,690$ Other 2,338,779 1,465,670 99,272 3,903,721
State:Categorical aid 3,739,433 3,262,052 — 7,001,485 Other 443,957 10,921 — 454,878
Federal 32,387,650 14,078,793 359,668 46,826,111 Total Revenues 38,925,509 18,817,436 458,940 58,201,885
ExpendituresCurrent:
Instruction 8,348,097 8,729,135 — 17,077,232 Building Service 77,688 — — 77,688 School administration 314,996 90,231 — 405,227 Instructional support 4,586,882 6,772,101 — 11,358,983 Noninstructional support 73,110 153,541 — 226,651 Transportation 2,426,142 — — 2,426,142 Food and community services 21,981,760 3,141,600 — 25,123,360
Capital outlay — — 477,172 477,172 Total Expenditures 37,808,675 18,886,608 477,172 57,172,455
Excess (Deficiency) Of Revenues Over Expenditures 1,116,834 (69,172) (18,232) 1,029,430
Other Financing Sources (Uses)Transfers in 297,307 69,172 22,246 388,725 Transfers out (251,138) — (4,014) (255,152)
Total Other Financing Sources (Uses) 46,169 69,172 18,232 133,573
Net Change In Fund Balances 1,163,003 — — 1,163,003
Fund Balance - Beginning Of Year 3,851,933 — — 3,851,933
Fund Balances - End of Year 5,014,936$ —$ —$ 5,014,936$

SPECIAL ADMINISTRATIVE BOARD OF THE TRANSITIONAL SCHOOL DISTRICT OF THE CITY OF ST. LOUIS
(ST. LOUIS PUBLIC SCHOOLS)
Page 94
SCHEDULE OF REVENUES BY SOURCE - ALL GOVERNMENTAL FUNDS Page 1 Of 2
For The Year Ended June 30, 2019
Debt Building Capital Permanent
General Teachers Grants Service Fund Settlement Fund Total
Local:
Current Taxes:
Real property 140,797,555$ —$ —$ 19,325,778$ —$ —$ —$ 160,123,333$
Personal property 34,458,340 — — 4,739,166 — — — 39,197,506
Surplus commissions 1,883,022 — — 260,077 — — — 2,143,099
Merchant and manufacturers 7,702,208 — — 1,059,337 — — — 8,761,545
Financial institution 1,479,115 — — 205,654 — — — 1,684,769
Surcharge 17,376,068 — — — — — — 17,376,068
Sales tax 27,667,281 — — — — — — 27,667,281
Sales tax-Prop C — 24,770,006 — — — — — 24,770,006
Delinquent taxes 7,716,090 — — 1,115,125 — — — 8,831,215
Investment income (loss) 1,770,380 — 15,690 1,440,583 8,058 3,894 (168,011) 3,070,594
Other:
Interest and protested taxes 57,691 — — 7,823 — — — 65,514
Tuition — — 302,056 — — — — 302,056
School Lunch Program — — 154,871 — — — — 154,871
School Lunch Nonprogram — — 200,484 — — — — 200,484
Indirect costs recovered 673,842 — — — — — — 673,842
Sundry 1,526,871 — 1,280,583 — 21,250 — (2,723) 2,825,981
Total local 243,108,463 24,770,006 1,953,684 28,153,543 29,308 3,894 (170,734) 297,848,164
County:
Fines and forfeitures — 258,134 — — — — — 258,134
Utility and railroad taxes 3,069,564 — — 426,331 — — — 3,495,895
Total county 3,069,564 258,134 — 426,331 — — — 3,754,029
(Continued)
Special Revenue

SPECIAL ADMINISTRATIVE BOARD OF THE TRANSITIONAL SCHOOL DISTRICT OF THE CITY OF ST. LOUIS
(ST. LOUIS PUBLIC SCHOOLS)
Page 95
SCHEDULE OF REVENUES BY SOURCE - ALL GOVERNMENTAL FUNDS Page 2 Of 2
For The Year Ended June 30, 2019
Debt Building Capital Permanent
General Teachers Grants Service Fund Settlement Fund TotalState:
Basic formula —$ 19,483,118$ —$ —$ —$ —$ —$ 19,483,118$ Categorical aid:
Transportation 4,178,138 — — — — — — 4,178,138 Exceptional pupil — — 6,523,496 — — — — 6,523,496 Free and reduced 7,823,622 — — — — — — 7,823,622 Vocational aid 19,491 — 372,220 — — — — 391,711 School lunch program — — 105,769 — — — — 105,769 Other 1,483,458 — 443,957 — — — — 1,927,415
Total state 13,504,709 19,483,118 7,445,442 — — — — 40,433,269
Federal:State administered:
ECIA - Chapter 1 — — 18,522,569 — — — — 18,522,569 Education of the Handicapped Act
(Public Law 94-142) — — 6,786,593 — — — — 6,786,593 National School Breakfast/
Lunch Program — — 15,547,110 — — — — 15,547,110 Local and direct grants:
Other 2,702,691 531,249 7,946,487 — — — — 11,180,427 Total federal 2,702,691 531,249 48,802,759 — — — — 52,036,699
Total Revenues 262,385,427$ 45,042,507$ 58,201,885$ 28,579,874$ 29,308$ 3,894$ (170,734)$ 394,072,161$
Special Revenue

Part III - Statistical Section (Unaudited)
This part of the District’s comprehensive annual financial report presents detailed information as a context for understanding what the information in the financial statements, note disclosures, and required supplementary information says about the District’s overall financial health. Contents Page Financial Trends 96 -102 These seven (7) schedules contain trend information to help the reader understand how the District’s financial performance and well-being have changed over time. Revenue Capacity 103 - 107 These four (4) schedules contain information to help the reader assess the factors affecting the District’s current largest own source revenue. Debt Capacity 108 - 110 These three (3) schedules present information to help the reader assess the affordability of the District’s current levels of outstanding debt and the City’s ability to issue additional debt in the future. Demographic And Economic Information 111 - 112 These two (2) schedules offer demographic and economic indicators to help the reader understand the environment within which the District’s financial activities take place and to help make comparisons over time and with over governments. Operating Information 113 - 115 These four (4) schedules contain information about the District’s operations and resources to help the reader understand how the District’s financial information relates to the services the District provides and the activities it performs.

SPECIAL ADMINISTRATIVE BOARD OF THE TRANSITIONAL SCHOOL DISTRICT OF THE CITY OF ST. LOUIS
(ST. LOUIS PUBLIC SCHOOLS)
Page 96
NET POSITION BY COMPONENT LAST TEN FISCAL YEARS
2010 2011 2012 2013 2014 2015 2016 2017 2018 2019Governmental Activities Net Investment in Capital Assets 220,741,507$ 198,696,409$ 183,591,491$ 161,497,960$ 147,191,285$ 143,933,444$ 136,820,383$ 127,830,747$ 49,501,256$ 78,184,903$ Restricted: Expendable: Capital Projects 119,455,742 122,361,425 60,638,297 36,843,180 38,561,927 26,549,995 5,783,606 5,112,508 5,330,440 4,568,190 Debt Service 28,138,082 32,191,615 32,435,384 34,808,230 31,194,471 29,473,576 28,193,248 25,494,954 50,843,935 48,216,804 Desegregation Settlement Programs — — — 10,961,282 — 1,623,447 16,982,956 11,094,358 7,396,442 7,926,189 Endowments, Nonexpendable 352,344 352,344 352,344 352,344 352,344 352,344 352,344 352,344 352,344 352,344 Workers Compensation Escrow — — — — — — — — — 3,158,095 Unrestricted (66,217,293) (53,164,655) 14,633,602 20,679,302 21,863,913 (143,300,568) (150,456,733) (147,073,568) (299,613,898) (413,753,071)
Total Primary Government Net Position 302,470,382$ 300,437,138$ 291,651,118$ 265,142,298$ 239,163,940$ 58,632,238$ 37,675,804$ 22,811,343$ (186,189,481)$ (271,346,546)$
(1) GASB 68, Pension Liability was implemented in 2015. GASB 75, Other Post Employee Benefits was implemented in 2018.
Source: St. Louis Public School Financial Statements

SPECIAL ADMINISTRATIVE BOARD OF THE TRANSITIONAL SCHOOL DISTRICT OF THE CITY OF ST. LOUIS
(ST. LOUIS PUBLIC SCHOOLS)
Page 97
EXPENSES, PROGRAM REVENUES AND NET EXPENSE (REVENUE) LAST TEN FISCAL YEARS
2010 2011 2012 2013 2014 2015 2016 2017 2018 2019
ExpensesGovernmental Activities: Instruction 224,146,573$ 212,515,070$ 207,895,286$ 213,811,656$ 204,035,308$ 199,844,051$ 201,529,250$ 220,835,851$ 308,364,412$ 279,226,947$ Building Services 61,923,729 45,437,217 35,400,040 49,988,321 42,441,240 39,799,722 44,823,673 42,131,729 41,960,940 38,349,233 School Administration 41,716,823 29,993,491 32,715,917 34,305,350 40,387,519 33,504,175 39,618,463 34,081,716 35,318,133 32,968,117 Instructional Support 34,492,445 36,067,256 35,509,506 36,045,545 42,964,336 34,152,869 32,044,884 29,243,134 31,656,733 42,088,514 Noninstructional Support 26,292,783 13,009,401 15,407,490 29,100,933 22,177,539 19,351,585 16,794,147 16,391,456 16,318,304 15,703,754 Transportation 29,496,425 22,822,432 22,203,156 22,719,483 22,857,795 24,981,686 24,409,439 25,264,106 27,006,959 27,973,761 Food and Community Services 20,208,582 19,324,339 19,750,891 21,599,028 22,842,317 36,185,288 37,320,604 34,524,224 34,805,444 34,413,078 Interest Expense 11,583,276 11,060,829 12,683,830 11,448,067 10,700,832 10,177,771 9,191,546 9,126,528 6,652,399 7,910,358 Bond Issuance Costs — — — — — — — — 552,209 — Total Primary Government Expenses 449,860,636 390,230,035 381,566,116 419,018,383 408,406,886 397,997,147 405,732,006 411,598,744 502,635,533 478,633,762
Program RevenuesGovernmental Activities: Charges For Services: Instruction — — — 24,098 — — 390,527 1,986 1,811 122 School Administration — — — — — — — — — 2 Noninstructional Support — — — — — — — — — 13,741 Transportation — — — — — — 789 — 1,827 — Food and Community Services 1,872,758 1,459,337 1,460,577 929,995 714,313 577,878 242,462 667,014 600,579 456,803 Total Charges For Services 1,872,758 1,459,337 1,460,577 954,093 714,313 577,878 633,778 669,000 604,217 470,668 Operating Grants and Contributions: Instruction 59,988,926 58,794,013 51,766,739 51,589,365 47,619,764 44,625,982 38,349,087 39,093,105 33,084,489 26,822,055 Building Services 16,180 189,615 1,160,971 219,281 213,410 541,656 515,247 305,847 275,881 132,640 School Administration 5,742,176 5,345,111 4,519,472 2,916,395 4,567,848 565,258 3,538,266 398,456 512,883 613,006 Instructional Support 16,333,786 16,919,388 16,514,157 13,995,306 15,746,577 11,497,210 10,148,405 8,787,182 11,926,841 14,532,700 Noninstructional Support 1,246,508 3,951,776 1,037,419 419,381 579,894 1,420,093 3,727,693 2,301,576 1,591,483 631,013 Transportation 7,362,660 5,785,437 5,014,063 5,168,502 5,287,367 8,024,136 7,266,111 6,401,350 6,697,334 7,271,292 Food and Community Services 17,101,032 16,154,035 17,182,516 18,737,822 22,056,457 28,590,992 28,480,856 26,797,423 25,852,350 25,162,971 Total Operating Grants and Contributions 107,791,268 107,139,375 97,195,337 93,046,052 96,071,317 95,265,328 92,025,665 84,084,939 79,941,261 75,165,677 Capital Grants and Contributions Instruction 9,273,710 921,159 641,933 926,359 402,309 3,732,745 4,844,474 1,836,885 637,738 465,509
Total Primary Government Program Revenue 118,937,736 109,519,871 99,297,847 94,926,504 97,187,939 99,575,951 97,503,917 86,590,824 81,183,216 76,101,854
Total Primary Government Net Expense (330,922,900)$ (280,710,164)$ (282,268,269)$ (324,091,879)$ (311,218,947)$ (298,421,196)$ (308,228,089)$ (325,007,920)$ (421,452,317)$ (402,531,908)$
Source: St. Louis Public School Financial Statements

SPECIAL ADMINISTRATIVE BOARD OF THE TRANSITIONAL SCHOOL DISTRICT OF THE CITY OF ST. LOUIS
(ST. LOUIS PUBLIC SCHOOLS)
Page 98
GENERAL REVENUES AND TOTAL CHANGES IN NET POSITION LAST TEN FISCAL YEARS
2010 2011 2012 2013 2014 2015 2016 2017 2018 2019
Net (Expense)/RevenueTotal Primary Government Net Expense (330,922,900)$ (280,710,164)$ (282,268,269)$ (324,091,879)$ (311,218,947)$ (298,421,196)$ (308,228,089)$ (325,007,920)$ (421,452,317)$ (402,531,908)$
General Revenues and Other Changes in Net PositionGovernmental Activities: Taxes Property Taxes Levied For:
General Purposes 154,526,449 158,349,365 160,442,394 173,134,850 164,645,342 166,184,530 166,764,750 197,535,701 206,058,944 210,814,732 Debt Service 26,375,224 26,418,051 24,681,140 25,891,679 24,857,383 24,885,346 24,953,995 24,969,815 26,456,466 26,709,302
Sales Taxes 44,330,464 45,676,880 44,853,111 44,471,936 50,635,946 52,211,429 53,169,188 52,027,178 53,164,510 52,437,286 Unrestricted Federal and State Aid 61,255,667 39,900,358 38,109,006 47,513,223 40,662,390 42,788,585 39,645,537 35,332,610 29,796,963 19,288,287 Earnings on Investments 831,077 2,118,690 855,231 717,535 981,363 (722,376) 1,089,267 22,520 1,612,777 3,183,472 Other Revenues 6,146,928 5,869,172 4,541,367 5,853,836 5,674,276 7,087,868 3,896,134 5,195,158 5,258,512 4,941,764 Total Primary Government 293,465,809 278,332,516 273,482,249 297,583,059 287,456,700 292,435,382 289,518,871 315,082,982 322,348,172 317,374,843
Change in Net Position (37,457,091) (2,377,648) (8,786,020) (26,508,820) (23,762,247) (5,985,814) (18,709,218) (9,924,938) (99,104,145) (85,157,065) Prior Period Adjustments (1,677,588) 1,906,302 — — — — (2,247,216) (4,939,523) (109,896,679) (186,189,481)
Change In Net Position - Primary Government (39,134,679)$ (471,346)$ (8,786,020)$ (26,508,820)$ (23,762,247)$ (5,985,814)$ (20,956,434)$ (14,864,461)$ (209,000,824)$ (271,346,546)$
Source: St. Louis Public School Financial Statements

SPECIAL ADMINISTRATIVE BOARD OF THE TRANSITIONAL SCHOOL DISTRICT OF THE CITY OF ST. LOUIS
(ST. LOUIS PUBLIC SCHOOLS)
Page 99
FUND BALANCES AND GOVERNMENTAL FUNDS LAST TEN FISCAL YEARS
2010 2011 2012 2013 2014 2015 2016 2017 2018 2019
General Fund Reserved 131,985$ —$ —$ —$ —$ —$ —$ —$ —$ —$ Unreserved (65,697,010) — — — — — — — — — Nonspendable — 139,025 312,484 365,599 407,948 852,735 438,461 — — — Restricted — — 8,589,574 10,961,282 — 1,623,447 3,679,872 4,299,859 — — Unassigned — (54,661,562) 3,278,736 17,905,297 25,063,678 18,418,132 19,170,299 49,235,017 69,663,482 85,111,421
Total General Fund (65,565,025)$ (54,522,537)$ 12,180,794$ 29,232,178$ 25,471,626$ 20,894,314$ 23,288,632$ 53,534,876$ 69,663,482$ 85,111,421$
All Other Governmental Funds Reserved 67,565,297$ —$ —$ —$ —$ —$ —$ —$ —$ —$ Unreserved, reported in: Capital Projects Funds 94,025,010 — — — — — — — — — Special Revenue Funds 1,113,996 — — — — — — — — — Nonspendable — 36,858,401 352,344 352,344 352,344 352,344 352,344 352,344 352,344 352,344
Restricted — 190,490,702 202,463,450 125,755,029 86,226,151 59,225,438 47,391,540 37,555,233 63,652,270 60,813,504 Unassigned — — — — — — — — 18,092 — Assigned — 926,175 814,209 1,966,068 3,766,708 5,367,214 2,658,516 2,639,221 3,851,933 5,014,936
Total All Other Governmental Funds 162,704,303$ 228,275,278$ 203,630,003$ 128,073,441$ 90,345,203$ 64,944,996$ 50,402,400$ 40,546,798$ 67,874,639$ 66,180,784$
Source: St. Louis Public School Financial StatementsNote: Effective July 1, 2010, the District adopted GASBStatement No. 54, Fund Balance Reporting and GovernmentalFund Type Definitions.

SPECIAL ADMINISTRATIVE BOARD OF THE TRANSITIONAL SCHOOL DISTRICT OF THE CITY OF ST. LOUIS
(ST. LOUIS PUBLIC SCHOOLS)
Page 100
GOVERNMENTAL FUNDS REVENUES LAST TEN FISCAL YEARS
2010 2011 2012 2013 2014 2015 2016 2017 2018 2019
Federal Sources: Federal Grants 98,466,970$ 91,011,064$ 72,495,756$ 69,914,888$ 66,754,939$ 68,382,240$ 64,955,725$ 58,943,809$ 54,418,338$ 52,036,699$
State Sources: Basic Formula 44,468,613 33,331,874 38,493,945 47,993,155 41,073,121 43,220,793 40,045,997 35,689,505 30,097,942 19,483,118 Categorical Aid 21,066,501 18,820,621 20,019,444 18,735,282 21,634,247 20,816,533 19,172,451 18,259,168 19,760,854 19,022,736 Other 10,817,354 1,085,653 590,119 1,770,065 3,361,239 3,693,977 4,025,501 2,416,639 2,010,393 1,927,415 Total State Sources 76,352,468 53,238,148 59,103,508 68,498,502 66,068,607 67,731,303 63,243,949 56,365,312 51,869,189 40,433,269
Local Sources: Current Taxes 215,246,084 222,118,852 218,417,488 232,685,796 230,247,415 233,221,227 236,080,339 264,690,012 275,268,922 281,723,607 Delinquent Taxes 11,106,895 10,745,965 7,584,647 12,291,375 10,593,578 10,597,830 9,449,872 9,302,750 9,483,489 8,831,215 Investment Income (Loss) 623,239 2,110,230 855,231 717,324 981,363 (722,376) 1,089,266 22,521 1,612,778 3,136,108 Other 8,509,612 7,674,155 7,569,998 7,398,999 6,882,512 9,443,264 8,607,935 7,791,694 5,953,500 4,157,234 Total Local Sources 235,485,830 242,649,202 234,427,364 253,093,494 248,704,868 252,539,945 255,227,412 281,806,977 292,318,689 297,848,164
County Sources 3,301,623 3,501,022 3,761,731 3,816,264 3,818,547 3,934,366 4,187,338 4,020,601 3,947,664 3,754,029
Total Revenues 413,606,891$ 390,399,436$ 369,788,359$ 395,323,148$ 385,346,961$ 392,587,854$ 387,614,424$ 401,136,699$ 402,553,880$ 394,072,161$
Source: St. Louis Public School Financial Statements

SPECIAL ADMINISTRATIVE BOARD OF THE TRANSITIONAL SCHOOL DISTRICT OF THE CITY OF ST. LOUIS
(ST. LOUIS PUBLIC SCHOOLS)
Page 101
GOVERNMENTAL FUNDS EXPENDITURES AND DEBT SERVICE RATIO LAST TEN FISCAL YEARS
2010 2011 2012 2013 2014 2015 2016 2017 2018 2019
Instruction 208,547,473$ 198,025,082$ 190,869,698$ 196,091,503$ 184,367,041$ 184,337,765$ 171,860,832$ 167,562,215$ 170,260,895$ 154,073,921$ Building Service 45,469,575 43,924,937 52,054,542 54,738,848 35,711,266 35,120,425 37,290,219 37,955,593 39,127,233 37,258,994 School Administration 40,272,984 30,648,641 32,915,195 34,510,541 33,875,490 39,097,293 39,596,739 33,630,536 35,201,604 32,652,908 Instructional Support 36,452,206 35,843,736 34,202,964 35,476,531 38,097,954 33,756,468 32,299,389 32,729,579 33,144,821 44,811,529 Noninstructional Support 19,248,981 17,196,329 19,975,616 20,921,691 24,771,470 21,959,258 19,401,899 16,366,203 16,317,940 15,703,446 Transportation 29,119,856 22,730,117 22,132,643 22,644,514 22,856,679 24,981,196 24,409,099 25,214,974 27,006,271 27,973,178 Food and Community Services 20,162,449 19,295,949 19,732,371 21,580,355 22,824,630 36,167,484 37,302,947 34,475,107 34,803,178 34,410,958 Capital Outlay 6,576,531 5,487,694 5,567,318 41,449,414 37,596,787 19,891,584 10,850,229 5,042,998 1,230,248 3,153,844 Debt Service: Principal Retirement 14,541,805 13,752,000 14,245,000 15,925,000 16,735,000 17,685,000 18,640,000 19,640,000 20,670,000 21,970,000 Interest Charges 9,912,027 9,843,329 11,118,858 9,631,735 9,999,434 9,568,896 8,584,241 8,801,028 7,413,782 9,216,137 Bond Issuance Costs — 588,461 646,566 661,336 — — 261,861 — 552,209 — Payments to Escrow Agent 4,878,622 — — — — — — — — —
Total Expenditures 435,182,509$ 397,336,275$ 403,460,771$ 453,631,468$ 426,835,751$ 422,565,369$ 400,497,455$ 381,418,233$ 385,728,181$ 381,224,915$
Debt Service as a percentage ofnoncapital expenditures 5.7% 6.0% 6.8% 6.6% 7.4% 7.3% 7.5% 8.2% 7.3% 8.3%
Note: Capital outlay is stated on a fund basisand is not included in the percentage above.
Source: St. Louis Public School Financial Statements

SPECIAL ADMINISTRATIVE BOARD OF THE TRANSITIONAL SCHOOL DISTRICT OF THE CITY OF ST. LOUIS
(ST. LOUIS PUBLIC SCHOOLS)
Page 102
OTHER FINANCING SOURCES AND USES AND NET CHANGE IN FUND BALANCE LAST TEN FISCAL YEARS
2010 2011 2012 2013 2014 2015 2016 2017 2018 2019
Excess of revenues over/(under) expenditures (21,575,618)$ (6,936,839)$ (33,672,412)$ (58,308,320)$ (41,488,790)$ (29,977,515)$ (12,883,031)$ 19,718,466$ 16,825,699$ 12,847,246$
Other Financing Sources (Uses)Transfers in 79,109,989 85,958,357 155,948,464 112,739,619 125,283,079 116,802,067 95,560,645 103,919,952 116,368,443 134,331,279 Transfers out (79,109,989) (85,958,357) (155,948,464) (112,739,619) (125,283,079) (116,802,067) (95,560,645) (103,919,952) (116,368,443) (134,331,279) Proceeds from G.O. bonds — 81,644,000 79,455,000 — — — — — — — Payment to refunding escrow agent — — (6,263,382) (77,296,756) — — (26,603,386) — (41,605,260) — Premium on issuance of bonds — — 2,538,850 8,520,206 — — 3,335,053 — 6,241,008 — Proceeds from sale of capital assets — — — — — — 2,715,302 672,176 50,000 906,838 Proceeds from refunding bonds — — — 68,579,695 — — 23,535,000 — 61,945,000 —
Total other financing sources (uses) — 81,644,000 75,730,468 (196,855) — — 2,981,969 672,176 26,630,748 906,838
Net change in fund balance (21,575,618) 74,707,161 42,058,056 (58,505,175) (41,488,790) (29,977,515) (9,901,062) 20,390,642 43,456,447 13,754,084 Prior period adjustment 1,906,302 — — — — (2,247,216) — — —
Adjusted net change in fund balance (21,575,618)$ 76,613,463$ 42,058,056$ (58,505,175)$ (41,488,790)$ (29,977,515)$ (12,148,278)$ 20,390,642$ 43,456,447$ 13,754,084$
Source: St. Louis Public School Financial Statements

SPECIAL ADMINISTRATIVE BOARD OF THE TRANSITIONAL SCHOOL DISTRICT OF THE CITY OF ST. LOUIS
(ST. LOUIS PUBLIC SCHOOLS)
Page 103
ASSESSED VALUE AND ACTUAL VALUE OF TAXABLE PROPERTY LAST TEN FISCAL YEARS
Actual ValueTotal Total Total
Assessed Residential Personal Commercial Residential Personal Commercial Taxable DirectFiscal Year Value Property Property Property Real Property Property Property Value Rate (1)
2010 4,321,388,787$ 1,881,067,537$ 1,026,644,586$ 1,413,676,664$ 9,900,355,458$ 3,083,016,775$ 4,417,739,575$ 17,401,111,808$ 3.89432011 4,397,270,564 1,905,846,272 1,114,232,738 1,377,191,554 10,030,769,852 3,346,044,258 4,303,723,606 17,680,537,717 3.98652012 4,144,977,723 1,810,633,349 970,466,714 1,363,877,660 9,529,649,205 2,914,314,456 4,262,117,688 16,706,081,349 4.17432013 4,160,066,572 1,822,903,401 995,775,569 1,341,387,602 9,594,228,426 2,990,317,024 4,191,836,256 16,776,381,706 4.40712014 3,937,987,680 1,624,126,504 991,700,945 1,322,160,231 8,548,034,232 2,978,080,916 4,131,750,722 15,657,865,869 4.37112015 4,210,986,731 1,739,382,743 1,046,951,987 1,424,652,001 9,154,646,016 3,143,999,961 4,452,037,503 16,750,683,480 4.37112016 4,273,669,654 1,787,916,221 1,059,205,663 1,426,547,770 9,410,085,374 3,180,797,787 4,457,961,781 17,048,844,942 4.37112017 4,224,304,398 1,822,475,706 960,556,059 1,441,272,633 9,591,977,400 2,884,552,730 4,503,976,978 16,980,507,108 5.12112018 4,187,363,318 1,917,548,275 971,439,569 1,298,375,474 10,092,359,342 2,917,235,943 4,057,423,356 17,067,018,641 5.03422019 4,201,814,836 1,951,491,520 979,987,678 1,270,335,638 10,271,008,000 2,942,905,940 3,969,798,869 17,183,712,809 5.1371
(1) Per $100 assessed valuation
Source: Assessor's Office - City of St. Louis

SPECIAL ADMINISTRATIVE BOARD OF THE TRANSITIONAL SCHOOL DISTRICT OF THE CITY OF ST. LOUIS
(ST. LOUIS PUBLIC SCHOOLS)
Page 104
DIRECT AND OVERLAPPING PROPERTY TAX RATES LAST TEN FISCAL YEARS
Overlapping Rates
State St. Louis Sheltered St. Louis Comm. Comm. Senior Zoo and
Fiscal General Capital Debt Blind Community Workshop Public Mental Child Serv Services Museum City of
Year Purposes Purposes Purposes Total Person College MSD Dist. Library Health Fund Fund District St. Louis
2010 3.2732 0.000 0.6211 $3.8943 0.0300 0.2136 0.0000 0.1346 0.5019 0.0800 0.1827 0.0000 0.2493 1.3601
2011 3.3654 0.000 0.6211 $3.9865 0.0300 0.2179 0.0790 0.1372 0.5208 0.0823 0.1880 0.0000 0.2546 1.4224
2012 3.5532 0.000 0.6211 $4.1743 0.0300 0.2200 0.0818 0.1445 0.5435 0.0867 0.1900 0.0000 0.2671 1.4691
2013 3.7860 0.000 0.6211 $4.4071 0.0300 0.2200 0.0821 0.1460 0.5814 0.0876 0.1900 0.0000 0.2684 1.4848
2014 3.7500 0.000 0.6211 $4.3711 0.0300 0.2200 0.0874 0.1500 0.5600 0.0900 0.1900 0.0000 0.2797 1.6092
2015 3.7500 0.000 0.6211 $4.3711 0.0300 0.2200 0.0879 0.1500 0.5600 0.0900 0.1900 0.0000 0.2797 1.6063
2016 3.7500 0.000 0.6211 $4.3711 0.0300 0.2176 0.0876 0.1500 0.5600 0.0900 0.1900 0.0000 0.2777 1.6158
2017 4.5000 0.000 0.6211 $5.1211 0.0300 0.2185 0.1196 0.1500 0.5600 0.0900 0.1900 0.0000 0.2795 1.6231
2018 4.4131 0.000 0.6211 $5.0342 0.0300 0.2112 0.1159 0.1472 0.5496 0.0883 0.1865 0.0500 0.2694 1.5933
2019 4.5160 0.000 0.6211 $5.1371 0.0300 0.1986 0.1077 0.1341 0.5424 0.0870 0.1838 0.0487 0.2549 1.5797
Source: Assessor's Office - City of St. Louis
District Direct Rates

SPECIAL ADMINISTRATIVE BOARD OF THE TRANSITIONAL SCHOOL DISTRICT OF THE CITY OF ST. LOUIS
(ST. LOUIS PUBLIC SCHOOLS)
Page 105
PRINCIPAL PROPERTY TAXPAYERS CURRENT CALENDAR YEAR AND NINE YEARS AGO
Calendar Year Calendar Year2018 2009
Taxable Percentage Taxable PercentageTax Payer by Industry Assessed Of Assessed Assessed Of Assessed Classification (1) Value Rank Value Value Rank Value
Utilities 93,501,000$ 1 2.13% 92,860,000$ 1 2.16%Financial Services 81,888,000 2 1.86% 44,559,000 6 1.04%Gaming 75,079,000 3 1.71% 77,199,000 3 1.80%Utilities 62,097,000 4 1.41% 30,587,000 8 0.71%Manufacturing 61,010,000 5 1.39% 81,323,000 2 1.89%Telecommunications 59,843,000 6 1.36% 69,102,000 4 1.61%Manufacturing 28,266,000 7 0.64%Retail 25,941,000 8 0.59%Financial Services 25,334,000 9 0.58%Property Management 23,264,000 10 0.53%Telecommunications 66,285,000 5 1.54%Property Management 36,400,000 7 0.85%Healthcare Services 29,540,000 9 0.69%Transportation 27,740,000 10 0.65%
Total 536,223,000$ 12.20% 555,595,000$ 12.94%
Source : Assessor's Office and Collector of Revenue - City of St. Louis
Note:(1) Taxpayer confidentiality prevents the disclosure of amounts by company name. The above information is individual taxpayers within the noted industry categories.

SPECIAL ADMINISTRATIVE BOARD OF THE TRANSITIONAL SCHOOL DISTRICT OF THE CITY OF ST. LOUIS
(ST. LOUIS PUBLIC SCHOOLS)
Page 106
PROPERTY TAX LEVIES AND COLLECTIONS LAST TEN FISCAL YEARS
Collected Within TheTaxes Levied Fiscal Year Of The Levy Collection In Total Collections to Date
Fiscal For The Percentage Subsequent PercentageYear Fiscal Year Amount Of Levy Years Amount Of Levy
2010 168,287,844$ 160,525,095$ 95.39% 7,764,798$ 168,289,893$ 100.00%2011 175,297,191 162,648,139 92.78% 10,559,341 173,207,480 98.81%2012 173,023,805 162,483,083 93.91% 10,540,722 173,023,805 100.00%2013 183,338,294 174,974,825 95.44% 8,363,469 183,338,294 100.00%2014 172,133,379 166,047,312 96.46% 6,086,067 172,133,379 100.00%2015 184,066,441 168,779,538 91.69% 9,447,288 178,226,826 96.83%2016 186,806,374 170,337,074 91.18% 8,942,086 179,279,160 95.97%2017 216,330,853 199,230,819 92.10% 9,162,845 208,393,664 96.33%2018 210,800,244 207,397,151 98.39% 3,403,093 210,800,244 100.00%2019 215,851,430 215,830,365 99.99% 215,830,365 99.99%
Source: Board of Education annual financial reports for the respective years

SPECIAL ADMINISTRATIVE BOARD OF THE TRANSITIONAL SCHOOL DISTRICT OF THE CITY OF ST. LOUIS
(ST. LOUIS PUBLIC SCHOOLS)
Page 107
OUTSTANDING DEBT BY TYPE LAST TEN FISCAL YEARS
Governmental ActivitiesNet
Net G.O. Ratio Of G.O.School Building Net Debt To
And Energy Capital Total Percentage G.O. Debt EstimatedFiscal Refunding Loan Lease Primary Of Personal Per Actual PropertyYear Bonds Payable Obligations Government Income (a) Capita (a) Value (b)
2010 210,041,918$ —$ 281,637$ 210,323,555$ 1.84 661 0.01212011 274,162,385 — — 274,162,385 2.51 860 0.01552012 333,567,457 — — 333,567,457 2.93 1,046 0.02002013 316,519,616 — — 316,519,616 2.67 995 0.01892014 309,082,988 — — 309,082,988 2.54 971 0.01972015 293,162,485 — — 293,162,485 2.35 924 0.01752016 277,525,956 — — 277,525,956 2.11 879 0.01632017 259,982,936 — — 259,982,936 2.03 835 0.01532018 240,111,502 — — 240,111,502 1.79 778 0.01412019 219,136,962 — — 219,136,962 1.52 724 0.0128
Notes: (a) See Demographic and Economic Statistics Table for personal income and population data. These ratios are calculated using personal income and population for the prior calendar year. (b) See Assessed Value and Actual Value of Taxable Property Statistics Table for estimated actual property value

SPECIAL ADMINISTRATIVE BOARD OF THE TRANSITIONAL SCHOOL DISTRICT OF THE CITY OF ST. LOUIS
(ST. LOUIS PUBLIC SCHOOLS)
Page 108
DIRECT AND OVERLAPPING GOVERNMENTAL ACTIVITIES DEBT June 30, 2019
Estimated
Estimated Share OfDebt Percentage Direct And
Governmental Unit Outstanding Applicable Overlapping Debt
Board of Education City of St. Louis (1); General Obligation Debt 219,136,962$ 100% 219,136,962$
Other Debt:Metropolitan St. Louis Sewer District (2) 1,561,280,000 9.05% * 141,295,840
St. Louis Public Library (3) 50,000,000 100.00% 50,000,000
Junior College District of St. Louis (4) 50,170,000 17.47% * 8,765,000
Subtotal Overlapping Debt 1,880,586,962 419,197,802
City of St. Louis Direct Debt (5) 971,908,000 100% 971,908,000
Subtotal Direct Debt 971,908,000 971,908,000
Total Direct and OverlappingDebt 2,852,494,962$ 1,391,105,802$
Sources: C(1) Board of Education City of St. Louis(2) Metropolitan St. Louis Sewer District(3) St. Louis Public Library(4) Junior College District of St. Louis(5) Notes to Basic Financial Statements
Note:* Based on assessed property value

SPECIAL ADMINISTRATIVE BOARD OF THE TRANSITIONAL SCHOOL DISTRICT OF THE CITY OF ST. LOUIS
(ST. LOUIS PUBLIC SCHOOLS)
Page 109
LEGAL DEBT MARGIN INFORMATION LAST TEN FISCAL YEARS
Legal Debt Margin Calculation for Fiscal Year 2019
Assessed Value 4,201,814,836$ Debt Limit (15% of assessed valuation) 630,272,225 Debt applicable to limit 219,136,962 Legal debt margin 411,135,263$
2010 2011 2012 2013 2014 2015 2016 2017 2018 2019
Debt limit 648,208,318$ 659,590,585$ 621,746,658$ 624,009,986$ 590,698,152$ 631,648,010$ 641,050,448$ 633,645,660$ 628,104,498$ 630,272,225$
Total net debt applicable to limit 210,041,918 274,162,385 333,567,457 316,519,616 309,082,988 293,162,485 277,525,956 259,982,936 240,111,502 219,136,962
Legal debt margin 438,166,400$ 385,428,200$ 288,179,201$ 307,490,370$ 281,615,164$ 338,485,525$ 363,524,492$ 373,662,724$ 387,992,996$ 411,135,263$
Total net debt applicable to thelimit as a percentage of debt 32.40% 41.57% 53.65% 50.72% 52.34% 46.41% 43.29% 41.03% 38.23% 34.77%limit
Source: County Clerk's Report District Records
Fiscal Year

SPECIAL ADMINISTRATIVE BOARD OF THE TRANSITIONAL SCHOOL DISTRICT OF THE CITY OF ST. LOUIS
(ST. LOUIS PUBLIC SCHOOLS)
Page 110
DEMOGRAPHIC AND ECONOMIC STATISTICS LAST TEN CALENDAR YEARS
(1) (1)
Personal Income Per Capita (2)
Calendar (1) (thousands Personal UnemploymentYear Population of dollars) Income Rate
2009 317,955 11,453,476$ 36,022$ 11.7%2010 318,842 10,928,301 34,275 8.7%2011 319,008 11,369,625 35,641 7.8%2012 318,069 11,842,448 37,232 7.4%2013 318,416 12,151,780 38,163 7.2%2014 317,419 12,484,968 39,333 5.7%2015 315,685 13,142,730 41,632 5.0%2016 311,404 12,786,566 41,061 4.0%2017 308,626 13,448,883 43,577 3.8%2018 302,838 14,428,133 47,643 3.4%
Notes:(1) Source: U.S. Bureau of Economic Analysis
(2) Data provided by the U.S. Bureau of Labor Statistics

SPECIAL ADMINISTRATIVE BOARD OF THE TRANSITIONAL SCHOOL DISTRICT OF THE CITY OF ST. LOUIS
(ST. LOUIS PUBLIC SCHOOLS)
Page 111
PRINCIPAL EMPLOYERS CURRENT CALENDAR YEAR AND NINE YEARS AGO
Calendar Year Calendar Year2018 2009
Percentage PercentageOf Total City Of Total City
Employer Employees Rank Employment Employees Rank Employment
Washington University 17,851 1 3.94% 13,672 1 3.22%BJC Health Systems 15,335 2 3.39% 12,225 2 2.88%St. Louis University 9,782 3 2.16% 9,500 4 2.24%City of St. Louis 8,069 4 1.78% 10,462 3 2.46%Defense Finance & Acct Services 6,138 5 1.36% 6,174 5 1.45%A G Edwards/Wells Fargo 5,598 6 1.24% 5,602 7 1.32%St. Louis Board of Education 4,653 7 1.03% 5,139 8 1.21%U.S. Postal Service 4,376 8 0.97% ― ― ―SSM Health SLUH 4,142 9 0.91% ― ― ―STL Children's Hospital 3,953 10 0.87% ― ― ―AT&T Services ― ― ― 5,683 6 1.34%Anheuser Busch ― ― ― 4,396 10 1.03%State of Missouri ― ― ― 4,646 9 1.09%
Total 79,897 17.65% 77,499 18.24%
Source: Collector of Revenue - City of St. Louis St. Louis City Comptrollers Office

SPECIAL ADMINISTRATIVE BOARD OF THE TRANSITIONAL SCHOOL DISTRICT OF THE CITY OF ST. LOUIS
(ST. LOUIS PUBLIC SCHOOLS)
Page 112
FULL-TIME EQUIVALENT DISTRICT EMPLOYEES BY TYPE LAST TEN FISCAL YEARS
2010 2011 2012 2013 2014 2015 2016 2017 2018 2019
Supervisory Administrators and Managers 111 146 164 142 143 145 138 147 149 173 Principals 74 72 72 71 73 72 68 74 67 75 Asst. Principals-Nonteaching 48 23 23 32 34 35 35 31 30 33 Total Supervisory 233 241 259 245 250 252 241 252 246 281
Instruction Elem. Classroom Teachers 1,343 1,050 982 899 1,321 1,280 1,102 1,096 981 1,105 Sec. Classroom Teachers 593 653 717 733 514 477 418 425 415 417
Other Classroom Teachers 37 36 32 27 80 59 53 60 62 83 Total instruction 1,973 1,739 1,731 1,659 1,915 1,816 1,573 1,581 1,458 1,605
Student Services Guidance counselors 87 83 82 76 82 91 85 89 81 90 Psychological 68 22 21 19 22 17 16 15 18 22 Librarians, Audio-Visual 51 33 19 15 14 13 11 11 5 14 Consultants/Inst. Supervisors — — — — — — — — — — Other Professionals 114 29 44 54 69 67 77 79 66 70 Teacher Aides 172 361 461 143 575 358 356 381 558 689 NLR Teachers 212 262 238 325 209 326 312 249 186 311 Technicians — — — — — — — — — — Total Student Services 704 790 865 632 971 872 857 824 914 1,196
Support and Administration Clerical/Technical 194 150 158 161 151 145 139 147 136 146 Service Workers 147 135 338 352 366 366 348 321 345 342 Skilled Crafts — — — — — — — — — — Unskilled Laborers — — — — — — — — — — Total support and Administration 341 285 496 513 517 511 487 468 481 488
Total 3,251 3,055 3,351 3,049 3,653 3,451 3,158 3,125 3,099 3,570
Source: St. Louis Public Schools Department of Human Resources

SPECIAL ADMINISTRATIVE BOARD OF THE TRANSITIONAL SCHOOL DISTRICT OF THE CITY OF ST. LOUIS
(ST. LOUIS PUBLIC SCHOOLS)
Page 113
LEVEL OF SERVICE LAST TEN FISCAL YEARS
Function/activity 2010 2011 2012 2013 2014 2015 2016 2017 2018 2019
Instruction: Student enrollment K-12 25,046 23,576 22,516 25,200 24,869 24,154 22,506 21,754 20,879 19,803
Building services: Number of schools 76 76 76 76 78 76 72 72 71 71
Transportation: Number of students Transported 27,671 26,902 27,506 31,307 30,303 29,838 27,163 25,952 24,521 22,457
Source: District Records

SPECIAL ADMINISTRATIVE BOARD OF THE TRANSITIONAL SCHOOL DISTRICT OF THE CITY OF ST. LOUIS
(ST. LOUIS PUBLIC SCHOOLS)
Page 114
SCHOOL BUILDING INFORMATION
Program Capacity Year Square Feet
FY 19 Enrollment
SCHOOLCODE Elementary Schools
4990 Academy of ES and Math (Carver)-499 277 1956 51,790 166 4000 Adams-400 321 1878 72,800 223 4250 Ames-VPA-425 425 1956 93,712 283 4060 Ashland-406 388 1909 74,146 186 4180 Bryan Hill-418 256 1912 63,991 152 4200 Buder-420 397 1920 64,973 284 4360 Clay CEC-436 222 1905 57,297 132 4400 Cole-440 361 1931 55,233 338 4420 Columbia CEC-442 251 1930 59,663 175 4470 Dewey International Studies-447 420 1918 59,392 381 4480 Dunbar-448 275 1912 72,784 119 4580 Farragut Accelerated-458 279 1906 65,479 115 4630 Ford CEC-463 352 1964 81,700 166 4660 Froebel-466 350 1895 82,828 166 4730 Gateway Math & Science Elem.-473 542 1995 96,206 512 5520 Gateway-Michael SpEd-552 86 1995 14,640 46 4780 Hamilton CEC-478 364 1918 65,110 239 4880 Henry-488 335 1906 71,645 199 4900 Herzog CEC-490 407 1937 48,231 234 4890 Hickey-489 237 1966 62,222 176 4920 Hodgen-492 398 1884 51,000 198 4960 Humboldt School of Higher Learning-496 314 N/A 74,628 176 5020 Jefferson-502 251 1960 89,976 139 5030 Kennard CJA-503 325 1930 53,151 304 5060 Laclede-506 307 1915 69,020 188 5100 Lexington-510 397 1996 58,554 313 5180 Lyon ABI-518 441 1910 88,397 255 5240 Mallinckrodt ABI-524 297 1940 43,044 250 5260 Mann-526 354 1902 61,983 253 5340 Mason-534 494 1921 67,000 376 5500 Meramec-550 215 1909 45,278 179 5560 Monroe-556 359 1899 48,498 215 5590 Mullanphy-559 448 1915 103,904 380 5610 Nance-561 373 2002 61,000 322 4970 Nahed Chapman New American Academy 560 69,657 207 5600 Oak Hill-560 338 1908 54,531 222 5620 Peabody -562 340 1957 86,866 137 5780 Shaw VPA-CEC-578 439 1908 69,961 363 5800 Shenandoah-580 211 1926 40,344 145 5860 Sigel CEC-586 310 1906 67,605 214 5930 Stix ECC 1-593 475 1921 79,000 292 5960 Walbridge ECC-ACC-596 367 1924 79,077 180 6010 Washington Montessori-601 360 1956 73,849 262 6030 Wilkinson ECC 1-603 302 1920 52,683 165 5970 Woerner-597 410 1932 62,623 389 6120 Woodward-612 406 1922 61,510 283

SPECIAL ADMINISTRATIVE BOARD OF THE TRANSITIONAL SCHOOL DISTRICT OF THE CITY OF ST. LOUIS
(ST. LOUIS PUBLIC SCHOOLS)
Page 115
SCHOOL BUILDING INFORMATION (Continued)
Program Capacity Year Square Feet Enrollment
Middle Schools3250 Academy Envt' Sci/Math Middle-325 N/A N/A N/A 317 3050 Busch-305 379 1953 52,112 372 3070 Carr Lane VPA-307 695 1959 114,191 448 3390 Compton Drew ILC-339 662 1996 92,000 486 3140 Fanning-314 401 1907 81,367 197 3260 Long-326 364 1923 71,467 233 1570 McKinley-157 546 1903 115,108 335 2080 Yeatman-Liddell-352 513 1967 77,030 394
Junior Prep Academies3230 Gateway Math & Science Peparatory-323 649 1995 133,154 508
Small High Schools1500 Carnahan High School of the Future-193 398 2003 73,500 308 1540 Trans & Law Academy @ Northwest-194 709 1964 170,460 194
High Schools1680 Roosevelt-168 1,272 1925 294,464 458 1800 Sumner-180 829 1910 170,468 274 1830 Vashon-183 930 2002 240,000 447 1440 Cleveland NJROTC-144 524 1955 104,048 272 1510 Collegiate School of Medicine/Bioscience-151 130 N/A 16,743 257 1222 Nottingham CAJT-114 140 1953 41,823 122 1860 Central VPA-186 @Southwest Complex 731 1937 143,653 365 1100 Clyde Miller Career Academy-117 1,003 2004 141,000 543 1220 Gateway Stem High-111 1,850 1956 470,891 970 1560 Metro A&C-156 381 1997 56,726 376 1730 Soldan International Studies-173 1,056 1909 293,097 526 1570 McKinley Leadership Academy-157 245 1903 51,715 287
Other Schools1250 Beaumont CTE High School-125 1,243 1926 274,599 394 1015 Griscom-668 N/A N/A N/A 21
Total St. Louis Public Schools 19,803
N/A = NOT AVAILABLE
Source: DESE Website