SPE-167145-MS
19
SPE 167145 Evaluating Long Term Flow Regimes in Unconventional Oil Reservoirs with Diverse Completion Technology Kurtoglu, B., Rasdi, F, Salman, A., Marathon Oil Company, and Kazemi, H., Colorado School of Mines Copyright 2013, Society of Petroleum Engineers This paper was prepared for presentation at the SPE Unconventional Resources Conference-Canada held in Calgary, Alberta, Canada, 5–7 November 2013. This paper was selected for presentation by an SPE program committee following review of information contained in an abstract submitted by the author(s). Contents of the paper have not been reviewed by the Society of Petroleum Engineers and are subject to correction by the author(s). The material does not necessarily reflect any position of the Society of Petroleum Engineers, its officers, or members. Electronic reproduction, distribution, or storage of any part of this paper without the written consent of the Society of Petroleum Engineers is prohibited. Permission to reproduce in print is restricted to an abstract of not more than 300 words; illustrations may not be copied. The abstract must contain conspicuous acknowledgment of SPE copyright. Abstract Innovative completion techniques for unconventional oil and gas reservoirs have been developed at a rapid pace. Deciphering the flow regime characteristics of the pressure-time signature of flowing wells associated with these new completion techniques is critical for evaluating well performance and ultimate hydrocarbon recovery. In this paper we present the flow regimes observed in the plots of field production data for several of these new completion techniques. We also present the simulated model results for these completions. Several rate-transient analyses (RTA) for different well completion techniques from 1990 to 2010 were analyzed to determine how different completion techniques would affect flow regime characteristics—specifically, the linear flow period. Reservoir simulation results for homogenous and heterogeneous reservoirs showed that hydraulic fracture and natural fracture properties are the most crucial variables affecting the linear flow period. A statistical analysis of the Arp's decline b-factor was also used to show the impact of increased reservoir connectivity with advanced completion techniques and stimulation. This paper demonstrates that (a) completion techniques can influence the linear flow period and the length of the transition period before boundary-dominated flow prevails, and (b) different completion techniques lead to different flow regime diagnostics and different Arp's flow rate exponent b. Introduction The Mississippian-Devonian Bakken petroleum system of the Williston Basin is characterized by low-porosity and low-permeability reservoirs, organic-rich source rocks, and regional hydrocarbon charge (Sonnenberg, 2009). Advances in drilling, completion, and stimulation enable this ultra-low permeability reservoir to be technologically recoverable. Considering the current low primary recovery range from 3 to18% in the Bakken system (LeFever and Helms, 2008), there is a huge potential to increase recovery both in primary production and with enhanced oil recovery methods. This requires understanding the global flow hierarchy in the Bakken as well as the flow regime characteristics of the pressure and rate transient responses. This paper summarizes the well flow regimes from flow- rate and pressure transient data in several Bakken fields for various geology and well completion techniques. Montana vs. North Dakota Geology The Williston Basin is a large sedimentary basin that covers parts of North Dakota, Montana, South Dakota, Saskatchewan, and Manitoba. The structure of the Basin illustrated in Fig.1 shows the Elm Coulee field in Montana and the Antelope, Parshall, Sanish, Reunion Bay, Bailey, and Murphy Creek fields in North Dakota. Blue arrows show the Nesson and Billings Anticlines.
description
ggg
Transcript of SPE-167145-MS

SPE 167145
Evaluating Long Term Flow Regimes in Unconventional Oil Reservoirs with Diverse Completion Technology Kurtoglu, B., Rasdi, F, Salman, A., Marathon Oil Company, and Kazemi, H., Colorado School of Mines
Copyright 2013, Society of Petroleum Engineers This paper was prepared for presentation at the SPE Unconventional Resources Conference-Canada held in Calgary, Alberta, Canada, 5–7 November 2013. This paper was selected for presentation by an SPE program committee following review of information contained in an abstract submitted by the author(s). Contents of the paper have not been reviewed by the Society of Petroleum Engineers and are subject to correction by the author(s). The material does not necessarily reflect any position of the Society of Petroleum Engineers, its officers, or members. Electronic reproduction, distribution, or storage of any part of this paper without the written consent of the Society of Petroleum Engineers is prohibited. Permission to reproduce in print is restricted to an abstract of not more than 300 words; illustrations may not be copied. The abstract must contain conspicuous acknowledgment of SPE copyright.
Abstract Innovative completion techniques for unconventional oil and gas reservoirs have been developed at a rapid pace. Deciphering the flow regime characteristics of the pressure-time signature of flowing wells associated with these new completion techniques is critical for evaluating well performance and ultimate hydrocarbon recovery. In this paper we present the flow regimes observed in the plots of field production data for several of these new completion techniques. We also present the simulated model results for these completions. Several rate-transient analyses (RTA) for different well completion techniques from 1990 to 2010 were analyzed to determine how different completion techniques would affect flow regime characteristics—specifically, the linear flow period. Reservoir simulation results for homogenous and heterogeneous reservoirs showed that hydraulic fracture and natural fracture properties are the most crucial variables affecting the linear flow period. A statistical analysis of the Arp's decline b-factor was also used to show the impact of increased reservoir connectivity with advanced completion techniques and stimulation.
This paper demonstrates that (a) completion techniques can influence the linear flow period and the length of the transition period before boundary-dominated flow prevails, and (b) different completion techniques lead to different flow regime diagnostics and different Arp's flow rate exponent b. Introduction The Mississippian-Devonian Bakken petroleum system of the Williston Basin is characterized by low-porosity and low-permeability reservoirs, organic-rich source rocks, and regional hydrocarbon charge (Sonnenberg, 2009). Advances in drilling, completion, and stimulation enable this ultra-low permeability reservoir to be technologically recoverable. Considering the current low primary recovery range from 3 to18% in the Bakken system (LeFever and Helms, 2008), there is a huge potential to increase recovery both in primary production and with enhanced oil recovery methods. This requires understanding the global flow hierarchy in the Bakken as well as the flow regime characteristics of the pressure and rate transient responses. This paper summarizes the well flow regimes from flow-rate and pressure transient data in several Bakken fields for various geology and well completion techniques. Montana vs. North Dakota Geology
The Williston Basin is a large sedimentary basin that covers parts of North Dakota, Montana, South Dakota, Saskatchewan, and Manitoba. The structure of the Basin illustrated in Fig.1 shows the Elm Coulee field in Montana and the Antelope, Parshall, Sanish, Reunion Bay, Bailey, and Murphy Creek fields in North Dakota. Blue arrows show the Nesson and Billings Anticlines.

2 SPE 167145
Figure 1: Bakken Structure in the Williston Basin. Contour interval is 500 ft. The dotted red areas show the Elm Coulee field in Montana and the Antelope, Parshall, Sanish, Reunion Bay, Bailey, and Murphy Creek fields in
North Dakota. Blue arrows show the Nesson and Billings Anticlines The North Dakota fields presented in this study started development in 2006 with long horizontal wells
(~9000 ft) completed in the Middle Bakken. The Bakken Formation in North Dakota consists of three informal members -- an upper and lower black, organic-rich shale separated by a dolomitic sandstone-siltstone. Figure 2 shows the log suite of gamma ray, resistivity, and porosity for a typical well in the North Dakota Bakken. In this example of a typical well, the gross thickness of the Middle Bakken is 35 ft, the average porosity is 4.8%, and the water saturation is around 46%; the average resistivity in the target formation is around 26 ohm. The Middle Bakken formation in North Dakota has five facies, the target facie being the laminated one.
Figure 2: Typical North Dakota Bakken well logs showing each stratigraphic unit (Lodgepole, Upper Bakken,
Middle Bakken, Lower Bakken, and Three Forks) with five facie-description of Middle Bakken formation
Elm Coulee
Parshall – Sanish - Reunion Bay
Bailey –Murphy Creek
Antelope Field
MONTANANORTHDAKOTA

SPE 167145 3
The Elm Coulee field in Montana was discovered in 2000 and developed with short laterals (~5000 ft) which were completed in the Middle Bakken. The Montana Bakken also consists of three informal members. However, the typical well in the Middle Bakken in Montana has a higher volume of silty dolostone which provides a higher porosity (7.4%) compared to a typical well in the Middle Bakken in North Dakota (4.8%). Additionally, the lower Bakken shale is typically not present in the Elm Coulee field, as seen in the typical Elm Coulee well log in Fig 3. Lower Bakken member in the Elm Coulee well consists of organic-rich siltstone to mudstone which thins locally to the south of the field. In the target Middle Bakken formation of the Elm Coulee field, not all five facies are present, as the packstone and lower members are absent. In comparison to the high water saturation (46%) in a typical North Dakota Bakken well (Fig. 2), the average water saturation for the typical Elm Coulee well is around 14% (Fig. 3). This also results in a higher average resistivity, 150 ohmm in the typical Elm Coulee well. The high porosity, high resistivity, and low water saturation characteristics observed in the Elm Coulee well suggest more oil wet types of rock in the Elm Coulee Bakken than the North Dakota Bakken.
Figure 3: Typical well logs for Elm Coulee Montana Bakken showing each unit (Lodgepole, Upper Bakken, Middle Bakken, Lower Bakken, and Three Forks) with three facie-description of Middle Bakken formation
The geologic and reservoir differences between the Bakken reservoir in the North Dakota and Elm Coulee
field are summarized in Table 1. This includes lithology, thickness, depositional model, lithofacies, porosity, matrix permeability, water saturation, fracture intensity, and resistivity.

4 SPE 167145
Table 1: Comparison of geologic and reservoir properties of Elm Coulee field, Montana, and properties of Murphy Creek, Bailey and Reunion fields, North Dakota
Completion Technology Chronology The first discovery of the Bakken formation in the Williston Basin occurred in the Antelope field in 1953, and development of the field began soon after. Development continued into the 1960s with vertical well drilling in the Bakken and Upper Three Forks formations.
The second period of vertical well development, using a single-stage axial hydraulic fracture, occurred in the Upper Bakken Shale formation around the Billings anticline between 1970 and 1985. The first horizontal drilling in the Upper Bakken shale commenced in 1987. The horizontal wells typically consisted of pre-perforated liner completion, often incorporating diversion materials in an attempt to generate multiple zones of stimulation (Pearson et. al, 2013). In these completions, low rate, high viscosity fracture fluid (cross-linked gel) was injected into an un-cemented wellbore. The objective was to activate pre-existing natural fractures and to create longitudinal axial fractures along the wellbore.
The status changed in 2000 with the discovery of significant reserves in the Middle Bakken of the Elm Coulee field (Sonnenberg, 2009). Horizontal wells, with single-stage cemented completion, were utilized in the early developments of the Elm Coulee field. Well completion was altered from cemented to un-cemented liners,
Montana North Dakota
Elm Coulee Field Murphy Creek, Bailey and Reunion Bay Fields
Lithology Upper Bakken organic-rich shales organic-rich shales Middle Bakken silty dolostone limestone to sandstone Lower Bakken organic-rich siltstone organic-rich shalesUnit Thickness (ft) Upper Bakken 6 - 10 12 - 18 Middle Bakken 10 - 40 30 - 40 Lower Bakken 2 - 6 8 - 10
Depositional ModelDolomitized carbonate-shoal
off-shore marine carbonate-shoal complex
Marine swamp with restricted circulation
Middle Bakken FaciesLaminated dolostone (MB3),
bioturbated dolostone (MB4), interbedded lower grainstone (MB5)
Dolomitic lime mudstone (MB1),packstone (MB2), laminated sandstone
and siltstone (MB3),bioturbated sandstone and siltstone
(MB4), lower grainstone (MB5)Middle Bakken Porosity (%) 5 - 7 4 - 6
Porosity Type Intercrystalline secondary porosity due to dolomitization
Intergranular porosity, intragranular within
clay filled pore volumeCore Permeability (md) 0.01 - 0.1 0.0001-0.001
Water Saturation 25 50
Prominent Structural Features Poplar Dome Nesson and Billing Anticline
Pressure Gradient (psi/ft) 0.53 0.78
Reservoir Temperature (°F) 240 240
Oil Density (API) 42 39 -42
HW Drilling Starts (MB) 2000 2006
Average Well Length (ft) 5000 9000
Properties

SPE 167145 5
which resulted in significant productivity increases in the Elm Coulee Bakken compared to previous techniques. In 2006, the development of the Middle Bakken of the Elm Coulee field led to the exploration of other
fields in the Williston Basin, starting with Parshall and Sanish fields in North Dakota (see Fig.1). After the success of the first multi-stage well with transverse hydraulic fractures in the Parshall field in 2007, multi-stage fracture technology was deployed in other fields in the Williston Basin.
Multi-stage completion include plug-and-perf (cemented liner), sliding sleeve (open-hole swellable packer), and a hybrid method. Plug-and-perf technology involves cementing the production casing in the horizontal wellbore. Stage-to-stage isolation in the liner is accomplished by the setting of bridge plugs, followed by perforating and then fracturing the well at each stage (Appleton and Rivenbark, 2013). In the swellable packer multi-stage system, the horizontal wellbore is left as an open hole. The packers are set to isolate sections of the wellbore into individual stages. Stimulation ports are run between packers, which can be hydraulically opened. The major advantage of the sliding sleeve system is that all stage treatments can be performed in a single continuous operation, saving time and cost. In both completion methods, slickwater is the preferred fracturing fluid because its low viscosity is suitable for large flow rates to be used for creating an extensive micro-fracture network.
The earliest wells in each area are primarily open-hole, single stage, un-cemented liner completions (500 K lb of sand with 750 K gallons of cross linked-gel). Wells drilled in the intermediate development period of the field are generally multi-stage wells comprising 8 to10 stages with a mixture of plug and perf and sliding sleeve (swellable packer) systems. As development of these fields has progressed, the number of stages has steadily increased with 30 stages and a swellable-packer completion dominating by 2012 (2,000 K lb of sand and 1,000 K gallons of a hybrid fracturing fluid). Performance Prediction and Flow Regimes Performance prediction of wells producing from ultra-tight unconventional reservoirs has historically been very challenging due to their unique flow regime characteristics in comparison to typical conventional reservoirs. The main difference is the long-transient flow period occurring in low permeability unconventional reservoirs. In addition to the complexities of geology, the complexity of completion and stimulation technologies makes the interpretation of the long-transient flow regime even more challenging because of the numerous flow paths which exist in the reservoir. Nonetheless, both the pressure transients of long-buildup tests (Kurtoglu et al., 2012) and the flow rate transient behavior (e.g., production history) of a stimulated horizontal well produce a half slope on pressure derivative.
Numerous empirical and analytical methods have been used to investigate the short- and long-term reservoir behaviors of unconventional reservoirs. This includes traditional decline-curve analysis (Arps, 1945), power-law exponential method (Ilk et al, 2008), stretched-exponential method (Valko, 2010), rate-decline method (Duong, 2011), and transient productivity index analysis (Medeiros et al, 2010). Because each methodology has differing assumptions, and newer wells have a short production history, forecasting a reliable future performance is always questionable. Nevertheless, we continued our search and relied on numerous set of field data from Montana and North Dakota to determine the peculiarities of the flow regimes of vertical and horizontal wells for various completion and stimulation practices.
Methodology In order to accurately analyze the effects of different completion techniques on decline behavior, ultimate recovery and well flow regimes: (1) We first utilized log-log rate versus material balance time analysis to investigate flow regimes of 688 wells in
the Elm Coulee field for which pressure data is not available. (2) To provide a more accurate evaluation of flow regimes in the Bakken, we then analyzed a selection of wells in
North Dakota with pressure and production data using log-log pressure and pressure derivative as well as square root of time analysis.
(3) We contructed a homogeneous and heterogeneous reservoir model taking into account the learnings of the previous two evaluations and further detailed reservoir characterization.

6 SPE 167145
Log-Log Rate versus Material Balance Time Plot A log-log analysis of rate versus material balance time was also used to complement the flow regime diagnostic. This method is used in the absence of a pressure measurement. In the log-log scale of rate versus material balance time, linear flow exhibits a half slope and a transition flow regime will exhibit a slope between half and unit. Okouma et al. (2012) explore the relationship between Arp’s flow rate exponent b and the flow regimes from log-log rate versus material balance time. Fig. 4 shows the flow regimes and each associated slope.
Figure 4: Flow regimes diagnostic using flow rate versus material balance equivalent time In this study, we used the transient flow regime diagnostic criteria to constrain the Arp's flow rate exponent
b (Arps, 1945). Table 2 shows how we associate the flow regime and the diagnostic slope’s numerical value to Arp's flow rate exponent b.
Table 2: Comparison of slope, flow regime and Arp’s flow rate exponent b
Flow Regime Slope on log-log Rate
versus Time Arp's Flow Rate
Exponent b Linear ½ 2
Transition ½ < slope < 1 1 < b < 2 Pseudo Boundary > 1 < 1
Log-Log Pressure and Pressure Derivative Plot Log-log diagnostic of pressure and pressure derivative of well data was used to decipher flow regimes. In log-log analysis, to account for the variable flow rate, an equivalent time 𝑡𝑒, the ratio of the cumulative production to the flow rate, was used as transient time (Blasingame et al., 1991). Furthermore, the pressure is normalized using 𝑝𝑖−𝑝𝑤(𝑡)𝑞(𝑡) and plotted versus 𝑡𝑒. On the log-log plot of
𝑝𝑖−𝑝𝑤(𝑡)𝑞(𝑡) versus 𝑡𝑒 , boundary dominated flow exhibits a unit
slope. To have psi unit on the vertical axis, 𝑝𝑖−𝑝𝑤(𝑡)𝑞(𝑡) can be multiplied by a constant reference rate. This has no
consequence on the interpretation, as the graph shape is not distorted on the log-log plot (KAPPA, 2012). Furthermore, the noise in daily production data diminishes by working with a normalized pressure and pressure derivative integral, (Eq.1 and Eq. 2):

SPE 167145 7
𝑝(𝑡𝑒) = 1𝑡𝑒∫ 𝑝𝑖−𝑝𝑤(𝑡)
𝑞(𝑡)𝑡0 𝑑𝑡 [1]
𝑝′(𝑡𝑒) = 𝜕𝑝(𝑡𝑒)𝜕𝑙𝑛(𝑡𝑒) [2]
Square Root of Time Plot The wells, which had bottomhole pressure data, were further analyzed using the square root of time plot to identify the linear flow period (Nobakht and Mattar, 2010). The following analytical solution (Eq.3) represents linear flow:
∆𝑝(𝑡) = 8.128√24 𝑞𝜇𝐵�𝑘𝑓,𝑒𝑓𝑓ℎ𝐿
�� 1(𝜑𝑐𝑡)𝑓+𝑚 𝜇
�1 2⁄
√𝑡� + 141.2 𝑞𝜇𝐵𝑘𝑓,𝑒𝑓𝑓ℎ
Shf [3]
Plotting the rate normalized pressure versus the square root of time results in the slope shown in Eq. 4.
Assuming the same rock and fluid properties for the wells in the same field, the slope has an inverse relation with�𝑘𝑓,𝑒𝑓𝑓ℎ𝐿. The smaller slope the linear flow analysis shows, the better the well productivity.
𝑚 = 8.128√24 𝜇𝐵�𝑘𝑓,𝑒𝑓𝑓ℎ𝐿
�� 1(𝜑𝑐𝑡)𝑓+𝑚 𝜇
�1 2⁄
� [4]
Field Examples The field examples were chosen to demonstrate the interdependence of geologic characteristic, reservoir characteristics, and well completion method on pressure-time or rate-time behavior. Ultimately, we like to know the effect of these parameters on oil production from Bakken. Impact on Decline Behavior 688 wells in Elm Coulee field were analyzed using rate versus material balance time. Figure 5 shows the well locations relative to the counties in North Dakota and Montana. The wells were completed from 1998 to 2012 with various completion techniques. The main objective of this portion of our investigation was to determine the diversity of flow regimes as various completion methods evolved.
Figure 5: 688 well locations in the Elm Coulee Field used to diagnose flow regimes
8 SPE 167145
Figure 6 shows a histogram of the slope of log-log rate versus material balance time for the 688 wells in Elm Coulee Field. More than 70% of the wells in Elm Coulee are still in linear or transition flow regimes. This further complements the hypothesis that large fracture network is created with multi-stage fracturing and thus prolongs the linear and transition flow periods.
Figure 6: Histogram of slope of log-log rate versus material balance time for 688 wells in Elm Coulee Field
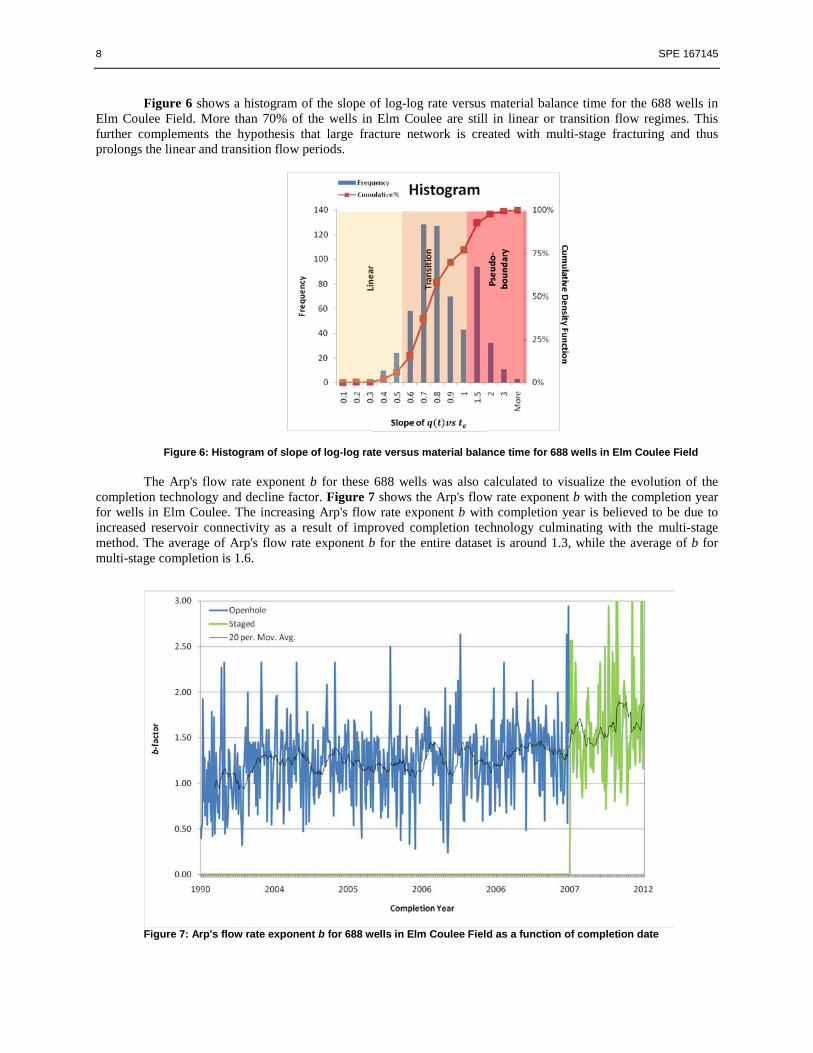
The Arp's flow rate exponent b for these 688 wells was also calculated to visualize the evolution of the completion technology and decline factor. Figure 7 shows the Arp's flow rate exponent b with the completion year for wells in Elm Coulee. The increasing Arp's flow rate exponent b with completion year is believed to be due to increased reservoir connectivity as a result of improved completion technology culminating with the multi-stage method. The average of Arp's flow rate exponent b for the entire dataset is around 1.3, while the average of b for multi-stage completion is 1.6.
Figure 7: Arp's flow rate exponent b for 688 wells in Elm Coulee Field as a function of completion date

SPE 167145 9
Impact on Ultimate Recovery We chose several typical wells for demonstration and analysis. They are: (1) a horizontal well from Elm Coulee field, (2) a vertical well in West Tioga field from 1970s, (3) a 1990s horizontal well in Devil Pass field near Nesson Anticline, and (4) three horizontal wells from Bailey field. Figure 8 shows oil rate versus cumulative production of these wells, and Table 3 summarizes the well completion and production information for each well.
Figure 8: Selected Bakken well production profiles in the study area
Below is a short description of the well characteristics, behavior, and observations from the production plot
shown in Fig. 8: (4) Vertical Well 1 and horizontal Well 2 were completed in Upper Bakken shale formation. Although this
formation has ultra-low permeability, these wells produced for more than twenty years without today’s advanced completion and stimulation techniques. Even after thirty years, vertical Well 1 has been producing at a constant rate for a long time, indicating persistent flow contribution from matrix.
(5) Both the early and late production rates were larger when comparing vertical wells to short laterals, short laterals to long laterals, and single-stage completion to multi-stage completion.
(6) Well 3, a short lateral with a single-stage fracture, outperformed Well 5 and Well 6 which are long laterals with multi-stage fractures. This can be explained by the higher permeability, higher porosity, and higher fracture intensity of the Middle Bakken in Elm Coulee than in North Dakota.

10 SPE 167145
Table 3: Summary of well properties from wells shown in Figure 8
Well # Depletion
Approximate Well Length
(ft) Field Formation Completion
Stage Days of
Production
Cumulative Oil
Production (MBBL)
Cumulative Oil
Production (150 days) (MBBL)
1 VW -- West Tiango
Upper Bakken 1-stage 10777 119 6
2 HW 2000 Devil Pass
Upper Bakken 1-stage 4869 95 17
3 HW 5000 Elm Coulee
Middle Bakken 1-stage 2556 491 57
4 HW 9000 Bailey Middle Bakken 1-stage 1781 111 20
5 HW 9000 Bailey Middle Bakken 15-stage 1028 145 36
6 HW 9000 Bailey Middle Bakken 30-stage 146 60 60
Only Well 4, 5, and 6, in Baily field, had surface pressure records through the well life. These pressures
were converted to the bottomhole conditions and were used to analyze using the square root of time plot (Fig. 9). Because of the continuity of surface pressure records, the effects of well completion on well productivity were diagnosed with more confidence, as listed below:
(1) The slope increases from the 30-stage completion (2.0 psi/STB.D1/2) to the 15-stage completion (2.4
psi/STB.D1/2) and, finally, to the single-stage completion (4.0 psi/STB.D1/2). This indicates greater reservoir enhancement both vertically and horizontally with multi-stage completion.
(2) All wells remain in linear regime (1/2 slope) without transitioning to a unit slope, indicating that long-transient flow persists in the Bakken in spite of differing completion methods.
Figure 9 Linear flow analysis of North Dakota Bakken horizontal wells with 1-stage, 15-stage and 30-stage completion
0
20
40
60
80
100
120
140
160
180
200
0 5 10 15 20 25 30 35 40
Rat
e N
orm
aliz
ed P
ress
ure
(psi
/STB
/D)
Square Root of Time (Day1/2)
Well 4: 1-Stage
Well 5: 15-Stage
Well 6: 30-Stage Well#
Slopepsi/STB.D1/2
4 4.0
5 2.4
6 2.0

SPE 167145 11
Impact on Flow Regimes Figure 10 shows the log-log diagnostic of rate normalized pressure and pressure derivative plots for the same North Dakota Bakken wells shown in Fig. 9. The flow regimes were compared to address the duration of linear and transition flow regimes for different well completion. The following are our conclusions: (1) The single-stage well stays in linear flow (1/2 slope) through its entire life (4.8 years) indicating the continuous
flow from the stimulated area to the wellbore. (2) Multi-stage wells show a slope higher than a half slope but less than a unit slope for a long period of time--
known as “transition flow”. This may be the result of a complex fracture system caused by multi-stage fracturing. Although it may not be definitive, we observed that wells stay in transition flow for a long period of time and do not see boundary-dominated flow even with multi-stage completion. This was further investigated with reservoir modeling in the next section.
Figure 10: Log-log diagnostic pressure and pressure derivative plots of North Dakota Bakken horizontal wells with 1-stage, 15-stage and 30-stage completion
Simulation Modeling
Analyses of the field data indicate that multi-stage completions increases well productivity, changes the flow regime from linear to transition, and creates improved reservoir connectivity. Nevertheless, to determine the combined effects of reservoir heterogeneity, multi-phase flow, well spacing, and completion practice on well behavior, two conceptual dual-porosity models were constructed which are presented in this section.
In this modeling study, both homogeneous and heterogeneous multi-layer models are presented for different completion and geological settings. In both models, the dual-porosity is a system where the flow path in the stimulated reservoir region begins with the nano-scale matrix flow to natural fractures to hydraulic fracture and to the wellbore. The hydraulic fracture, micro-fracture, and matrix properties were obtained from production data analysis, detailed fracture characterization study, and core permeability measurements from the study area (Rasdi et al, 2012).
Model 1: Homogenous Case The entire reservoir was discretized using logarithmic gridding and produced from three sub-domains (Fig. 11) consisting of hydraulic fractures to represent stage-completion, stimulated reservoir volume (SRV, in red), and un-stimulated reservoir volume (URV, in blue).
Figure 11: Homogenous reservoir model schematic showing stimulated reservoir volume and logarithmic gridding near wellbore
1.E+02
1.E+03
1.E+04
1.E+05
1.E+06
0.1 1.0 10.0 100.0 1000.0 10000.0
Nor
mal
ized
Pres
sure
N
orm
alize
d Pr
essu
re D
eriv
ativ
e
Equivalent Time, hr
Well 4: 1-Stage Well 5: 15-Stage Well 6: 30-Stage
linear linear transition linear transition
Permeability Distribution Fine-Logarithmic Gridding

12 SPE 167145
Model 1: Homogenous Case - Single-Stage Horizontal Wells Four identical horizontal wells with single-stage completion were simulated in a 1280-acre drilling spacing unit. To represent the open-hole single-stage completion, only two regions (SRV and URV) were included without having highly conductive transverse fractures in the model. The idea was to represent any enhanced production areas where there may be longitudinal fractures created by the single-stage completion. Well production profiles from the model were compared with the existing single-stage wells in the area to calibrate the model response.
Figure 12 shows the pressure propagation in the reservoir and corresponding flow periods on log-log diagnostic plot after 10 days, 6 months, and 40 years of production. The well stays in linear flow for most of the well life. This response is consistent with the field data of a typical single-stage horizontal well (Example is Well 4 in Table 3).
First, linear flow is observed along the wellbore. Transition flow occurs from the URV to the SRV region within longitudinal fractures, and to the wellbore. Unit slope (pseudo-boundary) on pressure and pressure derivative is observed only when the well reaches the SRV boundary. Only at this point does the pressure propagation go beyond that boundary, but it still does not show any well interference with the offset wells.
Figure 12: Pressure propagation profiles at 10 days, 6 months, and 40 years of production and the corresponding
diagnostic pressure and pressure derivative response for single-stage horizontal well
Model 1: Homogenous Case - Four 30-Stage Horizontal Wells This same model was modified to include a 30-stage completion for each well. Figure 13 shows the same time steps for the pressure profile and related flow regimes as in Fig. 12. Each hydraulic fracturing stage was uniformly distributed and modeled as transverse fractures.
The linear flow regime is related to the flow linearly in the hydraulic fractures. The transition flow regime is due to the fracture interference and SRV depletion. The flow regime is more complex in this system since linear flow exists from the URV to the SRV region in natural fracture blocks, and from those fractures to hydraulic fractures, and to the wellbore. The model response is consistent with a typical 30-stage horizontal well (Example is Well 6 in Table 3). Pseudo-boundary is observed only when the well reaches the SRV boundary.
This exercise shows multi-stage horizontal wells stay in transition flow for a long period of time even after the deviation from a linear slope.
Pressure Propagation
linear transition pseudo-boundary
10 daysLinear: Along Wellbore
6 monthsTransition: Longitudinal
Fracture
40 yearsPseudo-boundary: Outside of
SRV

SPE 167145 13
Figure 13: Pressure propagation profiles at 10 days, 6 months, and 40 years of production and the corresponding diagnostic pressure and pressure derivative response for 30-stage horizontal well
In Model 1, one should note that because the reservoir parameters were homogenous in each layer, the flow
paths are uniform in the reservoir. This conceptual representation could affect decisions about the well spacing. To capture the complexity of fluid flow due to reservoir heterogeneity, a geologically characterized model was used to build a more representative model, Model 2.
Model 2: Heterogeneous Case Sonnenberg et al. (2009) and Cipolla et al. (2011) point out the presence of natural fractures in the Bakken and unconventional reservoirs in general. Vertical cores and image logs in the Bakken show significant natural fractures presence. As illustrated in Table 1, the Elm Coulee Bakken has a different geology than the North Dakota Bakken. In attempt to capture this effect, a heterogeneous model with natural fracture corridors was generated.
A heterogeneous model upscaled from the discrete fracture network model (Rasdi et al., 2012) was further used in the study to simulate similar scenarios with the homogeneous model. A detail fracture characterization was constructed in this model to understand the lateral and vertical well connectivity. Figure 14 shows an overview of the natural fracture corridors and the permeability distribution in the model.
Figure 14: Overview of heterogeneous model with natural fracture corridors and permeability distribution
Pressure Propagation
linear transition pseudo-boundary
10 daysLinear: Hydraulic Fracture
6 monthsTransition: Interference
Hydraulic Fracture
40 yearsPseudo-boundary: Outside of
SRV

14 SPE 167145
Model 2: Heterogeneous Case - Unstimulated Horizontal Wells An unstimulated well simulation scenario was simulated in the model to further understand the flow regimes in the absence of multi-stage completion. This model includes four Middle Bakken horizontal wells in a 1280 acre reservoir. Figure 15 shows the corresponding diagnostic pressure and pressure derivative response for an unstimulated horizontal well.
Figure 15: Diagnostic pressure and pressure derivative response for an unstimulated horizontal well in a 4 well per 1280 acre drilling spacing unit
Only two distinctive flow regimes were observed; linear and transition. The linear flow regime is related to
the flow linearly in the horizontal wellbore while the transition flow regime is related to the interaction of natural fracture networks with the wellbore. Table 4 highlights and summarizes the flow regimes observed for openhole completion in both homogenous and heterogeneous models.
Table 3: Summary of flow regimes for single-stage completion

SPE 167145 15
Model 2: Heterogeneous Case - Thirty-Stage Horizontal Wells Eight wells with 30 stage completions were also simulated in the model to further understand the flow regimes in relation to the completion method. Four wells are completed in Middle Bakken and another four are completed in Three Forks. This will give an insight into the vertical interference between layers as described by Rasdi et al (2012). Figure 16-17 shows normalized pressure and its derivatives for a horizontal well completed with 30 stages in an 8 well per 1280 acre drilling spacing unit reservoir. The well experiences linear, transition, second linear, and transition flow regimes sequentially. The first linear flow in Fig. 16 is interpreted as linear flow into the hydraulic fractures. The transition flow regime is perceived as interaction between the hydraulic fractures.
Figure 16: Pressure propagation profiles through well life for a well in an 8 well per 1280 acre drilling spacing unit with 30-stage completion
The second linear flow in Fig. 17 is interpreted as linear flow in the natural fracture corridors. The last
transition flow regime lasting more than the 40 year producing life of the well is interpreted as drainage outside the SRV and fracture corridors.

16 SPE 167145
Figure 17: Pressure propagation profiles through well life for a well in an 8 well per 1280 acre drilling spacing unit with 30-stage completion
Table 5 summarizes the difference in flow regimes between the homogenous and heterogeneous model.
The main difference between the two approaches reveals the importance of reservoir characterization. In the homogenous model, the well exhibits the boundary due to lack of connectivity in the unstimulated area.
Table 5: Summary of flow regimes for multi-stage completion

SPE 167145 17
Discussion In this study, we attempted to understand the various flow regimes precipitated by the diverse completion method within the Bakken. This understanding is critical for performance forecasting. In all cases, the linear and transition flow regimes are observed as the dominant flow regimes in Bakken. The summary of these observations among the field, homogeneous, and heterogeneous models are presented in Table 5.
Table 5: Summary of flow regimes observed in field, homogenous, and heterogeneous reservoir model
Conclusions The scope of this paper is to understand the flow regime for the varied completion method. The most important observations and conclusions from this study are:
• Log-log diagnostic pressure and pressure derivative plot, square root of time plot, and log-log rate versus material balance time plot can be used together with the decline curve analysis to increase the confidence in well forecasting in unconventional reservoirs.
• Completion technique can influence the linear flow period and the length of the transition period before the boundary-dominated flow prevails. Multi-stage fracturing increases the complexity in the flow mechanism especially near the wellbore, which leads to early departure from linear flow when compared to a single-stage hydraulic fracture.
• Different completion techniques and increased reservoir heterogeneity lead to different Arp's flow rate exponent b. The greater the reservoir connectivity, the larger the b exponent will be.
• Detailed fracture characterization in unconventional reservoirs is the key to understanding well flow regime, which eventually will provide insight for long-term well spacing and productivity.

18 SPE 167145
Nomenclature Bo : formation volume factor, (RB/STB or RCF/SCF) ct, m : total matrix compressibility, (1/psi) ct, f : total fracture compressibility, (1/psi) h : formation thickness, (ft) kf, eff : effective fracture permeability (fracture porosity x fracture permeability), (md) L : well length (ft) m : linear flow slope (psi/STB.days1/2) nf : total number of fractures yf : fracture half-length, (ft) µo : oil viscosity, (cp) φm : matrix porosity, % φf : fracture porosity, % q : oil production rate, (ft3/D) pi : initial reservoir pressure, (psi) pw : well flowing pressure, (psi) Shf : horizontal skin factor t : time, (day) te : material balance time n : current step index for discrete time j : step index for discrete time Acknowledgement The authors would like to thank Marathon Oil Corporation management, especially to Russ Buettner, Tim Deines and Corey Scherrer for thoroughly reviewing the work and permission to publish this work. We would also like to acknowledge our peers from Bakken Asset Team and Upstream Technology for their reviews, comments and feedback. A special thanks to Jeff Brehm for generating petrophysical figures and Corey Scherrer for meticulously editing the paper. References Arps, J.J. 1945. Analysis of Decline Curves, Trans., AIME. SPE 1758-PA. DOI: 10.2118/1758-PA Appleton, J., and Rivenbank, M. 2013. Cemented Versus Open hole Completions: What is Best for Your Well? SPE paper
163946 presented at SPE Middle East Unconventional Gas Conference and Exhibitions, Muscat, Oman, 28-30 January 2013.
Blasingame, T.A., McCray, T.L., and Lee, W.J. 1991, Decline Curve Analysis for Variable Pressure Drop/Variable Flowrate
Systems, SPE paper 21513 presented at SPE Gas Technology Symposium, Houston, Texas, 23-24 January. Cipolla, C., Lewis, R., Maxwell, S., and Mack, M. 2011. Appraising Unconventional Resource Plays: Separating Reservoir
Quality from Completion Effectiveness, SPE paper 14677 presented at the International Petroleum Technology Conference, Bangkok, Thailand, 7-9 February.
Clarkson. C.R., and Beierle, J.J., 2011. Integration of Microseismic and Other Post-Fracture Surveillance with Production
Analysis: A Tight Gas. JNGSE 3: 382-401. DOI 10.1016/j.jngse.2011.0.003 Duong, A. 2011. Rate-decline Analysis for Fracture-Dominated Shale Reservoir. SPE paper 137748 presented at the Canadian
Unconventional Resources and International Conference, Calgary, Canada, 19-21 October. Ilk, D., Rushing, J.A., Perego, A.D., and Blasingame, T.A. 2008. Exponential vs Hyperbolic Decline in Tight Gas Sands –
Understanding the Origin and Implications for Reserve Estimates Using Arps’s Decline Curves, SPE paper 116731 presented at the SPE Annual Technical Conference and Exhibition, Denver, Colorado, 21-24 September.

SPE 167145 19
Kurtoglu, B., Torcuk, M., and Kazemi, H., 2012. Evaluation of Bakken Performance Using Coreflooding, Well Testing, and Reservoir Simulation Pressure Transient Analyses of Short and Long Duration Well Tests in Unconventional Reservoirs. SPE Paper 162473 presented at Canadian Unconventional Resources Conference, Calgary, Alberta, Canada, 30 October-1 November 2012
LeFever, J., and Helms, L., 2008, Bakken Formation reserve estimates: North Dakota Geological Survey white paper, North
Dakota Geological Survey, Bismarck, ND, March 2008, 6 p. Medeiros, F., Kurtoglu, B., Ozkan, E., and Kazemi, H. 2010. Analysis of Production Data From Hydraulically Fractured
Horizontal Wells in Shale Reservoirs. SPEREE 13 (3): 559-568 Okouma, V., Symmons, D., Hosseinpour-Zonoozi, N., Ilk, D., and Blasingame, T.A., 2012. Practical Consideration for Decline
Curve Analysis in Unconventional Reservoirs – Application of Recently Developed Time-Rate Relations, SPE paper 162910 presented at SPE Hydrocarbon, Economics and Evaluation Symposium, Calgary, Alberta, Canada, 24-25 September
Pearson, C.M., Griffin, L., Wright, C., and Weijers, L. 2013. Breaking Up is Hard to Do: Creating Hydraulic Fracture
Complexity in the Bakken Central Basin. SPE paper 163827 presented at SPE Hydraulic Fracturing Technology Conference, The Woodlands, Texas, 4-6 February 2013.
Nobakht, M., and Mattar, L., 2010. Analyzing Production Data from Unconventional Gas Reservoirs with Linear Flow and
Apparent Skin. SPE Paper 137454 presented at Canadian Unconventional Resources and International Petroleum Conference, Calgary, Alberta, Canada, 19-21 October 2010.
Rasdi, F., Salman, A., and Adams, D., 2012. An Investigation of Vertical and Lateral Communication in an Unconventional Oil
Reservoir Using Geochemistry and Reservoir Simulation. SPE Paper 162673 presented at Canadian Unconventional Resources Conference, Calgary, Alberta, Canada, 30 October-1 November 2012.
Saphir Version 4.20.03 Software, 2011. Sophia Antipolis, France: Kappa Engineering Sonnenberg, S. A. and Pramudito, S., 2009. Petroleum Geology of the Giant Elm Coulee Field, Williston Basin, AAPG Bulletin,
V. 93, NO. 9: 1127-1153. Valko, P.P. 2009. Assigning value to Stimulation in the Barnett Shale: A Stimulation Analysis of 7,000 plus Production Histories
and Well Completion Records. SPE paper 119369 presented at the SPE Hydraulic Fracturing Technology Conference, The Woodlands, Texas, 19-21 January