SPE 151860 Hydraulic Fracturing as Development Strategy in the
10
SPE 151860 Hydraulic Fracturing as Development Strategy in the Congo Onshore R. Perfetto SPE, eni Congo, F. Martocchia SPE, eni Congo, A. Binda, eni Congo, R. Itoua, eni Congo, G.Tita SPE, eni Congo, R.L. Ceccarelli SPE, eni E.&P., L.Tealdi, SPE, eni Congo, R. Cafarelli, eni Congo. Copyright 2012, Society of Petroleum Engineers This paper was prepared for presentation at the North Africa Technical Conference and Exhibition held in Cairo, Egypt, 20–22 February 2012. This paper was selected for presentation by an SPE program committee following review of information contained in an abstract submitted by the author(s). Contents of the paper have not been reviewed by the Society of Petroleum Engineers and are subject to correction by the author(s). The material does not necessarily reflect any position of the Society of Petroleum Engineers, its officers, or members. Electronic reproduction, distribution, or storage of any part of this paper without the written consent of the Society of Petroleum Engineers is prohibited. Permission to reproduce in print is restricted to an abstract of not more than 300 words; illustrations may not be copied. The abstract must contain conspicuous acknowledgment of SPE copyright. Abstract The benefits of Hydraulic Fracturing (HF) are well recognized in the oil industry, even if in many world regions it is still seen as a remedial operation rather than a reservoir development strategy. The big part of worldwide HF operations, are performed extensively in the US and Canada, primarily for reservoir development purposes of tight gas fields. However during the last few years, the global trend has seen a change and HF is now encouraged for adding new reserves, aiding the development of low permeability marginal reservoirs and prolonging life of brown fields. In Congo Onshore, HF is now a consolidated reality, with more than 70 frac jobs pumped. Good results have encouraged management to increase fracturing activity: nowadays HF is performed on all the infill wells that are drilled in the low permeability layers of the reservoir. From the early stages of development only the layers with the higher permeability were produced, while the possibility to develop the low permeability layers was not considered, because of very poor or zero production results due to the application of conventional completion strategy. Since HF is now performed as a standard practice on new wells, it has been reconsidered for the application on old wells completed in the low permeability layers. The challenge encountered on these old wells, has been the presence of long perforated interval. Rigless operations (such as sand plug) and work-over operations (such as cementing of old perforated interval and re- perforations) have been needed for fracturing in order to avoid fracture initiation issues like multiple fractures and early screenout. This paper will show the lessons learned and the main results achieved during this campaign and it is particularly focused on operational and logistic aspects, offering a full operational overview to all Companies and Operators that intend to apply this technology on their assets, maximizing oil recovery. Introduction Hydraulic Fracturing started in 1940s, with the goal of creating high conductive pathways into reservoir, increasing drainage area and allowing production from low permeability reservoirs, reducing the energy required to move the hydrocarbon from the reservoir to the well bore. This goal is reached by pumping at high pressure into formation, breaking the formation and creating high conductive channels. The creation of the fracture itself is accomplished through a high viscous fluid which is able to carry a particular material (proppant). The viscous fluid (fracturing fluid) is properly designed in order to “break” after a desired time, losing its carrying capacity. The pumped proppant is hold in place by the pressure exercised by the fracture’s faces (fracture closure pressure). Due to its mechanical properties the proppant is able to keep the fracture opened and above all, to create a pathway with a permeability that is considerably higher than formation permeability. After pumping operations, the “broken” fracturing fluid is then flow back during the clean up phase.
Transcript of SPE 151860 Hydraulic Fracturing as Development Strategy in the

SPE 151860
Hydraulic Fracturing as Development Strategy in the Congo Onshore R. Perfetto SPE, eni Congo, F. Martocchia SPE, eni Congo, A. Binda, eni Congo, R. Itoua, eni Congo, G.Tita SPE, eni Congo, R.L. Ceccarelli SPE, eni E.&P., L.Tealdi, SPE, eni Congo, R. Cafarelli, eni Congo.
Copyright 2012, Society of Petroleum Engineers This paper was prepared for presentation at the North Africa Technical Conference and Exhibition held in Cairo, Egypt, 20–22 February 2012. This paper was selected for presentation by an SPE program committee following review of information contained in an abstract submitted by the author(s). Contents of the paper have not been reviewed by the Society of Petroleum Engineers and are subject to correction by the author(s). The material does not necessarily reflect any position of the Society of Petroleum Engineers, its officers, or members. Electronic reproduction, distribution, or storage of any part of this paper without the written consent of the Society of Petroleum Engineers is prohibited. Permission to reproduce in print is restricted to an abstract of not more than 300 words; illustrations may not be copied. The abstract must contain conspicuous acknowledgment of SPE copyright.
Abstract The benefits of Hydraulic Fracturing (HF) are well recognized in the oil industry, even if in many world regions it is still seen as a remedial operation rather than a reservoir development strategy. The big part of worldwide HF operations, are performed extensively in the US and Canada, primarily for reservoir development purposes of tight gas fields. However during the last few years, the global trend has seen a change and HF is now encouraged for adding new reserves, aiding the development of low permeability marginal reservoirs and prolonging life of brown fields. In Congo Onshore, HF is now a consolidated reality, with more than 70 frac jobs pumped. Good results have encouraged management to increase fracturing activity: nowadays HF is performed on all the infill wells that are drilled in the low permeability layers of the reservoir. From the early stages of development only the layers with the higher permeability were produced, while the possibility to develop the low permeability layers was not considered, because of very poor or zero production results due to the application of conventional completion strategy. Since HF is now performed as a standard practice on new wells, it has been reconsidered for the application on old wells completed in the low permeability layers. The challenge encountered on these old wells, has been the presence of long perforated interval. Rigless operations (such as sand plug) and work-over operations (such as cementing of old perforated interval and re-perforations) have been needed for fracturing in order to avoid fracture initiation issues like multiple fractures and early screenout. This paper will show the lessons learned and the main results achieved during this campaign and it is particularly focused on operational and logistic aspects, offering a full operational overview to all Companies and Operators that intend to apply this technology on their assets, maximizing oil recovery. Introduction Hydraulic Fracturing started in 1940s, with the goal of creating high conductive pathways into reservoir, increasing drainage area and allowing production from low permeability reservoirs, reducing the energy required to move the hydrocarbon from the reservoir to the well bore. This goal is reached by pumping at high pressure into formation, breaking the formation and creating high conductive channels. The creation of the fracture itself is accomplished through a high viscous fluid which is able to carry a particular material (proppant). The viscous fluid (fracturing fluid) is properly designed in order to “break” after a desired time, losing its carrying capacity. The pumped proppant is hold in place by the pressure exercised by the fracture’s faces (fracture closure pressure). Due to its mechanical properties the proppant is able to keep the fracture opened and above all, to create a pathway with a permeability that is considerably higher than formation permeability. After pumping operations, the “broken” fracturing fluid is then flow back during the clean up phase.

2 SPE 151860
Reservoir Overview The field presented in this paper is located in Congo, it is a pre-salt anticlinal structure with an average reservoir depth of about 2000 m TVDSS and gross thickness from 120 to 450 m. The reservoir is filled with light oil (39° API) with low viscosity (0.5 cP) and is highly heterogeneous due to complex structural and stratigraphical setting (fig.1). The formation mainly comprises of clastic deposits fine to coarse sandstones to conglomerates with illitic dispersed clay from the Cretacic age. The basic structural framework composes of NW-SE oriented, high angle normal faults, possibly syn-rift in origin with more orthogonal transfer faults that control the sedimentation and the basin topography. Heavy faulting and fluvial lacustrine deposition contributes to compartmentalization of varying sealing capacity. There are about 30 different observed fluid contacts in the field. Each of the six reservoir layers, in partial hydraulic communication, is characterized by specific depositional environments and tectonic styles that result in extremely different petrophysical characteristics. A lateral, weak and disconnected aquifer is present only in some peripheral of the field and the primary drive mechanism is mainly solution gas expansion. Vertical and lateral reservoir compartmentalization and the lack of aquifer drive are the origin of differential depletion phenomena which cause a steep exponential decline in oil production (fig.2).
Fig. 1 – Field cross section showing multiple primary OWCs and GOCs.
The field is producing since 2002 and large volumes of reservoir fluids were withdrawn: dispersed water injection was implemented in 2007 as a solution to maintain reservoir pressure in order to arrest, minimize the field global decline. For the early stage of development, the layers with the best petrophysical characteristics were selected (layers 2 and 3, with 12% porosity and a permeability range of 10-1000 mD), while scarce contribution came from the other layers. Attempts were made to produce the lower layers, in particular layer 5, a braided channel system with low permeability (0.1-30 mD) and the highest Oil In Place, but both perforated cased holes and open holes completions gave unsatisfactory results. A new possibility came from the good results of HF, that opened the road to the latest and still ongoing phase of development in layer 5. The presence of multiple layer and differential depletion, presence of OWCs and GOCs made hydraulic fracturing treatments very challenging.
Fig. 2 – MDT plot showing differential depletion.
SPE 151860 3
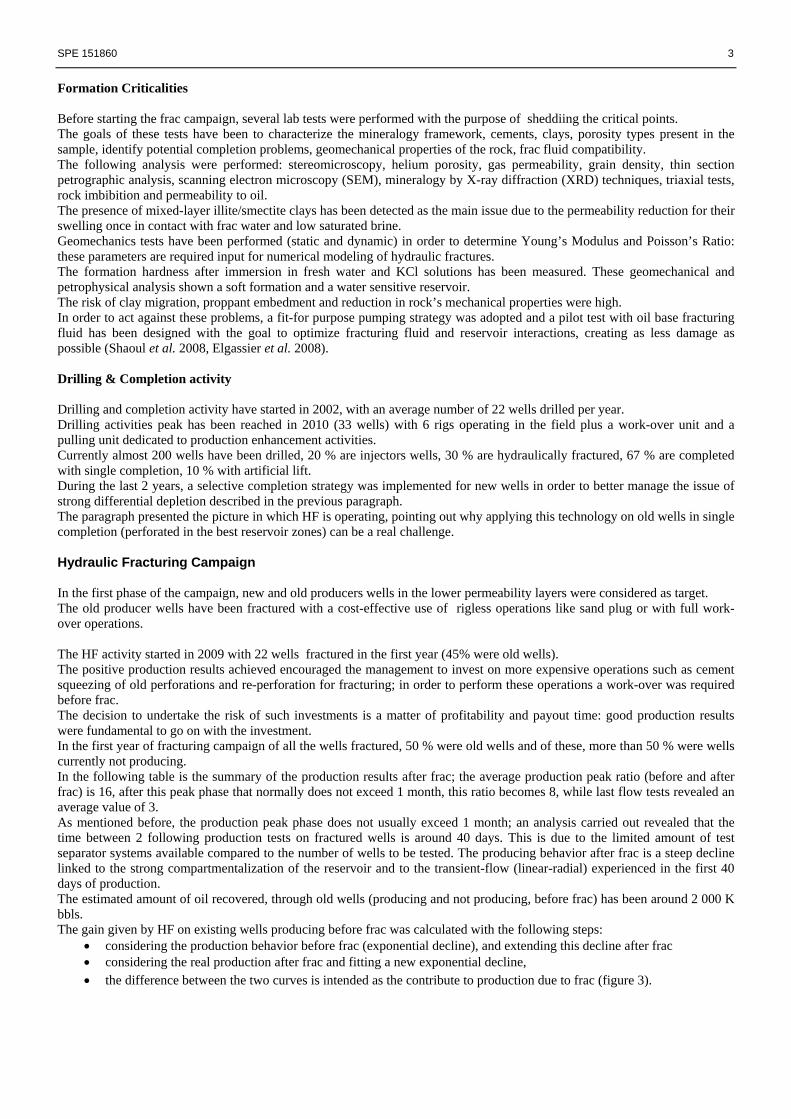
Formation Criticalities Before starting the frac campaign, several lab tests were performed with the purpose of sheddiing the critical points. The goals of these tests have been to characterize the mineralogy framework, cements, clays, porosity types present in the sample, identify potential completion problems, geomechanical properties of the rock, frac fluid compatibility. The following analysis were performed: stereomicroscopy, helium porosity, gas permeability, grain density, thin section petrographic analysis, scanning electron microscopy (SEM), mineralogy by X-ray diffraction (XRD) techniques, triaxial tests, rock imbibition and permeability to oil. The presence of mixed-layer illite/smectite clays has been detected as the main issue due to the permeability reduction for their swelling once in contact with frac water and low saturated brine. Geomechanics tests have been performed (static and dynamic) in order to determine Young’s Modulus and Poisson’s Ratio: these parameters are required input for numerical modeling of hydraulic fractures. The formation hardness after immersion in fresh water and KCl solutions has been measured. These geomechanical and petrophysical analysis shown a soft formation and a water sensitive reservoir. The risk of clay migration, proppant embedment and reduction in rock’s mechanical properties were high. In order to act against these problems, a fit-for purpose pumping strategy was adopted and a pilot test with oil base fracturing fluid has been designed with the goal to optimize fracturing fluid and reservoir interactions, creating as less damage as possible (Shaoul et al. 2008, Elgassier et al. 2008). Drilling & Completion activity Drilling and completion activity have started in 2002, with an average number of 22 wells drilled per year. Drilling activities peak has been reached in 2010 (33 wells) with 6 rigs operating in the field plus a work-over unit and a pulling unit dedicated to production enhancement activities. Currently almost 200 wells have been drilled, 20 % are injectors wells, 30 % are hydraulically fractured, 67 % are completed with single completion, 10 % with artificial lift. During the last 2 years, a selective completion strategy was implemented for new wells in order to better manage the issue of strong differential depletion described in the previous paragraph. The paragraph presented the picture in which HF is operating, pointing out why applying this technology on old wells in single completion (perforated in the best reservoir zones) can be a real challenge. Hydraulic Fracturing Campaign In the first phase of the campaign, new and old producers wells in the lower permeability layers were considered as target. The old producer wells have been fractured with a cost-effective use of rigless operations like sand plug or with full work-over operations. The HF activity started in 2009 with 22 wells fractured in the first year (45% were old wells). The positive production results achieved encouraged the management to invest on more expensive operations such as cement squeezing of old perforations and re-perforation for fracturing; in order to perform these operations a work-over was required before frac. The decision to undertake the risk of such investments is a matter of profitability and payout time: good production results were fundamental to go on with the investment. In the first year of fracturing campaign of all the wells fractured, 50 % were old wells and of these, more than 50 % were wells currently not producing. In the following table is the summary of the production results after frac; the average production peak ratio (before and after frac) is 16, after this peak phase that normally does not exceed 1 month, this ratio becomes 8, while last flow tests revealed an average value of 3. As mentioned before, the production peak phase does not usually exceed 1 month; an analysis carried out revealed that the time between 2 following production tests on fractured wells is around 40 days. This is due to the limited amount of test separator systems available compared to the number of wells to be tested. The producing behavior after frac is a steep decline linked to the strong compartmentalization of the reservoir and to the transient-flow (linear-radial) experienced in the first 40 days of production. The estimated amount of oil recovered, through old wells (producing and not producing, before frac) has been around 2 000 K bbls. The gain given by HF on existing wells producing before frac was calculated with the following steps:
• considering the production behavior before frac (exponential decline), and extending this decline after frac • considering the real production after frac and fitting a new exponential decline, • the difference between the two curves is intended as the contribute to production due to frac (figure 3).
4 SPE 151860
Q pre FracQ peak post
FracQ after trans
Q last test
FOI peak
FOI after transient
FOI last test
bopd bopd bopd bopd
1 93 2129 391 254 23 4 3
2 136 213 180 118 2 1 1
3 255 1860 1200 251 7 5 1
4 151 1685 552 588 11 4 4
5 15,81 709 390 165 45 25 10
6 32 1120 600 52 35 19 2
7 300 263 232 252 1 1 1
8 342 1062 NA 937 3 NA 3
Well
Fig. 3 – Production results after frac (old wells).
Candidate Selection Issues A series of aspects has to be considered before identifying possible candidates. Water & Gas Contacts. The field presents multiple contacts and fracture designs have been executed in order to maintain a safe distance from the contacts (minimum of 20 meters). Water production can come both from the weak bottom edge aquifer and from injected water breakthrough in the upper layers. It is important to note that the OWC depth can be overcautiously estimated, in the cases where ODT is taken as contact limit. Wellhead & Completion Limitations. Pressure limit for wellhead is 5 K psi. In order to protect the wellhead, for rigless interventions a treesaver has been used. In case of fracturing operations executed with work-over rig, hence using a dedicated frac string, the treesaver was avoided. The use of a dedicated frac string, if possible, is recommended for saving both costs and time. Moreover the use of a dedicated frac string protects important parts of the final completion such as valves, sliding side doors, subsurface safety valves which are exposed to the fracturing fluid and proppant during the pumping job. In such cases, the presence of hydraulic packers can be critical: the downward forces generated by bottomhole pressure could cause the release of the packer. This issue can be avoided by applying the right annulus pressure, defined with tubing stress analysis. Additionally, when a proper HF candidate evaluation is performed and the candidates are known in advance, a useful practice is also to lift the string a few centimeters above the tubing hanger before setting the packer; once the packer is set, the string is in a compression state (slack off on the packer) that acts against downward forces. If selective completion is used, the annulus pressure is not seen by the lowest packer (usually the one involved in the fracture). Cement Bond Quality. Cement bond analysis was double checked for all the HF treatments performed (CBL and VDL logs). In order to perform a good treatment in the desired zone it is important to get zonal isolation; without it the risk to pump the treatment outside the target zone has to be taken into account. A recent analysis carried out on the logs of old wells fractured revealed the following statistic:
• 42% of wells had a good cement bond, • 28 % of wells had a satisfactory quality and • 28 % of wells had a poor quality and the HF could have been risky.
It is interesting to notice that according to production results 75 % of the poor cement bond quality experienced the highest improvement in terms of production after frac. For the infilling wells, in the whole campaign only 2 wells had poor cement bond quality. Perforation for HF. In conventional reservoir where HF is not necessary, a long perforated interval is the best solution; many studies show a direct relationship between mechanical skin and partial penetration, suggesting that the entire interval should be perforated. For unconventional reservoir where HF is needed, the perforated interval should be carefully designed in order to reduce any possible issue that can compromise the frac treatment. A short perforated interval is preferable rather than long intervals, in order to concentrate the energy at the frac starting point, reducing the risk of tortuosity and multiple fractures.

SPE 151860 5
As described in the field overview paragraph, the presence of multiple GOCs, and WOCs required big efforts in order to concentrate the fracturing treatment in the desired zones, Ceccarelli et al. (2010). Regarding perforation for fracturing, a misleading concept is also the possibility to consider a re-perforation job after frac, in order to increase the wellbore-fracture connection. Without considering the case of a deviated well (which is even worse) it has been proved by PLT that perforation contributing to production after fracturing are the same perforations used to create the fracture itself, while little or no contribution comes from the remaining perforated interval. Not all the shot perforations will contribute to create the fracture: the ones aligned with the PFP (Preferred Fracture Plane) will highly be the most contributing. Rigless Operations (Sand Plug) A statistic of the timing for these operations is presented in fig. 4 below. The estimated production gained with HF compared to the do-nothing scenario is estimated to be around 815 K bbls.
0,0
1,0
2,0
3,0
4,0
5,0
Pump Sand Plug Frac well clean up
days
RIGLESS OPS TIMING/WELL
well A
well B
well C
well D
well E
well F
0,0
0,5
1,0
1,5
2,0
Pump Sand Plug Frac well clean up
days
AVERAGE RIGLESS TIME OPS
Fig. 4 – Operations timing for rigless sand plug.
Workover Operations (cement squeeze & reperf) The work-over unit (owned by eni Congo & Partners) used in these operations is a Wilson Mogul 42 S trailer rig, build 1981. The main characteristics of the unit are:
• mast 112 ft x 300.000# • 160 ton Ideco UTB block /hook • telescopic substructure 15 ft high • rotary table, mechanical drive • rig pump: single acting triplex pump, 350 hp, Pump capacity: ~700 l/min. – 5.2 l /stroke.
Fig 5 – Work-over unit
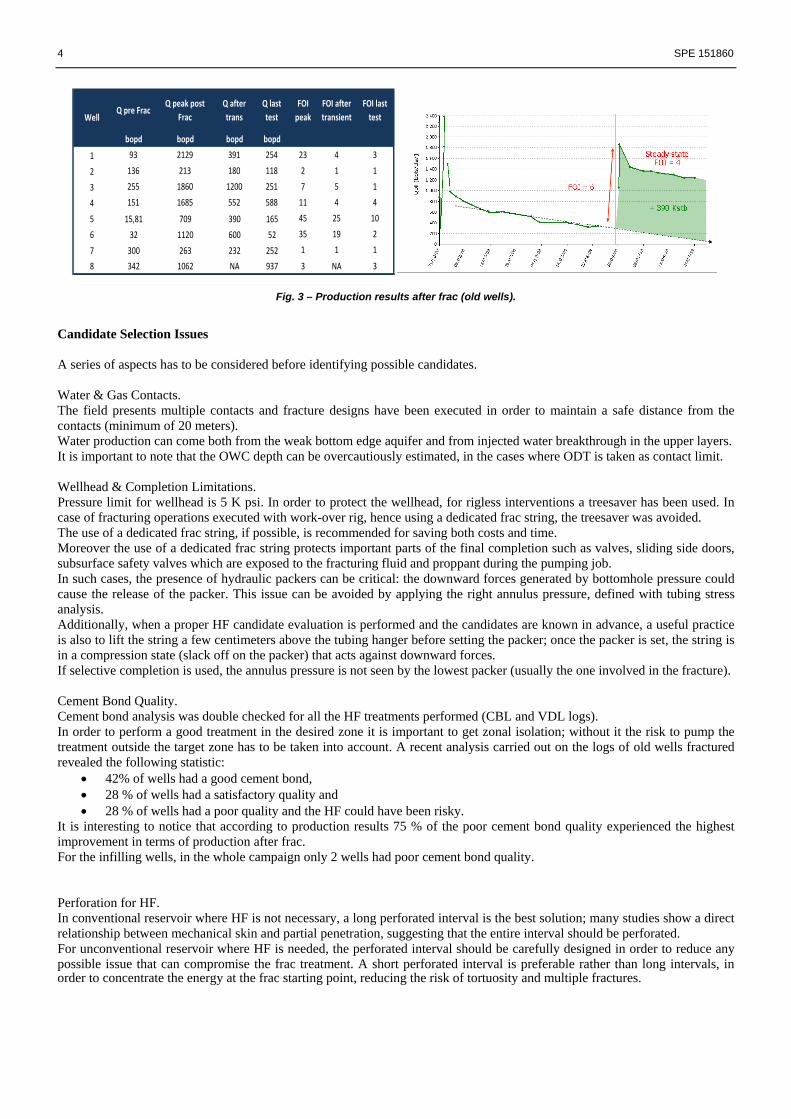
The OPS timing for these operations is presented below. It is possible to observe that the most time-consuming phase is the cement squeezing of old perforated intervals (10 days in average). A further analysis revealed a clear relationship between time and the length of the “exposed perfs” (the term exposed perfs refers to the perforations squeezed with cement, then drilled hence exposed to the fracture pressure during the treatment). The cement drilling operation after squeeze-job represents an important part of the whole operation. The length of the squeezed perforations varies in a range of 68-125 m with an average value of 106 m.
6 SPE 151860
0
2
4
6
8
10
12
14
16
18
20
days
WO OPS TIMING/WELL
well A
well B
well C
well D
well E
well F
well G
0,0
2,0
4,0
6,0
8,0
10,0
12,0
days
AVERAGE WO OPS TIMING
Fig. 6 – Operations timing for squeeze re-perf & frac.
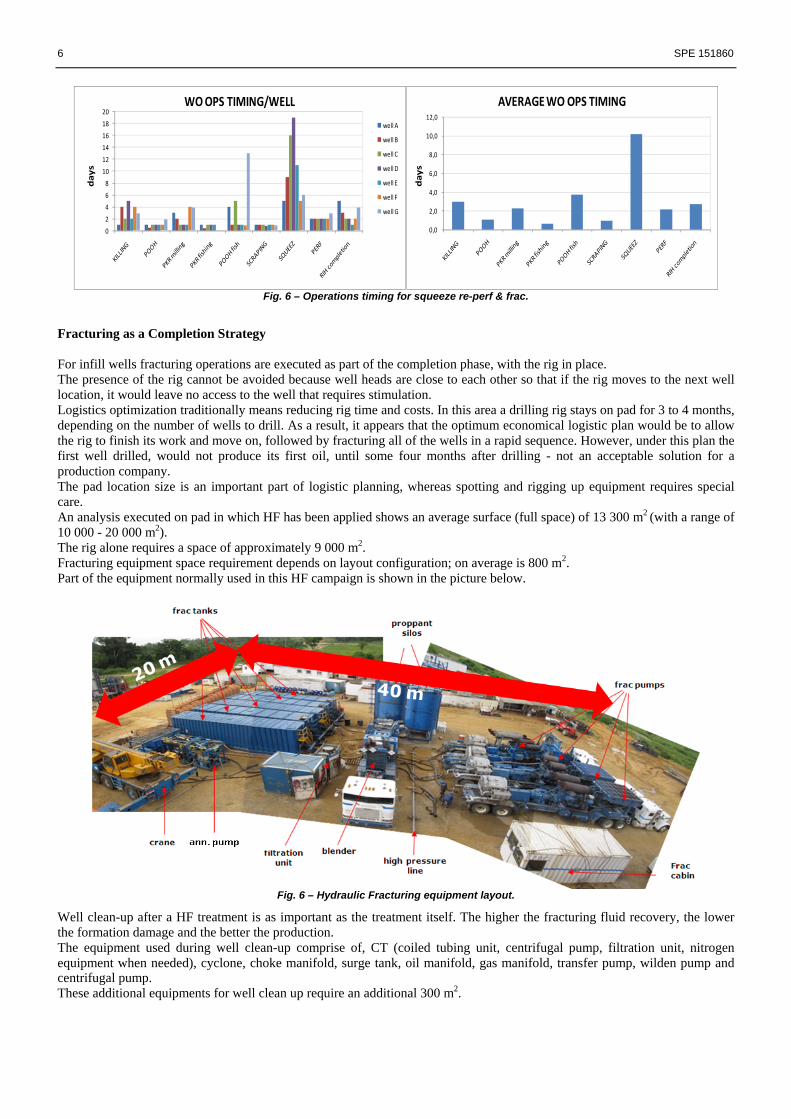
Fracturing as a Completion Strategy For infill wells fracturing operations are executed as part of the completion phase, with the rig in place. The presence of the rig cannot be avoided because well heads are close to each other so that if the rig moves to the next well location, it would leave no access to the well that requires stimulation. Logistics optimization traditionally means reducing rig time and costs. In this area a drilling rig stays on pad for 3 to 4 months, depending on the number of wells to drill. As a result, it appears that the optimum economical logistic plan would be to allow the rig to finish its work and move on, followed by fracturing all of the wells in a rapid sequence. However, under this plan the first well drilled, would not produce its first oil, until some four months after drilling - not an acceptable solution for a production company. The pad location size is an important part of logistic planning, whereas spotting and rigging up equipment requires special care. An analysis executed on pad in which HF has been applied shows an average surface (full space) of 13 300 m2 (with a range of 10 000 - 20 000 m2). The rig alone requires a space of approximately 9 000 m2. Fracturing equipment space requirement depends on layout configuration; on average is 800 m2. Part of the equipment normally used in this HF campaign is shown in the picture below.
Fig. 6 – Hydraulic Fracturing equipment layout.
Well clean-up after a HF treatment is as important as the treatment itself. The higher the fracturing fluid recovery, the lower the formation damage and the better the production. The equipment used during well clean-up comprise of, CT (coiled tubing unit, centrifugal pump, filtration unit, nitrogen equipment when needed), cyclone, choke manifold, surge tank, oil manifold, gas manifold, transfer pump, wilden pump and centrifugal pump. These additional equipments for well clean up require an additional 300 m2.
SPE 151860 7
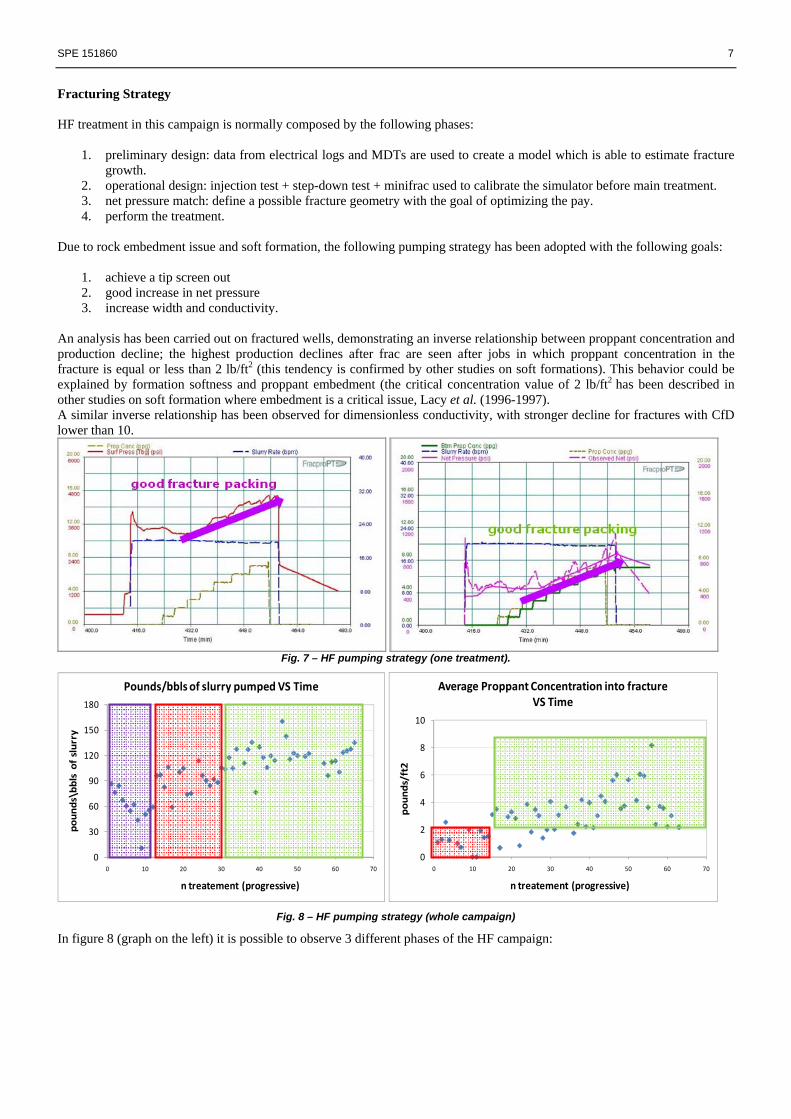
Fracturing Strategy HF treatment in this campaign is normally composed by the following phases:
1. preliminary design: data from electrical logs and MDTs are used to create a model which is able to estimate fracture growth.
2. operational design: injection test + step-down test + minifrac used to calibrate the simulator before main treatment. 3. net pressure match: define a possible fracture geometry with the goal of optimizing the pay. 4. perform the treatment.
Due to rock embedment issue and soft formation, the following pumping strategy has been adopted with the following goals:
1. achieve a tip screen out 2. good increase in net pressure 3. increase width and conductivity.
An analysis has been carried out on fractured wells, demonstrating an inverse relationship between proppant concentration and production decline; the highest production declines after frac are seen after jobs in which proppant concentration in the fracture is equal or less than 2 lb/ft2 (this tendency is confirmed by other studies on soft formations). This behavior could be explained by formation softness and proppant embedment (the critical concentration value of 2 lb/ft2 has been described in other studies on soft formation where embedment is a critical issue, Lacy et al. (1996-1997). A similar inverse relationship has been observed for dimensionless conductivity, with stronger decline for fractures with CfD lower than 10.
Fig. 7 – HF pumping strategy (one treatment).
0
30
60
90
120
150
180
0 10 20 30 40 50 60 70
poun
ds\bbls of slurry
n treatement (progressive)
Pounds/bbls of slurry pumped VS Time
0
2
4
6
8
10
0 10 20 30 40 50 60 70
poun
ds/ft2
n treatement (progressive)
Average Proppant Concentration into fracture VS Time
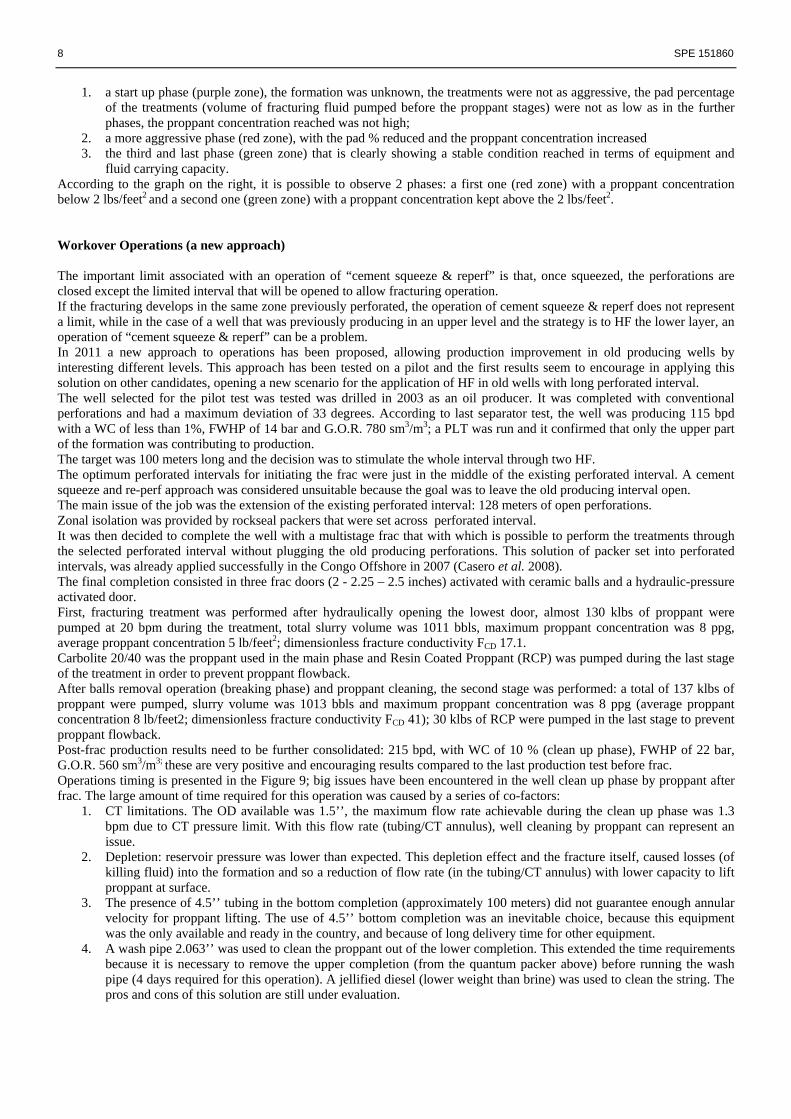
Fig. 8 – HF pumping strategy (whole campaign)
In figure 8 (graph on the left) it is possible to observe 3 different phases of the HF campaign:
8 SPE 151860
1. a start up phase (purple zone), the formation was unknown, the treatments were not as aggressive, the pad percentage of the treatments (volume of fracturing fluid pumped before the proppant stages) were not as low as in the further phases, the proppant concentration reached was not high;
2. a more aggressive phase (red zone), with the pad % reduced and the proppant concentration increased 3. the third and last phase (green zone) that is clearly showing a stable condition reached in terms of equipment and
fluid carrying capacity. According to the graph on the right, it is possible to observe 2 phases: a first one (red zone) with a proppant concentration below 2 lbs/feet2 and a second one (green zone) with a proppant concentration kept above the 2 lbs/feet2. Workover Operations (a new approach) The important limit associated with an operation of “cement squeeze & reperf” is that, once squeezed, the perforations are closed except the limited interval that will be opened to allow fracturing operation. If the fracturing develops in the same zone previously perforated, the operation of cement squeeze & reperf does not represent a limit, while in the case of a well that was previously producing in an upper level and the strategy is to HF the lower layer, an operation of “cement squeeze & reperf” can be a problem. In 2011 a new approach to operations has been proposed, allowing production improvement in old producing wells by interesting different levels. This approach has been tested on a pilot and the first results seem to encourage in applying this solution on other candidates, opening a new scenario for the application of HF in old wells with long perforated interval. The well selected for the pilot test was tested was drilled in 2003 as an oil producer. It was completed with conventional perforations and had a maximum deviation of 33 degrees. According to last separator test, the well was producing 115 bpd with a WC of less than 1%, FWHP of 14 bar and G.O.R. 780 sm3/m3; a PLT was run and it confirmed that only the upper part of the formation was contributing to production. The target was 100 meters long and the decision was to stimulate the whole interval through two HF. The optimum perforated intervals for initiating the frac were just in the middle of the existing perforated interval. A cement squeeze and re-perf approach was considered unsuitable because the goal was to leave the old producing interval open. The main issue of the job was the extension of the existing perforated interval: 128 meters of open perforations. Zonal isolation was provided by rockseal packers that were set across perforated interval. It was then decided to complete the well with a multistage frac that with which is possible to perform the treatments through the selected perforated interval without plugging the old producing perforations. This solution of packer set into perforated intervals, was already applied successfully in the Congo Offshore in 2007 (Casero et al. 2008). The final completion consisted in three frac doors (2 - 2.25 – 2.5 inches) activated with ceramic balls and a hydraulic-pressure activated door. First, fracturing treatment was performed after hydraulically opening the lowest door, almost 130 klbs of proppant were pumped at 20 bpm during the treatment, total slurry volume was 1011 bbls, maximum proppant concentration was 8 ppg, average proppant concentration 5 lb/feet2; dimensionless fracture conductivity FCD 17.1. Carbolite 20/40 was the proppant used in the main phase and Resin Coated Proppant (RCP) was pumped during the last stage of the treatment in order to prevent proppant flowback. After balls removal operation (breaking phase) and proppant cleaning, the second stage was performed: a total of 137 klbs of proppant were pumped, slurry volume was 1013 bbls and maximum proppant concentration was 8 ppg (average proppant concentration 8 lb/feet2; dimensionless fracture conductivity FCD 41); 30 klbs of RCP were pumped in the last stage to prevent proppant flowback. Post-frac production results need to be further consolidated: 215 bpd, with WC of 10 % (clean up phase), FWHP of 22 bar, G.O.R. 560 sm3/m3; these are very positive and encouraging results compared to the last production test before frac. Operations timing is presented in the Figure 9; big issues have been encountered in the well clean up phase by proppant after frac. The large amount of time required for this operation was caused by a series of co-factors:
1. CT limitations. The OD available was 1.5’’, the maximum flow rate achievable during the clean up phase was 1.3 bpm due to CT pressure limit. With this flow rate (tubing/CT annulus), well cleaning by proppant can represent an issue.
2. Depletion: reservoir pressure was lower than expected. This depletion effect and the fracture itself, caused losses (of killing fluid) into the formation and so a reduction of flow rate (in the tubing/CT annulus) with lower capacity to lift proppant at surface.
3. The presence of 4.5’’ tubing in the bottom completion (approximately 100 meters) did not guarantee enough annular velocity for proppant lifting. The use of 4.5’’ bottom completion was an inevitable choice, because this equipment was the only available and ready in the country, and because of long delivery time for other equipment.
4. A wash pipe 2.063’’ was used to clean the proppant out of the lower completion. This extended the time requirements because it is necessary to remove the upper completion (from the quantum packer above) before running the wash pipe (4 days required for this operation). A jellified diesel (lower weight than brine) was used to clean the string. The pros and cons of this solution are still under evaluation.

SPE 151860 9
Unfortunately at the end of the operation it was not possible to open the upper frac port (a damage of the port seat is highly suspected, probably caused during the ball-removal phase). It was decided to produce the well and then re-perforate wireline, connecting the previous producing interval in a second phase. The second CT lifting attempt was successful; at this point the operation could have ended, but being a pilot application, it was decided to close all the frac ports and test them selectively, one by one. The first test shown that the lowest interval (hydraulic frac port) was not producing. The second one (ball-activated) was effectively contributing. Finally the only upper HF treatment was tested and the production confirmed. It is possible to observe the cumulative time for the entire job in blue in the graph below, while in green is presented the forecasted time for the next job: thanks to the lesson learned during the first job a 24 days reduction is expected in the next jobs:
1. HF will focus only in the upper part of the low permeability layers (after rock typing new approach the most promising zone was defined) with one frac stage and the optimization of ball-launching/breaking operations)
2. CT operations (cleaning and lifting) will be optimized.
0
10
20
30
40
50
60
days
cumulative time VS OPS
first application
forecast time reduction‐‐>lesson learned
WO 6RIH low. comp. 4
Frac 1 1Clean. & Ball launch 11
Frac 2 1ball break. 6
RIH upp. comp. 2CT lift. 1st attempt 5CT lift. 2nd att. 8CT lift. 3rd att. 10
OPS days
Fig. 9 – Operation timing of the new work-over approach, and time optimization process (green side) .
Conclusions & Recommendations
1. HF in Congo Onshore represents a consolidated reality and a standard development approach; it is not a remedial job for well with low production. The estimated cumulative production recovered through the old wells fractured (30 % of all fractured) is more than 2 000 Kbbls.
2. Lab tests are crucial for success especially in the case of HF as development strategy. In this case, lab test revealed a soft formation with embedment issue.
3. In presence of soft formation, a fracture treatment design with an average proppant concentration above 2 lb/ft2 and dimensionless fracture conductivity CfD of 10 are recommended (Lacy et al. 1996 - 1997).
4. Candidate selections for HF takes in consideration as main aspects: a. Water & gas contacts b. Cement bond quality c. Wellhead & completion limitations d. Zonal isolation
5. Well clean up after frac is critical. The quicker the well clean up, the lower the reservoir damage caused by the fracturing fluid. In the case of infill wells fractured with rig in place, space limitations can represent an issue.
6. Fracturing below squeezed perforated interval is a good solution in the case where sand plug is not applicable. 7. A new approach for fracturing producing wells in the lower and worse part of the reservoir keeping in production the
upper perforated interval was tested, the results are encouraging further applications: a) It is strongly recommended to monitor both fluid and solid returns during CT proppant cleanout to evaluate
effectiveness of the operations. b) Annulus between CT and tubing must not be too large: CT size must be adequate for the string size. c) In case of depleted reservoirs and for proppant clean up a possible solution is represented by jellified diesel.
10 SPE 151860
Acknowlwdgements The authors would like to thank eni Congo’s Drilling & Completion Department for their great support in this campaign; eni Congo’s Reservoir Department for its kind cooperation. We extend our gratitude to eni E&P Production Optimization Department for their constant support and advices. References
1. Shaoul, J.R., W. Spitzer, S. Mendenhall, S. Soufi, and S. Aloun, (2008)_Optimizing Hydraulic Fracturing in a Mature Oil
Reservoir in Algeria. SPE 112867 presented at the 2008 SPE North Africa Technical Conference and Exhibition, Marrakech, Morocco, 12-14 March.
2. Burnstad, R.G., Martin, A.N., Stemberger, D.J. and Purwanto, B. (2004) A Case Study of a Mature Field Redevelopment Using Propped Hydraulic Fracturing. SPE 88604, presented at the SPE Asia Pacific Oil and Gas Conference and Exhibition, Perth, Australia, 18-20 October.
3. Ceccarelli, R.L., Pace, G., Casero, A., Ciuca, A. and Tambini, M. (2010) Perforating for Fracturing: Theory vs. Field Experiences. SPE 128270, presented at the SPE International Symposium and Exhibition on Formation Damage Control, Lafayette, Louisiana, 10-12 February.
4. Martin, A.N. and Economides, M.J. (2010): Best Practices for Candidate Selection. Design and Evaluation of Hydraulic Fracture Treatments, paper SPE 135669, presented at the SPE Production and Operations Conference and Exhibition, Tunis, Tunisia, 8-10 June.
5. Lacy, L.L. A.R. Rickard and D.M. Bilden (1996) Fracture Width and Embedment Testing in Soft Reservoir Sandstone. SPE 36421 presented at the 1996 SPE Annual Technical Conference and Exhibition, Denver 6-9 October.
6. Lacy, Lewis L., Allan R. Rickards, and Syed A. Ali (1997) Embedment and Fracture Conductivity in Soft Formations Associated with HSE, Borate and Water Based Fracture Designs. SPE 38590 presented at the 1997 SPE Annual Technical Conference and Exhibition, San Antonio, Texas, 5-8 October.
7. Casero, A., Pace, G., Malone, B., Cantaloube, F., Tealdi, L., Malonga, H. and Seale, R. (2008) Continuous Pumping, Multistage, Hydraulic Fracturing in Kitina Field, Offshore Congo, West Africa. SPE 112442, presented at the SPE International Symposium and Exhibition on Formation Damage Control held in Lafayette, Louisiana, 13-15 February.
8. Salazar, V., de la Rosa, V., Gomez, J., Quintana J., (2010) Cementing, Perforating and Fracturing Using Coiled Tubing: Rigless Completion Technique Developed for Marginal Field in Peru. SPE 138798, presented at the SPE Latin American & Caribbean Petroleum Engineering Conference held in Lima, Peru, 1-3 Decmber.
9. Casero, A., Tealdi, L., Ceccarelli, R.L., Ciuca, A., Pace, G., Malone, B. and Athans, J. (2009) Multiple Transverse Fracturing in Open Hole Allows Development of a Low Permeability Reservoir in the Foukanda Field, Offshore Congo. SPE 119140, presented at the Hydraulic Fracturing Technology Conference, The Woodlands, Texas, 19-21 January.
10. Rhodes, D., Orski, K., Guittiene P., (2011) Hydrajet Fracture Stimulation Tecnique Used To Rejuvenate Three Wells In Mature Offshore Oil Field Congo – Case History. SPE 144117, presented at the SPE European Formation Damage Conference, Noordwijk, The Netherlands, 7-10 June.
11. Demarchos, A.S., Chomatas, A.S., Economides, M.J., Mach, J.M., and Woloctt, D.S. (2004) Pushing the Limits in Hydraulic Fracture Design. SPE 86483, presented at the SPE International Symposium and Exhibition on Formation Damage Control, Lafayette, Louisiana, 18-20 February.
12. Diyashev, I.R., Economides, M.J. (2005) A General Approach To Well Evaluation. SPE 94644, presented at the SPE Formation Damage Conference, Scheveningen, The Netherlands, 25-27 May.
13. Elgassier, M.M. and S.M. Stolyarov (2008) Reasons for Oil Based Hydraulic Fracturing in Western Siberia. SPE 112092, presented at the 2008 SPE International Symposium and Exhibition on Formation Damage Control, Lafayette, Louisiana, USA, 13-15 February.
14. Li, Yongming, Jianchun Guo, Yingchun Yue and Jinzhou Zhao, and Cunyong Guo (2008) The Study and Application of Fracturing optimization Technology for Complicated Fault Block Reservoir with Strong Water Sensitivity. SPE 114151 presented at the 2008 SPE Western Regional and Pacific AAPG Joint Meeting, Bakersfiled, California, 31 March – 2 April.
15. Zou, W., Amaravadi, S. and Roedsjoe, M. (2005) Valhall Field Coiled Tubing Post-Fracture Proppant Cleanout Process Optimization, paper SPE 94131, presented at the SPE/CoTA Coiled Tubing Conference and Exhibition, The Woodlands, Texas, 12-13 April.
16. M. Rotondi, A. Binda, M. Draoui, A. Tsoumou, L. Tealdi, (2011) Monitoring and Improving Water Injection Efficiency in a Structurally Complex Field. SPE 146817, presented at Annual Technical Conference & Exhibition, Denver, Colorado, 1-2 November.