SPE-137184-MS
10
SPE 137184 Statistical Approach for PCP Standardizing Jose Gamboa, Multiphase Systems Integration LLC Copyright 2010, Society of Petroleum Engineers This paper was prepared for presentation at the SPE Progressing Cavity Pumps Conference held in Edmonton, Alberta, Canada, 12–14 September 2010. This paper was selected for presentation by an SPE program committee following review of information contained in an abstract submitted by the author(s). Contents of the paper have not been reviewed by the Society of Petroleum Engineers and are subject to correction by the author(s). The material does not necessarily reflect any position of the Society of Petroleum Engineers, its officers, or members. Electronic reproduction, distribution, or storage of any part of this paper without the written consent of the Society of Petroleum Engineers is prohibited. Permission to reproduce in print is restricted to an abstract of not more than 300 words; illustrations may not be copied. The abstract must contain conspicuous acknowledgment of SPE copyright. Abstract The selection of a progressing cavity pump heavily relies on the expertise and experience of field personnel. Therefore, the selection of pumps for a large number of wells becomes an energy consuming and cost-effective task where heuristic prevails over an algorithmic procedure. This paper proposes a new approach that attempt to perform such task by combining multiphase calculations with well known pump selection criteria and statistical clustering method. The methodology requires massive information about the well completions, fluid properties and operation conditions that are utilized for predicting the pressure rising required, inlet volumetric gas fraction among other variables for every well in the field. Two approaches can be utilized to identify standardized pump models: hit frequency and K-mean algorithm. The standardized models for a particular well are considered equivalent pumps, which means that any of standardized models can be utilized in the same well wit h equivalent results. The proc ess also allows identif ying in how many wells a partic ular pump model can be utilized. A case study applying the standardizing methodology is presented. The case is a extra-heavy oil field where standardized pump models for 592 wells are re quired for futu re purchase. The methodology proposed is the first step to establish an analytical procedure for identifying standardized pump in a field. The elastomer selection needs to be added to the methodology for sake of completeness; however, it has been left out due to lack of predicting model for the elastomer swelling, thermal expansion and fluid-material chemical interaction. Introduction An early practice among oil operators was to select particular pump models for every well. It led to fields with multiple pump models from various manufacturers, which created a challenge for MTBF tracking, root cause analysis and failure detection. When catastrophic failure occurred, the practice was to switch manufacturer without further review of the failure cause. Thus, trial and error became a common practice for utilizing PC pumps in a field. The development of testing methodologies for elastomer and better understanding of the pump failure mechanism caused a radical change in how progressing cavity pump models are chosen for a field. Then, the goal was to reduce the number of pump models and manufacturers so a limited inventory can simplify the task associated with elastomer testing and selection. However, the pump selection heavily relies on the personnel expertise and experience because there is not defendable method for predicting the pump lifetime under certain operating conditions. Usually, engineers learnt how certain pump models performed based on their own experience. Pump models and manufacturers with a high rate of catastrophic failure were quickly discard, while pump models and manufacturers with high MTBF became standardized. Thus, the pump selection improves as the personnel acquire more expertise and experience while the standardized pump is a sub-product of the PCP development in a field. The heuristic related to the standardizing process may be reduced if an algorithmic procedure is implemented to identify those standardized pump models. The objective of this paper is to provide a first review on the standardizing process for progressing cavity pumps. The approach proposed involves the direct simulation of the pump operating conditions for each well within a well population. Once the calculation are completed, two methodologies can be utilized for indentifying the standardized pumps: hit frequency and clustering. The hit frequency consists of counting the number of hits or wells in which each pump model can be utilized. Those pumps with larger number of hits or wells are considered as standardized models. On the other hand, the clustering methodology is a classical technique where the wells are classified in group with common characteristics. The classical K-mean method is the clustering technique utilized for illustrating the methodology.
-
Upload
jose-timana -
Category
Documents
-
view
226 -
download
0
Transcript of SPE-137184-MS
8/9/2019 SPE-137184-MS
http://slidepdf.com/reader/full/spe-137184-ms 1/10
SPE 137184
Statistical Approach for PCP StandardizingJose Gamboa, Multiphase Systems Integration LLC
Copyright 2010, Society of Petroleum Engineers
This paper was prepared for presentation at the SPE Progressing Cavity Pumps Conference held in Edmonton, Alberta, Canada, 12–14 September 2010.
This paper was selected for presentation by an SPE program committee following review of information contained in an abstract submitted by the author(s). Contents of the paper have not beenreviewed by the Society of Petroleum Engineers and are subject to correction by the author(s). The material does not necessarily reflect any position of the Society of Petroleum Engineers, itsofficers, or members. Electronic reproduction, distribution, or storage of any part of this paper without the written consent of the Society of Petroleum Engineers is prohibited. Permission toreproduce in print is restricted to an abstract of not more than 300 words; illustrations may not be copied. The abstract must contain conspicuous acknowledgment of SPE copyright.
AbstractThe selection of a progressing cavity pump heavily relies on the expertise and experience of field personnel. Therefore, the
selection of pumps for a large number of wells becomes an energy consuming and cost-effective task where heuristic prevailsover an algorithmic procedure. This paper proposes a new approach that attempt to perform such task by combining
multiphase calculations with well known pump selection criteria and statistical clustering method.
The methodology requires massive information about the well completions, fluid properties and operation conditions that areutilized for predicting the pressure rising required, inlet volumetric gas fraction among other variables for every well in the
field. Two approaches can be utilized to identify standardized pump models: hit frequency and K-mean algorithm. The
standardized models for a particular well are considered equivalent pumps, which means that any of standardized models can
be utilized in the same well with equivalent results. The process also allows identifying in how many wells a particular pump
model can be utilized.A case study applying the standardizing methodology is presented. The case is a extra-heavy oil field where standardized
pump models for 592 wells are required for future purchase.
The methodology proposed is the first step to establish an analytical procedure for identifying standardized pump in a field.The elastomer selection needs to be added to the methodology for sake of completeness; however, it has been left out due to
lack of predicting model for the elastomer swelling, thermal expansion and fluid-material chemical interaction.
IntroductionAn early practice among oil operators was to select particular pump models for every well. It led to fields with multiple pump
models from various manufacturers, which created a challenge for MTBF tracking, root cause analysis and failure detection.
When catastrophic failure occurred, the practice was to switch manufacturer without further review of the failure cause. Thus,
trial and error became a common practice for utilizing PC pumps in a field.The development of testing methodologies for elastomer and better understanding of the pump failure mechanism caused a
radical change in how progressing cavity pump models are chosen for a field. Then, the goal was to reduce the number of
pump models and manufacturers so a limited inventory can simplify the task associated with elastomer testing and selection.However, the pump selection heavily relies on the personnel expertise and experience because there is not defendable method
for predicting the pump lifetime under certain operating conditions. Usually, engineers learnt how certain pump models
performed based on their own experience. Pump models and manufacturers with a high rate of catastrophic failure were
quickly discard, while pump models and manufacturers with high MTBF became standardized.
Thus, the pump selection improves as the personnel acquire more expertise and experience while the standardized pump is asub-product of the PCP development in a field. The heuristic related to the standardizing process may be reduced if an
algorithmic procedure is implemented to identify those standardized pump models. The objective of this paper is to provide a
first review on the standardizing process for progressing cavity pumps. The approach proposed involves the direct simulation
of the pump operating conditions for each well within a well population. Once the calculation are completed, twomethodologies can be utilized for indentifying the standardized pumps: hit frequency and clustering. The hit frequency
consists of counting the number of hits or wells in which each pump model can be utilized. Those pumps with larger number
of hits or wells are considered as standardized models. On the other hand, the clustering methodology is a classical techniquewhere the wells are classified in group with common characteristics. The classical K-mean method is the clustering technique
utilized for illustrating the methodology.
8/9/2019 SPE-137184-MS
http://slidepdf.com/reader/full/spe-137184-ms 2/10
2 SPE 137184
Pump Selection Method- Hydraulic Pump DesignThe selection of a progressing cavity pump is a stepwise problem. First, the type of pump (single lobe or multi-lobe), the
pump geometry (displacement, pitch and number of stage) and the rotational speed are determined from the pressure rising(total head) required, free volumetric gas fraction and total flow rate. Next, the stator material and rotor-stator fit are chosen
based on the fluid temperature, fluid characteristics, fluid-material compatibility, presence of fines and fluid viscosity. The
first process is known as hydraulic design while the second process is often referred as material selection.
The hydraulic design of an PCP involves the determination of total flow rate, inlet gas fraction, intake pressure and
temperature, discharge pressure and pressure rising required. This information is utilized for calculating the rotational speed,rotor-stator fit and number of stage. The procedure for hydraulic design may vary according the aim pursed. In this case, it is
assumed that oil flow rate, well inflow relationship, gas-oil ratio (GOR ), water cut (WC ), pump setting depth and tubing/rod
string are known.Because the oil flow rate is known, the well flowing pressure can be obtained from the well inflow relationship (IPR). The
pump inlet pressure is obtained as algebraic sum of well flowing pressure and the pressure losses between the pump inlet and
the perforation. Next, the pump discharge pressure is calculated by adding the tubing pressure losses to the wellhead pressure. In both cases, the pressure losses are calculated utilizing a multiphase flow model or correlation. The pressure rising
required for the system is then calculated as,
I D p p p −=∆ (1)
There are two methods to determine the number of stages based on pressure rising required: the maximum pressure per stage
and the maximum pressure rising. The maximum pressure per stage (MPPS) is a heuristic value defined by manufacturersand vendor, which is based on the field experience and lab tests. The number of stages based on MPSS is calculated as
follows,
stage p
p stage
max,
#∆
∆= (2)
The alternative method is to compare the pump maximum pressure rising ( max p∆ ) to the pressure rising required. The
max p∆ is obtained as the pressure increment across the pump at 80% volumetric efficiency for the maximum rotational speed
recommended by manufacturer. A common practice is to calculate pump loading capacity based on max p∆ . This factor is
defined as ratio of pump maximum and required pressure rising (see Eq. 3)
p
p
∆
∆=
maxFactor Loading (3)
Thus, pump models with loading factor larger than 4 are very long pump where the torque may become an issue. On the other
hand, the pump reliability may be compromise for loading factor smaller than 1.2.
The pump displacement ( D ) is related to the total flow rate as shown in Eq. 4. The volumetric efficiency ( v E ) is often set at
a value between 80% and 100% . The rotational speed ( N ) is either suggested by the manufacturer or limited by the
drivehead structural loading and braking capability. Often it ranges between 200 rpm and 300 rpm.
N E
q Dv
T = (4)
If one assume a 80% volumetric efficiency and 300 rpm rotational speed, Eq. 4 becomes,
T q D 0.00417= (5)
The total flow rate ( T q ) is computed as follows,
( ) std owo sep g T qWC
WC B B E
WC
WC Rsw RsGOR Bq ,
11
1178.0 ⎥
⎦
⎤⎢⎣
⎡
−++−⎟
⎠
⎞⎜⎝
⎛
−−−= (6)
8/9/2019 SPE-137184-MS
http://slidepdf.com/reader/full/spe-137184-ms 3/10
SPE 137184 3
In this equation, Rs and Rsw are the gas solubility in oil and water, respectively. While, g B , o B and w B are the gas, oil
and water volumetric factors at the inlet pressure and temperature. These variables are either estimated by black-oil
correlations or calculated utilizing a compositional model. The produced gas-oil ratio (GOR), water cut (WC ) and oil flow
rate ( std oq , )referred at standard conditions are assumed as known variables; however, the gas separation efficiency ( sep E ) is
often unknown. The gas separation efficiency is defined as the ratio of actual gas flow rate flowing through the casing-tubing
annulus ( c g q , ) to the actual gas flow rate ( g q ) coming from the reservoir at the pump inlet temperature and pressure (see
Eq. 7).
g
c g sepq
q E
,= (7)
The downhole gas separation efficiency ( sep E ) is set at values between 50% and 90%. However, there is some correlations
and mechanistic model available for predicting the natural separation efficiency. In this study, Alhanati's (1993) simplifiedmodel is utilized for predicting the natural separation efficiency.
The selection of pump models for a wells is summarized as follows,
(1) Pick a pump model from the catalog, which can fit within casing drift diameter
(2) Because the oil flow rate is known, the total flow rate can be determined from Eq. 6.
(3) Rotational speed is calculated from Eq. 5 utilizing pump displacement reported by the manufacture(4) Calculate the pressure rising required from Eq. 1
(5) Determine the pump loading factor.
(6) if the rotational speed and loading factor are between certain range, the pump is considered as a candidate pumpmodels for this well.
The pumps obtained from this process are candidate because the elastomer selection needs to be carried out. Finally, the inlet
volumetric gas fraction is a critical factor in the pump reliability. A well can be produced with a PC pump if the volumetricgas fraction is smaller than 60%. Thus, any well with a volumetric gas fraction above 60% is discard for PC pump
installation.
Standardizing Pump Model ProcedureThe pump standardization refers to approaches for increasing commonality of either pump models or pump vendors utilized
in a particular field. The goal is to reduce the variability found in having many pump models and pump vendors.A pump model is considered standardized when it satisfies the hydraulic design criteria aforementioned in several wells
within a field. It implies that pump inlet volumetric gas fraction, discharge pressure, intake pressure and total flow rate arecalculated for each well. This process is called direct simulation.Once these calculation are completed, the rotational speed and loading factor are determined for specific pump models. The
pump models that satisfy the rotational speed and loading factor criteria in every well are tagged as candidate models. Then,
the simplest way to recognize those standardized pump models is to search common pump models between wells. In otherwords, those candidate models that appear more often are tagged as standardized models. Therefore, this method has been
called hit frequency.
The alternative approach is to classify the candidate models in groups that share common characteristics. This technique
known as clustering has the objective of building some natural subgroups or clusters that are similar according to some
appropriate criterion. Ten Eikelder et al (2004) stated the clustering is basically an optimization problem in which objectshave to be grouped in such way that some given cluster quality function is optimal. Often the quality of a cluster is given by
the squared error,
∑==
k
s s E E
1 (10)
where the cluster error s E is given as,
∑∈
−=
S C ji
ji s
s x xn
E
,
21 (11)
Hence the problem is to find a clustering sC that minimizes E . Various clustering algorithms are available for that aim,
namely, local search, unsupervised competitive neural networks, K-mean algorithm, hierarchical clustering and supportvector machine. The classical K-mean algorithm is utilized in this paper for illustrating the methodology.
Both methods hit frequency and clustering provide enough information that the following scenarios can be present,
• Pump models from same manufacturers can be identified for the same well
• Pump models from different manufacturers can be identified for the same well
8/9/2019 SPE-137184-MS
http://slidepdf.com/reader/full/spe-137184-ms 4/10
4 SPE 137184
• Wells that can utilize the same pump model are identified
• Most frequent pump models in a field can be identified
However, the clustering technique has an advantage over the hit frequency. The clustering can be utilized for creating a
classification system that can be utilized during the well production lifetime. For instance, let's assume that a certain well hasa high oil production while gas and water flow rates are low. The requirement of pressure rising is high so the well is
classified into intermediate displacement/high head group. After some years, the oil production declines while the water and
gas production increase. The well is then classified into large displacement/high head group. Then the water and oil
production declines even more, but the gas is dominant so the well is classified as large displacement/low head. Finally, thegas production increase until the point that the displacement required is out of chart, which means there is not PC pump
available to produce this well.
Case StudyField Description
The field studied is an depleted extra-heavy oil located at Western of Venezuela. The reservoir pressure has dropped down to
350 psig so most wells are produced at 50 psig well flowing pressure. These are vertical wells that are being produced with
rod pumping, which are located in densely populated areas. The goal is to replace the rod pumps by progressing cavity pump(PC Pumps) in 592 wells out of total well population. These wells are considered marginal or abandon so little information
about PVT is available. The reservoir is classified as saturated while the main drive mechanism is solution gas drive. The oil
production of these wells ranges between 10 stbpd and 353 stbpd, while the GOR is around at 200 scf/stb (solubility gas-oil
ratio for the reservoir).
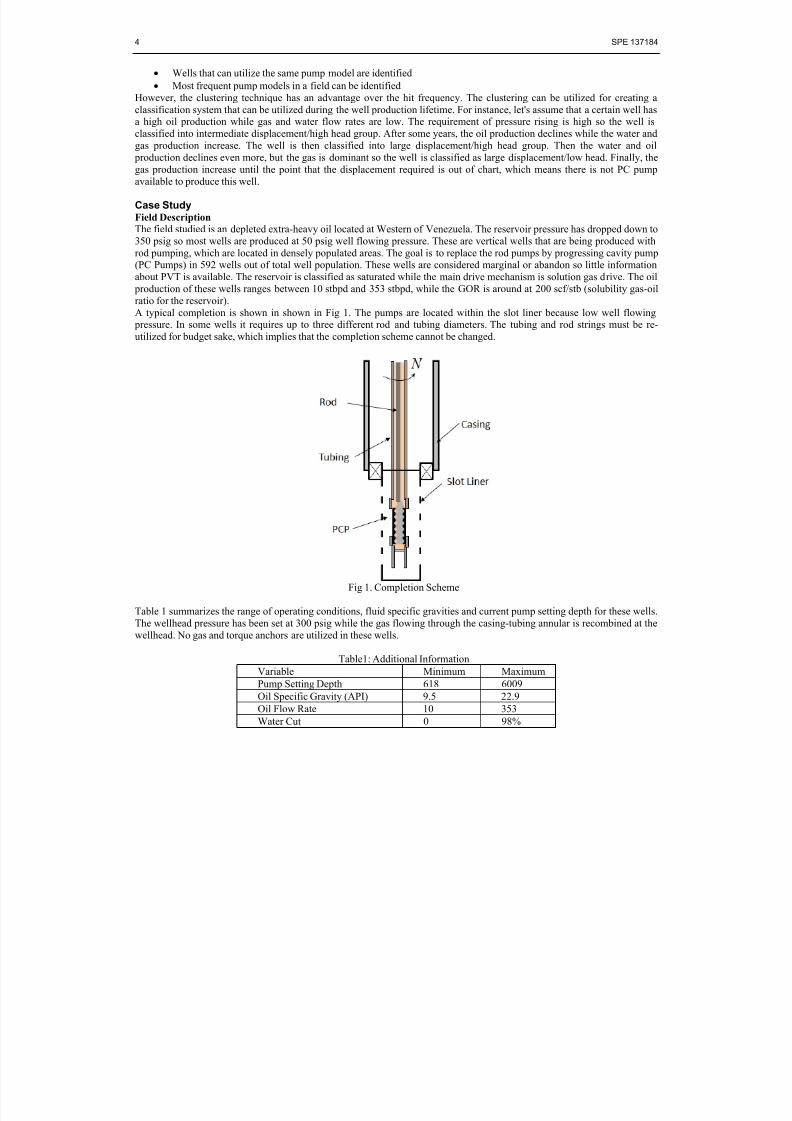
A typical completion is shown in shown in Fig 1. The pumps are located within the slot liner because low well flowing pressure. In some wells it requires up to three different rod and tubing diameters. The tubing and rod strings must be re-
utilized for budget sake, which implies that the completion scheme cannot be changed.
Fig 1. Completion Scheme
Table 1 summarizes the range of operating conditions, fluid specific gravities and current pump setting depth for these wells.
The wellhead pressure has been set at 300 psig while the gas flowing through the casing-tubing annular is recombined at the
wellhead. No gas and torque anchors are utilized in these wells.
Table1: Additional Information
Variable Minimum Maximum
Pump Setting Depth 618 6009
Oil Specific Gravity (API) 9.5 22.9
Oil Flow Rate 10 353
Water Cut 0 98%
8/9/2019 SPE-137184-MS
http://slidepdf.com/reader/full/spe-137184-ms 5/10
SPE 137184 5
Results
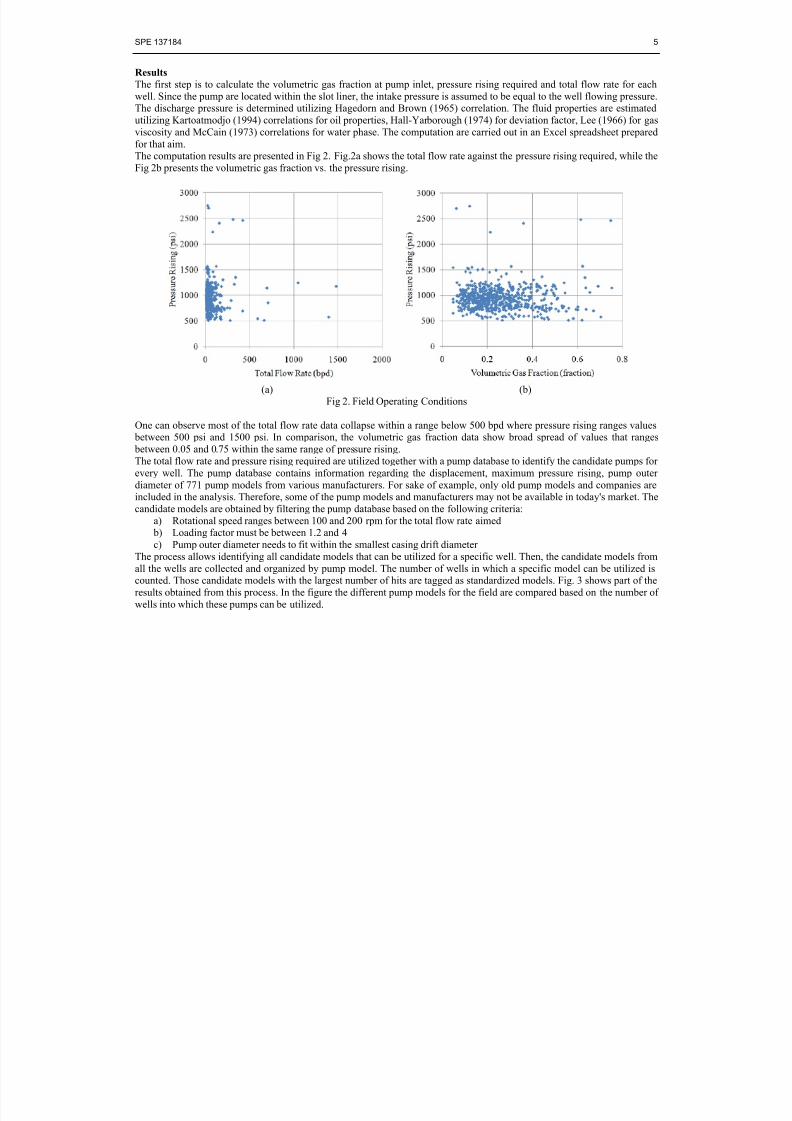
The first step is to calculate the volumetric gas fraction at pump inlet, pressure rising required and total flow rate for each
well. Since the pump are located within the slot liner, the intake pressure is assumed to be equal to the well flowing pressure.The discharge pressure is determined utilizing Hagedorn and Brown (1965) correlation. The fluid properties are estimated
utilizing Kartoatmodjo (1994) correlations for oil properties, Hall-Yarborough (1974) for deviation factor, Lee (1966) for gas
viscosity and McCain (1973) correlations for water phase. The computation are carried out in an Excel spreadsheet prepared
for that aim.
The computation results are presented in Fig 2. Fig.2a shows the total flow rate against the pressure rising required, while theFig 2b presents the volumetric gas fraction vs. the pressure rising.
(a) (b)Fig 2. Field Operating Conditions
One can observe most of the total flow rate data collapse within a range below 500 bpd where pressure rising ranges values between 500 psi and 1500 psi. In comparison, the volumetric gas fraction data show broad spread of values that ranges
between 0.05 and 0.75 within the same range of pressure rising.
The total flow rate and pressure rising required are utilized together with a pump database to identify the candidate pumps for
every well. The pump database contains information regarding the displacement, maximum pressure rising, pump outerdiameter of 771 pump models from various manufacturers. For sake of example, only old pump models and companies areincluded in the analysis. Therefore, some of the pump models and manufacturers may not be available in today's market. The
candidate models are obtained by filtering the pump database based on the following criteria:
a) Rotational speed ranges between 100 and 200 rpm for the total flow rate aimed b) Loading factor must be between 1.2 and 4
c) Pump outer diameter needs to fit within the smallest casing drift diameter
The process allows identifying all candidate models that can be utilized for a specific well. Then, the candidate models from
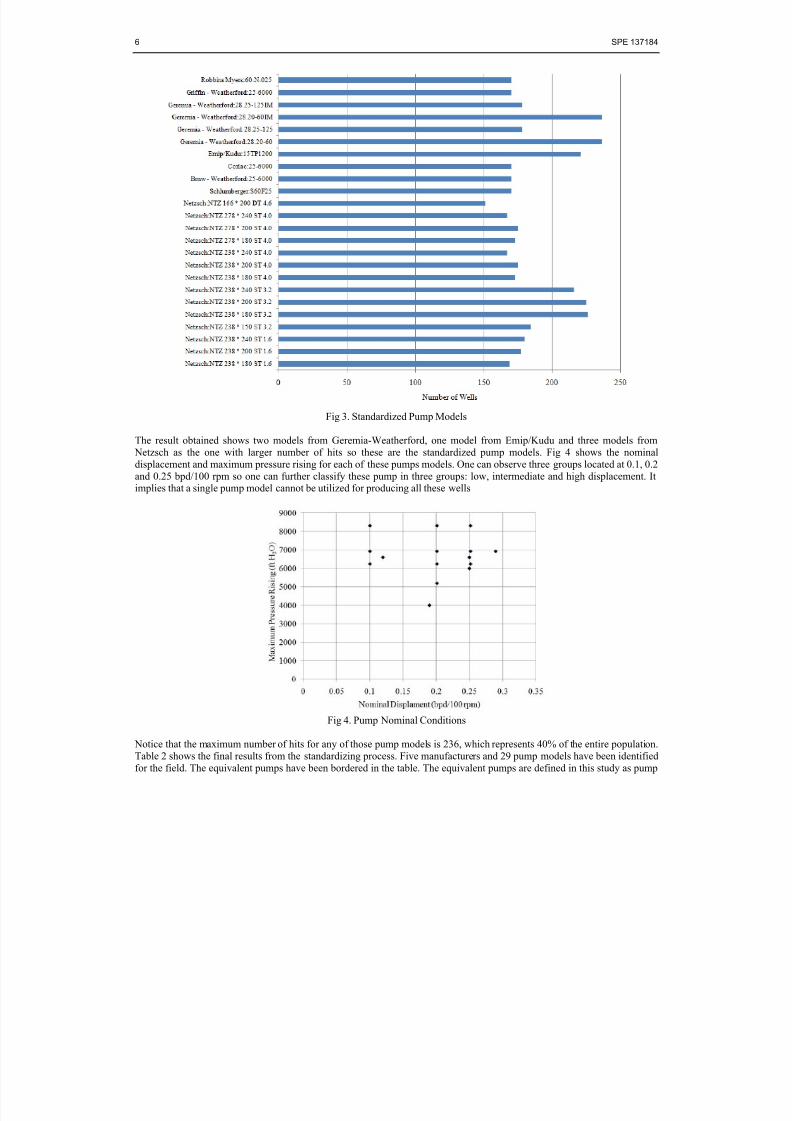
all the wells are collected and organized by pump model. The number of wells in which a specific model can be utilized iscounted. Those candidate models with the largest number of hits are tagged as standardized models. Fig. 3 shows part of the
results obtained from this process. In the figure the different pump models for the field are compared based on the number of
wells into which these pumps can be utilized.
8/9/2019 SPE-137184-MS
http://slidepdf.com/reader/full/spe-137184-ms 6/10
6 SPE 137184
Fig 3. Standardized Pump Models
The result obtained shows two models from Geremia-Weatherford, one model from Emip/Kudu and three models from
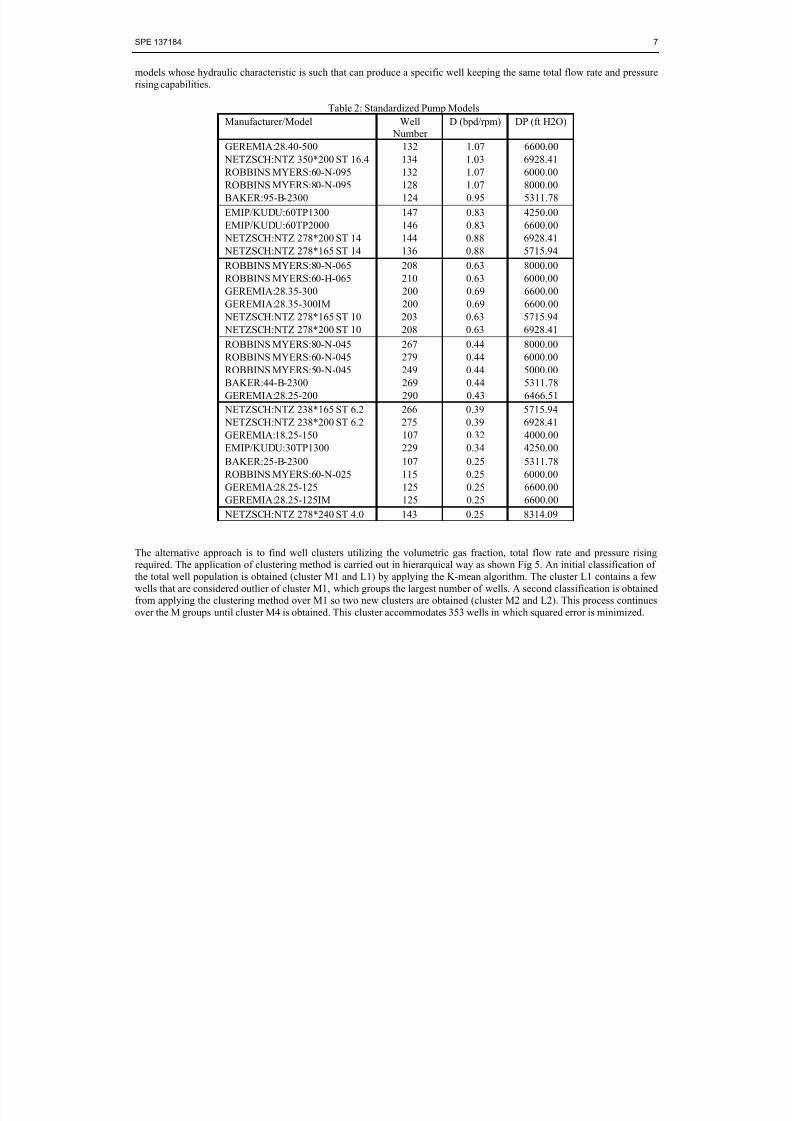
Netzsch as the one with larger number of hits so these are the standardized pump models. Fig 4 shows the nominal
displacement and maximum pressure rising for each of these pumps models. One can observe three groups located at 0.1, 0.2
and 0.25 bpd/100 rpm so one can further classify these pump in three groups: low, intermediate and high displacement. Itimplies that a single pump model cannot be utilized for producing all these wells
Fig 4. Pump Nominal Conditions
Notice that the maximum number of hits for any of those pump models is 236, which represents 40% of the entire population.
Table 2 shows the final results from the standardizing process. Five manufacturers and 29 pump models have been identified
for the field. The equivalent pumps have been bordered in the table. The equivalent pumps are defined in this study as pump
8/9/2019 SPE-137184-MS
http://slidepdf.com/reader/full/spe-137184-ms 7/10
SPE 137184 7
models whose hydraulic characteristic is such that can produce a specific well keeping the same total flow rate and pressure
rising capabilities.
Table 2: Standardized Pump Models
Manufacturer/Model Well
Number
D (bpd/rpm) DP (ft H2O)
GEREMIA:28.40-500 132 1.07 6600.00
NETZSCH:NTZ 350*200 ST 16.4 134 1.03 6928.41ROBBINS MYERS:60-N-095 132 1.07 6000.00
ROBBINS MYERS:80-N-095 128 1.07 8000.00
BAKER:95-B-2300 124 0.95 5311.78
EMIP/KUDU:60TP1300 147 0.83 4250.00
EMIP/KUDU:60TP2000 146 0.83 6600.00
NETZSCH:NTZ 278*200 ST 14 144 0.88 6928.41
NETZSCH:NTZ 278*165 ST 14 136 0.88 5715.94
ROBBINS MYERS:80-N-065 208 0.63 8000.00
ROBBINS MYERS:60-H-065 210 0.63 6000.00
GEREMIA:28.35-300 200 0.69 6600.00
GEREMIA:28.35-300IM 200 0.69 6600.00
NETZSCH:NTZ 278*165 ST 10 203 0.63 5715.94 NETZSCH:NTZ 278*200 ST 10 208 0.63 6928.41
ROBBINS MYERS:80-N-045 267 0.44 8000.00
ROBBINS MYERS:60-N-045 279 0.44 6000.00
ROBBINS MYERS:50-N-045 249 0.44 5000.00
BAKER:44-B-2300 269 0.44 5311.78
GEREMIA:28.25-200 290 0.43 6466.51
NETZSCH:NTZ 238*165 ST 6.2 266 0.39 5715.94
NETZSCH:NTZ 238*200 ST 6.2 275 0.39 6928.41
GEREMIA:18.25-150 107 0.32 4000.00
EMIP/KUDU:30TP1300 229 0.34 4250.00
BAKER:25-B-2300 107 0.25 5311.78
ROBBINS MYERS:60-N-025 115 0.25 6000.00GEREMIA:28.25-125 125 0.25 6600.00
GEREMIA:28.25-125IM 125 0.25 6600.00
NETZSCH:NTZ 278*240 ST 4.0 143 0.25 8314.09
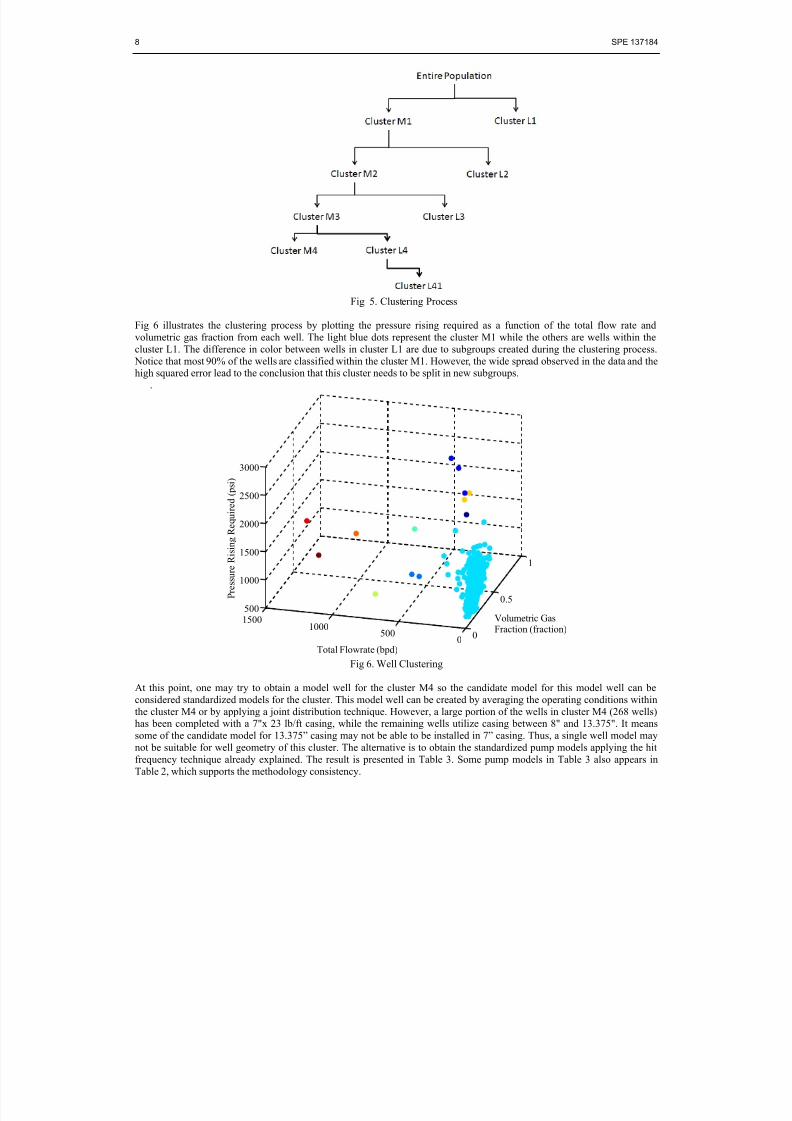
The alternative approach is to find well clusters utilizing the volumetric gas fraction, total flow rate and pressure risingrequired. The application of clustering method is carried out in hierarquical way as shown Fig 5. An initial classification of
the total well population is obtained (cluster M1 and L1) by applying the K-mean algorithm. The cluster L1 contains a few
wells that are considered outlier of cluster M1, which groups the largest number of wells. A second classification is obtainedfrom applying the clustering method over M1 so two new clusters are obtained (cluster M2 and L2). This process continues
over the M groups until cluster M4 is obtained. This cluster accommodates 353 wells in which squared error is minimized.
8/9/2019 SPE-137184-MS
http://slidepdf.com/reader/full/spe-137184-ms 8/10
8 SPE 137184
Fig 5. Clustering Process
Fig 6 illustrates the clustering process by plotting the pressure rising required as a function of the total flow rate and
volumetric gas fraction from each well. The light blue dots represent the cluster M1 while the others are wells within the
cluster L1. The difference in color between wells in cluster L1 are due to subgroups created during the clustering process.
Notice that most 90% of the wells are classified within the cluster M1. However, the wide spread observed in the data and thehigh squared error lead to the conclusion that this cluster needs to be split in new subgroups.
.
Fig 6. Well Clustering
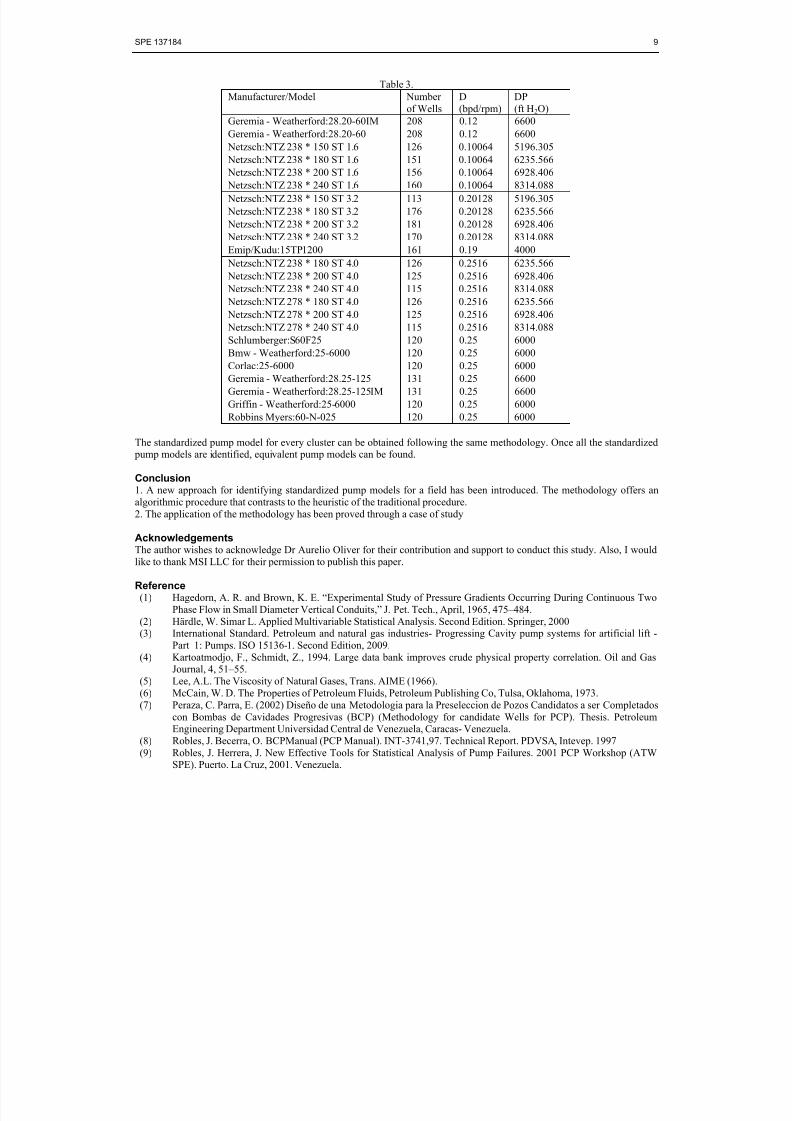
At this point, one may try to obtain a model well for the cluster M4 so the candidate model for this model well can be
considered standardized models for the cluster. This model well can be created by averaging the operating conditions within
the cluster M4 or by applying a joint distribution technique. However, a large portion of the wells in cluster M4 (268 wells)has been completed with a 7"x 23 lb/ft casing, while the remaining wells utilize casing between 8" and 13.375". It means
some of the candidate model for 13.375” casing may not be able to be installed in 7” casing. Thus, a single well model may
not be suitable for well geometry of this cluster. The alternative is to obtain the standardized pump models applying the hit
frequency technique already explained. The result is presented in Table 3. Some pump models in Table 3 also appears in
Table 2, which supports the methodology consistency.
0
0.5
1
0500
10001500500
1000
1500
2000
2500
3000
Volumetric Gas
Fraction (fraction)
Total Flowrate (bpd)
P r e s s u r e R i s i n g R e q u i r e d ( p s i )
8/9/2019 SPE-137184-MS
http://slidepdf.com/reader/full/spe-137184-ms 9/10
SPE 137184 9
Table 3.
Manufacturer/Model Number
of Wells
D
(bpd/rpm)
DP
(ft H2O)
Geremia - Weatherford:28.20-60IM 208 0.12 6600
Geremia - Weatherford:28.20-60 208 0.12 6600
Netzsch:NTZ 238 * 150 ST 1.6 126 0.10064 5196.305
Netzsch:NTZ 238 * 180 ST 1.6 151 0.10064 6235.566 Netzsch:NTZ 238 * 200 ST 1.6 156 0.10064 6928.406
Netzsch:NTZ 238 * 240 ST 1.6 160 0.10064 8314.088
Netzsch:NTZ 238 * 150 ST 3.2 113 0.20128 5196.305
Netzsch:NTZ 238 * 180 ST 3.2 176 0.20128 6235.566
Netzsch:NTZ 238 * 200 ST 3.2 181 0.20128 6928.406
Netzsch:NTZ 238 * 240 ST 3.2 170 0.20128 8314.088
Emip/Kudu:15TP1200 161 0.19 4000
Netzsch:NTZ 238 * 180 ST 4.0 126 0.2516 6235.566
Netzsch:NTZ 238 * 200 ST 4.0 125 0.2516 6928.406
Netzsch:NTZ 238 * 240 ST 4.0 115 0.2516 8314.088
Netzsch:NTZ 278 * 180 ST 4.0 126 0.2516 6235.566
Netzsch:NTZ 278 * 200 ST 4.0 125 0.2516 6928.406 Netzsch:NTZ 278 * 240 ST 4.0 115 0.2516 8314.088
Schlumberger:S60F25 120 0.25 6000
Bmw - Weatherford:25-6000 120 0.25 6000
Corlac:25-6000 120 0.25 6000
Geremia - Weatherford:28.25-125 131 0.25 6600
Geremia - Weatherford:28.25-125IM 131 0.25 6600
Griffin - Weatherford:25-6000 120 0.25 6000
Robbins Myers:60-N-025 120 0.25 6000
The standardized pump model for every cluster can be obtained following the same methodology. Once all the standardized pump models are identified, equivalent pump models can be found.
Conclusion1. A new approach for identifying standardized pump models for a field has been introduced. The methodology offers an
algorithmic procedure that contrasts to the heuristic of the traditional procedure.
2. The application of the methodology has been proved through a case of study
AcknowledgementsThe author wishes to acknowledge Dr Aurelio Oliver for their contribution and support to conduct this study. Also, I would
like to thank MSI LLC for their permission to publish this paper.
Reference(1) Hagedorn, A. R. and Brown, K. E. “Experimental Study of Pressure Gradients Occurring During Continuous Two
Phase Flow in Small Diameter Vertical Conduits,” J. Pet. Tech., April, 1965, 475–484.
(2) Härdle, W. Simar L. Applied Multivariable Statistical Analysis. Second Edition. Springer, 2000
(3) International Standard. Petroleum and natural gas industries- Progressing Cavity pump systems for artificial lift -Part 1: Pumps. ISO 15136-1. Second Edition, 2009.
(4) Kartoatmodjo, F., Schmidt, Z., 1994. Large data bank improves crude physical property correlation. Oil and GasJournal, 4, 51–55.
(5) Lee, A.L. The Viscosity of Natural Gases, Trans. AIME (1966).
(6) McCain, W. D. The Properties of Petroleum Fluids, Petroleum Publishing Co, Tulsa, Oklahoma, 1973.
(7) Peraza, C. Parra, E. (2002) Diseño de una Metodologia para la Preseleccion de Pozos Candidatos a ser Completados
con Bombas de Cavidades Progresivas (BCP) (Methodology for candidate Wells for PCP). Thesis. PetroleumEngineering Department Universidad Central de Venezuela, Caracas- Venezuela.
(8) Robles, J. Becerra, O. BCPManual (PCP Manual). INT-3741,97. Technical Report. PDVSA, Intevep. 1997
(9) Robles, J. Herrera, J. New Effective Tools for Statistical Analysis of Pump Failures. 2001 PCP Workshop (ATWSPE). Puerto. La Cruz, 2001. Venezuela.

8/9/2019 SPE-137184-MS
http://slidepdf.com/reader/full/spe-137184-ms 10/10
10 SPE 137184
(10) Ten Eikelder, H.M.M, Van Erk, A.A. Unification of some Least Squares Clustering Methods. Journal of
Mathematical and Algorithms,3,105-122, 2004
(11) Yarborough, L abd Hall, K.R. How to Solve Equation of State for Z-Factor. Oil and Gas Journal. February 18, 1974.