SPC Training (1)
21
22-03-12 ©SKF Slide 1 [Code] SKF [Organisation] SKF ED Statistical Process Control
-
Upload
mukul-raghav -
Category
Documents
-
view
108 -
download
12
description
hvvgv
Transcript of SPC Training (1)

23-04-17 ©SKF Slide 1 [Code] SKF [Organisation]
SKF ED
Statistical Process Control

23-04-17 ©SKF Slide 2 [Code] SKF [Organisation]
Statistical Process Control
•Statistical Process Control
•Variation & Causes of Variation
•Process : Control, Capability
•Process Capability Indices
•Control Charts

23-04-17 ©SKF Slide 3 [Code] SKF [Organisation]
Statistical Process Control
A process is unique combination of machines, tools, methods, materials, environment and people that attains an output in goods, software or services.
Generally we are interested in the output of a process e.g. Certain characteristics of interest like Groove Dia, Bore, Outer Diameter of rings.
In order to have the desired output we need to utilize a combination of all the inputs and also need to ensure this control continually.
Use of statistical techniques for controlling the process is called Statistical Process Control.

23-04-17 ©SKF Slide 4 [Code] SKF [Organisation]
Statistical Process Control
Variation & its causes
Variation: It is a well known fact that there can not be two products / things having exactly identical characteristic values.This is nothing but Variation.
In manufacturing / processing industry, we come across two different types of variations viz. Random variation and Non random variation
Random variation is due to common causes (chance causes) only where as nonrandom variation is the effect of special causes (assignable causes) and common causes (chance causes).

23-04-17 ©SKF Slide 5 [Code] SKF [Organisation]
Statistical Process Control
Random Variation Non random Variation
Due to common causes only
Due to common and special causes
Variation is fairly consistent; predictable
Variation is in consistent ; un predictable
Always a part of the process
Visitor to the process
Statistics apply Statistics do not apply
Controllable by management
Controllable by operating personnel
e.g. M/C Vibration, Power fluctuation
e.g. Wrong setting of tools, mix up of incoming materials,

23-04-17 ©SKF Slide 6 [Code] SKF [Organisation]
Statistical Process Control
Statistical Process Control :
A process is said to be in a state of statistical control if it is free of special causes of variation.
If a process remains to be in a state of statistical control over a period of time, it is called as a stable process.
A process under statistical control also needs to be
acceptable. (Remember – every process under statistical control may or may not be acceptable to the customer.)

23-04-17 ©SKF Slide 7 [Code] SKF [Organisation]
Statistical Process Control
Under Statistical
Control
Not under statistical
control
Acceptable – meeting
specifications
Case I Case III
Not Acceptable - not meeting
specifications
Case II Case IV
Types of processes
Case III processes may be accepted by customers under certain conditions as due to – the nature of process, root cause of the process is known and is uneconomical to control

23-04-17 ©SKF Slide 8 [Code] SKF [Organisation]
Statistical Process Control
How to see whether Process is in statistical control or not?
- Histogram : should demonstrate normal distribution (bell shape)
- Control charts (see out of control conditions on the chart)

23-04-17 ©SKF Slide 9 [Code] SKF [Organisation]
Statistical Process Control
What can go wrong with a process and which tools can detect it?
Process average shift – Monitor Control charts (e.g. averages chart)
Process spread change – Monitor Control chart (e.g. Ranges chart)
Distribution change – Plot Histogram and monitor
Either or combination of Process average, Process Spread, Distribution can change with respect to time
Time

23-04-17 ©SKF Slide 10 [Code] SKF [Organisation]
Statistical Process Control
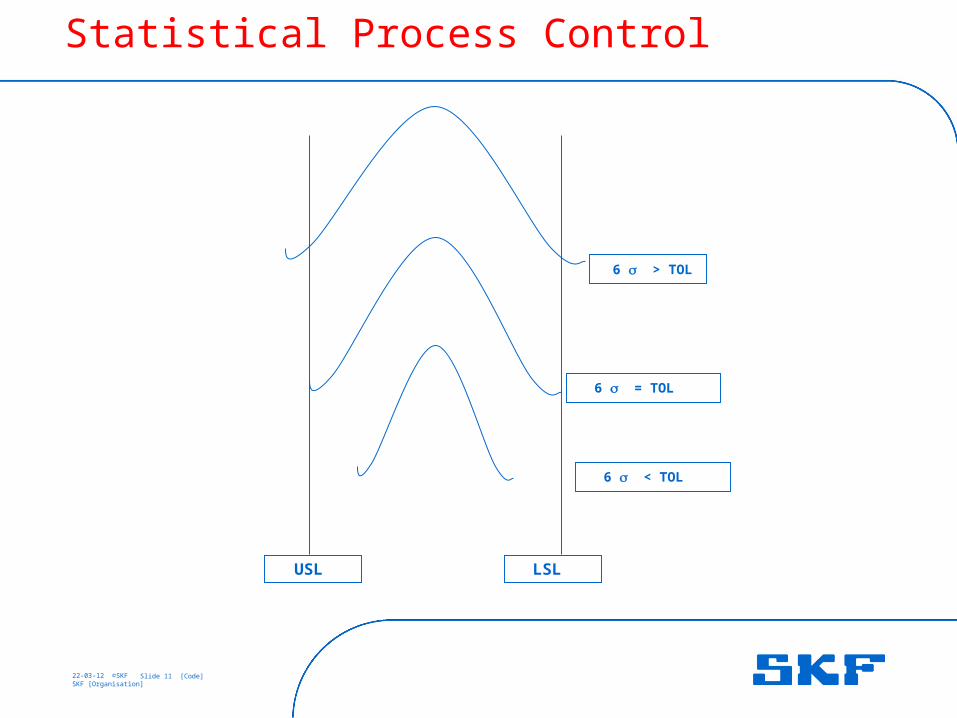
Process capability:
Total variation ( 6 ) of process when process is under statistical control is called process capability.
23-04-17 ©SKF Slide 11 [Code] SKF [Organisation]
Statistical Process Control
USL LSL
6 > TOL
6 = TOL
6 < TOL

23-04-17 ©SKF Slide 12 [Code] SKF [Organisation]
Statistical Process Control
Process capability:
It is not possible for the customer to specify the total variation acceptable to him for each parameter; hence there was a need for developing indices for relating tolerances and the total variation
Cp = Tolerance / Total Variation = Potential Process Capability Index
Process capability , as measured by Cp refers to variation in the process about the average value. Hence Cp index measures the potential capability assuming average at the target value or midpoint of specification limits and the process is operating under statistical control.

23-04-17 ©SKF Slide 13 [Code] SKF [Organisation]
Statistical Process Control
Process capability:
Very often it is observed that the process average is not at the target or midpoint of the specifications and hence the need to have a useful indicator for both variation and process average location i.e. Cpk.
Cpk = Min {((USL-X Bar)/ 3 ) or ((X bar – LSL) / 3 ) }
· Higher the value of Cpk , the lower will be the amount of product which is outside the specification limits.
· If actual average is equal to the midpoint of the specification range , then Cpk = Cp
· Cpk cannot exceed Cp
A capability index can also be calculated around the target value rather than the actual

23-04-17 ©SKF Slide 14 [Code] SKF [Organisation]
Statistical Process Control
Pp, Ppk Cp, Cpk
Index is process performance index This is used during PPAP / short process capability study Used for stable & chronically unstable processes Captures variation due to both common causes & special causes
Standard deviation = Calculated considering all individual reading using calculator or PC Customer requirements are: Ppk > 1.67
These are process capability index This is used during ongoing process capability study Used only for stable processes Captures variation due to only common causes. Standard deviation = R bar/ d2 Customer requirements are : Cpk > 1.33

23-04-17 ©SKF Slide 15 [Code] SKF [Organisation]
Statistical Process Control
Srno 1 2 3 4 5
1 1.440 1.420 1.410 1.410 1.440
2 1.440 1.420 1.420 1.430 1.410
3 1.440 1.420 1.430 1.430 1.430
4 1.440 1.420 1.430 1.420 1.410
5 1.420 1.430 1.430 1.420 1.410
6 1.440 1.430 1.410 1.420 1.420
7 1.430 1.440 1.440 1.430 1.430
8 1.440 1.440 1.440 1.430 1.450
9 1.440 1.430 1.420 1.430 1.440
10 1.420 1.440 1.440 1.430 1.410
11 1.440 1.440 1.410 1.440 1.440
12 1.430 1.430 1.420 1.420 1.420
13 1.420 1.430 1.410 1.410 1.420
14 1.420 1.400 1.410 1.420 1.410
15 1.430 1.430 1.420 1.410 1.420
16 1.420 1.430 1.420 1.410 1.430
0 0 01
14
2322
19
10 0 0 0 0 0
0
5
10
15
20
25
1.370 1.380 1.390 1.400 1.410 1.420 1.430 1.440 1.450 1.460 1.470 1.480 1.490 1.500 1.510
Histogram

23-04-17 ©SKF Slide 16 [Code] SKF [Organisation]
Statistical Process Control
Short Term Capability StudyMachine : SHG Channel : 05 Time of data collection : 10.05 to 11.05 Hrs
Type : QJ 209 IR Characteristic: Bore Specification: Φ 45.00 +0/-0.01
Total No of samples selected for study: 100
All the dimensions are deviations from 45.00 in microns
Min Max Average 1 Min Max Average 2
1 -4 -5 -4.5 -6 -7 -6.5 2 -5.52 -5 -7 -6 -6 -8 -7 1 -6.53 -5 -6 -5.5 -6 -8 -7 1.5 -6.254 -3 -4 -3.5 -4 -6 -5 1.5 -4.255 -4 -5 -4.5 -5 -6 -5.5 1 -56 -4 -5 -4.5 -6 -7 -6.5 2 -5.57 -3 -4 -3.5 -5 -6 -5.5 2 -4.58 -4 -6 -5 -6 -7 -6.5 1.5 -5.759 -4 -6 -5 -5 -6 -5.5 0.5 -5.2510 -4 -5 -4.5 -6 -7 -6.5 2 -5.5
Average ID Side 1 Side 2
TaperRdng . No Calculations :
Maximum ID -4
Minimum ID -10.25
Range 6.25
Average Bore -5.58
Standard Deviation - Bore 0.938
Upper Specification Limit 0Lower Specification Limit -10
Pp= (USL-LSL)/ 6 σ = 1.777Ppk= Min (( USL-Average)/ 3*σ, (Average- LSL)/ 3 * σ)
PPk1 3.6424
PPk2 1.5707
Ppk 1.5707

23-04-17 ©SKF Slide 17 [Code] SKF [Organisation]
Statistical Process Control
On Going Process Capability Study
Machine : SHG Channel : 05 Upper Specification Limit 0Date of Study : 10.04.2006 Lower Specification Limit -10
1 2 3 4 5 6 7 8 9 10 11 12 13 14 15 16 17 18 19 20
0830 0900 0930 1000 1030 1100 1130 1230 0100 0130 0200 0230 0300 0400 0430 0500 0530 0600 0630
1 -4.5 -4.5 -5 -5.5 -5.5 -6.5 -5.5 -4.5 -5.5 -4.5 -6.5 -3.5 -6.5 -3.5 -4.5 -4 -4.5 -4.5 -4.5
2 -5.5 -5 -5.5 -4.5 -6.5 -6.5 -5 -4.5 -3.5 -4.5 -5.5 -4.5 -5.5 -2.5 -4.5 -4.5 -4.5 -5 -4.5
3 -5.5 -5 -5.5 -5.5 -6.5 -5.5 -4.5 -5 -6 -4.5 -6.5 -3.5 -5.5 -3.5 -4.5 -5 -4.5 -5 -4
4 -5.5 -4.5 -5 -5 -5.5 -4.5 -5.5 -5.5 -4.5 -5.5 -4.5 -3.5 -6 -2.5 -3.5 -4 -4 -5.5 -5.5
5 -4.5 -5.5 -5.5 -5.5 -5.5 -4.5 -5 -5.5 -4.5 -4.5 -4.5 -3.5 -4.5 -4.5 -5.5 -4.5 -5 -5.5 -5.5
Avg -5.1 -4.9 -5.3 -5.2 -5.9 -5.5 -5.1 -5 -4.8 -4.7 -5.5 -3.7 -5.6 -3.3 -4.5 -4.4 -4.5 -5.1 -4.8
Range 1 1 0.5 1 1 2 1 1 2.5 1 2 1 2 2 2 1 1 1 1.5Avg of Avg -4.69 -4.69 -4.69 -4.69 -4.69 -4.69 -4.69 -4.69 -4.69 -4.69 -4.69 -4.69 -4.69 -4.69 -4.69 -4.69 -4.69 -4.69 -4.69 -4.69Avg of Ranges1.84 1.84 1.84 1.84 1.84 1.84 1.84 1.84 1.84 1.84 1.84 1.84 1.84 1.84 1.84 1.84 1.84 1.84 1.84 1.84UCL X bar -3.63 -3.63 -3.63 -3.63 -3.63 -3.63 -3.63 -3.63 -3.63 -3.63 -3.63 -3.63 -3.63 -3.63 -3.63 -3.63 -3.63 -3.63 -3.63 -3.63LCL Xbar -5.75 -5.75 -5.75 -5.75 -5.75 -5.75 -5.75 -5.75 -5.75 -5.75 -5.75 -5.75 -5.75 -5.75 -5.75 -5.75 -5.75 -5.75 -5.75 -5.75UCL R bar 3.8942 3.8942 3.8942 3.8942 3.8942 3.8942 3.894 3.894 3.894 3.894 3.894 3.894 3.894 3.894 3.894 3.894 3.894 3.894 3.894 3.894LCL R bar 0 0 0 0 0 0 0 0 0 0 0 0 0 0 0 0 0 0 0 0
Average of averages - 4.89Average of Ranges 1.342
Std Dev= Average of Ranges / d2 0.577 σ ind 0.838Upper Specification Limit 0
Lower Specification Limit -10
2.888 Pp 1.99
2.825 Ppk 1.94Cpk= Min (( USL-Average)/ 3* Std dev, (Average- LSL)/ 3 * Std dev)
Cp= (USL-LSL)/ 6 Std Dev

23-04-17 ©SKF Slide 18 [Code] SKF [Organisation]
Statistical Process Control
Average - Range Chart
-8
-6
-4
-2
0
2
4
6
1 2 3 4 5 6 7 8 9 10 11 12 13 14 15 16 17 18 19 20
Sample #
Avera
ge /
Range (
µ)
Avg
Range
Avg of Avg
Avg of Ranges
UCL X bar
LCL Xbar
UCL R bar
LCL R bar
Range Chart

23-04-17 ©SKF Slide 19 [Code] SKF [Organisation]
Statistical Process Control
Interpret Control Charts

23-04-17 ©SKF Slide 20 [Code] SKF [Organisation]
Statistical Process Control
Interpret Control Charts

23-04-17 ©SKF Slide 21 [Code] SKF [Organisation]
Statistical Process Control
Interpret Control Charts