Spatio-temporal patterns of fish assemblages in a large regulated ...
37
HAL Id: hal-00653265 https://hal.archives-ouvertes.fr/hal-00653265 Submitted on 19 Dec 2011 HAL is a multi-disciplinary open access archive for the deposit and dissemination of sci- entific research documents, whether they are pub- lished or not. The documents may come from teaching and research institutions in France or abroad, or from public or private research centers. L’archive ouverte pluridisciplinaire HAL, est destinée au dépôt et à la diffusion de documents scientifiques de niveau recherche, publiés ou non, émanant des établissements d’enseignement et de recherche français ou étrangers, des laboratoires publics ou privés. Spatio-temporal patterns of fish assemblages in a large regulated alluvial river R. Rifflart, G. Carrel, Y. Le Coarer, B. Nguyen The Fontez To cite this version: R. Rifflart, G. Carrel, Y. Le Coarer, B. Nguyen The Fontez. Spatio-temporal patterns of fish as- semblages in a large regulated alluvial river. Freshwater Biology, Wiley, 2009, p. 1544 - p. 1559. <10.1111/j.1365-2427.2009.02200.x>. <hal-00653265>
Transcript of Spatio-temporal patterns of fish assemblages in a large regulated ...

HAL Id: hal-00653265https://hal.archives-ouvertes.fr/hal-00653265
Submitted on 19 Dec 2011
HAL is a multi-disciplinary open accessarchive for the deposit and dissemination of sci-entific research documents, whether they are pub-lished or not. The documents may come fromteaching and research institutions in France orabroad, or from public or private research centers.
L’archive ouverte pluridisciplinaire HAL, estdestinée au dépôt et à la diffusion de documentsscientifiques de niveau recherche, publiés ou non,émanant des établissements d’enseignement et derecherche français ou étrangers, des laboratoirespublics ou privés.
Spatio-temporal patterns of fish assemblages in a largeregulated alluvial river
R. Rifflart, G. Carrel, Y. Le Coarer, B. Nguyen The Fontez
To cite this version:R. Rifflart, G. Carrel, Y. Le Coarer, B. Nguyen The Fontez. Spatio-temporal patterns of fish as-semblages in a large regulated alluvial river. Freshwater Biology, Wiley, 2009, p. 1544 - p. 1559.<10.1111/j.1365-2427.2009.02200.x>. <hal-00653265>

Spatio-temporal patterns of fish assemblages in a large regulated alluvial river. Freshwater Biology (2009), 54, 1544-1559
RENAUD RIFFLART *†, GEORGES CARREL*, YANN LE COARER* AND BENEDICTE NGUYEN THE FONTEZ † * Cemagref, UR HYAX, 13182 Aix-en-Provence, France. † Université de Provence, UMR IMEP 6116, 13331 Marseille, France. Correspondence: Renaud Rifflart, Cemagref, UR HYAX, 3275 Route de Cézanne, CS 40061, 13182 Aix-en-Provence cedex 5, France. E-mail: [email protected] Key words: Fish; riverine habitat assessment; gravel-bed river; instream flow; GIS; Partial Least Square regression.
(Manuscript accepted 20 October 2008) Author Posting. © Renaud RIFFLART, Georges CARREL, Yann LE COARER AND Benedicte NGUYEN THE FONTEZ {2009} This is the author's version of the work. It is posted here for personal use, not for redistribution. The definitive version was published in Freshwater Biology, 54, 1544-1559 and is available at www.blackwell-synergy.com http://dx.doi.org/10.1111/j.1365-2427.2009.02200.x

Précisions : Dans la version publiée de l’article, trois espèces avaient été nommées sous leur ancienne dénomination scientifique : le chevaine (Leuciscus cephalus devenu Telestes cephalus), le toxostome (Chondrostoma toxostoma devenu Parachondrostoma toxostoma) et le blageon (Leuciscus souffia devenu Telestes souffia).
2

SUMMARY
1. The River Durance, the last alpine tributary of the River Rhône, is a large, braided
alluvial hydrosystem. Following large-scale regulation, flow downstream of the Serre-
Ponçon dam has been maintained at 1/40th of previous annual mean discharge. To
assess the effects of historical disturbances, fish assemblages and habitat use were
analysed during five summers in a representative reach of the middle Durance.
2. Habitat availability and use were assessed with a multi-scale approach including the
variables water depth, current velocity, roughness height of substratum, amount of
woody debris and lateral/longitudinal location. Eighteen fish species were sampled by
electrofishing in 289 habitat sample units.
3. Partial Least Square (PLS) regression showed that taxa were mainly distributed
according to relationships between their total length and water depth/velocity
variables. Fish assemblage composition was also related to roughness height as well as
distance from the bank or to the nearest large woody debris. However, PLS regression
revealed no significant differences in habitat selection between two periods of varying
hydromorphological stability.
4. Fish distribution patterns and density were related to proximity to the bank and cover,
indicating that local scale variables need to be considered in conservation and
restoration programmes.
3

INTRODUCTION
Natural disturbances such as floods or droughts are integral components of most freshwater
ecosystems, and consequently organisms have evolved traits that enable them to survive,
exploit and even depend on many kinds of disturbances (Townsend & Hildrew, 1994; Bunn &
Arthington, 2002; Lytle & Poff, 2004). For example, fish can move to refuge areas during
spates, avoid hostile conditions by spawning after floods and protect their eggs by excavating
deep nests in gravel bottoms (Lytle & Poff, 2004). However, anthropogenic activities such as
the regulation of rivers for hydropower often result in loss or modification of freshwater
habitats (e.g. Nilsson et al., 2005), by changing river connectivity (Aarts, Van Den Brink &
Nienhuis, 2004; Hirzinger et al., 2004), altering exchange processes (Brunke & Gonser, 1997)
and fragmenting populations (Corbacho & Sanchez, 2001). Although fishes are primarily
affected by alterations in hydromorphology (Ormerod, 2003), separating the effects of flow
regulation from other anthropogenic impacts on the floodplain, such as extraction of gravel,
water abstraction and pollution, has proven to be difficult.
The riverscape is a complex and heterogeneous system including lateral floodplain water
bodies connected to the main channel. This lateral connectivity is frequently used by riverine
fishes as seasonal habitat and plays a functional role as spawning or nursery grounds. Habitat
disturbances affect fish life-histories, survival, reproductive success and ultimately population
growth rate (Copp, 1989; Molls, 1999; Borcherding et al., 2002; Dunham & Rieman, 1999).
Although these impacts are well known, fish community responses are not well understood
(Nilsson et al., 2005). Disturbed wetlands have less species diversity (Chipps, Perry & Perry,
1994), and invasion of exotic and fugitive species is facilitated by habitat alterations (Meffe,
1984; Moyle & Light, 1996). Understanding the links between fish fitness and flow regimes
4
or other habitat variables is important for an effective watercourse management (Lytle & Poff,
2004).
In classical fish habitat studies, current velocity, water depth and substratum type are often
used to explain spatial patterns and to calibrate predictive models (Gorman & Karr, 1978;
Bovee, 1982). However, recent studies have shown that these variables alone are not adequate
to understand and predict fish responses (Brosse & Lek, 2000; Mugodo et al., 2006). For
instance, in complex hydrosystems, like large gravel bed alluvial rivers associated to
plurispecific fish communities (Souchon et al., 2002), other habitat features are needed to
predict fish assemblages (Powers et al., 2003). Refuge availability and proximity to the
riparian zone are two variables that have been shown to be strong predictors of fish
assemblages (Copp & Jurajda, 1999; Schiemer, Keckeis & Flore, 2001). Both of these
variables are proxies for the availability of refuges (Growns, Pollard & Gehrke, 1998) as well
as shading zones, organic matter and favoured feeding areas (Gozlan et al., 1999; Hirzinger et
al., 2004). Species richness (Powers et al., 2003) and densities (Shields, Knight & Cooper,
1994) are also strongly correlated with channel width.
Although earlier studies often considered the importance of local scale variables as drivers of
stream diversity, recent studies have shown the importance of catchment level variables
(Ward & Stanford, 1989; Townsend et al., 2003). Moreover, as mechanisms may operate on
scales other than those at which patterns are observed they may be best understood by the
assessment of relationships within smaller scale units, within large scale units (Levin, 1992;
Moir, 2008). Consequently, relating processes identified at a local scale to large scale
phenomena is a major challenge of both fundamental and applied ecology. For this reason, we
describe habitat at local and mesohabitat scales. We study the importance of the classical
5

variables, water depth, current velocity and roughness height, as well as proximity to the
bank, presence of large woody debris and channel width, as predictors of fish assemblages.
Furthermore, using two distinct hydromorphological periods separated by almost 10 years we
test the hypothesis that relationships between fish assemblages and spatial habitat are
consistent among years. The study was carried out in a highly regulated river which has
experienced stable low flow conditions and a significant decrease in minor floods since the
construction of the Serre-Ponçon dam in late 1950’s; dam construction resulted in flows of
1/40th of pre-regulated annual mean discharges. Finally, although much is known of the
effects of flow regulation on salmonids (Murchie et al., 2008), our study focused on
rheophilic cyprinids.
METHODS
Study area
The catchment of the Durance River (14 322 km²), the last left-bank tributary of the Rhône
River, starting at about 2400 m a.s.l. at the Franco-Italian border, merges with Rhône River
some 320 km downstream. Having a Mediterranean climate, the Durance catchment receives
less annual precipitation than other alpine tributaries of the Rhône (annual mean rainfall 720-
900 mm in the Durance catchment; data from Météo-France, 1961-1990, AURELHY model).
The upper Durance has a nival flow regime, not much influenced by glacial inputs, but the
influence of Mediterranean climate increases with decreasing altitude (Pardé, 1925).
The study site is a reach of about one kilometre long, located near Manosque (Alpes-de-
Haute-Provence, Latitude: 43° 50' 26'' N, Longitude: 05° 51' 06'' E) (Fig. 1). The study
focused on the residual channel of the initial braided alluvial river pattern (Warner, 2000).
Before flow regulation, annual discharge averaged 140 m3.s-1, and the natural minimum flow
6

was c. 24 m3.s-1. After flow regulation, discharge has markedly decreased (to c. 3.5 m3.s-1),
with interspersed winter or spring flood events from intermediate sub-catchments (Fig. 2).
Low discharge has resulted in a single channel, with few connections to residual side channels
and backwaters, an increased remoteness of favourable structures for fish, such as shade and
cover, and a reduction in river bank heterogeneity. The physical habitat is essentially built
around gravel point, mid-channel, diamond and diagonal bars (Kellerhals & Church, 1989).
These features explain the main physical characteristics of the regulated middle Durance
River (Table 1).
Fish assemblage
Fish were sampled from 289 independent homogeneous sample units by diurnal electrofishing
(EFKO F.E.G. 8000, 400–600 V, 6–10 A) using an open-sampling technique (Lamouroux et
al., 1999b; Thevenet & Statzner, 1999; Lamouroux et al., 2006). As larger individuals have a
better escape response, an adapted long anode of four metres was used to prospect deep areas
and reduce fish escape. Surfaces varied between 4.5 and 110 m2 (95% of units). Lamouroux et
al. (1999a) showed that the area of sample units had a negligible impact on preference
models.
All individuals were identified to species (except for young stages of the two species of the
genus Chondrostoma which were grouped), and total length (TL ± 1 mm) measured. For
analysis, each species was divided into size or taxa classes as: taxon 1 (0 < TL ≤ 30 mm),
taxon 2 (30 < TL ≤ 60 mm), taxon 3 (60 < TL ≤ 90 mm), taxon 4 (90 < TL ≤ 120 mm), taxon
5 (120 < TL ≤ 150 mm), taxon 6 (150 < TL ≤ 300 mm), taxon 7 (300 < TL ≤ 450 mm) and
taxon 8 (TL > 450). Rarest species were excluded from statistical analysis.
7
Annual sampling campaigns were carried out from July until September during five years,
grouped in two periods (1995-1996-1997 and 2004-2005). Sampling was done when physical
constraints linked to regulated low flow and water temperature were the highest and when all
fish size classes, in particular the young-of-the-year, could be obtained (Gozlan et al., 1999).
The first period was characterised by flood events between each annual campaign, whilst the
second period was characterised by a long and stable hydrological period due to the absence
of high flow events (Fig. 2).
Habitat characteristics
A specific digital elevation model (DEM) was developed and used to describe hydraulic
variability in the study reach (e.g. quantification of the proportions of velocity–depth classes).
For a given flow and for any area of the aquatic space, it was possible to quantify the
hydraulic diversity by calculating the percentages of volumes or horizontal surfaces in a
depth–average velocity cross-classification. This representation in the velocity–depth plane is
known as a hydraulic signature (Le Coarer, 2005; Le Coarer, 2007).
Geo-referencing of vertical measurements of depths and corresponding average velocities was
done with a TCRA 1102 (© LEICA). Density of verticals increased according to the local
heterogeneity of geomorphic units. Current velocities were measured using an
electromagnetic current metre (FLO-MATE, portable model 2000). Discharge was gauged
during each sampling period. Each year, the complete topography, depth and velocity
measurements, gave a precise cartography of the study reach.
A more exhaustive habitat description was done for each of the individual sampling sub-units
for fish. Within each sub-unit, a minimum of nine verticals of water depth and current
8

velocity were spatialised to build a triangular irregular network (TIN) of hydraulic
description. Using the Hydrosignature concept, we defined nine depth-velocity crossed
classes (i.e. hydraulic classes, Table 2). The lower velocity class limit (5 cm.s-1) separates
lentic zones and the upper value (30 cm.s-1) corresponds to the observed critical velocity for
suspended load transport. Values for depth were chosen according to Aadland’s (1993)
classification of stream habitat types.
Substratum type was characterized by measuring roughness height (k), defined as the
difference between the highest point on a particle and the minimal height of contact points of
adjacent particles (Gordon, McMahon & Finlayson, 1992). A minimum of 10 values were
measured in each sample unit and divided into five classes (Table 3). Large woody debris
(LWD) was recorded as percent cover according to three classes (W1 < 10 %,
10 ≤ W2 < 50 %, W3 ≥ 50 %). This form of assessment is well adapted to large systems
presenting low density and discrete distributions of LWD (Maridet & Souchon, 1995;
Thevenet, Citterio & Piegay, 1998). Segments were created from shorelines and cover
percentages incremented into a GIS. The shortest distances were then measured from the
centroid of each sample unit to each modality of cover (d_W1, d_W2 and d_W3) and to the
bank (dBank). Channel width was also recorded (Width) (Table 3). The last two variables
were chosen according to the asymmetry of transversal fish distribution in a channel and the
importance of instream ecotones (Bretschko & Waidbacher, 2001).
For the global approach, 10 types of visually distinguishable and biologically meaningful
mesohabitats were identified (Table 4), and associated surfaces were evaluated each sampling
year. Mesohabitat classes were defined according to the criteria proposed by Borsanyi (2004)
and Malavoi & Souchon (2002).
9
Analysis
Importance of habitat
Partial Least Square regression (PLS) was used to quantify the influence of habitat variables
on the spatial patterns of fish assemblages. As regression coefficients are not independent
among fish taxa, they were ranked and analysis done on the first three variable ranks.
Distances were square-root transformed and fish densities (abundance.m-2) were log (x+1)-
transformed to account heteroscedasticity and deviations from normality. As values of
coefficients associated to distances were inversely related to proximity to these structures, the
signs of the coefficients were reversed and referred to as: Bank, Wood1, Wood2 and Wood3.
Bootstrapping was used to assess the distribution of the rank variables denoting the relative
importance of each descriptive variable, according to Austin & Tu (2004) and adapted for
study needs.
In order to transpose information collected at the sample unit scale to the reach scale, we used
10 000 simulations of the simulated surface areas of each mesohabitat, with a Dirichlet
variable (Lange, 2002). Using parameters observed at the reach scale, we generated a
bootstrapped data set in order to represent habitat diversity observed at the studied reach.
Coefficients ranks were computed for the 10 000 resampled data sets using pls package for R
(Kooistra et al., 2001). Interpretation of the results focused on the first three variable ranks
(rank one being the number of times the descriptive variable had the most influence on fish
presence).
Importance of temporal stability
10
Temporal stability of spatial relationships between the two sampling periods was tested using
PLS. First, the same data processing as in previous analysis (bootstrapping including PLS
regression) was carried out but restricted to 100 PLS regressions. The resulting two rank
matrices were simplified: only taxa from the eight dominant species (blageon – Leuciscus
souffia, stream bleak – Alburnoides bipunctatus, chub – Leuciscus cephalus, stone loach -
Barbatula barbatula, barbel – Barbus barbus, minnow – Phoxinus phoxinus, sofie –
Chondrostoma toxostoma and gudgeon – Gobio gobio) and habitat variables: (i) Wood3
(proximity to the most complex LWD), (ii) Bank (proximity to the bank), (iii) k1, kt (k2, k3
and k4 grouped) and k5 and (iv) D1V1, D1V2, D1V3, D2V1, D2V2, D2V3 with depth limits
(D1 ≤ 30 cm, D2 > 30 cm) and velocity limits (V1 ≤ 5 cm.s-1, 5 cm.s-1< V2 ≤ 30 cm.s-1 and V3
> 30 cm.s-1) were used.
Simulated rank distribution of each variable for each taxon was compared using a t-test. The
resulting p-values matrix was considered as an observed situation between the two data sets.
New data sets were generated using the assumption that spatial relationships were similar
among years. For this, and as bootstrapped Student t-statistic asymptotic properties were not
known (Mason & Shao, 2001), permutation tests were performed (Manly, 1997). All sample
units were combined and permutations were carried out in order to rebuild 1000 replicates of
both data sets including data from all years. For each permutation, the same data processing
was undertaken and the resulting distribution of statistics from these 1000 t-tests was
considered as a theoretical situation (i.e. if there were no fish species preferences). The
relative positions of the p-values associated to the observed situation within the distribution of
the 1000 p-values obtained for the theoretical situation informed us about the probability of
the observed situation under null hypothesis of stability of relationships among years.
11

All analysis were conducted using R software version 2.2.1 © 2005
(R_Development_Core_Team, 2005).
RESULTS
Fish assemblages
The studied reach of the middle Durance was characterised by 18 fish species from six
families and was mainly dominated by rheophilous cyprinids (Table 5). Six species made up
85% of captures: five cyprinids (blageon, stream bleak, chub, barbel, minnow) and one
balitorid, the stone loach. Four intermediate species counted for about 14% of captures: three
cyprinids (nase - Chondrostoma nasus, sofie, gudgeon) and one cobitid, the spined loach
(Cobitis bilineata). Eight rare species represented 1.3% of the total number of captures: three
cyprinids (bleak – Alburnus alburnus, roach – Rutilus rutilus and tench – Tinca tinca), two
percids (perch – Perca fluviatilis and Rhône streber – Zingel asper), one centrarchid
(pumpkinseed – Lepomis gibbosus) and two salmonids (brown trout – Salmo trutta and
rainbow trout – Oncorhynchus mykiss). Two species deserve particular attention: the Rhône
streber, a threatened endemic species of the Rhône catchment, and the introduced spined
loach. Thirty-one individuals of Rhône streber were recorded in 20 sample units during the
five sampling campaigns. This species is considered as critically endangered in the
International Union for Conservation of Nature and Natural Resources (IUCN) Red list of
threatened species (Crivelli, 2006). The spined loach was also caught in the studied reach;
first observed in the Durance River in 1996 after successive high floods, and captures
increased from 14 specimens in the first period to 176 specimens in the second period.
12

Most individuals of the fish assemblage consisted of young-of-the-year and small species (c.
75 percent were < 90 mm). Only 0.65% of total fish catch were longer than 300 mm. For
large cyprinids, adults > 300 mm accounted 0.8%, 2% and 6.5% of chub, barbel and nase,
respectively.
Habitat characteristics
Instream flow varied from 3.5 to 7 m3.s-1, and width of active channel varied from 7 to 202 m
(mean 33 m) during the study period (Table 1). Cross-section flow velocities (mean 0.44 m.s-
1, range 0.05 - 1.85 m.s-1) and water depth (mean 0.36 m, range 0.04 - 1.11 m) showed a
predominance of shallow and lentic habitats. Deep areas > 60 cm covered 13.5% of the reach
compared to 26.2% for shallow areas (d < 15 cm, Table 2). The proportion of large and
shallow riffles increased. A first topographical survey of 3 300 m resulted in the presence of
10 riffles of 25 m or more with a depth < 15 cm (Dumont et al., 1993).
During regulated flow conditions the alluvial forest is almost always far from the channel and
reached only during floods. Inputs of large woody debris from riparian forest to the channel
were highly reduced. The scarcity of immersed LWD was indirectly shown by the average
minimal distance between sample units and woody debris (d_W3: 64 m, d_W2: 81 m, d_W1:
84 m, Table 3), i.e. twice the width of the active channel.
The first 16 principal components of the PLS regression were kept in order to explain at least
25 % of the spatial patterns individual taxa. Including more components did not improve
model fit. The first three ranks obtained from the coefficients of the PLS regression
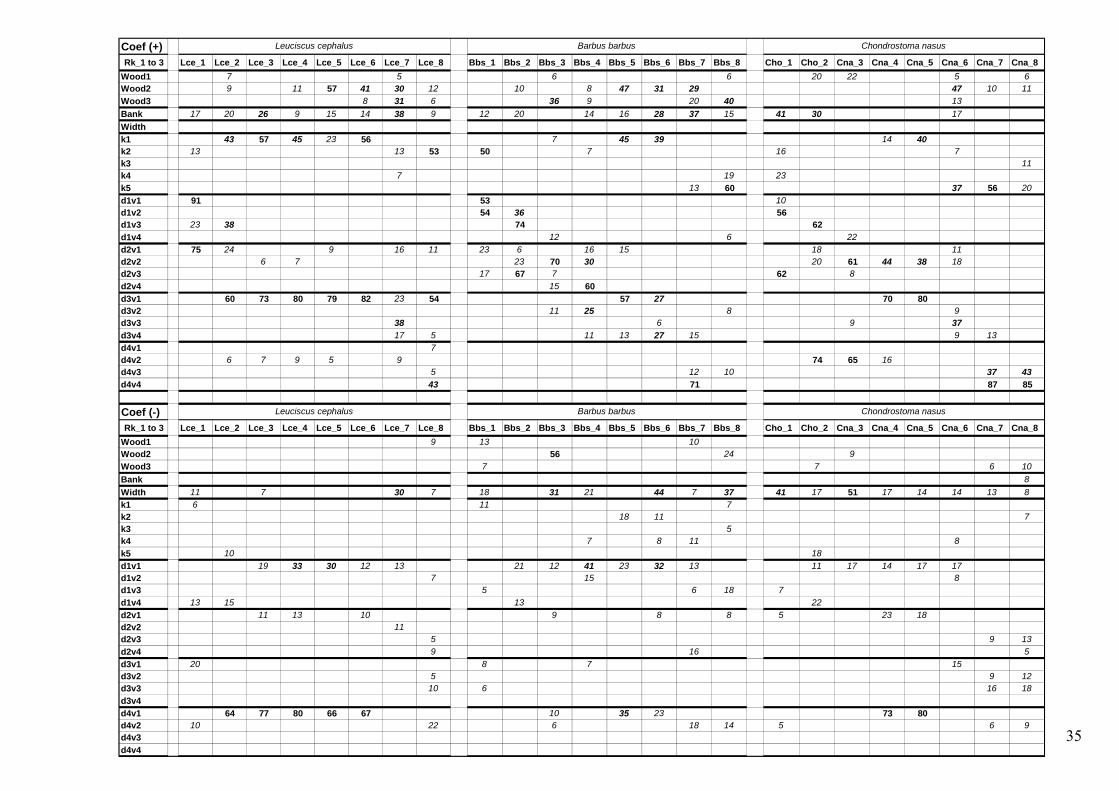
(Appendix 1) revealed strong relationships between fish length and hydraulic classes. A well
13
defined pattern for the largest species (chub, barbel and nase) was exhibited. Some hydraulic
classes were strongly avoided, such as d1v1 by large taxa, d1v4 by minnow and d4v1 by
bleak (Aal 2 & 3), blageon (Lso 4 & 5), chub (Lce 2 to 6), nase (Cna 4 & 5) and all taxa of
spined loach.
Habitat characteristics were important predictors of fish assemblage composition. Presence or
proximity of LWD had a significant effect on the largest specimens of sofie, gudgeon, perch,
chub, blageon, nase and barbel, and also on all size classes of stream bleak. LWD was also
the most important variable for nase (Cna 6), gudgeon (Ggo 4 & 5) and perch (Pfl 6). By
contrast, other taxa, bleak (Aal 3 & 4), young sofie (Cto 3) and barbel (Bbs 3) and Rhône
streber (Zas 2) were negatively correlated with LWD. A positive effect of bank proximity was
also observed for almost all species, particularly for the youngest fishes, in relation to low
depths close to the bank. Bank proximity was also important for some large taxa such as chub,
barbel and perch. Conversely, bank proximity was not important for spined loach, and Rhône
streber was negatively correlated with this variable. Regarding channel width, most of the
species occupied the narrow sections of the river, except Rhône streber (taxa 3, 4 & 5) which
showed a preference for large channels and an avoidance of bank proximity. All sizes of
species caught in lentic sub-units (chub, spined loach, perch) but also some rheophilous taxa
(bleak, gudgeon, blageon) were associated to the lowest roughness height values (k1). The
largest rheophilic species (nase, sofie, barbel, blageon) were associated to the highest k values
(k5) recorded in narrow and curved sections of the channel with the highest hydraulic classes.
In some areas, rheophilic species were associated to heavy blocks used for bank stabilisation.
Our results show the importance of habitat for the endangered Rhône streber and two loaches
(stone and spined loach). Small individuals (< 60 mm) were mainly associated with d2v3
14

while the larger individuals (> 60 mm) were only associated with d2v4 (d2v3 were partly
avoided). Rhône streber inhabited mid-channels in wide sections. Roughness height followed
a gradient in intermediate k classes according to the fish size (k4 was avoided by taxa 3 and
4). The stone loach was mainly found in fast-flowing shallow zones (overall < 0.05 m) and
appeared to be directly influenced by proximity to the bank or to the largest woody debris. By
contrast, the spined loach was only observed in null velocity areas; according to rank values,
this species was associated to the presence of very fine (k1) substratum.
Temporal variability
Hydromorphological changes in the river bed and instream LWD after high-level floods
showed the most marked changes between the two time periods (Fig. 2). Although % bank
line with LWD did not differ among years (range 2.6% in 1996 to 7% in 1995), distance to
the nearest and highest complex LWD (d_W3) did differ between the two periods (Period 1:
99 ± 21 m, Period 2: 35 ± 5 m, Mann-Whitney test, P < 0.001) (Table 6). Distances to the
bank did not differ (Period 1: 4.9 ± 0.8 m, Period 2: 6.1 ± 0.8 m, P = 0.078), whereas
roughness height classes differed significantly for k1 and k5. Silted areas increased in 2005
and roughness height increased in the last two years (Table 3).
As the river channel was not restructured between 2004 and 2005, the sampled surface
associated to k1 in 2005 (10.8 %) was about twice that of other years (mean 5.3%).
Furthermore, in the second period, a reach section was running along rocks protecting a
motorway, increasing "artificially" high roughness height values (sampled surface associated
to k5 was about 2.5% in 2004-2005, whereas it was less than 0.6% for the other three years).
15
In spite of changes in habitat characteristics, no major differences in fish-habitat relationships
were noted between the study periods (Table 6). The importance of bank characteristics was
the same between periods except for stream bleak (Abi 4). Only one strong ecological change
concerned proximity to the nearest large woody debris (blageon, Lso 5) and roughness height
(stream bleak, Abi 2 for k1). Similarly, few differences were noted for hydraulic classes
between periods (Table 2). The most important changes were noted in D2V1 class for chub
(Lce 2 & 6) and in D2V3 for barbel (Bbs 6). Observed differences in hydrosignatures were
mainly related to deep classes (d > 60 cm). A deepening of the channel against the artificial
bank reinforcement consecutive to its lateral migration explained the highest proportion of
deep classes during the second period.
DISCUSSION
River topography and quantitative hydraulic characterisation of habitat (Le Coarer & Dumont,
1995; Le Coarer, 2005; Le Coarer, 2007) were used to define the hydraulic heterogeneity of
each sub-unit. Traditionally, water depth and current velocity are considered as independent
parameters, although they are intimately associated, for example, in characterisation of
physical flow (Stewardson & McMahon, 2002), ecological mesohabitat evaluation (Orth,
1995) and fish habitat use (Mosley, 1983; Aadland, 1993). Bivariate classes (depth/velocity)
and use of fish size classes highlighted taxa distributions according to the size, physiological
adaptation and ecological affinity to hydraulic conditions. Taxa followed well-defined gradual
distribution in hydraulic classes.
Our results show the importance of habitat characteristics for fish assemblages, but also that
depths used by taxa, especially large individuals, were probably a "compulsory" adjustment to
16

physical conditions rather than a real preference in the Durance (Boyer, 2004). Only 13.5% of
the study reaches consisted of deep mesohabitat (d > 60 cm), which is known to be important
in the life history of large rheophilous species (Baras & Cherry, 1990; Lucas & Batley, 1996;
Huber & Kirchhofer, 1998; Allouche, Thevenet & Gaudin, 1999). Hence, the scarcity of deep
mesohabitat is likely responsible for the low number of large individuals recorded in our
study. Only 0.8% of chub, 2% of barbel and 6.5% of nase individuals captured were > 300
mm. Although sampling effort may have underestimated the density of large individuals, our
findings support previous studies on the regulated Durance (Bouchard, 1996; Dumont et al.,
1993). The low number of large individuals could also be associated to fitness which may be
negatively affected by physical constraints, such as low availability of LWD, decrease in
mean current velocity, lack of deep areas and alteration of temperature patterns. All of these
disturbances have been shown to affect the growth rate of salmonids (Swales, 1988; Fausch &
Northcote, 1992) and chub (Bouchard et al., 1998) in the river Durance.
The finding that substratum roughness height value (k) was a robust predictor of fish
assemblages was expected as it indirectly estimates hydraulic shelter created by substratum
elements. A previous study in a salmonid-rich part of the regulated Durance showed a
significant positive relationship between mean size of brown trout and mean k value in sub-
units (Carrel et al., 1992). The importance of the k1 class is related to fine sediments
associated with low velocity; only Cobitis bilineata can be considered as having a real affinity
to fine sediment substratum (Slavik et al., 2000). Intermediate k classes had no clear influence
on the spatial patterns of individual taxa, with the exception of Rhône streber. Our results
corroborate Rhône streber habitat observations on the Beaume River, a tributary of the
Ardèche River (Labonne, Allouche & Gaudin, 2003). The k5 class appears naturally in the
17

deepest areas and in artificial rocks protecting the bank (second period). The large substrate
elements are mainly used as cover for the largest specimens.
Woody debris was among the first three variables selected in our models, and its importance
is clearly highlighted regarding the influence of LWD on rank values. This strong relationship
is likely related to the overall low amount of LWD in the study reaches, but also its
importance for instream hydrology and shelter. The largest woody debris (and associated
distances: d_W2 and d_W3) had the most influence on fish assemblages. Thevenet, Citterio &
Piegay (1998) showed that wood jams containing large wood had greater potential for aquatic
communities. Likewise, Angradi et al. (2004) showed the importance of LWD for increasing
habitat heterogeneity, by increasing the hydraulic roughness of the bed and creating specific
habitats, for fish assemblages.
Species richness and spatial responses of taxa were relatively stable, despite large
hydromorphological changes during flood events. The main differences between the study
periods were associated with changes in morphological characteristics following natural high
flood events and siltation during long periods of stable low flow. The significant changes in
distances to the nearest LWD observed between the two periods could be linked to migration
patterns of the channel, thereby underpinning the importance of contact with forested bank.
Our results showed low LWD densities in the channel in addition to the highest densities
unusually being found in the channel sections reaching overhanging residual alluvial forests.
Differences observed for Wood3 were explained by greater distances to these LWD during
the first period. For example, distances for blageon to the nearest largest LWD were clearly
distinct between the first (mean 78.3 m) and second (14.5 m) periods. For bank variability, the
differences observed for stream bleak were explained by the shorter distance to the bank
18

recorded the first year (1.8 ± 1.1 m in 1995) compared to the other years (6.1 ± 0.9 m). The
only difference exhibited in roughness height was associated with stream bleak for k1 and
was related to the increase in silted areas in 2005.
Spatio-temporal relationships for hydraulic classes showed the regulated Durance to be
relatively stable during the study period. Significant differences concerned chub for class
D2V1 and barbel for class D2V3. Chub preferred habitats with low water velocity, greater
depth and wood shelter (Appendix 1). During the first study period, chubs were often sampled
in sub-units close to or inside wood cover, i.e. woody debris functioned as a hydraulic refuge.
The observed differences were therefore related more to the choice of hydraulic class limits
than to a real change in velocity preference of the species. Barbel was associated with deep,
fast-flowing habitats located along rip rap. Despite high levels of disturbance, both fish
assemblages and spatio-temporal relationships of individual taxa to habitat characteristics
appeared relatively stable.
Prior to large scale regulation of the middle Durance River the fish community was
practically unknown, except for some rare historical data published in cartographical archives.
Studies by Kreitman (1932) and Leger (1934) provide historical data on fish assemblages in
the Rhône River and Upper Durance catchment, respectively. A comparison of current with
past conditions showed fish assemblages in the main channel to be similar, with the exception
of eel (Anguilla anguilla), which has totally disappeared from the middle Durance, and the
recent arrival of Cobitis bilineata. Indeed, before the first capture of a cobitid in the Durance,
Cobitis taenia was considered as the only spined loach present in France, mainly limited to
the Seine and the Rhine catchments (Keith & Allardi, 2001). The diversity of hydrosystems
inhabited by C. bilineata could explain its rapid and successful colonisation of the River
19

Durance (Kottelat & Freyhof, 2007). By contrast, the distribution of the endemic percid
Zingel asper has dramatically decreased in the Rhône River catchment (Laroche & Durand,
2004). Therefore, a population of the endemic Zingel asper in the highly regulated middle
Durance can be considered as a positive element for its conservation.
Many studies have demonstrated that an efficient restoration plan cannot rely solely on small-
scale actions such as implantation of artificial instream structures or rehabilitation of the main
channel (Pretty et al., 2003). Potential recovery of fish assemblages in the Durance River is
driven by the necessity of promoting the development of lateral and off-channel habitats
within the river corridor. Sustainable management implies an efficient rehabilitation scheme
including a regulated instream flow that should be more adapted to fish needs. Coupling
information on mesohabitat and at reach scale was demonstrated to be the best way of
assessing and predicting fish spatial assemblages (Parasiewicz & Walker, 2007). Although
restoration would require improving natural hydro-geomorphological dynamics in order to
increase habitat heterogeneity, with connections to remnant side channels or backwaters, it
would be most effective when used together with other strategies such as water quality
management. Consequently, explaining how these abiotic and biotic factors interact over a
range of temporal and spatial scales should be a major goal of lotic fish ecologists (Schlosser,
1995).
In regulated rivers, many landscape attributes have been shown to have strong effects on
processes determining fish population dynamics. The functional terrestrial-aquatic ecotone
and its influence on temporal and spatial variation in resource or cover supply were shown to
significantly affect the distribution fish species and assemblages. Large-scale spatial habitat
relationships and their effects on resource use and fish movement are likely to be most
20

relevant for modelling. Presence of refuges from harsh environmental conditions and their
influence on fish survival and emigration/immigration rates must be taken into account to
increase fish populations.
ACKNOWLEDGMENTS
We thank all past and present members of the Hydrobiology unit at Cemagref (Aix en
Provence) for their help during sampling periods and data analysis. Special thanks to Maxime
Logez for his reviews in data modelling. We thank anonymous reviewers for helpful
comments that substantially improved earlier versions of the manuscript. Data for the first
three years are the propriety of Electricité De France (EDF). Financial support for this study
was provided by the Region Provence–Alpes–Côte d’Azur. Hydrosignature software is
available at http://hydrosignature.aix.cemagref.fr/
21

REFERENCES
Aadland L.P. (1993) Stream habitat types: their fish assemblages and relationship to flow. North American Journal of Fisheries Management, 13, 790-806.
Aarts B.G.W., Van Den Brink F.W.B. & Nienhuis P.H. (2004) Habitat loss as the main cause of the slow recovery of fish faunas of regulated large rivers in Europe: The transversal floodplain gradient. River Research and Applications, 20, 3-23.
Abdi H. (2007) Partial least square regression (PLS regression). In: Encyclopedia of Measurement and Statistics, vol. (Ed. N.J. Salkind), pp. 740-744. Sage, Thousand Oaks, CA, USA.
Allouche S., Thevenet A. & Gaudin P. (1999) Habitat use by chub (Leuciscus cephalus L. 1766) in a large river, the French Upper Rhone, as determined by radiotelemetry. Archiv für Hydrobiologie, 145, 219-236.
Angradi T.R., Schweiger E.W., Bolgrien D.W., Ismert P. & Selle T. (2004) Bank stabilization, riparian land use and the distribution of large woody debris in a regulated reach of the upper Missouri River, North Dakota, USA. River Research and Applications, 20, 829-846.
Austin P.C. & Tu J.V. (2004) Bootstrap methods for developing predictive models. American statistician, 58, 131-137.
Baras E. & Cherry B. (1990) Seasonal activities of female barbel Barbus barbus (L.) in the River Ourthe (Southern Belgium), as revealed by radio tracking. Aquatic Living Resources, 3, 283-294.
Borcherding J., Bauerfeld M., Hintzen D. & Neumann D. (2002) Lateral migrations of fishes between floodplain lakes and their drainage channels at the Lower Rhine: diel and seasonal aspects. Journal of Fish Biology, 61, 1154-1170.
Borsanyi P., Alfredsen K., Harby A., Ugedal O. & Kraxner C. (2004) A meso-scale habitat classification method for production modelling of Atlantic salmon in Norway. Hydroécologie Appliquée, 14, 119-138.
Bouchard P. (1996) Dynamique spatio-temporelle des peuplements ichtyologiques de la Durance aménagée. Doctorat de l'Université de Provence, Université de Provence, Aix-Marseille.
Bouchard P., Chappaz R., Cavalli L. & Brun G. (1998) Influence of environmental variables on the growth of Leuciscus cephalus (Linnaeus 1766), in the River Durance, South-east France. Annales de Limnologie, 34, 193-200.
Bovee K.D. (1982) A guide to stream habitat analysis using the instream flow incremental methodology. 12, U.S. Department of the Interior, Fish and Wildlife Service, Office of Biological Services.
Boyer J. (2004) 5M7, un modèle de préférence d'habitat pour les poissons d'eau courante : test et validation. Master thesis, Environnement et Développement Durable, Option FGMAM, Université de Perpignan.
Bravard J.-P., Amoros C., Pautou G., Bornette G., Bournaud M., Creuze Des Chatelliers M., Gibert J., Peiry J.-L., Perrin J.-F. & Tachet H. (1997) River incision in South-East France: morphological phenomena and ecological effects. Regulated Rivers - Research & Management, 13, 75-90.
Bretschko G. & Waidbacher H. (2001) Riparian ecotones, invertebrates and fish: life cycle timing and trophic base. In: Catchment processes land/water ecotones and fish communities, vol. 1, (Eds M. Zalewski, F. Schiemer & J. Thorpe), pp. 57-64. Ecohydrology and Hydrobiology, Warsaw, Poland.
Brosse S. & Lek S. (2000) Modelling roach (Rutilus rutilus L.) microhabitat using linear and nonlinear techniques. Freshwater Biology, 44, 441-452.
22

Brunke M. & Gonser T. (1997) The ecological significance of exchange processes between rivers and groundwater. Freshwater Biology, 37, 1-33.
Bunn S.E. & Arthington A.H. (2002) Basic principles and ecological consequences of altered flow regimes for aquatic biodiversity. Environmental management, 30, 492-507.
Carrel G., Dumont B., Le Coarer Y. & Rivier B. (1992) Morphodynamique et biologie piscicole de la Durance dans le secteur Espinasses-Rochebrune (aval de Serre-Ponçon). Division Hydrobiologie, Cemagref Aix-en-Provence, Le Tholonet.
Chipps S.R., Perry W.B. & Perry S.A. (1994) Fish assemblages of the central Appalachian Mountains: an examination of trophic group abundance in nine West Virginia streams. Environmental Biology of Fishes, 40, 91-98.
Copp G.H. (1989) The habitat diversity and fish reproductive function of floodplain ecosystems. Environmental Biology of Fishes, 26, 1-27.
Copp G.H. & Jurajda P. (1999) Size-structured diel use of river banks by fish. Aquatic Sciences, 61, 75-91.
Corbacho C. & Sanchez J.M. (2001) Patterns of species richness and introduced species in native freshwater fish faunas of a mediterranean-type basin: The Guadiana River (southwest Iberian Peninsula). Regulated Rivers - Research & Management, 17, 699-707.
Crivelli A.J. (2006) Zingel asper [online]. 2007 IUCN Red List of Threatened Species. Doledec S., Lamouroux N., Fuchs U. & Merigoux S. (2007) Modelling the hydraulic
preferences of benthic macroinvertebrates in small European streams. Freshwater Biology, 52, 145-164.
Dufour S., Barsoum N., Muller E. & Piegay H. (2007) Effects of channel confinement on pioneer woody vegetation structure, composition and diversity along the River Drome (SE France). Earth Surface Processes and Landforms, 32, 1244-1256.
Dumont B., Le Coarer Y. & Carrel G. (1993) Moyenne Durance. Site du Largue. Etude du débit réservé. Morphodynamique et ichtyologie. CEMAGREF, Division Hydrobiologie, Aix-en-Provence, France.
Dunham J.B. & Rieman B.E. (1999) Metapopulation structure of bull trout: Influences of physical, biotic, and geometrical landscape characteristics. Ecological Applications, 9, 642-655.
Fausch K.D. & Northcote T.G. (1992) Large woody debris and Salmonid habitat in a small coastal British Columbia stream. Canadian Journal of the Fisheries and Aquatic Sciences, 49, 682-693.
Gordon N.D., McMahon T.A. & Finlayson B.L. (1992) Stream hydrology: an introduction for ecologists. John Wiley & Sons Ltd, Chichester.
Gorman O.T. & Karr J.R. (1978) Habitat structure and stream fish communities. Ecology, 59, 507-515.
Gozlan R.E., Mastrorillo S., Copp G.H. & Lek S. (1999) Predicting the structure and diversity of young-of-the-year fish assemblages in large rivers. Freshwater Biology, 41, 809-820.
Gozlan R.E., Mastrorillo S., Dauba F., Tourenq J.N. & Copp G.H. (1998) Multi-scale analysis of habitat use during late summer for 0+ fishes in the River Garonne (France). Aquatic Sciences, 60, 99-117.
Growns I.O., Pollard D.A. & Gehrke P.C. (1998) Changes in river fish assemblages associated with vegetated and degraded banks, upstream of and within nutrient-enriched zones. Fisheries Management and Ecology, 5, 55-69.
Hirzinger V., Keckeis H., Nemeschkal H.L. & Schiemer F. (2004) The importance of inshore areas for adult fish distribution along a free-flowing section of the Danube, Austria. River Research and Applications, 20, 137-149.
23

House R.A. & Boehne P.L. (1986) Effects of instream structures on salmonid habitat and populations in Tobe Creek, Oregon. North American Journal of Fisheries Management, 6, 38-46.
Huber M. & Kirchhofer A. (1998) Radio telemetry as a tool to study habitat use of nase (Chondrostoma nasus L.) in medium-sized rivers. Hydrobiologia, 372, 309-319.
Hunter C.J. (1991) Better trout habitat : a guide to stream restoration and management. Montana Land Reliance.
Keith P. & Allardi J. (Eds.) (2001) Atlas des poissons d'eau douce de France. Muséum National d'Histoire Naturelle, Paris.
Kellerhals R. & Church M. (1989) The morphology of large rivers: characterization and management. In: International Large River Symposium (Ed. D.P. Dodge), pp. 31-48. Honey Harbour, Ontario, Canada. Canadian Special Publication of Fisheries and Aquatic Sciences.
Kooistra L., Leuven R.S.E.W., Nienhuis P.H., Wehrens R. & Buydens L.M.C. (2001) A procedure for incorporating spatial variability in ecological risk assessment of Dutch River floodplains. Environmental Management, 28, 359-373.
Kottelat M. & Freyhof J. (2007) Handbook of Euroean freshwater fishes. Kottelat & Freyhorf, Cornol, Switzerland, Berlin, Germany.
Kreitmann L. (1932) Les grandes lignes de l'économie piscicole du bassin français du Rhône. Travaux du Laboratoire d'Hydrobiologie et de Pisciculture de l'Université de Grenoble, 24, 127-131.
Labonne J., Allouche S. & Gaudin P. (2003) Use of a generalised linear model to test habitat preferences: the example of Zingel asper, an endemic endangered percid of the River Rhone. Freshwater Biology, 48, 687-697.
Lamouroux N., Capra H., Pouilly M. & Souchon Y. (1999a) Fish habitat preferences in large streams of southern France. Freshwater Biology, 42, 673-687.
Lamouroux N., Olivier J.M., Persat H., Pouilly M., Souchon Y. & Statzner B. (1999b) Predicting community characteristics from habitat conditions: fluvial fish and hydraulics. Freshwater Biology, 42, 275-299.
Lamouroux N., Olivier J.M., Capra H., Zylberblat M., Chandesris A. & Roger P. (2006) Fish community changes after minimum flow increase: testing quantitative predictions in the Rhone River at Pierre-Benite, France. Freshwater Biology, 51, 1730-1743.
Lange K. (2002) Mathematical and statistical methods for genetic analysis. New York: Springer-Verlag.
Laroche J. & Durand J.D. (2004) Genetic structure of fragmented populations of a threatened endemic percid of the Rhône river: Zingel asper. Heredity, 92, 329-334.
Le Coarer Y. (2005) "HydroSignature" software for hydraulic quantification. In: COST 626 - European Aquatic Modelling Network. Proceedings from the final meeting in Silkeborg, Denmark 19-20 May 2005, vol. (Eds A. Harby, M. Baptist, H. Duel, M. Dunbar, P. Goethals, A. Huusko, A. Ibbotson, H. Mader, M. Pedersen, S. Schmutz & M. Schneider), pp. 193-203. National Environmental Research Institute, Silkeborg, Denmark.
Le Coarer Y. (2007) Hydraulic signatures for ecological modelling at different scales. Aquatic Ecology, 41, 451-459.
Le Coarer Y. & Dumont B. (1995) Modélisation de la morphodynamique fluviale pour la recherche des relations habitat/faune aquatique. Bulletin Français de Pêche et de Pisciculture, 337/338/339, 309-316.
Leahey E. (2005) Alphas and Asterisks: The Development of Statistical Significance Testing Standards in Sociology. Social Forces, 84, 1-24.
24

Leger L. (1934) Carte piscicole du département des Hautes Alpes (avec notice explicative et considérations sur l'économie piscicole régionale), 28 pages + carte hors texte. 1/200000. Allier, Grenoble.
Levin S.A. (1992) The problem of pattern and scale in ecology. Ecology, 73, 1943-1967. Lucas M.C. & Batley E. (1996) Seasonal movements and behaviour of adult barbel Barbus
barbus, a riverine cyprinid fish: Implications for river management. Journal of Applied Ecology, 33, 1345-1358.
Lytle D.A. & Poff N.L. (2004) Adaptation to natural flow regimes. Trends in Ecology & Evolution, 19, 94-100.
Malavoi J.R. & Souchon Y. (2002) Description standardisée des principaux faciès d'écoulement observables en rivière : clé de détermination qualitative et mesures physiques. Bulletin Français de Pêche et de Pisciculture, 365/366, 357-372.
Manly B.F.J. (1997) Randomization, Bootstrap and Monte Carlo Methods in Biology. Chapman & Hall.
Maridet L. & Souchon Y. (1995) Habitat potentiel de la truite fario (Salmo trutta fario, L. 1758) dans trois cours d'eau du massif central. Bulletin Français de Pêche et de Pisciculture, 336, 1-18.
Mason D.M. & Shao Q.-M. (2001) Bootstrapping the Student t-statistic. The annals of probability, 29, 1435-1450.
Meffe G. (1984) Effects of abiotic disturbance on coexistence of predator–prey fish species. Ecology, 65, 1525-1534.
Miramont C. (2000) L'histoire du paysage fluvial durancien à l'époque historique. Courrier scientifiques du Parc naturel régional du Lubéron, 4, 110-126.
Moir H.J. & Pasternack G.B. (2008) Relationships between mesoscale morphological units, stream hydraulics and Chinook salmon (Oncorhynchus tshawytscha) spawning habitat on the Lower Yuba River, California. Geomorphology, 100, 527-548.
Molls F. (1999) New insights into the migration and habitat use by bream and white bream in the floodplain of the Rhine River. Journal of Fish Biology, 55, 1187-1200.
Mosley M.P. (1983) Response of braided rivers to changing discharge. Journal of Hydrology (N.Z.), 22, 18-67.
Moyle P.B. & Light T. (1996) Biological invasions of fresh water: Empirical rules and assembly theory. Biological Conservation, 78, 149-161.
Mugodo J., Kennard M., Liston P., Linke S., Norris R.H. & Lintermans M. (2006) Local stream habitat variables predicted from catchment scale characteristics are useful for predicting fish distribution. Hydrobiologia, 572, 59-70.
Murchie K.J., Hair K.P.E., Pullen C.E., Redpath T.D., Stephens H.R. & Cooke S.J. (2008) Fish response to modified flow regimes in regulated rivers: research methods, effects and opportunities. River Research and Applications, 24, 197-217.
Nilsson C., Reidy C.A., Dynesius M. & Revenga C. (2005) Fragmentation and flow regulation of the world's large river systems. Science, 308, 405-408.
Ormerod S.J. (2003) Current issues with fish and fisheries: editor's overview and introduction. Journal of Applied Ecology, 40, 204-213.
Orth D.J. (1995) Food web influences on fish population responses to instream flow. Bulletin Français de Pêche et de Pisciculture, 337/338/339, 317-328.
Parasiewicz P. & Walker J.D. (2007) Comparison of MESOHABSIM with two microhabitat models (PHABSIM and HARPHA). River Research and Applications.
Parde M. (1925) Le Régime du Rhône. Etude hydrologique. Allier, Masson, Grenoble, Lyon. Piegay H., Thevenet A., Kondolf G.M. & Landon N. (2000) Physical and human factors
influencing potential fish habitat distribution along a mountain River, France. Geografiska Annaler, Series A: Physical Geography, 82A, 121-136.
25
Powers S.L., Jones G.L., Redinger P. & Mayden R.L. (2003) Habitat associations with upland stream fish assemblages in Bankhead National Forest, Alabama. Southeastern Naturalist, 2, 85-92.
Pretty J.L., Harrison S.S.C., Shepherd D.J., Smith C., Hildrew A.G. & Hey R.D. (2003) River rehabilitation and fish populations: assessing the benefit of instream structures. Journal of Applied Ecology, 40, 251-265.
R_Development_Core_Team (2005) R: A language and environment for statistical computing. R Foundation for Statistical Computing. Vienna, Austria.
Ribes E. & Provansal M. (2005) Suspended sediment transport and trapping processes in the regulated lower Durance River, southeastern France. In: Geomorphological Processes and Human Impacts in River Basins, vol. 299, (Eds R.J. Batalla & C. Garcia), pp. 101-110. International Association of Hydrological Sciences, Wallingford, England.
Schiemer F., Keckeis H. & Flore L. (2001) Ecotones and hydrology: key conditions for fish in large rivers. Ecohydrology and Hydrobiology, 1, 49-55.
Schlosser I.J. (1991) Stream fish ecology: a landscape perspective. BioScience, 41, 704-712. Schlosser I.J. (1995) Critical lanscape attributes that influence fish population dynamics in
headwater streams. In: The importance of aquatic-terrestrial ecotones for freshwater fish, vol. 303, (Eds F. Schiemer, M. Zalewski & J.E. Thorpe), pp. 71-81. Hydrobiologia.
Shields F.D., Jr, Knight S.S. & Cooper C.M. (1994) Effects of channel incision on base-flow stream habitats and fishes. Environmental Management, 18, 43-57.
Slavik O., Mattas D., Jirinek P., Bartos L. & Rebec J. (2000) Substratum selection by different sizes of spined loach Cobitis sp. Folia Zoologica, 49, 167-172.
Sokal R.R. & Rohlf F.J. (1995) Biometry. The principles and practice of statistics in biological research. W. H. Freeman and Company, New York.
Souchon Y., Andriamahefa H., Breil P., Albert M.-B., Capra H. & Lamouroux N. (2002) Vers de nouveaux outils pour l'aide à la gestion des hydrosystèmes : couplage des recherches physiques et biologiques sur les cours d'eau. Nature Sciences Sociétés, 10, 26-41.
Stewardson M.J. & McMahon T.A. (2002) A stochastic model of hydraulic variations within stream channels. Water Resources Research, 38.
Swales S. (1988) Fish populations of a small lowland channelized river in England subject to long-term river maintenance and management works. Regulated Rivers - Research & Management, 2, 493-506.
Thevenet A., Citterio A. & Piegay H. (1998) A new methodology for the assessment of large woody debris accumulations on highly modified rivers (example of two French piedmont rivers). Regulated Rivers - Research & Management, 14, 467-483.
Thevenet A. & Statzner B. (1999) Linking fluvial fish community to physical habitat in large woody debris: sampling effort, accuracy and precision. Archiv für Hydrobiologie, 145, 57-77.
Townsend C.R., Doledec S., Norris R., Peacock K. & Arbuckle C. (2003) The influence of scale and geography on relationships between stream community composition and landscape variables: description and prediction. Freshwater Biology, 48, 768-785.
Townsend C.R. & Hildrew A.G. (1994) Species traits in relation to a habitat templet for river systems. Freshwater Biology, 31, 265-275.
Ward J.V. & Stanford J.A. (1989) Riverine ecosystems: the influence of man on catchment dynamics and fish ecology. In: International Large River Symposium (Ed. D.P. Dodge), pp. 56-64. Honey Harbour, Ontario, Canada. Canadian Special Publication of Fisheries and Aquatic Sciences.
26

Warner R.F. (2000) Gross channel changes along the Durance River, Southern France, over the last 100 years using cartographic data. Regulated Rivers - Research & Management, 16, 141-157.
Warner R.F. (2006) Natural and artificial linkages and discontinuities in a Mediterranean landscape: Some case studies from the Durance Valley, France. CATENA, 66, 236-250.
Wilhelm I. (1913) La Durance. Etude de l'utilisation de ses eaux et de l'amélioration de son régime par la création de barrages. Lucien LAVEUR, Paris.
27

0 200100 m
Italy
Serre-Ponçon reservoir
Sainte-Croix reservoir
Berre Lagoon
Manosque
#Escale
#La Brillanne
Mediterranean Sea
0 2010 Km
Figure 1: The Durance River basin, its main tributary network (Strahler order ≥ 3) and the study site located near Manosque (Alpes-de-Haute-Provence). A thick grey line outlines the canal supplying 14 hydropower stations from Serre-Ponçon dam to Berre Lagoon. For clarity, all hydropower stations are omitted from the map. Escale and La Brillanne are gauging stations (see Figure 2). The bottom-right insert shows the studied river reach during the two final years, 2004 and 2005. Document sources: U.R. Hydrobiologie - Cemagref Aix-en-Provence, ©IGN, BD CARTHAGE® RMC.
28

1
10
100
1 000
10 000
2003 2004 2005
1995 1996 19971
10
100
1 000
10 000EscaleLa Brillanne
Q m3.s-1
Figure 2 - Time-series of mean daily discharge of the Durance River at Escale and at La Brillanne for the two study periods: 1995-1997 and 2003-2006. At Escale (44°05’11”N, 6°00’45”E), natural discharge is reconstructed and close to the historical Durance stream flow. At La Brillanne (43°56’04”N, 5°53’37”E), current discharge corresponds to regulated instream flow and includes partial flows from tributaries located between the two gauging stations. Data from the French Hydrology Data Bank HYDRO of the Ministry for Ecology, Sustainable Development and Spatial Planning (http://www.hydro.eaufrance.fr/).
29

Table 1 – Main hydromorphological variables of the study site. Mean values were calculated with 1164 transects at 5 m intervals along the curvilinear axis of the channel. W: width of the channel, dm: mean depth of transect, dM: maximal depth of transect, V: mean velocity and Slope: surface water slope.
W (m) dm (m) dM (m) V (m.s-1) Slope (%) Mean 32.8 0.32 0.59 0.42 0.39 Standard deviation 16.2 0.18 0.32 0.24 0.54 Minimum 7.4 0.04 0.06 0.05 0.01 Maximum 202.5 1.11 2.05 1.85 3.05
Table 2 – Variables and their codes obtained by depth (d) and current velocity (v) cross tabulation. The numerical value of each variable is the percentage area of the cross class in the total area considered. The sum of the 16 variables of the cross table equals 100%. Values are indicated for the whole five year period and for both distinct periods.
depth (cm)
d > 60 d4V1 d4V2 d4V3 d4V4 2.3 4.5 4.6 2.1
30 < d ≤ 60 d3V1 d3V2 d3V3 d3V4 2.3 9.4 10.9 11.5
15 < d ≤ 30 d2V1 d2V2 d2V3 d2V4 2.0 7.7 11.0 5.4
0 < d ≤ 15 d1V1 d1V2 d1V3 d1V4 8.6 12.9 4.3 0.4
0 < v ≤ 5 5 < v ≤ 30 30 < v ≤ 60 v > 60 0 < v ≤ 5 5 < v ≤ 30 30 < v ≤ 60 v > 60 Velocity (cm.s -1 )
depth (cm)
d > 60 0.1 3.1 5.8 0.9 4.7 6.0 3.3 3.4
30 < d ≤ 60 1.6 11.9 10.8 10.6 3.1 6.8 11.1 12.4
15 < d ≤ 30 1.8 9.3 11.8 5.5 2.3 6.0 10.2 5.2
0 < d ≤ 15 9.2 13.7 3.4 0.4 7.9 12.0 5.3 0.4
0 < v ≤ 5 5 < v ≤ 30 30 < v ≤ 60 v > 60 0 < v ≤ 5 5 < v ≤ 30 30 < v ≤ 60 v > 60 Velocity (cm.s -1 )
First period : 1995 to 1997 Second period : 2004 - 2005
Total ( 5 year period)Codes
30

Table 3 – Habitat variables, their modalities and values for each year. Minimal distances were calculated from the sample unit centroid to the nearest three cover modalities and to the nearest bank. The width of the channel was measured at the level of the sample unit centroid and on a line perpendicular to the water current direction. The frequency distribution of roughness height values in a given sample unit gives the percentage of each size class (variable ki).
< 10 % d_W1 282 (± 282) [5 - 861] 80 (± 96) [0.3 - 348] 30 (± 22) [0.8 - 80] 58 (± 62) [0.6 - 285] 37 (± 42) [0.1 - 199] < 50 % d_W2 52 (± 60) [0.1 - 191] 191 (± 136) [1.2 - 464] 52 (± 33) [2.1 - 110] 48 (± 53) [0.4 - 226] 53 (± 57) [0.3 - 244] > 50 % d_W3 137 (± 183) [0.1 - 574 100 (± 90) [0.1 - 329] 46 (± 37) [0.2 - 113] 34 (± 34) [0.01 - 154] 36 (± 33) [0.2 - 155]
Distance to the bank (m) dBank 4 (± 4) [0.1 - 21] 5 (± 4) [0.3 - 19] 6 (± 5) [0.4 - 19] 6 (± 6) [0.1 - 27] 6 (± 5) [0.1 - 20] Chenal width (m) Width 20 (± 12) [4 - 48] 18 (± 10) [3 - 46] 27 (± 12) [4 - 44] 25 (± 12) [2 - 55] 25 (± 11) [6 - 50]
[ 0 - 0.0625 cm [ k1 3.9 (± 16.3) [0 - 100] 8.4 (± 23.6) [0 - 100] 8.7 (± 25.5) [0 - 100] 6.1 (± 17.6) [0 - 100] 22.7 (± 34) [0 - 100]
Variables and Codes Cover percentage
Other variables
Substrate roughness height
and distance associated
1997 2004
Mean (± sd) [Min. - Max.] Mean (± sd) [Min. - Max.] Mean (± sd) [Min. - Max.] 2005
and frequencies (ki)
Mean (± sd) [Min. - Max.] [Min. - Max.]Mean (± sd)
1995 1996
[0 - 64.7] [0 - 90] [0 - 80] [0 - 90]
14.6 (± 17.2) 39.7 (± 26.7) 19.8 (± 23.2) 3.1 (± 12.8)
[0 - 78.6][0 - 100][0 - 75]
[0 - 78.9]
22.3 (± 21.6)49.4 (± 24.3)17.9 (± 18.2)4.2 (± 14.4)
[0 - 76.9][0 - 80][0 - 70][0 - 0]
22.7 (± 20.1) 44.7 (± 23.2) 23.8 (± 19.7)
0 (± 0)
[0 - 44.4][0 - 86.6][0 - 86.6][0 - 12.5]
7.9 (± 12.1)47.1 (± 19.7)35.9 (± 22.9)
0.6 (± 2.2)
[0 - 93.3][0 - 92.3][0 - 76.9]
[0 - 10]
18.8 (± 22.7) 47.7 (± 20.3) 29.3 (± 24.5)
0.2 (± 1.6)
k2k3k4k5
[ 0.0625 - 1.6 cm [ [ 1.6 - 6.4 cm [ [ 6.4 - 25.6 cm [ [ 25.6 - 204.8 cm [
Table 4 - Definition and codes of the 10 mesohabitats according to the following physical variables: wave height of the water surface, surface water slope, current velocity and depth [adapted from Malavoi & Souchon (2002) and Borsany et al. (2004)].
Water surface Slope Velocity Depth > 60 cm
> 30 cm.s-1
< 60 cm
> 0.4% < 30 cm.s-1
Waves < 5cm > 60 cm
> 30 cm.s-1 < 60 cm
> 60 cm
< 0.4% < 30 cm.s-1
< 60 cm > 60 cm
> 30 cm.s-1 < 60 cm
Waves > 5cm > 0.4%
< 30 cm.s-1 > 60 cm
> 30 cm.s-1 < 60 cm
> 60 cm
< 0.4% < 30 cm.s-1
< 60 cm
31

32
Table 5 – List of the 18 species sampled in the middle Durance study site and their abbreviation (Abb.). For each species, total number of fish caught (N), relative abundance (%), number of sample units (Nsampl) and species occurrence (Occ.) in percentage, minimal (TLm) and maximal (TLM) total length in mm are indicated. The last column indicates the three groups of species according to their relative abundance. Group 1: main species, > 5%. Group 2: intermediate species, from 1 to 5%. Group 3: rare species, < 1%. Five species were excluded from data analysis: roach, tench, the two salmonids and pumpkinseed.
Abb. N % Nsampl Occ. TLm TLM GroupCyprinidae Leuciscus souffia Blageon Lso 2318 19.46 191 0.66 17 165 1 Alburnoides bipunctatus Stream bleak Abi 2045 17.17 191 0.66 11 132 1 Leuciscus cephalus Chub Lce 1730 14.52 165 0.57 17 558 1 Barbus barbus Barbel Bbs 1463 12.28 197 0.68 16 610 1 Phoxinus phoxinus Minnow Pph 965 8.10 95 0.33 14 68 1 Chondrostoma nasus Nase Cna 520 4.36 92 0.32 28 525 2 Chondrostoma toxostoma Sofie Cto 480 4.03 89 0.31 20 237 2 Gobio gobio Gudgeon Ggo 449 3.77 104 0.36 15 130 2 Alburnus alburnus Bleak Aal 45 0.38 25 0.09 18 160 3 Rutilus rutilus Roach Rru 6 0.05 5 0.02 32 107 3 Tinca tinca Tench Tti 1 0.01 1 < 0.01 173 173 3Balitoridae Barbatula barbatula Stone loach Bba 1599 13.42 160 0.55 22 85 1Cobitidae Cobitis bilineata Spined loach Cbi 190 1.59 48 0.17 31 102 2Percidae Perca fluviatilis Perch Pfl 51 0.43 19 0.07 66 190 3 Zingel asper Rhône streber Zas 31 0.26 20 0.07 40 155 3Centrarchidae Lepomis gibbosus Pumpkinseed Lgi 5 0.04 4 0.01 85 97 3Salmonidae Salmo trutta Brown trout Str 12 0.10 10 0.03 61 240 3 Oncorhynchus mykiss Rainbow trout Omy 3 0.03 2 0.01 290 350 3 Total number of fish 11913

Pph_1 Pph_2 Abi_2 Abi_3 Abi_4 Ggo_2 Ggo_3 Ggo_4 Lso_1 Lso_2 Lso_3 Lso_4 Lso_5 Cho_2 Cto_4 Cto_5 Cto_6Wood3 * * * ***
Bank *k1 **ktk5
D1V1 * *D1V2 *D1V3 *D2V1 *D2V2D2V3
Period 1 171 506 185 766 85 70 121 45 90 459 324 123 26 141 11 15 21Period 2 99 171 433 194 255 63 39 96 25 518 314 360 71 76 36 31 89
Bbs_2 Bbs_3 Bbs_4 Bbs_5 Bbs_6 Lce_1 Lce_2 Lce_3 Lce_4 Lce_5 Lce_6 Bba_2 Bba_3Wood3 *
Bank
k1ktk5
D1V1D1V2D1V3 *D2V1 ** * **D2V2D2V3 **
Period 1 158 106 95 44 201 188 230 172 118 68 65 776 129Period 2 224 67 154 157 173 61 329 129 176 74 106 484 121
Sofie
Stone loachChubBarbel
Minnow Stream bleak Gudgeon Blageon
33
Table 6 – Analysis of temporal effects: p-values of t-test for comparison between two time periods (1995-1996-1997 and 2004-2005). Abbreviations were explained in Methods - Analysis - Importance of temporal stability. Total abundances were mentioned for each period and for each taxon. Critical values were adjusted with a Dunn Sidak procedure to account for multiple comparisons (Sokal & Rohf, 1995). The correction of the multiple comparisons will lead to conservative tests (Sokal & Rohf, 1995) therefore an upper alpha risk than the usual 0.05 could be assumed and we suggest 0.2. Significances were coded as standard proposed by (Leahey, 2005): *p <= 0.2, **p <= 0.1, ***p <= 0.05. Variables considered as having no relevant influence on fish presence according to results from previous analysis are shown as grey.

Appendix 1 – Number of times (expressed in percentages) each variable belongs to the first three ones explaining fish presence. Abbreviations were previously explained in part Methods. Information about sign of PLS coefficients was kept in order to inform about attractiveness or avoidance of relationships. For simplification and readability of the tables, percentages less than 5% have not been indicated. Values were formatted as following: italic (from 5 to 25), italic bold (from 25 to 50) and bold (over 50).
34
Coef (+)Rk_1 to 3 Pph_1 Pph_2 Pph_3 Abi_1 Abi_2 Abi_3 Abi_4 Aal_1 Aal_2 Aal_3 Aal_4 Ggo_1 Ggo_2 Ggo_3 Ggo_4 Ggo_5 Lso_1 Lso_2 Lso_3 Lso_4 Lso_5 Lso_6 Cho_1 Cho_2 Cto_3 Cto_4 Cto_5 Cto_6
Wood1 14 11 14 11 10 23 15 11 6 8 6 24 5 10 20 5 21Wood2 39 55 11 7 38 66 9 19 37 16 8Wood3 11 25 21 12 7 16 13 16Bank 28 62 9 74 21 35 31 37 29 23 18 6 10 15 27 17 5 10 41 30 10 7Width 7 8k1 6 93 14 10 36 10 25 23 53 5 9 8k2 11 40 18 12 16k3 22k4 11 20 23k5 23 23d1v1 23 53 61 54 10d1v2 23 40 22 56d1v3 52 66 62 28 23 68 62 9d1v4 48d2v1 60 24 17 46 5 44 30 68 7 22 65 13 26 18 8d2v2 11 45 8 56 55 26 48 97 74 10 20 45 85 79 5d2v3 17 10 9 6 9 26 62 17d2v4 8 7 20d3v1 21 11 53 6 27 23 32 68 53d3v2 16 7 43 10 51 25 8 46d3v3 55 23 44 7 7 10 12d3v4 20 13 7d4v1 7 61 23 23 6 47d4v2 16 11 68 33 58 10 54 65 25 52 15 74 18 6d4v3 6 5d4v4 17
Coef (-)Rk_1 to 3 Pph_1 Pph_2 Pph_3 Abi_1 Abi_2 Abi_3 Abi_4 Aal_1 Aal_2 Aal_3 Aal_4 Ggo_1 Ggo_2 Ggo_3 Ggo_4 Ggo_5 Lso_1 Lso_2 Lso_3 Lso_4 Lso_5 Lso_6 Cho_1 Cho_2 Cto_3 Cto_4 Cto_5 Cto_6
Wood1 6 11 9 33Wood2 78 16 75 78 11 7 18 76Wood3 24 7 6 6 18 7BankWidth 9 18 87 30 8 31 9 12 20 81 20 6 12 66 21 12 19 41 17 41 53 71 37k1 25 38k2 7 21k3k4 8 27 14 6 18 10 10 16 27 9k5 9 18 13 10 7 6 18 18 6d1v1 6 41 10 56 7 12 53 66 16 42 63 38 11 42 44 30d1v2 5d1v3 8 7d1v4 29 22 38 10 10 14 26 22d2v1 9 13 5 17d2v2 10d2v3d2v4d3v1 9 23 6 30 7 10d3v2 7 14d3v3 6d3v4d4v1 6 39 30 7 48 70 61d4v2 5d4v3d4v4
Leuciscus souffiaPhoxinus phoxinus Chondrostoma toxostomaGobio gobioAlburnus alburnusAlburnoides bipunctatus
Phoxinus phoxinus Chondrostoma toxostomaGobio gobio Leuciscus souffiaAlburnoides bipunctatus Alburnus alburnus
35
Coef (+)Rk_1 to 3 Lce_1 Lce_2 Lce_3 Lce_4 Lce_5 Lce_6 Lce_7 Lce_8 Bbs_1 Bbs_2 Bbs_3 Bbs_4 Bbs_5 Bbs_6 Bbs_7 Bbs_8 Cho_1 Cho_2 Cna_3 Cna_4 Cna_5 Cna_6 Cna_7 Cna_8
Wood1 7 5 6 6 20 22 5 6Wood2 9 11 57 41 30 12 10 8 47 31 29 47 10 11Wood3 8 31 6 36 9 20 40 13Bank 17 20 26 9 15 14 38 9 12 20 14 16 28 37 15 41 30 17Widthk1 43 57 45 23 56 7 45 39 14 40k2 13 13 53 50 7 16 7k3 11k4 7 19 23k5 13 60 37 56 20d1v1 91 53 10d1v2 54 36 56d1v3 23 38 74 62d1v4 12 6 22d2v1 75 24 9 16 11 23 6 16 15 18 11d2v2 6 7 23 70 30 20 61 44 38 18d2v3 17 67 7 62 8d2v4 15 60d3v1 60 73 80 79 82 23 54 57 27 70 80d3v2 11 25 8 9d3v3 38 6 9 37d3v4 17 5 11 13 27 15 9 13d4v1 7d4v2 6 7 9 5 9 74 65 16d4v3 5 12 10 37 43d4v4 43 71 87 85
Coef (-)Rk_1 to 3 Lce_1 Lce_2 Lce_3 Lce_4 Lce_5 Lce_6 Lce_7 Lce_8 Bbs_1 Bbs_2 Bbs_3 Bbs_4 Bbs_5 Bbs_6 Bbs_7 Bbs_8 Cho_1 Cho_2 Cna_3 Cna_4 Cna_5 Cna_6 Cna_7 Cna_8
Wood1 9 13 10Wood2 56 24 9Wood3 7 7 6 10Bank 8Width 11 7 30 7 18 31 21 44 7 37 41 17 51 17 14 14 13 8k1 6 11 7k2 18 11 7k3 5k4 7 8 11 8k5 10 18d1v1 19 33 30 12 13 21 12 41 23 32 13 11 17 14 17 17d1v2 7 15 8d1v3 5 6 18 7d1v4 13 15 13 22d2v1 11 13 10 9 8 8 5 23 18d2v2 11d2v3 5 9 13d2v4 9 16 5d3v1 20 8 7 15d3v2 5 9 12d3v3 10 6 16 18d3v4d4v1 64 77 80 66 67 10 35 23 73 80d4v2 10 22 6 18 14 5 6 9d4v3d4v4
Leuciscus cephalus Barbus barbus Chondrostoma nasus
Chondrostoma nasusLeuciscus cephalus Barbus barbus

36
Coef (+)Rk_1 to 3 Bba_1 Bba_2 Bba_3 Cbi_2 Cbi_3 Cbi_4 Pfl_3 Pfl_4 Pfl_5 Pfl_6 Zas_2 Zas_3 Zas_4 Zas_5
Wood1 7 15 23 24Wood2 11 11 21 47 67 20Wood3 6 14 17 7Bank 15 6 8 25 15 9Width 6 13 12 30k1 17 91 69 97 63 55 48k2 12k3 56 44k4 6 45k5 43d1v1 31 88 29d1v2 67 93 36 61d1v3 30 77 77 12 5d1v4 43 38 44d2v1 7 30 15 35 34d2v2 5 58d2v3 28 6 7 72d2v4 11 14 14 80 70d3v1 6 35 68 75 83 84d3v2 25d3v3 5 16 19d3v4 39d4v1 54 61 32d4v2d4v3d4v4
Coef (-)Rk_1 to 3 Bba_1 Bba_2 Bba_3 Cbi_2 Cbi_3 Cbi_4 Pfl_3 Pfl_4 Pfl_5 Pfl_6 Zas_2 Zas_3 Zas_4 Zas_5
Wood1 7Wood2 12 20 43Wood3 11 9Bank 31 6 31Width 9 13 36k1k2 7 22 22 26 22 9k3 7k4 42 36k5 5d1v1 12 7 7 7d1v2 16d1v3 21d1v4 9 8d2v1 19 15 29 7d2v2 5 8d2v3 12 14 6d2v4d3v1d3v2 11 8 16d3v3 5 13d3v4d4v1 8 9 40 76 76 73d4v2 5 7d4v3d4v4 14
Zingel asper
Zingel asperBarbatuta barbatula Cobitis bilineata Perca fluviatilis
Cobitis bilineata Perca fluviatilisBarbatuta barbatula