Spatial trends in tourism within South Africa: The ...
13
South African Journal of Geomatics, Vol. 6. No. 2, Geomatics Indaba 2017 Special Edition, August 2017 219 Spatial trends in tourism within South Africa: The expected and the surprising David H McKelly 1 , Christian M. Rogerson 2 , Elsona van Huysteen 1 , Johan Maritz 1 , Mawande Ngidi 1 1 Urban and Regional Planning, Spatial Planning and Systems, Built Environment, Council for Scientific and Industrial Research (CSIR), Stellenbosch, South Africa. [email protected] 2 School of Tourism and Hospitality, Faculty of Management, University of Johannesburg, South Africa. DOI: http://dx.doi.org/10.4314/sajg.v6i2.7 Abstract Several researchers have highlighted the spatial imbalances of the tourism sector in South Africa. It has been noted that this sector is highly concentrated spatially in terms of its distribution and in relation to its potential local impacts across the country. Although it is broadly understood that the tourism sector is geographically uneven, the lack of sector comparative data at municipal level may inhibit the wide spread use of geographically comparative analyses of the contribution of the various dimensions of tourism in the South African space economy. The aim of this paper is to provide an indication of the value of such comparative analyses of the spatial trends and impacts of the tourism sector in local economies in South Africa. The discussion of the tourism space economy is based on an analysis of a local tourism database which contains details of the tourism performance of all local authorities in the country focussing on the period from 2001 to 2011. Whilst the study confirms the important role of metropolitan areas, secondary and coastal cities and typical tourism destinations in the tourism space economy, it also highlights the significance of some local places/economies that are not traditionally associated with tourism, as well as illustrating the significance of tourism spend in the local economies of a range of municipalities that might not be part of the ‘top’ tourist destinations in South Africa. Key Words: Spatial tourism trends, South Africa, space economy, tourism in local economy, trip purpose. 1 Introduction The World Tourism Organization (WTO) defines tourism as the activities associated with travel away from a person’s usual place or environment (WTO, 2000). Unlike agriculture or the manufacturing sector, tourism is a service industry with the product being consumed at the point of production. Given the tourist industry’s structure in terms of a mix of large enterprises and many SMMEs that draw upon domestic and international visitors, and its components of natural and manmade attractions, tourism is complex, cross-sectoral and highly dynamic. In particular, as
Transcript of Spatial trends in tourism within South Africa: The ...

South African Journal of Geomatics, Vol. 6. No. 2, Geomatics Indaba 2017 Special Edition, August 2017
219
Spatial trends in tourism within South Africa: The expected and the
surprising
David H McKelly1, Christian M. Rogerson2, Elsona van Huysteen1,
Johan Maritz1, Mawande Ngidi1
1Urban and Regional Planning, Spatial Planning and Systems, Built Environment, Council for
Scientific and Industrial Research (CSIR), Stellenbosch, South Africa. [email protected]
2School of Tourism and Hospitality, Faculty of Management, University of Johannesburg, South
Africa.
DOI: http://dx.doi.org/10.4314/sajg.v6i2.7
Abstract
Several researchers have highlighted the spatial imbalances of the tourism sector in South
Africa. It has been noted that this sector is highly concentrated spatially in terms of its distribution
and in relation to its potential local impacts across the country. Although it is broadly understood
that the tourism sector is geographically uneven, the lack of sector comparative data at municipal
level may inhibit the wide spread use of geographically comparative analyses of the contribution of
the various dimensions of tourism in the South African space economy.
The aim of this paper is to provide an indication of the value of such comparative analyses of the
spatial trends and impacts of the tourism sector in local economies in South Africa. The discussion
of the tourism space economy is based on an analysis of a local tourism database which contains
details of the tourism performance of all local authorities in the country focussing on the period
from 2001 to 2011.
Whilst the study confirms the important role of metropolitan areas, secondary and coastal cities
and typical tourism destinations in the tourism space economy, it also highlights the significance of
some local places/economies that are not traditionally associated with tourism, as well as
illustrating the significance of tourism spend in the local economies of a range of municipalities
that might not be part of the ‘top’ tourist destinations in South Africa.
Key Words: Spatial tourism trends, South Africa, space economy, tourism in local economy,
trip purpose.
1 Introduction
The World Tourism Organization (WTO) defines tourism as the activities associated with travel
away from a person’s usual place or environment (WTO, 2000). Unlike agriculture or the
manufacturing sector, tourism is a service industry with the product being consumed at the point of
production. Given the tourist industry’s structure in terms of a mix of large enterprises and many
SMMEs that draw upon domestic and international visitors, and its components of natural and
manmade attractions, tourism is complex, cross-sectoral and highly dynamic. In particular, as

South African Journal of Geomatics, Vol. 6. No. 2, Geomatics Indaba 2017 Special Edition, August 2017
220
compared to the sectors of mining and manufacturing which relate to landscapes of production, the
tourism sector must be understood as related to the understanding of places or landscapes of
consumption.
The aim of this paper is to provide an indication of the value of geographically comparative
analyses of the impact and spatial trends of the tourism sector in local economies in South Africa
between 2001 and 2012. This will be done by first providing a short background on the role of
tourism in South Africa and the mainstream understanding of its spatial distribution, followed by a
short introduction to the analyses and lastly providing an overview of the more multi-dimensional
nature of the tourism space economy.
Overall, the paper represents a further contribution to an emerging scholarship that seeks to
understand the space economy of tourism in South Africa (see Visser 2007; Rogerson 2014, 2015).
2 The role of tourism and its spatial distribution
In terms of economic analysis, the tourism sector is highly distinctive in that it is not a sector that
is formally classified as such in terms of the International Standard Industrial Classifications
(Hatzichronoglou 1997). One important consequence of this situation is that there is often
considerable uncertainty concerning the precise boundaries of the tourism economy and of how to
measure its economic impact on employment creation or contribution to national GDP, as for
example attempted within the NSDP, 2006 (The Presidency, 2006: 53-55). Among others, Christie
et al. (2013: 43) stress that “in national accounts ‘tourism’ does not appear as a formal industry
classification; its sub-categories, such as hotels and transport, are found within ‘real estate’, or
aggregated under ‘transport, communications and storage’”. One tool for measurement is the
Tourism Satellite Account (TSA) which in South Africa has been developed by Statistics South
Africa to offer certain estimates of the direct contribution of tourism to GDP and employment
creation.
Tourism is identified as one of the key industries driving change on the African continent,
including South Africa (EDD, 2011). It is referred to as a potential jewel in the crown of many
African countries, albeit an economic jewel that is in need of constant polishing and refinement
(World Bank, 2010; EDD, 2011). From a base of 6.7 million visitors in 1990, sub-Saharan Africa
attracted 33.1 million international arrivals in 2011. On a global scale tourism is growing faster in
the world’s emerging and developing regions than in the rest of the world. In a landmark recent
study on tourism in Africa, Christie et al. (2013: 56) argue that tourism does not receive the credit it
deserves in terms of its contributions towards the economic and social development of the
continent. These authors identify (at least) ten principal reasons for developing tourism assets and
poising a country for sustained economic growth of its tourism assets (Christie et al. 2013: 56).
According to their findings the growth of tourism can: fuel the economic transformation of
destinations; create many good jobs; show particular promise as a vehicle for the development of
peripheral and remote regions; accelerate economic reforms that can help SMME development; be a

South African Journal of Geomatics, Vol. 6. No. 2, Geomatics Indaba 2017 Special Edition, August 2017
221
catalyst for infrastructure improvements; increases domestic consumption and diversify exports; be
a trigger for empowering women, youth and marginalised populations; be a stimulus for cultural
heritage and environmental conservation; promote public-private partnerships; and improve the
image of nations, regions and localities. This list could be extended even further to include such
important contributions by tourism to: helping fight poverty; and improving social and economic
inclusion.
Indeed, through the consumption of local products in tourist accommodation and through visitor
expenditure outside that accommodation, tourism can be a catalyst for developing small businesses
in the production and service sectors, increase demand for crafts and generate linkages to
agriculture, fishing, food processing and light manufacturing. In addition, tourism can potentially
“also create links in the informal sector” (Christie et al. 2013: 84-85).
Internationally, the expansion of tourism and recreational activities can result in positive impacts
on local economies, in particular by generating economic and social development in marginal
regions or rural areas. In developed economies, Jones and Munday (Jones et al. 2001: 2) observe
that acknowledgement of “tourism and leisure as a fast growing industry has led to its identification
as a potential driver of regeneration in economically disadvantaged localities”. Overall, in terms of
spatial development it is important to understand that “tourism can provide an economic base for a
region whose only development options are its cultural and natural resources, whether coastal,
mountain or wildlife” (Christie et al., 2013: 85).
Visser et al. (2004) describe tourism as the sector that was most adversely affected of all the
sectors of South Africa’s economy by the apartheid programs. Under the apartheid legislation the
potential of domestic tourism was constrained as the majority Black population could not enjoy
access to certain facilities and places, like beaches.
Several researchers have highlighted the spatial imbalances of the tourism sector in South Africa
(Rogerson et al. 2004; Visser 2007; Visser et al. 2012) and that it is highly concentrated spatially in
terms of its distribution and correspondingly in relation to its potential local impacts across the
country. Even though regional tourism strategies highlight regional and local specific destinations
and activities, comparative analyses usually highlight the role of municipalities in this important
industry in terms of bednights and tourism spending patterns. It is postulated that the lack of sector
comparative data at municipal level may have inhibited the wide spread use of geographically
comparative analyses of the contribution of the various dimensions of tourism within municipalities
across South Africa. Behind this knowledge gap is the weakness of data concerning the tourism
sector as a whole in South Africa and in particular at a fine grained geographical scale of analysis.
3 The Underlying Analysis
This paper is based on a study conducted for the Economic Development Department (EDD) in
2014, and aimed at developing spatial perspectives for selected job drivers in support of the New
Growth Path (NGP) (van Huyssteen et al. 2014). The analyses are based on a database which is

South African Journal of Geomatics, Vol. 6. No. 2, Geomatics Indaba 2017 Special Edition, August 2017
222
derived from IHS Global Insight as part of its Regional eXplorer (IHS 2014). It is a consolidated
platform of integrated databases that provides statistics down to a local municipal level.
The discussion of the tourism space economy draws upon an analysis of the local tourism
database which contains details of the tourism performance of all local authorities in the country in
respect of the number of tourism trips differentiated by purpose of trip and origin (domestic or
international); bednights by origin of tourist (domestic or international); calculations of tourism
spend; and, of the contribution of tourism spend to local gross domestic product. Data is available
on an annual basis from 2001; in this analysis the focus is on the period 2001 and 2010, a decade
which culminated in South Africa’s hosting of the FIFA World Cup. The District Municipality
(DM) and Local Municipality (LM) boundaries and names for 2011 were used in this analysis.
The data is based on the Tourism Satellite Account (TSA) model which was developed by the
World Tourist Organisation (Frechtling 2012). The primary motivation behind TSA has been to
compensate for the lack of reliable and comparable information to assess the role of tourism in
national economies worldwide, and to develop a comprehensive and consistent set of principles to
measure the economic impact of the tourist industry (Frechtling 2012).
In analysing this material, it should be understood at the outset that the measurement of tourism
is not a perfect science. Although the TSA model can be a useful tool, care should be taken in
interpreting the model calculations which use historic data as well as economic research to make
assumptions and forecasts. Indeed, as a result of using a different methodology to that of the TSA,
the estimated national contribution of tourism to the GDP of South Africa in the Global Insight data
base (IHS 2014) is 6.3% (2010) which is higher than that given in the provisional estimates made in
2010 by Statistics South Africa. This said, it is noted that the Global Insight data is closer than that
of StatsSA to the estimates made by Saayman et al. (2012: 462) that tourism contributes an
estimated 7% of national GDP in South Africa.
In understanding the multi-dimensional nature of the tourism space economy the discussion will
unfold through four sections of material. These will relate to the following:
• The spatial patterns of tourism trips and bednights as a whole.
• Differentiation of the geographical distribution of tourism trips and bednights by origin of
tourist, whether domestic or international.
• The spatial patterns of trips by purpose of trip and differentiated into four sub-categories,
namely leisure, business, visiting friends and relatives (VFR) and other.
• The geography of total tourism spend and the contribution of tourism to local economies.
For each of these four themes of discussion, a profile of the leading destinations in 2010 and a
brief overview of major trends from 2001 to 2010, is presented.
Whilst it is acknowledged that 2010 was the year that South Africa hosted the FIFA Soccer World
Cup and national and regional tourism figures would be influenced by that, the focus of the paper
South African Journal of Geomatics, Vol. 6. No. 2, Geomatics Indaba 2017 Special Edition, August 2017
223
was not on analysing the impact of the event, nor on make statements about change in the industry
per se. The focus is rather on a more nuanced understanding of the comparative spatial distribution
and multi-dimensional nature of tourism.
4 Study Results and Discussion
4.1 The Spatial Patterns of Tourism Trips and Bednights as a Whole
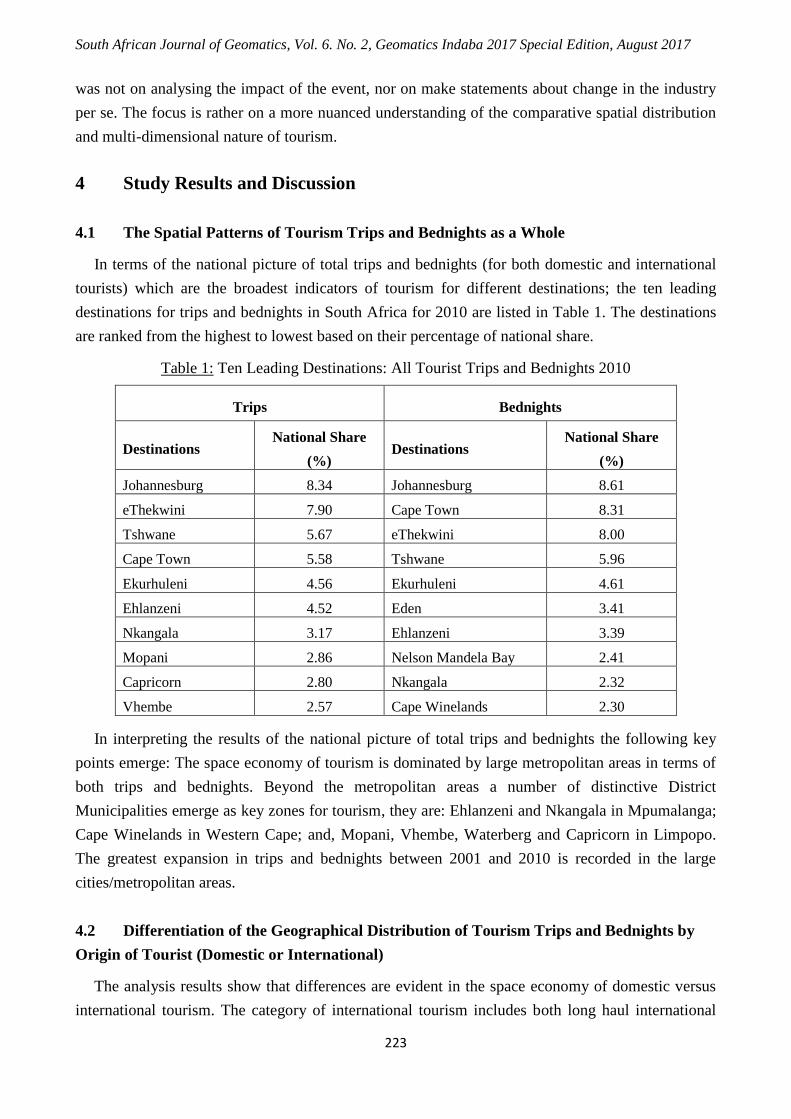
In terms of the national picture of total trips and bednights (for both domestic and international
tourists) which are the broadest indicators of tourism for different destinations; the ten leading
destinations for trips and bednights in South Africa for 2010 are listed in Table 1. The destinations
are ranked from the highest to lowest based on their percentage of national share.
Table 1: Ten Leading Destinations: All Tourist Trips and Bednights 2010
Trips Bednights
Destinations National Share
(%) Destinations
National Share
(%)
Johannesburg 8.34 Johannesburg 8.61
eThekwini 7.90 Cape Town 8.31
Tshwane 5.67 eThekwini 8.00
Cape Town 5.58 Tshwane 5.96
Ekurhuleni 4.56 Ekurhuleni 4.61
Ehlanzeni 4.52 Eden 3.41
Nkangala 3.17 Ehlanzeni 3.39
Mopani 2.86 Nelson Mandela Bay 2.41
Capricorn 2.80 Nkangala 2.32
Vhembe 2.57 Cape Winelands 2.30
In interpreting the results of the national picture of total trips and bednights the following key
points emerge: The space economy of tourism is dominated by large metropolitan areas in terms of
both trips and bednights. Beyond the metropolitan areas a number of distinctive District
Municipalities emerge as key zones for tourism, they are: Ehlanzeni and Nkangala in Mpumalanga;
Cape Winelands in Western Cape; and, Mopani, Vhembe, Waterberg and Capricorn in Limpopo.
The greatest expansion in trips and bednights between 2001 and 2010 is recorded in the large
cities/metropolitan areas.
4.2 Differentiation of the Geographical Distribution of Tourism Trips and Bednights by
Origin of Tourist (Domestic or International)
The analysis results show that differences are evident in the space economy of domestic versus
international tourism. The category of international tourism includes both long haul international

South African Journal of Geomatics, Vol. 6. No. 2, Geomatics Indaba 2017 Special Edition, August 2017
224
travel and regional African visitors, who constitute 78% of current international travellers to South
Africa. The ten leading destinations for domestic and International tourism together with their
percentage of national share trips and bednights for 2010 are listed in Table 2.
Table 2: Ten leading (local) destinations for both Domestic and International Tourist, 2010.
Domestic Tourist Destinations International Tourist Destinations
Trips Bednights
Trips
Bednights
Destination (%) Destination (%) Destination (%) Destination (%)
eThekwini 8.85 eThekwini 9.53 Johannesburg 15.28 Johannesburg 14.67
Johannesburg 6.59 Johannesburg 6.10 Tshwane 11.06 Cape Town 13.86
Cape Town 5.20 Cape Town 6.01 Cape Town 7.10 Tshwane 10.56
Tshwane 4.32 Tshwane 4.05 Ekurhuleni 7.08 Ekurhuleni 6.95
Ehlanzeni 3.99 Ekurheleni 3.64 Ehlanzeni 6.62 Eden 6.05
Ekurhuleni 3.93 Ehlanzeni 3.27 eThekwini 4.12 eThekwini 4.30
Nkangala 3.18 Nelson Mandela
Bay 2.98 West Rand 3.21 Cape Winelands 4.08
Capricorn 2.91 Buffalo City 2.70 Nkangala 3.11 Ehlanzeni 3.66
Mopani 2.89 OR Tambo 2.64 Eden 3.08 West Rand 3.11
Vhembe 2.80 Nkangala 2.58 Mopani 2.75 Overberg 2.35
Importantly, the top five domestic destinations account for 28% of trips and 29% of bednights.
Cape Town has weakened in terms of volume as a domestic tourism destination since 2001 and
between 2001-2010 records the largest absolute fall in domestic visitor trips. In terms of
metropolitan areas, Mangaung is also in decline. eThekwini recorded the highest growth as a
domestic tourism destinations and is followed by Johannesburg and Tshwane. The weakening of
Cape Town as a domestic destination is reflected in a massive drop in domestic bednights. There
are also declines in bednights at Mangauang and Ekurhuleni. Among DMs the largest absolute
declines in bednights are for OR Tambo, Thabo Mafuntsanyane and significant falls for Frances
Baard and Siyanda.
The top five international destinations account for 47% of all trips and 52% of bednights. This
shows that international tourism is much more geographically concentrated than the domestic
tourism patterns. The trend from 2001 in terms of trips for all metropolitan areas (except Buffalo
City which has a marginal absolute decline) shows strong growth in international visitors with the
highest expansion recorded in Johannesburg, Tshwane and Ekurhuleni. Among DMs the strongest
growth of international trips is to Ehlanzeni and Waterberg, Eden and Mopani. There is an absolute
decline in international tourist trips to Frances Baard, Siyanda and Namakwa. With respect to
bednights similar patterns can be noted. The strongest DMs are Ehlanzeni, Waterberg, Eden, Cape
Winelands, Capricorn while the weakest performances with the largest absolute declines are for
Frances Baard, Siyanda and Namakwa. Cape Town recorded the largest growth of bednights by

South African Journal of Geomatics, Vol. 6. No. 2, Geomatics Indaba 2017 Special Edition, August 2017
225
international visitors followed by Johannesburg, Ekurhuleni and eThekwini. All metropolitan areas
show a growth in bednights for international visitors.
The metropolitan areas with Johannesburg, Cape Town and Tswhane are the leading
international tourist destinations in South Africa while authorities such as Eden and Overberg make
a strong contributions. eThekwini, Johannesburg and Cape Town are the top domestic tourist
destinations but their growth is not as fast as smaller destinations.
4.3 The Spatial Patterns of Trips by Purpose of Trip
Spatial patterns of trips by “purpose of trip” are unpacked and discussed in this section in terms
of four different tourism segments, namely: leisure, business, visiting friends and relatives (VFR),
and other. The spatial distribution of the total number of trips for the different “purpose of trips” to
South African for 2010 were mapped. The bar chart in Figure 1 shows the percentage contribution
to national total for the business, leisure, visiting friends and relatives and “other” trips by district
authorities for 2010.
Table 3: Fifteen Leading “Trips by Purpose” Destinations: 2010
Business Leisure VFR Other
Destination (%) Destination (%) Destination (%) Destination (%)
City of
Johannesburg 17.96
City of Cape
Town 11.47 eThekwini 8.74
City of
Johannesburg 17.96
City of
Tshwane 12.95
City of
Johannesburg 10.30
City of
Johannesburg 6.66 City of Tshwane 12.95
Ekurhuleni 7.12 City of Tshwane 7.98 Ekurhuleni 4.65 Ekurhuleni 7.12
City of Cape
Town 6.80 Ehlanzeni 6.67
City of
Tshwane 4.40
City of Cape
Town 6.80
eThekwini 6.44 eThekwini 6.53 Ehlanzeni 4.34 eThekwini 6.44
Ehlanzeni 4.48 Eden 5.12
City of Cape
Town 3.62 Ehlanzeni 4.48
Eden 2.72 Ekurhuleni 4.45 Vhembe 3.45 Eden 2.72
Bojanala 2.14 Cape Winelands 3.42 Nkangala 3.07 Bojanala 2.14
West Rand 2.11 Cacadu 3.15 Mopani 3.06 West Rand 2.11
Cape Winelands 2.05 Waterberg 2.83 Bojanala 2.51 Cape Winelands 2.05
Mangaung 2.01 Mopani 2.38
UMgungundlo
vu 2.41 Mangaung 2.01
Gert Sibande 1.96 West Rand 2.31 Capricorn 2.36 Gert Sibande 1.96
Capricorn 1.91 Mangaung 2.22 Uthungulu 2.31 Capricorn 1.91
Nelson Mandela
Bay 1.73 Bojanala 2.07 O.R.Tambo 1.96
Nelson Mandela
Bay 1.73
Sedibeng 1.68
Nelson Mandela
Bay 2.04 Amathole 1.95 Sedibeng 1.68

South African Journal of Geomatics, Vol. 6. No. 2, Geomatics Indaba 2017 Special Edition, August 2017
226
4.3.1 Leisure
The top fifteen destination for leisure is listed in table 3. The table (column: leisure) shows the
percentage of national share of leisure trips by district authorities for 2010.
Important points to note with regard to leisure trips are the following. The top five leisure
destinations account for 41% of national share in 2001 and 2010 with a very slight decline in 2010.
The ten leading destinations, headed by Cape Town, are responsible for capturing an estimated 59%
of the national share of leisure trips. More than one-third of all leisure trips are accounted for by the
four metropolitan areas of Cape Town, eThekwini, Tshwane and Johannesburg, a finding which
reinforces the dominant role of these urban destinations in South Africa’s tourism space economy.
Outside of these areas, the leading DMs for leisure tourism are those around the Garden Route and
the nature tourism attractions of Kruger Park, its surrounds and the region of Waterberg in Limpopo
province. There is a relative consistency in leading leisure trip destinations between 2001 and 2010.
4.3.2 Business Tourism
The top fifteen destination for business is listed in table 3. The table (column: business) shows
the percentage of national share of business trips by district authorities for 2010.
With regard to business trips, the top five destinations account for 44% national share in 2001
and 49% share by 2010. There is a high degree of concentration in business tourism in Gauteng. It
is strongly concentrated upon the Johannesburg and Tshwane metropolitan areas followed by Cape
Town, eThekwini and Ekurhuleni. In 2010 these five metropolitan areas were responsible for
almost half of all national business trips. Together Johannesburg and Tshwane account for almost
30% of the national total. A key change since 2001 is the further strengthening of Johannesburg and
Tshwane in importance and a greater concentration of business tourism on these two centres with a
relative weakening of other metros (in particular Buffalo City). In terms of net change from 2001 to
2010, the overwhelming shift is towards Johannesburg and Tshwane and to a lesser extent
eThekwini and Cape Town.
4.3.3 Visiting Friends and Relatives (VFR) Tourism
Among the least well-understood dimensions of the South African tourism economy is tourism
related to visiting friends and relatives (VFR). It is known that VFR tourism is the largest element
or most popular form of the domestic tourism sector and that the drivers of VFR tourism are
markedly different to those of leisure or business tourism (Rule et al. 2004; Rogerson et al. 2005).
The VFR market shows a close relationship to the national distribution of population and is the
segment of tourism recognised to be most dominated by black tourists. The top fifteen destination
for VFR is listed in table 3. The table (column: VFR) shows the percentage of national share of
VFR trips by district authorities for 2010. The most important point to take cognisance of with
regard to VFR is that the top five destinations for VFR account for 29% of national share in 2001
and 28% share in 2010 indicating a much more geographically widespread pattern of tourism than
South African Journal of Geomatics, Vol. 6. No. 2, Geomatics Indaba 2017 Special Edition, August 2017
227
for leisure or business. Significantly, however, the list of leading destinations includes several
district municipalities which incorporate small towns and rural areas of South Africa. The Vhembe
DM and Mopani DM in Limpopo province emerge as significant tourism destinations for VFR
tourism.
4.3.4 Other Forms of Tourism
The category “other” is mainly dominated by two forms of tourism, namely health tourism or
religious (pilgrimage) tourism. It is by far the smallest category of tourism. The top fifteen
destination for “other” is listed in table 3. The table (column: other) shows the percentage of
national share of “other” trips by district authorities for 2010. The results indicate that the top five
destinations for “other” tourist trips account for 46% share in 2001 but 39% share in 2010, there has
been greater dispersion. The importance of certain DMs in Limpopo and KwaZulu-Natal which are
focal points for religious tourism is evident. The significance of Johannesburg and Tshwane and
other metros relates to the availability of medical facilities. Between 2001 and 2010 the most
notable change is the rise of Umzinyathi which is a focus for pilgrimage.
4.4 The Geography of Tourism Spend
The analysis now turns to examine spatial patterns of tourism spend and to the relative
contribution and importance of tourism to local economies. This is undertaken in terms of first
examining the patterns of total tourism spend and then the relative significance of tourism spend in
local areas as indexed by, firstly, average tourism spend per capita and, secondly, contribution of
tourism spend as a share of local GDP.
4.4.1 Spatial Patterns of Total Tourism Spend
The map in figure 2 shows the total tourism spend as a percentage of national share for 2010.
The data confirms that the impacts of tourism in South Africa are highly concentrated in a small
number of tourism destinations. The analysis of tourism spend in South African local authority
areas reveals that the leading ten areas account for 54.% of total tourism spend in 2010. It is evident
that the greatest amount of tourism spend is captured by South Africa’s major metropolitan areas
rather than the country’s secondary cities or small towns. Tourism is reinforcing the continued
dominance of the core regions of the South African space economy. In 2010, 38.6% of total
national tourism spend accrues to the five metropolitan areas of Cape Town, Johannesburg,
Tshwane, eThekwini, and Ekurhuleni. Although in terms of other indicators, Cape Town is not
always the leading local authority area, in terms of the critical indicator of total tourism spend it is
the leading destination and beneficiary of tourism growth in South Africa. DMs such as Eden, the
Cape Winelands and Ehlanzeni are important nodes for tourism spend. Beyond these areas of note
is also the relatively high share of tourism spend in Cacadu, Nkangala, West Rand and Overberg.
Between 2001 and 2010 the top eight destinations in ranked order for total tourism spend remain

South African Journal of Geomatics, Vol. 6. No. 2, Geomatics Indaba 2017 Special Edition, August 2017
228
unchanged, albeit the closing in of Johannesburg on the dominance of Cape Town. Beyond the
stability of leading destinations in the tourism space economy, however, a number of significant
shifts can be noted. In terms of metros both Nelson Mandela Bay and Buffalo City have increased
in relative importance.
4.4.2 Relative Significance of Tourism for Local Economies
Using an indicator of average tourism per capita spend in local authorities, a picture emerges of
those areas of South Africa in which the impact of tourism spend is most strongly experienced. The
map in Figure 2 shows the average per capita tourism spend for 2001 and 2010.
The local authorities with the highest average per capita tourism spend illustrate the critical
importance of tourism outside of the metropolitan areas. There are no metropolitan areas under the
leading 20 destinations for 2010.
What emerges is that the local impacts of tourism are critical in many secondary towns and small
towns across South Africa. Between 2001 and 2010 some significant changes are in evidence. The
most dramatic is the rise in significance of the local impact of tourism for Prince Albert and also for
Knysna, Stellenbosch, Mossel Bay, Oudtshoorn and George.
Figure 2: Average Tourism Spend per Capita
A second indicator of the relative importance of tourism for local economies is the estimated
contribution of tourism spend as a contribution to local GDP. The maps in Figure 3 highlight the
importance of tourism to the local GPD of the non-metropolitan areas.

South African Journal of Geomatics, Vol. 6. No. 2, Geomatics Indaba 2017 Special Edition, August 2017
229
Figure 3: Tourism Spend as a Percentage of Local Gross Domestic Product
This analysis once again discloses the vital role of tourism in the non-metropolitan areas of
South Africa. The findings reveal that in many secondary and small towns of the country tourism is
a critical sector – often the lead sector – in local economies. In 2001 there were over 60 District and
Local Municipalities where the proportion of tourism spend to total local GDP exceeded at least 15
percent. In the case of 12 local governments the contribution of tourism spend to local GDP is in
excess of 30 percent; for eight local governments the contribution of tourism spend to local GDP is
over 40 percent; and, for five local governments in 2010 tourism spend accounted for more than
50% of local GDP. Overall, these results point to the critical need for capacity development for
tourism planning in local governments outside of the leading metropolitan areas of South Africa. As
a whole in 2001, 106 local authorities (38%) were above the national average of estimated tourism
contribution to national GDP. By 2010, 167 local authorities (60%) were above the national
average. This shows the great dependence of South African local authorities upon the contribution
of tourism to local economies. Between 2001 and 2010 a relative increase in tourism compared to
the rest of the economic output in municipal economies is evident in several areas. Critically,
several of these areas which are increasingly reliant upon tourism fall within the 27 Priority Rural
Districts identified by the Department of Rural Development and Land Reform (DRDLR),
including several former Homeland areas (DRDLR, 2013). The comparative analyses highlight the
existing and potential role of tourism as a vehicle for regional development, even in the marginal
areas of the South African space economy.
5 Conclusions
The analyses of national and international tourism trips and spending illustrate the significant
role of metropolitan areas, secondary and coastal cities, and typical tourism destinations in the
tourism space economy. Beyond the metropolitan areas a number of distinctive District
Municipalities emerge as key zones for tourism, they are: Ehlanzeni and Nkangala in Mpumalanga;
the Cape Winelands in the Western Cape; Mopani, Vhembe, Waterberg and Capricorn in Limpopo.
The greatest growth in trips and bednights between 2001 and 2010 is recorded in the large
cities/metropolitan areas.

South African Journal of Geomatics, Vol. 6. No. 2, Geomatics Indaba 2017 Special Edition, August 2017
230
With regard to business trips, the top five destinations accounted for a 49% share by 2010. There
is a high degree of concentration in business tourism in Gauteng, followed by Cape Town and
eThekwini. The spatially comparative analyses of the trips also illustrate the significance and
different spatial pattern of trips generated through the visiting of friends and family across the South
African landscape. In this regard it is evident that the more rural municipalities and especially
former homeland areas play a significant role nationally, but also in terms of opportunities for local
municipalities.
Considering the comparative analyses of tourism spend in relation to population and the
economic output of municipalities, the significant role of tourism in areas that are not necessarily
seen as top tourism destinations is also illustrated. The local municipalities with the highest average
per capita tourism, as well as local municipalities where tourism spend seems significant in relation
to economic output, emphasise the critical importance of tourism outside of the metropolitan areas.
The analyses point to the local impacts and significance of tourism, and the possible associated
opportunities in a range of rural regions and many secondary and small towns across South Africa.
As indicated in the first part of the paper, it is widely believed that regional and local tourism
strategies need to confront the traditional thinking around tourism destinations and opportunities. In
support thereof the paper illustrates the significance and opportunities of the tourism industry in a
range of municipalities across the South African landscape, and the value that alternative spatial
perspectives and comparative analyses can provide in understanding the multi-dimensional nature
of the tourism industry and its diverse national, regional, and local significance.
6 References
Christie, I., Fernandes, E., Messerli, H. & Twining-Ward, L. 2013. Tourism in Africa: Harnessing Tourism
for Growth and Improved Livelihoods. Washington DC: The World Bank.
Economic Development Department. 2011. The New Growth Path. Pretoria: Department of Economic
Development.
Department of Rural Development and Land Reform. 2013. Priority Districts Analyses for Economic
Transformation. Pretoria: Department of Rural Development and Land
Department of Tourism 2011. National Tourism Sector Strategy. Pretoria: Department of Tourism.
Douglas C., Frechtling, A. 2010. The tourism satellite account: A primer. Annals of Tourism Research 37
(1), 136-153.
Frechtling D. 2012: Forecasting Tourism Demand. London: Routledge IHS Global Insight. 2014. ReX
Regional Explorer. Centurion: IHS Global Insight.
Hatzichronoglou, T. 1997, Revision of the High-Technology Sector and Product Classification", OECD
Science, Technology and Industry Working Papers, No. 1997/02, OECD Publishing, Paris.
http://dx.doi.org/10.1787/134337307632
Jones, C., Munday, M. 2001.Tourism and local economic development: Three case studies. Paper presented
at the European Regional Science Association 41st Annual Meeting, Zagreb, August.
Rogerson, C.M. 2014a. The Uneven Geography of Tourism in South Africa. African Journal of Hospitality,
Tourism and Leisure, 3 (1), 1-15.

South African Journal of Geomatics, Vol. 6. No. 2, Geomatics Indaba 2017 Special Edition, August 2017
231
Rogerson, C.M. and Lisa Z. 2005: ‘Sho’t left’: promoting domestic tourism in South Africa, Urban Forum,
16, 88-111.
Rogerson, C.M. 2015. Tourism and Regional Development: The Case of South Africa’s ‘Distressed Areas’.
Development Southern Africa, 32, 277-291.Rogerson C.M. & Lisa, Z. (2005).‘Sho’t left’: Promoting
domestic tourism in South Africa. Urban Forum 16(2/3), 88-111.
Rogerson, C. M. & Visser, G., Eds. 2004. Tourism and Development Issues in Contemporary South Africa.
Pretoria: Africa Institute of South Africa.
Rule, S. Viljoen, J., Zama, S., Struwig, J., Langa, Z., Bouare, O. 2004. Visiting friends and relatives: South
Africa’s most popular form of domestic tourism. In C.M. Rogerson & G. Visser (Eds.), Tourism and
Development Issues in Contemporary South Africa, (pp. 78-101). Pretoria: Africa Institute of South
Africa.
Saayman, M., Rossouw, R. and Krugell, W. 2012. The impact of tourism on poverty in South Africa.
Development Southern Africa, 29, 462-487.
The Presidency. 2006. The National Spatial Development Perspective. The Presidency. South Africa
Van Huysteen, E., Maritz, J., McKelly D., Oranje M., Jordaan A., Rogerson C. 2014. RESOURCE
DOCUMENT: TOWARDS SPATIAL PERSPECTIVES IN SUPPORT OF THE NGP. Viewed: June 2017,
<http://stepsa.org/pdf/projects/edd_tools/Draft%20Resource%20Document%20Spatial%20Perspectives%
20NGP%20v3.pdf>.
Visser, G. 2007. Geography of tourism. In R. George (ed.) Managing Tourism in South Africa (pp. 34-52).
Cape Town: Oxford University Press.
Visser, G. & Hoogendoorn, G. 2012. Uneven tourism development in South Africa: Another ongoing
struggle Africa Insight 42 (2), 66-75.
Visser, G and Rogerson, CM. 2004. Researching the South African tourism and development nexus.
GeoJournal, 60, 201-215
World Bank 2010. Kenya’s Tourism: Polishing the Jewel. Washington DC: World Bank Africa Region
Finance and Private Sector Department.
World Tourism Organisation. 2000. Tourism 2020 vision. Madrid; World Tourism Organisation. Madrid,
WTO