Spatial-Temporal Features of Wuhan Urban Agglomeration...
17
Journal of Building Construction and Planning Research, 2017, 5, 14-29 http://www.scirp.org/journal/jbcpr ISSN Online: 2328-4897 ISSN Print: 2328-4889 DOI: 10.4236/jbcpr.2017.51002 March 8, 2017 Spatial-Temporal Features of Wuhan Urban Agglomeration Regional Development Pattern—Based on DMSP/OLS Night Light Data Mengjie Zhang 1* , Wenwei Miao 1 , Yingpin Yang 2 , Chong Peng 1 , Yaping Huang 1 1 School of Architecture and Urban Planning, Huazhong University of Science and Technology, Wuhan, China 2 Institute of Remote Sensing and Digital Earth, Chinese Academy of Sciences, Beijing, China Abstract Based on the night light data, urban area data, and economic data of Wuhan Urban Agglomeration from 2009 to 2015, we use spatial correlation dimen- sion, spatial self-correlation analysis and weighted standard deviation ellipse to identify the general characteristics and dynamic evolution characteristics of urban spatial pattern and economic disparity pattern. The research results prove that: between 2009 and 2013, Wuhan Urban Agglomeration expanded gradually from northwest to southeast and presented the dynamic evolution features of “along the river and the road”. The spatial structure is obvious, forming the pattern of “core-periphery”. The development of Wuhan Urban Agglomeration has obvious imbalance in economic geography space, pre- senting the development tendency of “One prominent, stronger in the west and weaker in the east”. The contract within Wuhan Urban Agglomeration is gradually decreased. Wuhan city and its surrounding areas have stronger eco- nomic growth strength as well as the cities along The Yangtze River. However, the relative development rate of Wuhan city area is still far higher than other cities and counties. Keywords Night Light Data, Urban Spatial Pattern, Economic Disparity Pattern, Wuhan Urban Agglomeration 1. Introduction Urban agglomeration is an area where the economy, politics, culture and system are highly integrated, and its formation and development process is affected by the space, economy, society and multiple factors. Therefore, the research on the How to cite this paper: Zhang, M.J., Miao, W.W., Yang, Y.P., Peng, C. and Huang, Y.P. (2017) Spatial-Temporal Features of Wu- han Urban Agglomeration Regional De- velopment Pattern—Based on DMSP/OLS Night Light Data. Journal of Building Con- struction and Planning Research, 5, 14-29. https://doi.org/10.4236/jbcpr.2017.51002 Received: February 3, 2017 Accepted: March 5, 2017 Published: March 8, 2017 Copyright © 2017 by authors and Scientific Research Publishing Inc. This work is licensed under the Creative Commons Attribution International License (CC BY 4.0). http://creativecommons.org/licenses/by/4.0/ Open Access
-
Upload
vuongkhanh -
Category
Documents
-
view
218 -
download
0
Transcript of Spatial-Temporal Features of Wuhan Urban Agglomeration...

Journal of Building Construction and Planning Research, 2017, 5, 14-29 http://www.scirp.org/journal/jbcpr
ISSN Online: 2328-4897 ISSN Print: 2328-4889
DOI: 10.4236/jbcpr.2017.51002 March 8, 2017
Spatial-Temporal Features of Wuhan Urban Agglomeration Regional Development Pattern—Based on DMSP/OLS Night Light Data
Mengjie Zhang1*, Wenwei Miao1, Yingpin Yang2, Chong Peng1, Yaping Huang1
1School of Architecture and Urban Planning, Huazhong University of Science and Technology, Wuhan, China 2Institute of Remote Sensing and Digital Earth, Chinese Academy of Sciences, Beijing, China
Abstract Based on the night light data, urban area data, and economic data of Wuhan Urban Agglomeration from 2009 to 2015, we use spatial correlation dimen-sion, spatial self-correlation analysis and weighted standard deviation ellipse to identify the general characteristics and dynamic evolution characteristics of urban spatial pattern and economic disparity pattern. The research results prove that: between 2009 and 2013, Wuhan Urban Agglomeration expanded gradually from northwest to southeast and presented the dynamic evolution features of “along the river and the road”. The spatial structure is obvious, forming the pattern of “core-periphery”. The development of Wuhan Urban Agglomeration has obvious imbalance in economic geography space, pre-senting the development tendency of “One prominent, stronger in the west and weaker in the east”. The contract within Wuhan Urban Agglomeration is gradually decreased. Wuhan city and its surrounding areas have stronger eco- nomic growth strength as well as the cities along The Yangtze River. However, the relative development rate of Wuhan city area is still far higher than other cities and counties.
Keywords Night Light Data, Urban Spatial Pattern, Economic Disparity Pattern, Wuhan Urban Agglomeration
1. Introduction
Urban agglomeration is an area where the economy, politics, culture and system are highly integrated, and its formation and development process is affected by the space, economy, society and multiple factors. Therefore, the research on the
How to cite this paper: Zhang, M.J., Miao, W.W., Yang, Y.P., Peng, C. and Huang, Y.P. (2017) Spatial-Temporal Features of Wu-han Urban Agglomeration Regional De-velopment Pattern—Based on DMSP/OLS Night Light Data. Journal of Building Con-struction and Planning Research, 5, 14-29. https://doi.org/10.4236/jbcpr.2017.51002 Received: February 3, 2017 Accepted: March 5, 2017 Published: March 8, 2017 Copyright © 2017 by authors and Scientific Research Publishing Inc. This work is licensed under the Creative Commons Attribution International License (CC BY 4.0). http://creativecommons.org/licenses/by/4.0/
Open Access

M. J. Zhang et al.
15
regional development pattern of urban agglomeration not only pays attention to its visual development pattern, but also focuses on the potential economic geo-graphic pattern, namely, differentiation pattern inside the urban agglomeration. At present, the research on the spatial pattern of the urban agglomeration has changed from mainly relying on qualitative analysis to the comprehensive analy-sis combining qualitative and quantitative analysis [1] [2] [3]. However, it is dif-ficult for the single statistical index to make a comprehensive characterization of the spatial development of urban agglomeration, and it is in urgent need of ex-panding the new methodology and new data sources. DMSP/OLS night light da-ta acquired by American military meteorological satellite DMSP cover the in-formation closely related to the distribution of population, city, economy and other factors and realize the organic integration of single statistical index with the comprehensive index system. Compared to the traditional remote sensing data and statistical data, these are available, intuitive and comprehensive and are applicable to the research on the spatial development pattern of urban agglome-ration.
The research carried out through the night light data are mainly centered on the urbanization extension [4] [5] [6] [7], economic and population estimate [8] [9] [10], carbon emission [11], light pollution and other aspects [12]. Wang Yueyun, Liao Bing, et al. use the light data to extract the urban construction land and carry out the empirical research in Jiangsu Province and Jiangxi Province by establishing the urban construction land extension form evaluation index [13] [14]; Xu Mengjie, et al. establish the spatial pattern of the Yangtze River Delta with the night light data reconstruction [15], and Chang Ting, et al. carry out the analysis and research on the spatial and temporal process and characteristics of the Yangtze River Delta urban agglomerations during the urban expansion in recent 10 years [16]; Shen Tiyan, et al. make the analysis on the spatial structure of urban system in the Yangtze River Economic Zone and its evolution characte-ristics [17]. The author holds that the comprehensive consideration shall be made from two aspects-space and economy to make the comprehensive and ac-curate research on the regional development pattern of urban agglomeration. The night light data are the new data source. The application objects should not only include the state-level areas and urban agglomerations, but also cover the regional-level and prefecture-level urban agglomerations, thus verifying the ap-plicability of data in the different scale space and enriching the achievements of empirical application research. Therefore, this paper selected Wuhan urban ag-glomeration as the research object, carried out the investigation at the coun-ty-level space with the night light data and economic statistical data, made intui-tive recognition of urban spatial pattern, and deeply analyzed the economic dif-ference pattern.
2. Data Source and Research Method 2.1. Research Area
Wuhan urban agglomeration covers Wuhan and its 9 surrounding cities includ-
M. J. Zhang et al.
16
ing Huangshi, Ezhou, Xiaogan, Huanggang, Xianning, Xiantao, Tianmen and Qianjiang within the range of about 100 kilometers of radius, with the area of 58,052 km2, which is commonly known as “1 + 8 urban circle”. Upon the inves-tigation at the county (provincial directly governing city, county-level city and district) level, Wuhan urban agglomeration includes 39 basic spatial units.
2.2. Data Acquisition and Processing
The data used by the research are mainly remote sensing data (night light data), statistical data and auxiliary GIS data. Among them, night light data are from the website of the National Geophysics Data Center which cover the night light remote sensing images from 1999 to 20131. The basic data used by the research are the stable light image data which are obtained through the direct averaging processing of VNIR channel gray value throughout the year after the influences from the cloud, flame and other occasional noises are removed The scope of data gray value is 1 - 63, and spatial resolution is 1 km. This paper selected 2009-2013 Wuhan urban agglomeration night light influence as the research data.
Since the light has the overflow characteristic, the light should be within the boundary range of the real built-up area through the processing in the process of using the night light data to extract the urban built-up area. The process is data acquisition (stable data)-threshold setting (data selection)-superposition of ad-ministrative boundaries (data approval)-final data. The specific method is set-ting the initial threshold of night lighting intensity, making statistics of light plaque area of each spatial unit, and comparing them with the built-up area until the land-use area of built-up area extracted by light data under a threshold con-dition is sufficiently close to the statistical data. Since DN (remote sensing image pixel brightness value) is <=63, the initial threshold is 40, and the threshold of different cities in different years is different, with 2013 spatial information ex-traction threshold as an example (Table 1).
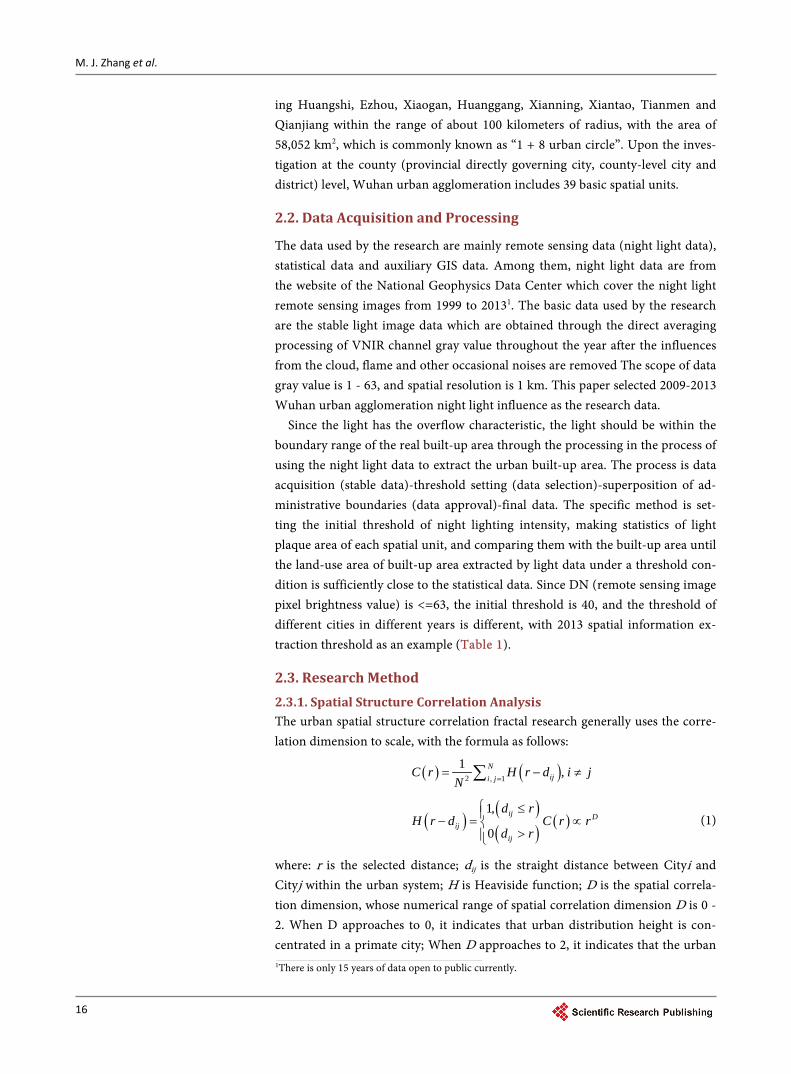
2.3. Research Method 2.3.1. Spatial Structure Correlation Analysis The urban spatial structure correlation fractal research generally uses the corre-lation dimension to scale, with the formula as follows:
( ) ( )2 , 1
1 ,Niji jC r H r d i j
N == − ≠∑
( ) ( )( )
( )1,
0
ij Dij
ij
d rH r d C r r
d r
≤− = ∝>
(1)
where: r is the selected distance; dij is the straight distance between Cityi and Cityj within the urban system; H is Heaviside function; D is the spatial correla-tion dimension, whose numerical range of spatial correlation dimension D is 0 - 2. When D approaches to 0, it indicates that urban distribution height is con-centrated in a primate city; When D approaches to 2, it indicates that the urban
1There is only 15 years of data open to public currently.

M. J. Zhang et al.
17
Table 1. Spatial information threshold of Wuhan urban agglomeration based on DMSP/ OLS data in 2013.
City Threshold Extraction area (km2) Statistical area (km2) Relative error (%)
Wuhan 62 514 534 −0.0375
Huangshi 53 78 88 −0.1136
Daye 56 18 27 −0.3333
Ezhou 51 77 60 0.2833
Huanggang 53 50 47 0.0638
Macheng 48 27 27 0
Wuxue 48 23 24 −0.0417
Xiaogan 51 63 62 0.0161
Yingcheng 47 46 46 0
Anlu 47 22 22 0
Hanchuan 47 26 26 0
Xianning 49 74 72 0.0278
Chibi 49 28 26 0.0769
Xiantao 45 67 67 0
Tianmen 42 79 80 −0.0125
Qianjiang 50 55 50 0.10
spatial distribution aggregation is not significant, and correlation function is weak; When D approaches to 1, it indicates that the urban spatial concentration presents the linear distribution along the railway, highway, river and other axes [18].
2.3.2. Urban Spatial Evolution Process Analysis To measure the urban spatial evolution of Wuhan urban agglomeration in 5 years, the standard deviation elliptical figure can be made. The ellipse center re-flects the relative position and change of core of factor spatial layout; Long axis and short axis of the ellipse characterize the dispersion degree of factor spatial layout in the primary and secondary direction respectively. The rotation angle reflects the main trend direction of its distribution; The area of the ellipse cha-racterizes the concentration or dispersion degree of factor spatial distribution [19]. The standard deviation ellipse of different years can be used to observe the dynamic characteristics of core, denseness, direction and form of discrete data changing along with the time in the spatial distribution [20].
2.3.3. Economic Difference Spatial Pattern Analysis 1) Coefficient of Variable is used to measure the relative difference level of re-
gional economic development.
( )2
11n
ii Y YSCVY Y n
=−
= =∑
(2)

M. J. Zhang et al.
18
2) The global and local spatial auto-correlation analyses were used to identify the static and dynamic pattern characteristics of the economic geography of Wuhan urban agglomeration.
① The global Moran's I index can be used to measure the spatial correlation and spatial difference degree among regions. Moran’s I value is between −1 and 1. The value more than 0 indicates the positive correlation, while the value less than 0 indicates the negative correlation. If the value is larger, the spatial distri-bution correlation is more significant. What’s more, the value approaching to 0 indicates that the spatial distribution presents the random distribution. ② LISA (Local Indicators of Spatial Association) analysis can measure the
correlation of the regional spatial units, and conclude the spatial agglomeration area.
3. Results and Analyses 3.1. Urban Spatial Pattern 3.1.1. General Characteristics According to the original night light image map (Figure 1) of Wuhan urban ag-glomeration from 2009 to 2013, the light pixel brightness and density increase year by year, which is embodied in the constant increase of spatial activity inten-sity. The overall urban spatial distribution of Wuhan urban agglomeration pre-sents the core-edge structure with relatively dense core and relatively sparse edge. Wuhan and Xianning, Xiaogan, Ezhou and Huangshi gradually gather into the core urban concentration area. Meanwhile, the surrounding space joints also develop constantly and form several sub-regional spaces, presenting the radial core urban concentration area.
According to the spatial correlation dimension model in the research method, the distance among spatial units of urban agglomeration is established into 39*39 matrix (due to the limited length, the original matrix data are omitted)2. To facilitate the processing, the Formula (3) can be used to select yardstick r,
Figure 1. The night light image of Wuhan Urban Agglomeration from 2009 to 2013. (a) 2009; (b) 2010; (c) 2011; (d) 2012; (e) 2013.
2The linear distance of two palces is calculated by Google map.
M. J. Zhang et al.
19
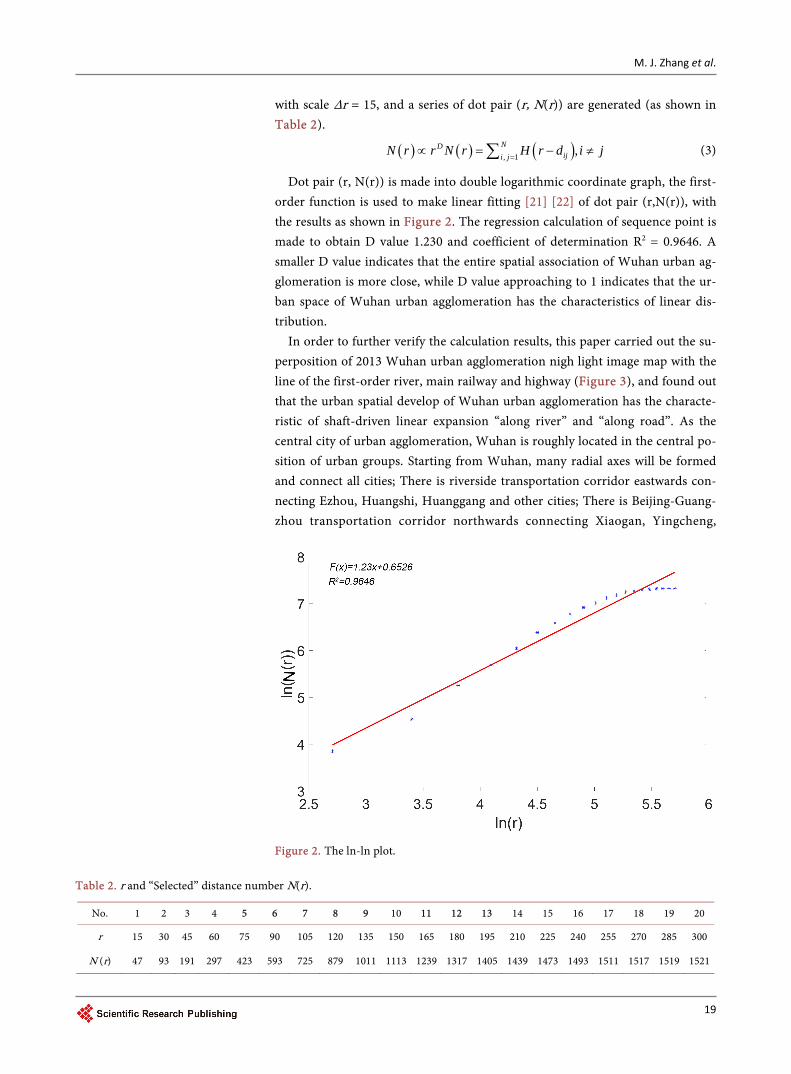
with scale Δr = 15, and a series of dot pair (r, N(r)) are generated (as shown in Table 2).
( ) ( ) ( ), 1 ,NDiji jN r r N r H r d i j
=∝ = − ≠∑ (3)
Dot pair (r, N(r)) is made into double logarithmic coordinate graph, the first- order function is used to make linear fitting [21] [22] of dot pair (r,N(r)), with the results as shown in Figure 2. The regression calculation of sequence point is made to obtain D value 1.230 and coefficient of determination R2 = 0.9646. A smaller D value indicates that the entire spatial association of Wuhan urban ag-glomeration is more close, while D value approaching to 1 indicates that the ur-ban space of Wuhan urban agglomeration has the characteristics of linear dis-tribution.
In order to further verify the calculation results, this paper carried out the su-perposition of 2013 Wuhan urban agglomeration nigh light image map with the line of the first-order river, main railway and highway (Figure 3), and found out that the urban spatial develop of Wuhan urban agglomeration has the characte-ristic of shaft-driven linear expansion “along river” and “along road”. As the central city of urban agglomeration, Wuhan is roughly located in the central po-sition of urban groups. Starting from Wuhan, many radial axes will be formed and connect all cities; There is riverside transportation corridor eastwards con-necting Ezhou, Huangshi, Huanggang and other cities; There is Beijing-Guang- zhou transportation corridor northwards connecting Xiaogan, Yingcheng,
Figure 2. The ln-ln plot.
Table 2. r and “Selected” distance number N(r).
No. 1 2 3 4 5 6 7 8 9 10 11 12 13 14 15 16 17 18 19 20
r 15 30 45 60 75 90 105 120 135 150 165 180 195 210 225 240 255 270 285 300
N (r) 47 93 191 297 423 593 725 879 1011 1113 1239 1317 1405 1439 1473 1493 1511 1517 1519 1521

M. J. Zhang et al.
20
Figure 3. The night light image of Wuhan Urban Agglomeration in 2013 with the main river, railway and highway.
Yunmeng, Dawu and other cities; There is Wuhan-Yichang transportation cor-ridor westwards connecting three cities, “Xiantao, Tianmen and Qianjiang”; There is Wuhan-Xianning transportation corridor southwards connecting Xian-ning and Changsha-Zhuzhou-Xiangtan urban agglomeration; There is Shang-hai-chengdu transportation corridor northeastwards connecting Macheng and other cities in Dabieshan area; There is Wuhan-Shiyan transportation corridor connecting Xiangyang, Shiyan and other cities.
3.1.2. Dynamic Evolution Characteristics According to the built-up area of each spatial unit of Wuhan urban agglomera-tion extracted by 2009-2013 night light data, this paper analyzed the urban spa-tial change of Wuhan urban agglomeration in 5 years. The area of built-up area of Wuhan urban agglomeration in 5 years is 1004 km2, 1096.1 km2, 1153 km2, 1189.5 km2 and 1258 km2 respectively, and urban space presents the trend of ex-panding year by yea [23]. Compared to the area of built-up area of 2009 and 2013, the growth range is not large.
In order to further measure and find out the spatial direction of the urban spatial change of Wuhan urban agglomeration, GIS was used to draw the stan-dard deviation ellipse and changing track of core (Figure 4) of the urban space of Wuhan urban agglomeration in 5 years. In these 5 years, the ellipse area of Wuhan urban agglomeration increases from 64,773.758731 km2 in 2009 to 81,235.313993 km2 in 2013. There is a certain increase in both long axis and short axis direction, and the increase in the short axis direction is more signifi-cant (Table 3); The core of urban agglomeration has the local fluctuations, but it

M. J. Zhang et al.
21
Figure 4. Standard deviation ellipse from 2009 to 2013 Table 3. Variation of standard deviation ellipse parameters from 2009 to 2013.
Year Xcoordinates of the center
Y coordinates of the center
Major axis (km)
Minor axis (km)
Area (km2) Rotation
Angle
2009 114.364638 30.499724 1.732796 0.831513 64773.758731 102.917663
2010 114.324228 30.528621 1.724956 0.937511 72724.104855 98.839757
2011 114.344102 30.522232 1.711087 0.940554 72368.1725275 100.35413
2012 114.309468 30.523268 1.805727 0.888247 72123.789934 101.001741
2013 114.290524 30.494316 1.844574 0.979664 81235.313993 101.919305
is still located in the urban area of Wuhan. It mainly presents the westward shifting in the longitude direction and the fluctuation in the latitude direction. It indicates that the entire spatial development of Wuhan urban agglomeration presents the characteristics of first moving towards northwest and then towards southwest. The spatial growth is mainly concentrated on the western cities.
3.2. Economic Difference Pattern 3.2.1. General Characteristics The night light data can synthetically characterize the breadth and intensity of human activity and is closely related to the urban economic factor. Therefore, this paper makes the spatial visualization of the night lighting intensity vector data of each spatial unit on the GIS platform (Figure 5). The overall develop-ment of Wuhan urban agglomeration has the difference and imbalance in the economic geographic space and presents the development trend of “stronger in the west than the east”.
In order to further know the economic difference pattern of Wuhan urban ag-glomeration, in combination with GDP, per capita GDP, social fixed investment assets and total social consumable retail sales data of Wuhan urban agglomera-

M. J. Zhang et al.
22
Figure 5. The night light geographical distribution map of Wuhan Urban Agglomeration from 2009 to 2013. (a) 2009; (b) 2010; (c) 2011; (d) 2012; (e) 2013. tion counties (districts) in 2015 (Figure 6). Upon the comprehensive judgment of analysis results, the development of Wuhan urban agglomeration is very un-balanced. Wuhan has the significant polarization, with developed economic areas locating in Wuhan municipal district and Wuhan-Ezhou-Huangshi-Hua- nggang urban concentration area and economically backward areas locating in the east (southeast and northeast) of Wuhan urban agglomeration.
3.2.2. Dynamic Change Characteristics This paper selected GDP data of various cities and counties of Wuhan urban ag-glomeration in 2009 and 2015, calculated the average annual growth rate and relative development rate (NICH)3 of GDP, made the quantitative analysis and spatial visualization based on ArcGIS platform (Figure 7).
In terms of average annual growth rate, the regions with faster development speed from 2009 to 2015 of Wuhan urban agglomeration are mainly concen-trated on the central part and neighboring cities and counties of Wuhan, but Wuhan municipal district with larger economic aggregate doesn't display the outstanding development speed; In addition, due to the limited topographic conditions, the development speed of Dawu County, Xiaochang County, Ying-shan County, Luotian County and other regions is slower.
In terms of relative development rate, the regions with better economic growth ability are still in the middle part of Wuhan urban agglomeration, and the growth ability of Wuhan municipal district is especially outstanding and its role in driving the surrounding hinterland areas is also quite significant. Cities along the Yangtze River area such as Qianjiang, Xiantao, Hanchuan, etc. also have better economic growth ability; The northern, eastern and southern parts of Wuhan city circle have the poorer economic growth ability.
3The ratio of GDP in each spatial unit to t GDP of the whole region in a given period of time.

M. J. Zhang et al.
23
(a)
(b)

M. J. Zhang et al.
24
(c)
(d)
Figure 6. Spatial-economic geography pattern of Wuhan Urban Agglomeration based on spatial interpolation method. (a) GDP; (b) Per capita GDP; (c) Total social fixed investment; (d) Total retail sales of consumer goods.

M. J. Zhang et al.
25
(a)
(b)
Figure 7. The analysis of Wuhan Urban Agglomeration economic cold-hot zone with average annual growth rate and relative development rate. (a) GDP growth rate; (b) Relative growth rate.

M. J. Zhang et al.
26
This paper further carried out the significance level LISA analysis on two in-dicators-average annual growth rate and relative development rate (NICH) and identifies the growth agglomeration partition of Wuhan urban agglomeration (Figure 8).
In terms of average annual growth rate, Wuhan urban agglomeration formed the high-high agglomeration area, high-low agglomeration area and low-high agglomeration area from 2009 to 2015, namely, growth diffusion area, growth polarization area and growth subsidence area. The growth diffusion area is lo-cated in the middle parts (Jiangxia District, Hanjiang District and Caidian Dis-
(a)
(b)
Figure 8. Economic growth cluster districts of Wuhan Urban Agglomeration. (a) Annual growth rate; (b) Relative growth rate.

M. J. Zhang et al.
27
trict under the jurisdiction of Wuhan, as well as Jiayu County under the jurisdic-tion of Xianning); Growth polarization area is located in Daye under the juris-diction of Huangshi; The growth subsidence area is located in Wuhan municipal district, indicating that the surrounding growth of this area is faster.
In terms of relative development rate, Wuhan city circle only formed the high-high agglomeration area from 2009 to 2015, namely, growth diffusion area. It is worth noting that there is only one growth diffusion area, namely, Wuhan municipal district, which indicates that though the average annual growth of Wuhan municipal district is slow, yet its relative development rate is far more than that of other cities and counties.
4. Conclusions and Discussion
1) General characteristics of urban spatial distribution of Wuhan urban ag-glomeration present the core-edge structure with relatively dense core and rela-tively sparse edge. Wuhan and Xianning, Xiaogan, Ezhou and Huangshi gradu-ally gather into the core urban concentration area. Meanwhile, the surrounding space joints also develop constantly and form several sub-regional spaces, pre-senting the radial core urban concentration area.
2) The spatial correlation of Wuhan urban agglomeration is significant, and its urban land has the characteristic of shaft-driven linear expansion “along river” and “along road”. With Wuhan as the center, six radial transportation corridors eastwards, westwards, southwards, northwards, northeastwards and northwest-wards are formed to connect various city and town clusters.
3) In 2009-2013, the spatial extension of Wuhan urban agglomeration was mainly concentrated on the western cities and presented the characteristic of first moving towards northwest and then towards southwest. In 5 years, the ur-ban space of Wuhan urban agglomeration presents the trend of expanding year by year, but its growth range is smaller. The core of urban agglomeration has the local fluctuations, but it is still located in the urban area of Wuhan.
4) The overall development pattern of Wuhan urban agglomeration presents the imbalance characteristic of “one predominant core, stronger in the west than the east”. At present, the economic development of various counties and cities in the agglomeration area is still at the stage of competition being stronger than cooperation. The developed economic areas are located in Wuhan municipal district and Wuhan-Ezhou-Huangshi-Huanggang urban concentration area, while the economically backward areas are located in the east of Wuhan city circle.
5) Wuhan urban agglomeration formed three growth agglomeration areas- growth diffusion area, growth polarization area and growth subsidence area from 2009 to 2015. The economic growth ability of Wuhan is relatively strong, and its role in driving the surrounding hinterland areas is also quite significant. Cities along the Yangtze River area such as Qianjiang, Xiantao, Hanchuan, etc. also have better economic growth ability. However, the development speed of Dawu County, Xiaochang County, Yingshan County, Luotian County and other counties in the northeast and southeast regions of urban agglomeration is slower.

M. J. Zhang et al.
28
Based on the above results, the further optimization of spatial pattern of Wu-han urban agglomeration should not only emphasize the clustering of Wuhan and its surrounding areas, but also further improve the coordination of hierar-chical sub-regional space and overall space. It should focus on enhancing the driving role of core node cites, strengthen the economic relation, improve the economic strength of the county spatial unit, and gradually narrow the econom-ic difference inside Wuhan urban agglomeration.
Support
This study research is supported by Science and Technology Support Project of Hubei Province (No. 2015BDF040).
References [1] Wu, J.S., Liu, H., Peng, J., et al. (2014) Hierarchical Structure and Spatial Pattern of
China’s Urban System: Evidence from DMSP/OLS Nightlight Data. Acta Geogra-phica Sinica, 69, 760-770.
[2] Shang, Z.Y. and Zhang, X.L. (2009) Urban System Spatial Structure and ITS Fractal Characteristic of the Yangtze Delta. Economic Geography, 29, 913-928.
[3] Liu, L.P. and Mu, G.S. (2011) Analysis of the Structure and Spatial Relation of Zhongyuan City Agglomeration. Areal Research and Development, 30, 165-168.
[4] Small, C., Pozzi, F. and Elvidge, C.D. (2005) Spatial Analysis of Global Urban Extent from DMSP-OLS Night Lights. Remote Sensing of Environment, 96, 277-291. https://doi.org/10.1016/j.rse.2005.02.002
[5] Li, Z., Qiang, L., Jin, C., et al. (2007) Characteristics Analysis of Urban Land Expan-sion in China in 1990s Using DMSP/OLS Data. Acta Scientiarum Naturalium Un-iversitatis Sunyatseni, 3, 98-102.
[6] Lu, D., Tian, H., Zhou, G. and Ge, H. (2008) Regional Mapping of Human Settle-ments in Southeastern China with Multisensor Remote Sensed Data. Remote Sens-ing of Environment, 112, 3668-3679. https://doi.org/10.1016/j.rse.2008.05.009
[7] Cao, X., Chen, J., Imura, H. and Higashi, O. (2009) A SVM-Based Method to Ex-tract Urban Areas from DMSP-OLS and SPOT VGT Data. Remote Sensing of En-vironment, 113, 2205-2209. https://doi.org/10.1016/j.rse.2009.06.001
[8] Elvidge, C.D., Baugh, K.E., Kihn, E.A., et al. (1997) Relation between Satellite Ob-served Visible-Near Infrared Emissions, Population, Economic Activity and Electric Power Consumption. International Journal of Remote Sensing, 18, 1373-1379. https://doi.org/10.1080/014311697218485
[9] Elvidge, C.D., Imhoff, M.L., Baugh, K.E., et al. (2001) Night-Time Lights of the World: 1994-1995. ISPRS Journal of Photogrammetry and Remote Sensing, 56, 81- 99. https://doi.org/10.1016/S0924-2716(01)00040-5
[10] He, C., Shi, P., Li, J., et al. (2006) Spatial Restruction of Urbanization in Chinese Mainland in 1990s Using DMSP/OLS Night Light Data and Statistical Data. Chinese Science Bulletin, 51, 856-861. https://doi.org/10.1007/s11434-006-2006-3
[11] Raupach, M., Rayner, P. and Paget, M. (2009) Regional Variations in Spatial Struc-ture of Nightlights, Population Density and Fossil-Fuel CO2 Emissions. Energy Pol-icy, 38, 4756-4764. https://doi.org/10.1016/j.enpol.2009.08.021
[12] Chalkias, C., Petrakis, M., Psiloglou, B. and Lianou, M. (2006) Modelling of Light Pollution in Suburban Areas Using Remotely Sensed Imagery and GIS. Journal of

M. J. Zhang et al.
29
Environmental Management, 79, 57-63. https://doi.org/10.1016/j.jenvman.2005.05.015
[13] Wang, Y.Y., Xu, D. and Zhu, X.G. (2010) The Spatio-Temporal Characteristics of Urban and Town Construction Land Expansion in Jiangsu Province from DMSP- OLS Nighttime Images. Modern Urban Research, No. 2, 67-73.
[14] Liao, B., Wei, K.X. and Song, W.W. (2012) Assessment and Application of DMSP/ OLS Night Time Light Data in Spatial Structure of Urban System—A Case of Jiang-xi Province in Nearly 16 Years. Resources and Environment in the Yangtze Basin, 21, 1297-1300.
[15] Xu, M.J., Chen, L., Liu, H.J., et al. (2011) Pattern and Process of Urbanization in the Yangtze Delta Based on DMSP/OLS Data. Remote Sensing for Land & Resources, No. 9, 107-112.
[16] Change, T. and Wu, S.H. (2014) Spatial-Temporal Characteristics of Yangtze River Delta Urban Agglomeration’s Geographic Expansion in Recent Decades—An Em-pirical Study Based on DMSP/OLS Night Light Data. Modern Urban Research, No. 7, 67-72.
[17] Zhang, C., Wang, C.Y., Lv, Y.Q., et al. (2015) Research on City System Spatial Structure of the Yangtze River Economic Belt: Based on DMSP/OLS Night Time Light Data. Urban Development Studies, 22, 19-26.
[18] Liu, J.S. and Chen, Y.G. (1999) Fractal Dimensions of Spatial Structure of an Urban System and the Methods of Their Determination. Geographical Research, 18, 172- 178.
[19] Wang, C.Y., Wu, G.Y. and Zhang, C. (2015) Research on Spatial Structure of the Chengdu-Chongqing Urban Agglomeration Based on the DMSP/OLS Night Time Light Data. Urban Development Studies, 22, C20-C24.
[20] Gangopadhyay, K. and Basu, B. (2009) City Size Distribution for India and China. Physica A: Statistical Mechanics and Its Applications, 388, 2682-2688. https://doi.org/10.1016/j.physa.2009.03.019
[21] Liu, J.S. and Chen, Y.G. (1999) A Study on Fractal Dimensions of Spatial Structure of Transport Networks and the Methods of Their Determination. Acta Geographica Sinica, 54, 472-477.
[22] Shang, Z.Y. and Zhang, X.L. (2009) Urban System Fractal Characteristic of the Yangtze Delta Interlocking Metropolitan Areas. Resources and Environment in the Yangtze Basin, 18, 998-1002.
[23] Song, J.C., Li, X.H., Lin, T., et al. (2015) A Method of Extracting Urban Built-Up Area Based on DMSP/OLS Nighttime Data and Google Earth. Journal of Geo-In- formation Science, 17, 750-756.

Submit or recommend next manuscript to SCIRP and we will provide best service for you:
Accepting pre-submission inquiries through Email, Facebook, LinkedIn, Twitter, etc. A wide selection of journals (inclusive of 9 subjects, more than 200 journals) Providing 24-hour high-quality service User-friendly online submission system Fair and swift peer-review system Efficient typesetting and proofreading procedure Display of the result of downloads and visits, as well as the number of cited articles Maximum dissemination of your research work
Submit your manuscript at: http://papersubmission.scirp.org/ Or contact [email protected]