Spatial Tax Competition and Domestic Wages Aparna Mathur ...
39
Spatial Tax Competition and Domestic Wages Kevin A. Hassett, AEI Aparna Mathur, AEI Current Version: November 2010 Abstract Using a unique, self-compiled dataset on international tax rates, we explore the link between taxes and manufacturing wages for a panel of 65 countries over 25 years. We find, controlling for other macroeconomic variables, that wages are significantly responsive to corporate taxation. Higher corporate tax rates depress wages. We also find that tax characteristics of neighboring countries, whether geographic or economic, have a significant effect on domestic wages. These results are consistent with the frequently employed assumptions in the public finance literature that capital is highly mobile, but labor is not. Under these conditions labor will bear the burden of capital taxes. JEL Codes: F21, H2, J3, C3
Transcript of Spatial Tax Competition and Domestic Wages Aparna Mathur ...
Spatial Tax Competition and Domestic Wages
Kevin A. Hassett, AEI
Aparna Mathur, AEI
Current Version: November 2010
Abstract
Using a unique, self-compiled dataset on international tax rates, we explore the
link between taxes and manufacturing wages for a panel of 65 countries over 25 years.
We find, controlling for other macroeconomic variables, that wages are significantly
responsive to corporate taxation. Higher corporate tax rates depress wages. We also find
that tax characteristics of neighboring countries, whether geographic or economic, have a
significant effect on domestic wages. These results are consistent with the frequently
employed assumptions in the public finance literature that capital is highly mobile, but
labor is not. Under these conditions labor will bear the burden of capital taxes.
JEL Codes: F21, H2, J3, C3
2
I. Introduction
The incidence of the corporation income tax is a fundamental question in the
study of public economics. Corporation income taxes are levied on the earnings of capital
in the corporate sector of the economy. Corporations, or businesses, however are legal
structures that bring together shareholders or investors, workers and consumers.
Therefore it is natural to question which of these entities, in fact, bears the economic
burden of repaying the tax.i The contribution of economic theory to this study has been
the recognition that while the statutory burden of the tax is on corporate income, the
economic burden could be shifted forward to consumers in the form of higher prices, to
shareholders in the form of lower returns or shifted backward to workers in the form of
lower wages. ii
In this paper, we abstract from the effect of the corporate income tax on
shareholder returns and consumer prices and focus on the extent to which workers may
inadvertently bear a portion of the corporation tax. This narrow focus is justified
somewhat since economic models relying on open economy assumptions predict no
changes in output prices and rates of return to capital due to tradability of output and
perfect capital mobility. In these models, workers are shown to bear a large part of the
corporate tax burden since the only option for firms to remain competitive is to pass on
the tax to workers in the form of lower wages. For instance, Harberger (1995) shows that
under these conditions, workers could bear more than 100% of the corporate tax burden.
The idea that workers may bear a portion of the corporate income tax is neither
surprising nor new. Basic incidence analysis suggests that the burden of the tax will
3
always be larger on the side of the market that is more inelastic. In the short run, the
incidence will necessarily be borne out of the earnings of fixed capital since the supply of
capital is fixed. However, it is the long run effects which are of greatest theoretical and
practical interest. Since capital is relatively more mobile in the long-run than labor
(which is relatively inelastically supplied), labor could bear a larger portion of the tax
burden.
The actual mechanism by which the tax burden is transferred to workers is a
question of extreme interest in our paper. One channel through which this works is the
effect of a higher tax rate on capital investment. Since the imposition of the corporate tax
lowers the post-tax return on capital, this reduces the firms‟ incentive to invest. In the
long-run, as the stock of capital declines, worker productivity suffers since workers have
relatively lower stocks of capital to work with. A decline in the marginal product of labor
then lowers the wage.
These effects could be large in a domestic setting, but are probably magnified in
an open economy setting. With open borders and free capital mobility, corporate capital
can move to other countries that have lower rates of corporate taxation. Over the previous
decade, almost every member of the European Union has cut its rate. Germany has
reduced its corporate rate from around 40 percent to 30 percent. U.K. has also cut its
corporate rate from 30 percent to 28 percent. These reductions reflect a growing
perception among governments worldwide that low corporate taxes attract businesses and
investment and stimulate long-term competitiveness. The spur in economic activity as a
result of the shifting of investment to low-tax jurisdictions is likely to have long-term
4
wage impacts. Our paper attempts to model this tax competition among spatial neighbors
by including as an explanatory variable, the average tax rate in the neighboring country.
Accordingly, the paper addresses two main questions: One, do corporate tax rates
systematically affect wage rates? Two, if tax rate differentials lead to international capital
mobility, are wages in the domestic economy affected by taxes in competing economies?
These questions are addressed using a sample of developing and developed economies.
Our empirical results indicate that domestic corporate taxes are negatively and
significantly related to wage rates across countries. Further, relatively higher corporate
taxes in a country‟s neighbors lead to higher domestic wages due to capital flight from
high tax jurisdictions.
Section II provides a literature survey. Section III discusses the data and presents
summary statistics. Section IV discusses regression results. Section V concludes.
II. Literature Review
The debate surrounding the incidence of the corporate income tax has a long
history and evolution, starting from Harberger‟s seminal 1962 contribution which placed
the entire burden of the corporate tax on capital, to his most recent 2006 paper in which
he concludes that for a small country which is a price taker in product markets for
tradable goods “labor will bear more than the full burden of the corporation income tax”.
Feldstein (1974) develops a theoretical model of the incidence of a corporate
income tax. Replacing the Harberger (1962) assumptions of a fixed capital stock in a
static model with a growing economy with a variable savings rate, Feldstein (1974)
concludes that a substantial fraction of the burden of a corporate tax may fall on workers.
5
Other studies along the same vein which argue that the burden of the tax would fall on
the immobile factors include Bradford (1978), Kotlikoff and Summers (1987), Mutti and
Grubert (1985) and Randolph (2006). The paper by Randolph suggests that domestic
labor and capital bear the tax burden roughly in proportion to their factor income shares:
labor bears 73% of the tax burden. A few authors however question the assumptions of
perfect capital mobility and product substitutability which drive Harberger‟s open
economy results. For instance, Gravelle and Smetters (2001, 2006) and Gravelle (1994)
argue that relaxing these assumptions leads us back to the closed economy outcome of
capital bearing the larger share of the tax burden.
While much of the debate on the incidence of the corporate income tax has been
waged on theoretical grounds, in recent times there has been a spurt of empirical papers
that have attempted to address the topic using real world data on corporate tax rates and
wage rates. For instance, Arulampalam et al. (2007) use company level data for nine
major European countries for the period 1996-2003. Their results suggest that $1 of
additional tax reduces wages by 49 cents in the long run. This is the direct effect which
arises as a result of wage bargaining between the firm and workers. The paper does not
attempt to estimate the indirect effect which works through a lower capital stock,
therefore it is hard to predict what the total impact would be and how it compares to our
estimates. Mihir A. Desai, C. Fritz Foley, and James R. Hines (2007) use aggregate data
on the activities of US companies in around 50 countries in four years to estimate jointly
the impact of the corporate income tax on the wage rate and the rate of profit. Fixing the
sum of these effects to be unity, they find that between 45 and 75 percent of the corporate
tax borne is borne by labor with the remainder falling on capital. Again, fixing the sum of
6
the effects to be unity abstracts from the indirect effects of the deadweight cost, which if
included would generate a total effect in excess of unity. Felix (2007) also finds a large
negative effect of corporate taxes on worker wages. Using cross-country panel data from
the Luxembourg Income Study for 19 countries, she estimates that a 10 percentage point
increase in the corporate tax rate would reduces annual gross wages by 7 percent. Using
U.S. data on corporate tax revenues and total wages, these estimates predict that labor‟s
share of the tax burden is more than four times the magnitude of the corporate tax
revenue collected in the U.S.. The paper does not distinguish between long-run and short-
run effects. Hence none of the papers so far has estimated the long-run impact or what
Arulampalam et al. (2007) refer to as the indirect impact of corporate taxation on wages.
Further, none of the papers accounts for the spatial tax competition that is essential to any
such study.
In addition, it appears that capital flows to a particular country are also
significantly influenced by corporate tax rates in competing countries. After large
reductions in statutory corporate tax rates by Ireland, UK and USA in the mid 1980‟s,
other OECD countries also cut their rates perhaps out of a concern that they would lose
investments.iii
The international tax literature, recently summarized by Gordon and Hines
(2002) and Devereux and Griffiths (1998) finds that mobile capital may often flow to low
tax jurisdictions. If there is a drop in investment in relatively high-tax countries, this
would reduce the amount of capital available to workers and thus reduce real wages in
that country. Hence if tax competition is prevalent, then investment may not only be
influenced by the level of rates but also by relative rates. Accordingly, it is important to
explore not only the impact of levels of tax variables, but also the impact of relative tax
7
variables for competing countries. Hence our analysis extends existing studies on wage
determination by allowing for tax “competition” to influence wages, i.e., we allow taxes
in competitive neighbor countries to influence domestic wage levels.iv
III. Wage Determination Models
To date, studies seeking to explain the cross-country variation in wage growth
have not focused on the role of capital taxation. Rodrik (1999) finds that there is a robust
and statistically significant association between the extent of democracy and the level of
manufacturing wages in a country. This holds even after controlling for labor
productivity and per capita incomes. Freeman and Ostendorp (2000) explain cross-
country differences in terms of the level of gross domestic product per capita and
unionization and wage setting institutions. Rama (2003) concludes that in the short run,
wages fall with openness to trade and rise with foreign direct investment, but after a few
years the effect of trade on wages is reversed. At a micro level, the widening wage
distribution in the United States has been explained in terms of de-unionization and the
erosion of the real value of the minimum wage (DiNardo, Fortin and Lemieux, 1996).
Card, Kramarz and Lemieux (1996) similarly emphasize labor market rigidities as
important factors. Katz (1999) points to the increasing use of computers and computer
based technologies as affecting the relative demand for skilled workers, and wage
inequality. Other papers, such as Davis and Henrekson (2004) study the effect of high
personal income tax rates on hours worked in the market sector and other labor market
outcomes. Some papers also study the effect of foreign direct investment on wage
determination in a spatial setting. Feenstra and Hanson (1995) find that increased foreign

8
direct investment in Mexico, just across the US border, caused an increase in the relative
wages of skilled workers, in both countries along the border. They, however, did not
explicitly model or estimate this relationship using regression analysis or spatial
econometrics techniques.
IV. Data Sources and Descriptions
The data cover the period 1981-2005 and include 65 countries.v The dependent
variable in the empirical analysis is the average nominal U.S. dollar wage earned in
manufacturing per hour. The main source of data on wages is the Labor Statistics
database available from the International Labor Organization (http://laborsta.ilo.org/).
This source provides information on wages for a broad sample of countries, for the period
1981-2005. (For a detailed explanation of the wage data, see Appendix A.2).
International comparability of the data is made possible through use of various controls
for differences in coverage and definitions. In most countries, the statistics on wages refer
to “wages and salaries” which include direct wages and salaries, bonuses and gratuities,
etc. whereas in some countries they refer to “earnings”, which include, more broadly, all
compensation such as paid leave, pension and insurance schemes. We then converted
these total wage payments to hourly wage payments by dividing by the total number of
hours worked, data which was again obtained from the ILO.vi
We check for the
robustness of empirical results when controls for differences in coverage are included.
Average wages have been rising over the period 1981-2005 for all countries, though there
is wide variation in countries both cross-sectionally and over time.vii
9
The other key variables in this paper are the tax rate variables. For these we draw
on a new source, the AEI International Tax Database. The AEI tax database has been
compiled over a number of years and includes information on several tax variables, such
as (national and local) corporate taxes, personal income taxes, VAT, employer and
employee payroll taxes, etc for about 128 countries starting in 1981. The main source for
the corporate and personal income tax data has been the PriceWaterhouseCoopers
“Corporate Taxes Worldwide Summaries” and “Individual Taxes Worldwide
Summaries”, however several other sources (detailed in Appendix A.1) have been used to
validate the numbers. An attempt has been made as far as possible to standardize the
definition of the tax rate used across countries, and to incorporate all the information
available in the corporate tax summaries. viii
For details on comparability issues, see
Appendix A.1.
We control for differences in personal income taxation as well. To do this, we use
average and median personal income tax rates from the AEI International Tax Database.
The tax database has information on the number of tax brackets and the corresponding
tax rate for each country. We constructed average and median tax rates using these.
V. Empirical Model
Using the Harberger model as our motivation, but allowing for long-run changes
and international capital mobility to affect wages, our baseline empirical specification is
as follows:
20052001 20001996 19951991 19901986 t19851981 where
1,..,5s ;
21
1
321
,,,,t
DPwwis
s
ttit
n
j
jtijtititi
t
it
10
The dependent variable in this specification is wit, the five year (Log) average of
the nominal US$ wage rate in manufacturing for country i at time t. We use five year
averages over five distinct sub-periods. Country-specific fixed effects are captured by .
To ensure exogeneity of the right hand side variables, we use beginning-of-period values
of , the (Log) Top Statutory Corporate Tax Rate, (Log) Value Added per worker ( it )
in manufacturing.ix
Following Rodrik (1999), we also included an index of average
consumer prices which is comparable across countries. This captures cost-of-living
differences across countries that are not captured by exchange rate conversions. We use
the five year average of this index since it works like a deflator for our nominal wage
variable. The index is available from the Penn World Tables. Finally, we also include
dummy variables for each sub-period in our sample.
We use beginning of period (or lagged) values of the independent variables since
in our model corporate taxes only indirectly affect wages, by first affecting the capital-
labor (K/L) ratio. Thus the response of wages to corporate taxation depends first on the
speed with which capital-labor ratios adjust to corporate taxation, and second, on the
speed with which wages adjust to changes in productivity as a result of changes in K/L.
Domestic firms may respond to lower corporate taxes by increasing their stock of capital
and theory suggests that this adjustment may not be instantaneous. Global capital may be
more flexible, but will only gradually flow into the low-tax country thereby increasing
the stock of domestic capital. Wages will respond to this increase in capital-labor ratios
with some lag as firms observe productivity gains and workers renegotiate fixed wage
contracts. Hence we look for changes over long periods of time.

11
We present results with different measures of the corporate tax rates, such as the
top national corporate tax rate, the effective marginal (EMTR) and the effective average
corporate tax rate (EATR). A word about these rates is warranted here since we are not
using the realized values of taxes and incomes to generate these rates. In fact, these rates
are constructed using the methodology discussed in Devereux and Griffith (1999). The
EMTR is the tax rate on the marginal investment, where the marginal investment equates
the net present value of the income stream to the net present value of costs from the
investment. The EATR can be computed as the difference between the pre-tax and the
post-tax economic rent scaled by the net present value of the pre-tax income stream.x
We computed the EATR and the EMTR for all countries in the sample and for each time
period using the methodology outlined in Devereux et al (1999), assuming fixed
parameter values for the economic depreciation rates, the inflation rate and the annual
discount rate.xi
An interesting addition in the paper is the exploration of tax competition issues.
Wages in the home country are affected by capital flows to the country as we discussed
above. However, capital flows are subject to the forces of competition from other
countries that are keen to divert these flows to themselves. Tax competition occurs
through the lowering of relative tax rates across countries. Therefore, to account for the
effect of tax rates in other countries on capital flows and therefore wages in the home
country, we include variables measuring the weighted average tax rates in similar income
and geographically close economies. This follows the standard spatial regression
literature as summarized by Anselin (1999). To our knowledge, this is the first paper to
explicitly include spatial variables in a wage regression.
12
The spatial weights matrix takes the form, Wt=[W'1t.,………..,W'Nt.]'. At any time
t, the ith row of this matrix is given by Wit, which specifies “neighborhood sets” for each
observation i. The ij-th element of Wt, namely, wij,t, is positive if j is a “neighbor” of i,
and is zero otherwise. In our model, we consider many forms of the weighting matrix.
One is based on regional economic weights. In this, the countries are assigned to be
“neighbors” if they are in the same region as country i. For example, Zambia would have
as its neighbors, Zimbabwe, Malawi and Mauritius since they are all in the East African
region, but would not include Bolivia, Australia, etc. since they are in other regions.
Countries within the same region would then be weighted by their GDP. A second form
of the weighting matrix is based on Income weights, i.e., countries within the same
income group, such as high income, low income, or upper middle income, etc. are
classified as neighbors. These countries are then weighted by their GDP. The third kind
of weighting we used was to assign distance weights to countries within the same income
group.
These weighting matrices were used to create weighted averages of corporate tax
rates in “neighbor” countries. In somewhat more detail, the ijth element of the weighting
matrix at time t, is,
k
ikt
ijt
ijt
GDP
GDPw where k is the number of “neighbor” countries for country i.
The weighting matrix based on distance is defined in a similar manner. By
convention, a cross sectional unit is not a neighbor to itself, so that the diagonal elements
of Wt are all zero i.e wii,t=0. The significance of these spatial variables in the regressions
suggests that tax competition affects capital flows and wages in the home country.

13
We expand upon the baseline regression by including variables to measure the
openness of the economy. These include trade as a fraction of GDP (available from the
ILO KILM database) and an index of capital mobility (from the Economic Freedom of
the World Database). We also experiment with additional variables such as the level of
schooling, computerization and urbanization, highlighted by other papers in the literature.
To allow for the effect of labor market institutions, we use two variables. One of
these measures the percentage of workers in a country covered by collective bargaining
agreements, as a percent of total salaried or dependent workers. The second is a broader
measure which is a count of the cumulative number of ILO conventions ratified by the
country. The ILO conventions include ratification of conventions on child labor, forced
or compulsory labor, discrimination, the right to organize and the right to bargain
collectively. Thus the greater the number of ratified conventions, the greater the
protection of workers rights. Information on these variables is available from the Fraser
Institute‟s Economic Freedom of the World dataset and the World Bank Labor Market
Database (WBLMD), (Rama, 1996), respectively.
Following Rodrik (1999), ideally we would like to include both the level of gross
domestic product (GDP) per capita (available from Penn World Tables) and
manufacturing Value Added (MVA) per worker in the same regression. We obtained
value added per worker data from the ILO. The correlation between this variable and the
GDP variable is high, above 0.70. Hence while we get similar results with the two
variables, we report results using the Value Added variable to measure productivity.xii
Finally, we obtained information on capital-labor ratios from the extended Penn World
14
Tables (Version 2.1, April 2006).xiii
These data are not specific to the manufacturing
sector and are not as extensive as for the tax variables in our model.xiv,xv
VI. Regression Results
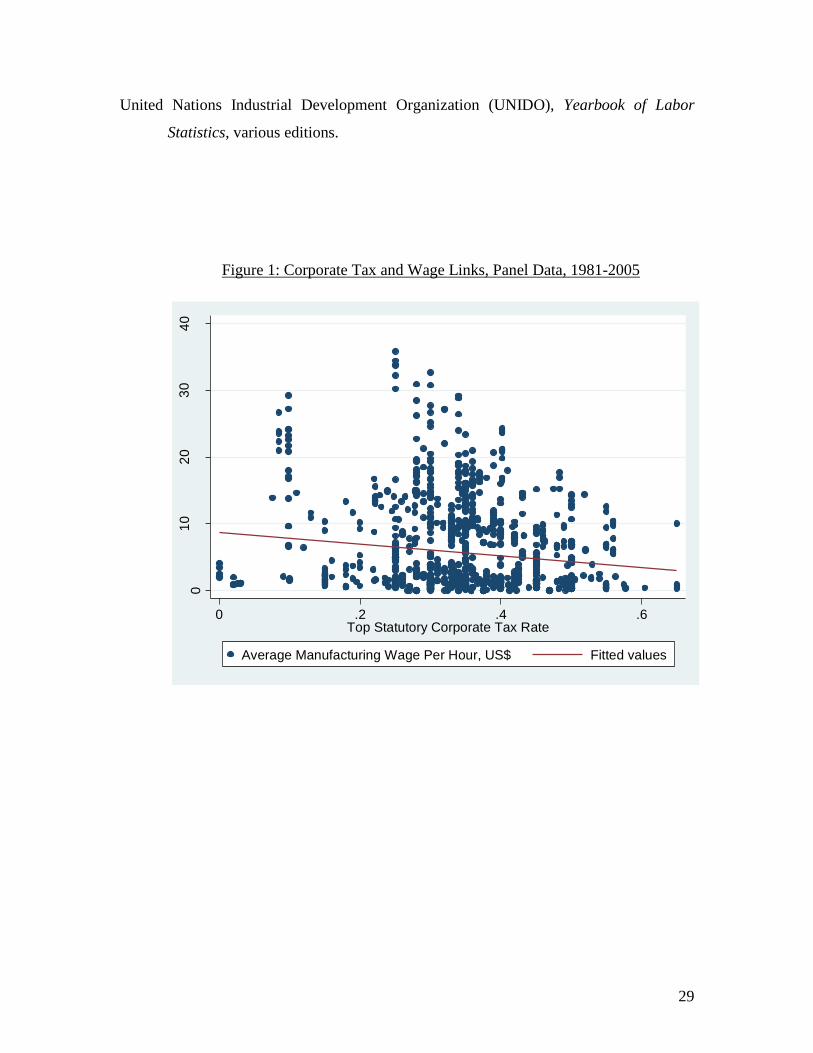
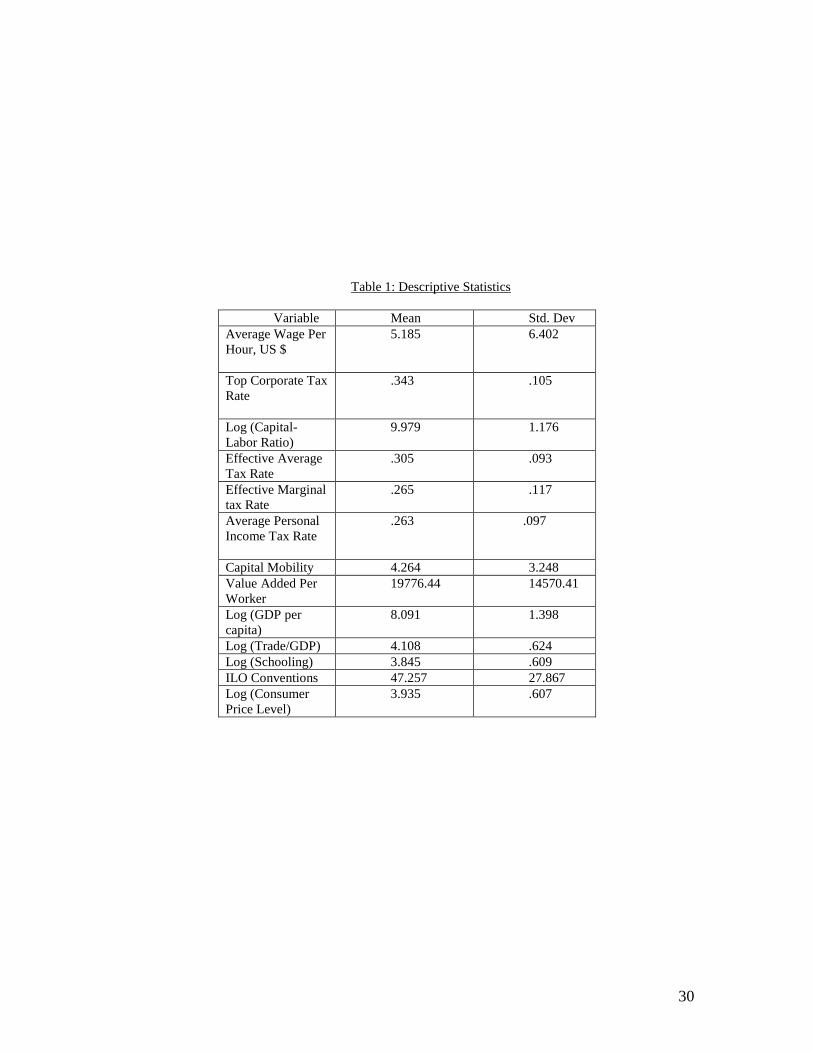
Table 1 provides summary tables for our data. The average dollar wage over our
sample period for all countries was approximately $5.2 per hour, while the average
headline corporate tax rate was 34 percent. The effective average rate was lower at 30
percent, and the effective marginal rate was nearly 10 percentage points lower at 26.5
percent. In general average wages have increased between 1981 and 2005 from $3.5 to $9
per hour, while average tax rates have declined substantially. In 1981, the average top
rate was 42 percent. In 2005, the average rate was 25 percent.
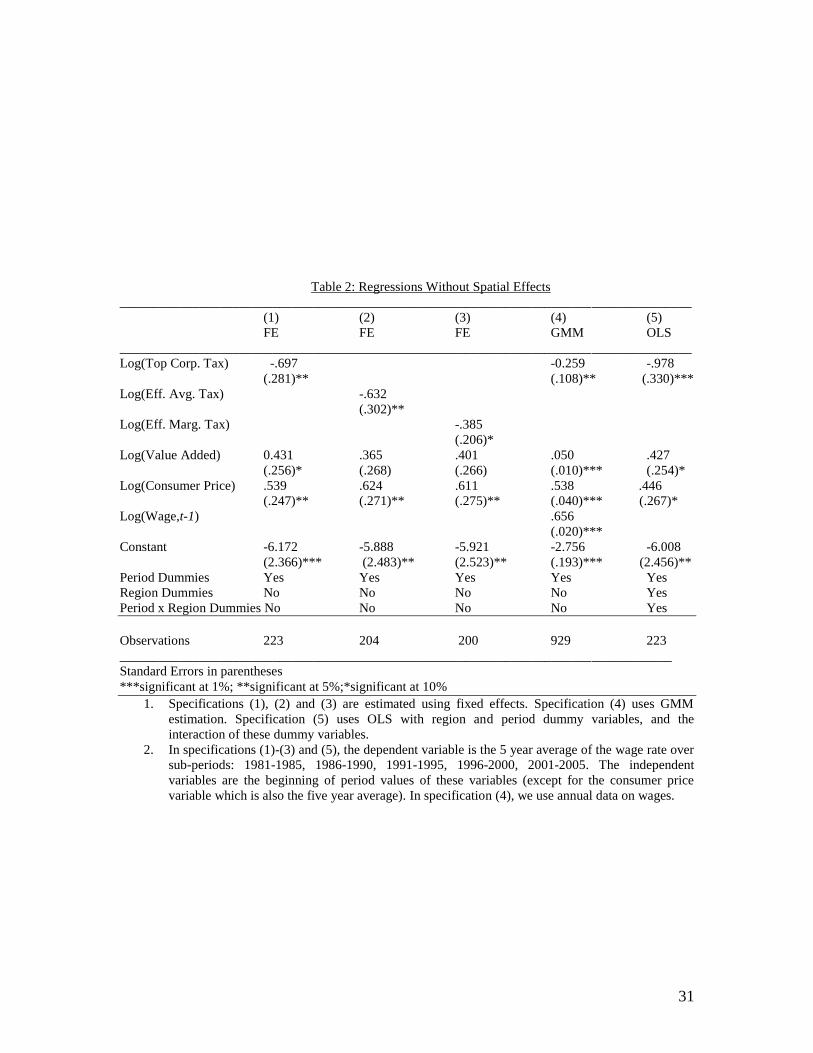
Table 2 presents the first set of regression results. All the regressions, unless
otherwise stated, are estimated using fixed effects. All specifications also control for sub-
period (time) dummies and the regressions are run allowing for clustering within country
groups. This option calculates the Huber/White/sandwich estimator of variance and also
allows observations within a group to be correlated. (We also ran GLS regressions
allowing for panel heteroskedasticity with similar results).
The main variable of interest in this paper is the corporate tax rate. Regressions in
Table 3 present estimates without the spatial variables. Column (1) presents a simple
regression of the wage on the headline rate. The coefficient is highly significant at 5
percent, with a value of -0.69. Therefore, the elasticity of wages w.r.t. corporate taxes is
fairly high and negative. A 1 percent increase in the corporate tax rate is associated with a
nearly 0.7 percent decrease in hourly wages.
15
The coefficient on Log (Value Added) is also significant and positive, implying
that higher worker productivity is associated with higher wages. Finally, the higher the
price level of consumption, the higher the nominal wage.
In Columns (2) and (3), we test to see if the results from our baseline specification
in Column (1) carry over to other measures of the corporate tax rate, such as the effective
marginal tax rate and the effective average tax rate. The coefficient on the effective
average tax rate variable is negative and significant at 5 percent, while on the effective
marginal tax rate variable is significant only at 10 percent. These results are interesting
since they suggest that the effective average rates of taxation matter almost as much for
investment behavior as the statutory rate. Ultimately, firms care about what rate they will
end up paying rather than the top rate, which a lot of firms can avoid paying through use
of allowances and deductions. This supports the results of Devereux and Griffiths (1998)
and Hassett and Hubbard (2002) of the impact of tax rates on investment for effective
average tax rates.
In Column (4), we test our intuition that the longer term elasticity of wages w.r.t.
the corporate tax is likely to be higher than the short-term elasticity. To do so, we do a
regression of annual wages on the contemporaneous corporate tax rate and a one-year
lagged wage rate. To account for endogeneity of the lagged wage rate and the corporate
tax rate variables, we use GMM estimation. In this case, the elasticity of the wage w.r.t.
the corporate tax variable is still above 1, though it is significantly lower in magnitude at
approximately -0.3, as opposed to -0.7 for our earlier regressions. Thus our results
suggest that changes in corporate tax rates have long-term impacts on wages and
productivity, and looking only at annual impacts may understate the true elasticity.
16
As a final specification check, we divided countries into different regions and
then re-estimated the equation using OLS with a set of region dummies, time dummies
and the interaction of the two i.e region-specific time trends. This allows for common
shocks across countries within a region and over time. For instance, many East European
countries faced common economic and political shocks in the aftermath of the collapse of
the Soviet Union which may have affected labor markets, productivity and wage levels.
This was also true of the East Asian economies in the wake of the currency crisis in the
late 1990s. Results in Column (5) suggest that adding these controls causes our estimated
elasticity to be marginally higher than in earlier specifications.
In a recent paper, Gordon and Lee (2005) find that corporate taxation negatively
affected country growth rates between 1970-1997. Our results suggest that these slower
GDP per capita growth rates in the 1980s and 1990s may have also translated into slower
wage growth, hence workers must be bearing some of the burden of corporate taxes.xvi
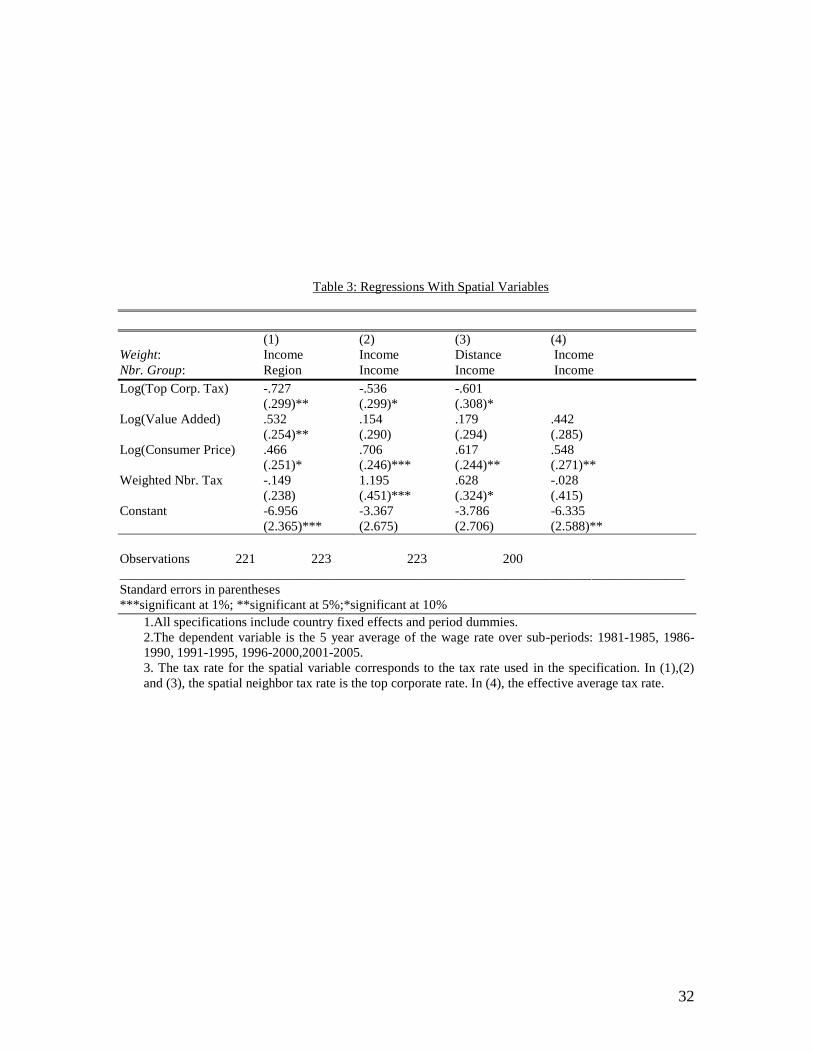
Table 3 presents results with the spatial tax variables included in the regression.
These regressions incorporate measures of weighted average tax rates in “neighbor”
countries. The choice of weights is guided by previous literature using spatial
econometrics techniques, but we also experiment with different weighting schemes that
are relevant to our analysis.xvii
In specification (1) “neighbor” countries are defined as all
those countries that are in the same physical region, as described before.xviii
The weights
that we use for these countries are GDP (per capita) weights. Thus every country is
weighted by its economic strength in the region. In this specification, the domestic top
corporate rate remains significant, but the weighted average tax rate in the region is not.

17
This suggests that tax rate competition within regional neighbors is not a significant
determinant of wage levels across countries.
In Column (2), we change the spatial neighbors by defining as neighbors those
countries that are in the same income group (rather than in the same region). Countries
within the same income group are then weighted by their respective GDP per capita. This
specification would be justified if capital is more likely to flow between countries with
the same per capita income rather than from very high to very low income countries or
vice-versa. In this specification, the coefficient on the domestic corporate tax rate is
marginally smaller than without the spatial tax variables. Also, the neighbor tax rates are
significant and positive, suggesting that higher tax rates in neighbor countries have a
positive impact on wages in the domestic country. The magnitude of the spatial tax
coefficient is marginally higher than 1, suggesting that these tax linkages are stronger
than for the regional neighbors.
Finally, column (3) presents results with another weighting scheme. While
neighbors continue to be defined in terms of income groups, the countries within the
group are now weighted using (inverse) distance weights.xix
Thus the farther the country,
the lower the weight it receives within the group. In this specification the coefficient on
the spatial tax variable is 0.6, implying an elasticity of domestic capital formation to
neighbor tax rates that is nearly the same as that with respect to domestic corporate tax
rates. Thus tax linkages among countries within the same income group are a significant
predictor of domestic wages.xx
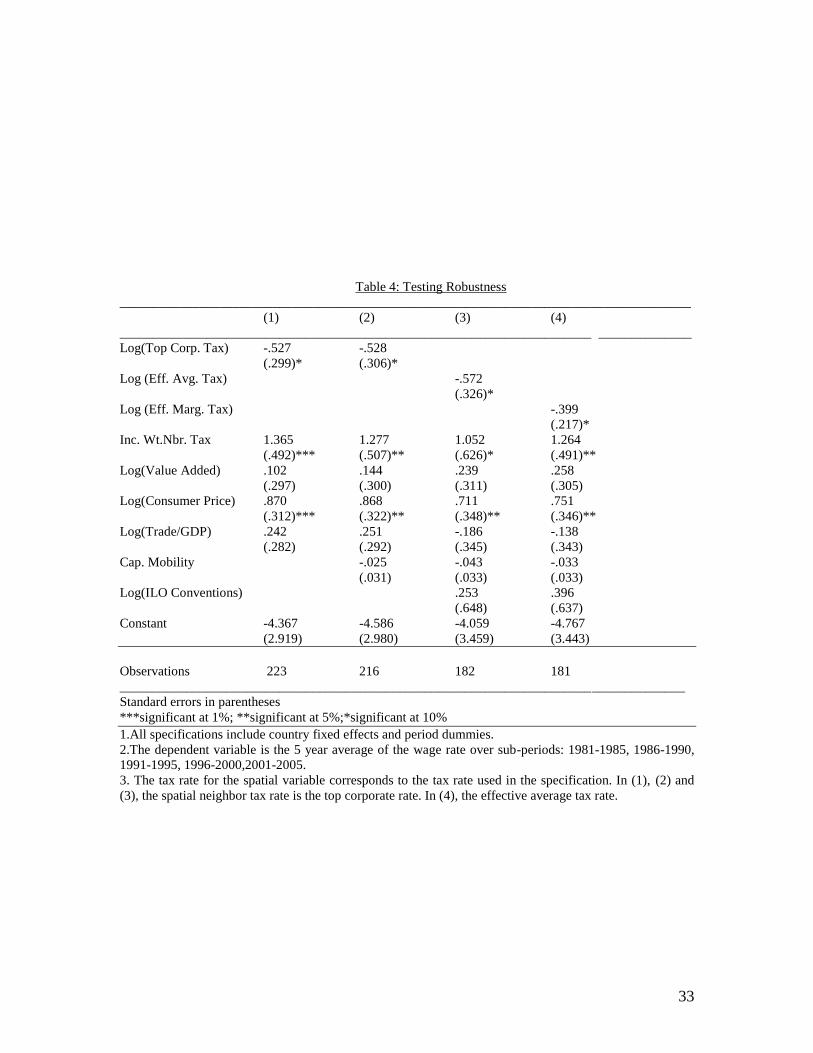
In Table 4, we tested for robustness of the coefficient on domestic and neighbor
tax rates by including additional variables. These include the level of openness of the
18
economy measured by the share of total trade in GDP and an index of capital mobility.
We also included labor market regulations (as measured by the number of ILO
conventions ratified by the country or the percent of workers covered by collective
bargaining agreements). Finally, in unreported regressions, we included schooling
(measured by enrollment at different levels of schooling, such as primary, secondary and
tertiary (ILO)) and the extent of computerization (measured as the estimated number of
personal computers in use as a fraction of the population, available from ILO). However,
none of these enters significantly, since we control for labor productivity directly.xxi
The
estimated coefficient on corporate tax rates (the top rate, effective average and effective
marginal rates) remains fairly similar across different specifications, and is significant at
10 percent. Further, the income weighted tax rates in income neighbor countries enter
with coefficients higher than 1, implying that all types of corporate taxation have an
effect on wages, even after controlling for standard explanatory variables as suggested by
the literature.
VII. Testing the Mechanism
If we accept the results in Tables 2, 3 and 4 that corporate taxes affect wages, the
natural next step is to question the mechanism by which they do so. Our hypothesis is
that corporate tax rates affect wages through their impact on capital-labor ratios. We use
different measures of the corporate tax rate, since high taxes on capital affect investment
and therefore the capital stock by raising the user cost of capital. The user cost of capital
is defined as the minimum return a firm needs to cover depreciation, taxes and the
opportunity cost of funds (Jorgenson (1963), Hall and Jorgenson (1967), Auerbach
(1983b)). Typically studies have found that high taxes lead to high user costs.xxii
19
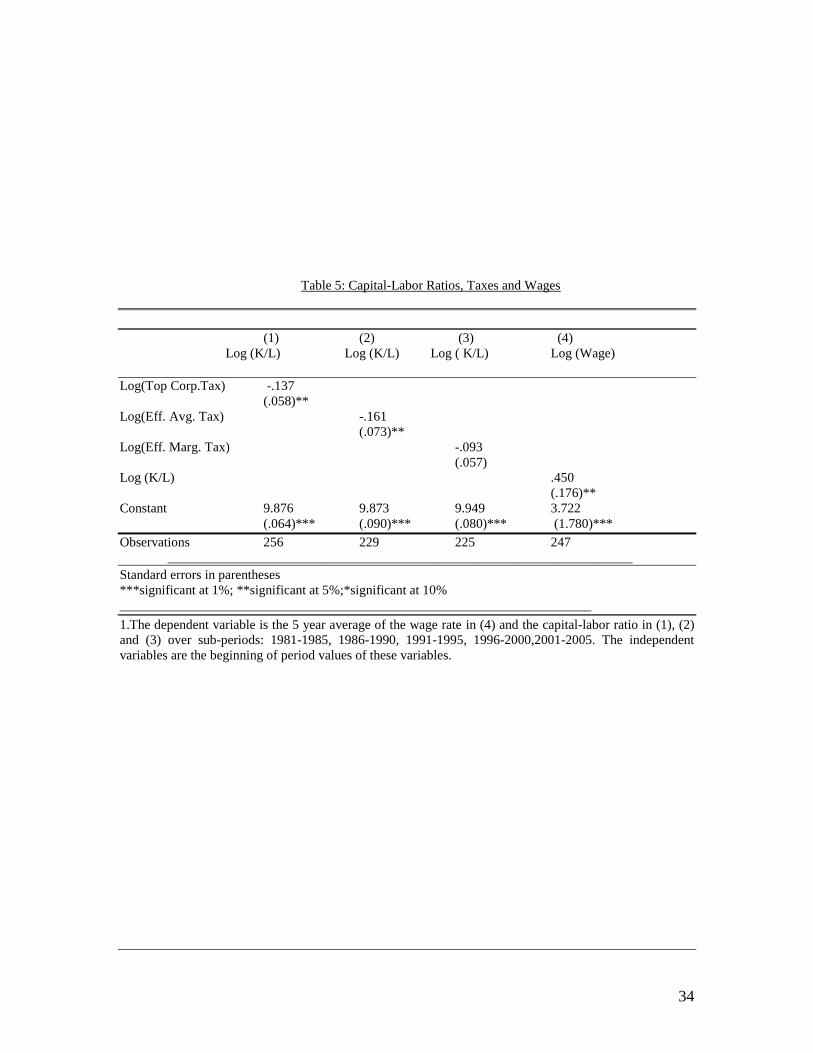
Table 5 presents various tests of our hypothesis. In specification (1), we use a five
year (log) average of the capital-labor ratio as the dependent variable. We find that all
measures of corporate taxation, such as the top national corporate tax rate, the effective
average and the effective marginal tax rate negatively affect capital formation, though
only the first two measures show up as significant. The coefficient on (Log) Top
Corporate Tax Rate implies a value of the elasticity of close to -0.14. Clearly, higher top
rates discourage capital formation. This result is even stronger for effective average tax
rates which take into account depreciation allowances, inflation and interest rates and
other factors that affect capital formation through the user cost of capital (specification
2). The estimated elasticity in this case is close to (negative) 0.16. Other studies, using
micro data and the actual user cost (not only the tax rate) estimate elasticities that are
higher than this. Balistreri, McDaniel and Wong (2002) using industry data from the
Bureau of Economic Analysis estimate elasticities in the range of 1-1.22, using different
weighting schemes. Leung and Yuen (2005) using industry-level data on Canadian
manufacturing estimate an elasticity of 0.33. While our coefficient estimate is likely to be
heavily biased due to aggregation, measurement issues and data constraints (the capital-
labor ratio is not specific to the manufacturing sector), we present these results simply to
show that different measures of corporate taxation can significantly and negatively affect
capital-labor ratios.xxiii
The final column, Column (4), studies the link between high capital-labor ratios
and average wages. Since capital-labor ratios are a direct proxy for worker productivity,
it is not surprising that higher capital-labor ratios are associated with significantly higher
20
wages. In general, a 1 percent increase in the capital-labor ratios is associated with a 0.45
percent increase in wages.
While these results are obviously not conclusive of the mechanism, much less that
this is the only means by which corporate taxes affect workers, it is clearly evidence that
corporate taxes could have long-term impacts on wages by affecting the availability of
capital to combine with labor.
IX. Discussion of Results
To check our results and in order to put bounds on the estimated coefficients, we
did a back of the envelope calculation using results from the investment literature.xxiv
Since our assumption is that corporate taxes affect investment in capital, we surveyed the
recent literature on the elasticity of investment with respect to corporate tax rates. De
Mooij and Ederveen (2003) conclude that the median value of the tax rate elasticity is
around -3.3. Thus a 1 percent increase in corporate tax rates, on average, leads to a
lowering of foreign direct investment by about 3 percent. They also report that the
elasticities have increased over time, from 2.4 in 1987 to 3.7 by 2002. The elasticity with
respect to domestic investment is lower at around 1. If investment responds to corporate
taxation, this will lead to changes in the capital stock over a period of time (and the
capital-labor ratio for a given level of employment). Taking derivatives with respect to
corporate taxes in the wage equation in the Solow model and using the widely accepted
calibrated value of α (the share of capital) as 0.33, these elasticities for foreign and
domestic investment suggest that in the long-run, a lowering of corporate tax rates by 1
percent could cause wages to increase by 0.3-0.9 percent. Hence our estimate of the
elasticity is in the range predicted by the Solow wage equation.
21
X. Incidence Analysis
It is interesting to analyze what our elasticity results imply for the incidence of the
tax on labor incomes. To do a simple back-of-the-envelope calculation, we obtained data
on corporate tax revenues and wages in the manufacturing sector. Note that our elasticity
numbers relate the real wage per hour to the corporate tax rate. However, assuming a
fixed stock of capital (which forms the tax base) and labor, this can be interpreted as the
elasticity of the wage bill with respect to corporate tax revenues. The most recent data on
revenues broken down by sector are available from the IRS for the year 2002. We
therefore took the share of revenues generated by the manufacturing sector for that year
and applied it to the most recent data available for tax revenues, which is 2006. For this
year, the manufacturing sector revenues using the 2002 shares totaled $116 billion. The
total wage bill in manufacturing for the same year (data available from BEA) was $962
billion. To calculate incidence, we multiplied the elasticity numbers obtained from the
earlier regressions with the ratio of the wage bill to the tax revenues. Doing this using the
elasticity w.r.t. the top corporate tax rate of 0.5 on average, we get that every dollar of
additional tax revenue leads to a $4 decrease in the real wage. However, the statutory
headline rate may not be the most appropriate for doing this incidence analysis since the
revenues depend on taxes actually paid, which depend upon depreciation allowances and
other deductions. Therefore, we did the incidence analysis also w.r.t to the effective
marginal (and average) tax rates. The elasticity of wages w.r.t. the effective marginal or
average corporate tax rate varies from 0.4 to 0.6, suggesting that a $1 increase in the tax
revenue leads to a nearly $3 or $4 decrease in the real wage. Note that these incidence
22
calculations refer to the long run, i.e., they allow for a dynamic response of wages to
corporate tax rate changes. Hence they would be higher than those obtained by other
authors using annual data, since they account for long run changes in the capital stock
affecting worker productivity. Using our annual income regressions, we find that a $1
increase in tax revenues leads to a $2 decrease in wages. Further, we are using the
corporate tax revenues and wage data for the U.S. which may not be typical of our
sample, which comprises low income countries as well. Therefore the incidence numbers
would vary from country to country depending on the ratio of wages to corporate tax
revenues.
XI. Conclusion
To summarize, our results indicate that while personal income tax rates do not
systematically affect wages, corporate taxes are significantly related to wage rates across
countries. Our coefficient estimates suggest that a 1 percent increase in corporate tax
rates leads to a 0.5-0.6 percent decrease in wage rates. These results also hold for
effective marginal and average tax rates. The coefficient estimate is (on average) close to
0.5. This suggests that wages are as likely to be influenced by the top statutory corporate
tax rate, as by the effective marginal and average tax rates. Hence corporate tax cuts in
the form of large allowances for depreciation of equipment and structures which reduce
effective marginal rates could effectively influence wage levels as well.
We find evidence of international tax competition in the data. Capital formation
and therefore wage rates are affected not only by domestic tax rates, but also tax rates in
competing economies. The coefficient estimates for the spatial tax variables range from
.6 to 1.4 suggesting significant quantitative impacts. Comparing different weighting
23
schemes, the effects are largest when “neighbors” are defined as countries within the
same income group, rather than within the same region. This suggests that tax
competition is most intense among, say, high income countries such as Canada, France
and Italy, rather than between geographic neighbors. This makes sense intuitively since
there do not appear to be large transport costs associated with moving capital across large
distances, so capital can easily flow to the most remunerative locations.
References
Alesina, Alberto, and Roberto Perotti, “The Welfare State and Competitiveness,”
American Economic Review, 87:5 (December 1997), 921-936.
Altshuler, Rosanne, and Timothy J. Goodspeed, “Follow the Leader? Evidence on
European and U.S. Tax Competition,” Department of Ecoomics Working Paper
200226, Rutgers University (2003).
Anderson, T.W., Introduction to Multivariate Statistical Analysis, New York: Wiley
(1984).
Anselin, Luc, “Spatial Econometrics,” (1999); available at:
http://www.csiss.org/learning_resources/content/papers/baltchap.pdf
Arulampalam, Wiji, Michael Devereux, and Giorgia Maffini, “The Direct Incidence of
Corporate Income Taxes on Wages,” (2010); available at:
http://users.ox.ac.uk/~mast1732/RePEc/pdf/WP0707.pdf
Auerbach, Alan J., “Corporate Taxation in the United States.” Brookings Papers on
Economic Activity, 2 (1983a), 451-513.
Auerbach, Alan J., “Taxation, Corporate Financial Policy and the Cost of Capital,”
Journal of Economic Literature, 21:3 (1983b), 905-940.
Auerbach, Alan J., “Tax Reform and Adjustment Costs: The Impact on Investment and
Market Value,” International Economic Review, 30:4 (1989), 939-962.
24
Auerbach, Alan J., “Who Bears the Corporate Tax?” NBER Working Paper W11686
(2005).
Auerbach, Alan J., and Kevin A. Hassett, “Tax Policy and Business Fixed Investment in
the United States,” Journal of Public Economics, 47 (1992), 141-170.
Auerbach, Alan J., and Kevin A. Hassett, “On the Marginal Source of Investment
Funds,” Journal of Public Economics, 87:1 (January 2003), 205-232.
Auerbach, Alan J., and Kevin A. Hassett, “Dividend Taxes and Firm Valuation: New
Evidence,” American Economic Review, Vol. 96:2 (2006), 119-123.
Balistreri, Edward, Christine McDaniel, and Eina Wong, “An Estimation of U.S. Industry
–Level Capital-Labor Substitution Elasticities: Cobb-Douglas as a Reasonable
Starting Point?” mimeo (2002). available at:
http://www.journalofpolicymodels.com/articles/prodfun_jpm.pdf
Barro, Robert J.,“Religion and Economic Growth,” NBER Working Paper 9682 (2003).
Basinger, Scott J., and Mark Hallerberg, “Remodeling the Competition for Capital: How
Domestic Politics Erases the Race to the Bottom,” American Political Science
Review, 98: 2 (2004), 261-276.
Besley, Timothy, and Harvey Rosen, “Sales Tax and Prices: An Empirical Analysis,”
Princeton University Economics Department, mimeo (1994).
Bingley, Paul, Gauthier Lanot, “The Incidence of Income Tax on Wages and Labor
Supply,” Journal of Public Economics, 83:2 (February 2002), 173-94.
Bloningen, Bruce A., Ronald B. Davies, Glen R. Waddell, and Helen T. Naughton, “FDI
in Space: Spatial Autoregressive Relationships in Foreign Direct Investment,”
(2005); available at: http://darkwing.uoregon.edu/~bruceb/BDWN-2005-10-
03.pdf
Bradford, David F., “Factor Prices May be Constant, but Factor Returns are Not”
Economics Letters, 1:3 (1978), 199-203.
Bradford, David F., “The Incidence and Allocation Effects of a Tax on Corporate
Distributions,” Journal of Public Economics, 15:1 (April 1981), 1-22.
Card, David, Francis Kramarz, and Thomas Lemieux, “Changes in the Relative Structure
of Wages and Employment: A Comparison of the United States, Canada and
France,” NBER Working Paper 5487 (1996).
25
CBO, “Corporate Income Tax Rates: International Comparisons,” (November 2005);
available at: http://www.cbo.gov/ftpdocs/69xx/doc6902/11-28-CorporateTax.pdf
Cummins, Jason G., Kevin A. Hassett, and R. Glenn Hubbard, “A Reconsideration of
Investment Behavior using Tax Reforms as Natural Experiments,” Brookings
Papers on Economic Activity, 2 (1994): 1-74.
Davis, Steven J., and Magnus Henrekson, “Tax Effects on Work Activity, Industry Mix
and Shadow Economy Size: Evidence from Rich-Country Comparisons”, in R.
Gómez-Salvador, A. Lamo, B. Petrongolo, M. Ward, and E. Wasmer (Eds.),
Labour Supply and Incentives to Work in Europe (Cheltenham, UK: Edward
Elgar, 2005), chapter 2, 4-104.
De Mooij, Ruud, and Sjef Ederveen, “Taxation and Foreign Direct Investment: a
synthesis of empirical research,” International Tax and Public Finance, 10
(2003), 673-693
Desai, Mihir, Fritz Foley, and James R. Hines, “Labor and Capital Shares of the
Corporate Tax Burden: International Evidence,” (2007); available at:
http://www.people.hbs.edu/mdesai/publications.html
Devereux, Michael, Ben Lockwood, and Michela Redoano, “Capital Account
Liberalization and Corporate Taxes,” IMF Working Papers 03/180, International
Monetary Fund (2003).
Devereux, Michael, and Rachel Griffith, “Taxes and the Location of Production:
Evidence from a Panel of US Multinationals,” Journal of Public Economics, 68
(June 1998), 335-367
Devereux, Michael, and Rachel Griffith, “The Taxation of Discrete Investment Choices,”
The Institute For Fiscal Studies, Working Paper Series No. W98/16 (1999).
Devereux, Michael, Rachel Griffith, and Alexander Klemm, “Corporate Income Tax
Reforms and International Tax Competition,” Economic Policy, 17: 35 (October
2002), 451-495.
DiNardo, John, Nicole M. Fortin, and Thomas Lemieux, “Labor Market Institutions and
the Distribution of Wages, 1973-1992: A Semi-parametric Approach,”
Econometrica, 64:5 (July 1996), 1001-1044.
26
Feldstein, Martin, and Marian Vaillant, “Can State Taxes Redistribute Income?” Journal
of Public Economics, 68:3 (1998), 369-96.
Feldstein, Martin, “Incidence of a Capital Income Tax in a Growing Economy with a
Variable Savings Rate,” Review of Economic Studies, 40 (2974), 505-513.
Felix, R. Alison, “Passing the Burden: Corporate Tax Incidence in Open Economies,”
Federal Reserve Bank of Kansas City Working Paper (October 2007); available
at: http://www.kansascityfed.org/Publicat/RegionalRWP/RRWP07-01.pdf
Franzese, Robert J. Jr., and Jude C. Hays, “Modelling Spatial Interdependence in
Comparative and Internaitonal Political Economy with an Application to Capital
Taxation,” (April 2005); available at: http://www-
personal.umich.edu/~franzese/FranzeseHays_MWPSA05.pdf
Freeman, Richard B., and Remco Oostendorp, “Wages Around the World: Pay Across
Occupations and Countries,” NBER Working Paper 8058 (2002).
Gordon, Roger H., “Taxation of Investment and Savings in a World Economy,”
American Economic Review, 76:5 (December 1986), 1086-1102.
Gordon, Roger H., and James Hines “International Taxation,” NBER Working Paper
8854 (2002).
Gordon, Roger H., and Young Lee, “Tax Structure and Economic Growth,” Journal of
Public Economics, 89:5-6 (2005), 1027-1043.
Gordon, Roger H., and Wei Li, “Tax Structure in Developing Countries: Many Puzzles
and a Possible Explanation,” NBER Working Paper 11267 (2005).
Gravelle, Jane G., and Kent Smetters, “Who Bears the Burden of the Corporate Tax in
the Open Economy?” NBER Working Paper 8280 (May 2001).
Gravelle, Jane G., and Kent Smetters, “Does the Open Economy Assumption Really
Mean That Labor Bears the Burden of a Capital Income Tax,” Advances in
Ecnomic Analysis & Policy, 6:1 (August 2006).
Gruber, Jonathan, “The Incidence of Payroll Taxation: Evidence from Chile,” Journal of
Labor Economics, 15:3, Part 2 (1997), S72-S101.
Grubert, Harry, and John Mutti, “Do Taxes influence where US Multinational
Corporations Invest?” National Tax Journal, 53:4 (December 2000), 825-849.
27
Gwartney, James, and Robert Lawson, Economic Freedom of the World: 2005 Annual
Report (Vancouver: The Fraser Institute 2005). Data retrieved from
www.freetheworld.com.
Hall, Robert E., and Dale W. Jorgenson, “Tax Policy and Investment Behavior,” The
American Economic Review, 57:3 (June 1967), 391-414.
Hallerberg, Mark, and Scott J. Basinger, “Internationalization and Changes in Tax Policy
in OECD Countries: The Importance of Domestic Veto Players.” Comparative
Political Studies, 31 (June 1998), 321–53.
Hallerberg, Mark, and Scott J. Basinger, “Globalization and Tax Reform: An Updated
Case for the Importance of Veto Players,” Poltische Vierteljahresschrift, 40:4
(1999), 618–27.
Hanson, Gordon H., and Robert C. Feenstra, “Foreign Investment, Outsourcing and
Relative Wages”, in Robert C. Feenstra, Gene M. Grossman, and Douglas A.
Irwin (Eds.), Political Economy of Trade Policy: Essays in Honor of Jagdish
Bhagwati, (Cambridge, MA: MIT Press, 1999), 89-127.
Harberger, Arnold C., “The Incidence of the Corporation Income Tax,” Journal of
Political Economy, 70:3 (June 1962), 215-240.
Harberger, Arnold C., “Corporation Tax Incidence: Reflections on What is Known,
Unknown, and Unknowable,” For conference “Is It Time For Fundamental Tax
Reform: The Known, Unknown and Unknowable?” (April 2006).
Hassett, Kevin A., and G. Hubbard, “Tax Policy and Business Investment,” in Alan J.
Auerbach and M. Feldstein (Eds.), Handbook of Public Economics, Vol. 3 (2002),
1293-1343.
Hays, Jude C., “Globalization and Capital Taxation in Consensus and Majoritarian
Democracies,” World Politics, 56 (2003), 79-113.
Hines, James R., and Eric M. Rice, “Fiscal Paradise: Foreign Tax Havens and American
Business,” Quarterly Journal of Economics, 109:1 (February 1994), 149-182.
Jorgenson, Dale W., “Capital Theory and Investment Behavior,” American Economic
Review, 53:2 (1963), 247–59.
28
Katz, Lawrence F., “Technological Change, Computerization and the Wage Structure,” in
Erik Brynjolfsson, Brian and Kahin (Eds.), Understanding the Digitial Economy:
Data, Tools, and Research (Cambridge, MA: MIT Press, 2002), 217-243.
Kotlikoff, Laurence, and Laurence Summers, “Tax Incidence”, in Alan J. Auerbach and
Martin S. Fedstein (Eds.), Handbook of Public Economics (Amsterdam: North-
Holland, 1987).
Leung, Danny, and Terence Yuen, “Do Exchange Rates Affect the Capital-Labor Ratio?
Panel Evidence from Canadian Manufacturing Industries,” Bank of Canada
Working Paper (April 2005); available at:
http://www.bankofcanada.ca/en/res/wp/2005/wp05-12.pdf.
Mutti, John, and Harry Grubert, “The Taxation of Capital Income in an Open Economy:
The importance of Resident-Nonresident Tax Treatment,” Journal of Public
Economics, 27 (August 1985), 291-309.
Nunziata, Luca, “Institutions and Wage Determination: A Multi-Country Approach,”
working paper (2001); available at: http://ideas.repec.org/p/nuf/econwp/0129.html
Persson, Torsten, and Guido Tabellini, “Democracy and Development: Devil in the
Details” (2005); available at:
http://www.aeaweb.org/annual_mtg_papers/2006/0106_1015_1402.pdf.
Poterba, James, “Retail Price reactions to Changes in State and Local Sales Taxes,”
National Tax Journal, 49:2 (1996), 165-176.
Rama, Martin, “A Labor Market Cross-Country Database” Washington, DC: World
Bank, 1996).
Rama, Martin, “Globalization and the Labor Market”, The World Bank Research
Observer, 18:2 (2003), 159-186.
Randolph, William C., “International Burdens of the Corporate Income Tax,” CBO
Working Paper 2006-09 (August 2006).
Rodrik, Dani, “Democracies Pay Higher Wages,” Quarterly Journal of Economics, 114:3
(1999), 707-738.
Solon, Gary, Robert Barsky, and Jonathan A. Parker, “Measuring the Cyclicality of Real
Wages: How Important is Composition Bias,” Quarterly Journal of Economics,
109:1 (1994), 1-25.
29
United Nations Industrial Development Organization (UNIDO), Yearbook of Labor
Statistics, various editions.
Figure 1: Corporate Tax and Wage Links, Panel Data, 1981-2005
01
02
03
04
0
0 .2 .4 .6Top Statutory Corporate Tax Rate
Average Manufacturing Wage Per Hour, US$ Fitted values
30
Table 1: Descriptive Statistics
Variable Mean Std. Dev
Average Wage Per
Hour, US $
5.185
6.402
Top Corporate Tax
Rate
.343
.105
Log (Capital-
Labor Ratio)
9.979 1.176
Effective Average
Tax Rate
.305 .093
Effective Marginal
tax Rate
.265 .117
Average Personal
Income Tax Rate
.263
.097
Capital Mobility 4.264 3.248
Value Added Per
Worker
19776.44 14570.41
Log (GDP per
capita)
8.091 1.398
Log (Trade/GDP) 4.108 .624
Log (Schooling) 3.845 .609
ILO Conventions 47.257 27.867
Log (Consumer
Price Level)
3.935 .607
31
Table 2: Regressions Without Spatial Effects
______________________________________________________________________________________
(1) (2) (3) (4) (5)
FE FE FE GMM OLS
______________________________________________________________________________________
Log(Top Corp. Tax) -.697 -0.259 -.978
(.281)** (.108)** (.330)***
Log(Eff. Avg. Tax) -.632
(.302)**
Log(Eff. Marg. Tax) -.385
(.206)*
Log(Value Added) 0.431 .365 .401 .050 .427
(.256)* (.268) (.266) (.010)*** (.254)*
Log(Consumer Price) .539 .624 .611 .538 .446
(.247)** (.271)** (.275)** (.040)*** (.267)*
Log(Wage,t-1) .656
(.020)***
Constant -6.172 -5.888 -5.921 -2.756 -6.008
(2.366)*** (2.483)** (2.523)** (.193)*** (2.456)**
Period Dummies Yes Yes Yes Yes Yes
Region Dummies No No No No Yes
Period x Region Dummies No No No No Yes
Observations 223 204 200 929 223
___________________________________________________________________________________
Standard Errors in parentheses
***significant at 1%; **significant at 5%;*significant at 10%
1. Specifications (1), (2) and (3) are estimated using fixed effects. Specification (4) uses GMM
estimation. Specification (5) uses OLS with region and period dummy variables, and the
interaction of these dummy variables.
2. In specifications (1)-(3) and (5), the dependent variable is the 5 year average of the wage rate over
sub-periods: 1981-1985, 1986-1990, 1991-1995, 1996-2000, 2001-2005. The independent
variables are the beginning of period values of these variables (except for the consumer price
variable which is also the five year average). In specification (4), we use annual data on wages.
32
Table 3: Regressions With Spatial Variables
(1) (2) (3) (4)
Weight: Income Income Distance Income
Nbr. Group: Region Income Income Income
Log(Top Corp. Tax) -.727 -.536 -.601
(.299)** (.299)* (.308)*
Log(Value Added) .532 .154 .179 .442
(.254)** (.290) (.294) (.285)
Log(Consumer Price) .466 .706 .617 .548
(.251)* (.246)*** (.244)** (.271)**
Weighted Nbr. Tax -.149 1.195 .628 -.028
(.238) (.451)*** (.324)* (.415)
Constant -6.956 -3.367 -3.786 -6.335
(2.365)*** (2.675) (2.706) (2.588)**
Observations 221 223 223 200
_____________________________________________________________________________________
Standard errors in parentheses
***significant at 1%; **significant at 5%;*significant at 10%
1.All specifications include country fixed effects and period dummies.
2.The dependent variable is the 5 year average of the wage rate over sub-periods: 1981-1985, 1986-
1990, 1991-1995, 1996-2000,2001-2005.
3. The tax rate for the spatial variable corresponds to the tax rate used in the specification. In (1),(2)
and (3), the spatial neighbor tax rate is the top corporate rate. In (4), the effective average tax rate.
33
Table 4: Testing Robustness
______________________________________________________________________________________
(1) (2) (3) (4)
_______________________________________________________________________ ______________
Log(Top Corp. Tax) -.527 -.528
(.299)* (.306)*
Log (Eff. Avg. Tax) -.572
(.326)*
Log (Eff. Marg. Tax) -.399
(.217)*
Inc. Wt.Nbr. Tax 1.365 1.277 1.052 1.264
(.492)*** (.507)** (.626)* (.491)**
Log(Value Added) .102 .144 .239 .258
(.297) (.300) (.311) (.305)
Log(Consumer Price) .870 .868 .711 .751
(.312)*** (.322)** (.348)** (.346)**
Log(Trade/GDP) .242 .251 -.186 -.138
(.282) (.292) (.345) (.343)
Cap. Mobility -.025 -.043 -.033
(.031) (.033) (.033)
Log(ILO Conventions) .253 .396
(.648) (.637)
Constant -4.367 -4.586 -4.059 -4.767
(2.919) (2.980) (3.459) (3.443)
Observations 223 216 182 181
_____________________________________________________________________________________
Standard errors in parentheses
***significant at 1%; **significant at 5%;*significant at 10%
1.All specifications include country fixed effects and period dummies.
2.The dependent variable is the 5 year average of the wage rate over sub-periods: 1981-1985, 1986-1990,
1991-1995, 1996-2000,2001-2005.
3. The tax rate for the spatial variable corresponds to the tax rate used in the specification. In (1), (2) and
(3), the spatial neighbor tax rate is the top corporate rate. In (4), the effective average tax rate.
34
Table 5: Capital-Labor Ratios, Taxes and Wages
(1) (2) (3) (4)
Log (K/L) Log (K/L) Log ( K/L) Log (Wage)
Log(Top Corp.Tax) -.137
(.058)**
Log(Eff. Avg. Tax) -.161
(.073)**
Log(Eff. Marg. Tax) -.093
(.057)
Log (K/L) .450
(.176)**
Constant 9.876 9.873 9.949 3.722
(.064)*** (.090)*** (.080)*** (1.780)***
Observations 256 229 225 247
______________________________________________________________________
Standard errors in parentheses
***significant at 1%; **significant at 5%;*significant at 10%
_______________________________________________________________________
1.The dependent variable is the 5 year average of the wage rate in (4) and the capital-labor ratio in (1), (2)
and (3) over sub-periods: 1981-1985, 1986-1990, 1991-1995, 1996-2000,2001-2005. The independent
variables are the beginning of period values of these variables.
35
Data Appendix
A.1 AEI International Tax Database
The main sources of information for the data are: (1) The Price Waterhouse
Coopers Corporate Taxes – Worldwide Summaries” and “Individual Taxes – Worldwide
Summaries” (2) Coopers and Lybrand: “International Tax Summaries” (3) “Worldwide
Corporate Tax Guide 2001” by Ernest & Young (4) The International Bureau for Fiscal
Documentation‟s Loose-leaf Service (5) Embassies and ministries of taxation in
individual countries. Historical information was gathered from Georgetown Law Library
and the Library of Congress. The most recent information was purchased from the PWC
website:
(http://www.pwc.com/extweb/pwcpublications.nsf/docid/9B2B76032544964C8525717E
00606CBD) or printed out from the E&Y website.
The Database consists of a number of spreadsheets containing information on a
specific tax rate, the number of income tax brackets and the upper limit of each bracket
(in local currency) and the tax rate in each bracket for about 128 countries. We chose
countries based on data availability and to ensure a mix of developing and developed
economies.
The database contains information on the following tax variables: (1) Personal
Income Taxes (2) Deductions to Personal Income Taxes (3) Personal Dividend Taxes (4)
Local Personal Taxes (5) Capital Gains Taxes (6) Corporate Taxes (manufacturing are
reported separately)xxv
(7) Local Corporate Taxes (8) Corporate Dividend Taxes (9)
Corporate Capital Gains Taxes (10) Employer Payroll Taxes (11) Employee Payroll
Taxes (12) VAT (13) Inheritance and Gift Taxes. It also provides information on the tax
depreciation rules followed by countries. Depreciation rules are broadly based on the
straight line method or the declining balance method or a combination of both. These
rates vary across countries and were used in the calculation of the effective average and
effective marginal corporate tax rates.
Cross-country comparability issues
The main differences across countries in corporate taxation arise due to various
surcharges and additional contributions that are either (1) added to the base tax rates or
(2) are imposed as a proportion of taxes payable. For instance, Barbados in 1991 added a
1.5 percent stabilization tax to all marginal tax rates. Brazil in 2005 imposed an
additional „social contribution‟ of 10 percent. The assumption we have made is that if the
36
surcharge applies to all tax brackets, it is added to all the corresponding tax rates. In other
cases, the surcharge is applied to all tax payable. In this case, all tax rates are multiplied
by (1+surcharge%). For instance, Belgium in 2005 imposed a crisis tax of 3 percent,
raising its total corporate tax rate to 33.99 percent from 33 percent. Canada in 1987
imposed a temporary 3% surtax on tax payable. All marginal tax rates were multiplied by
1.03. However, in some cases this is not possible since the surcharge applies only if the
tax liability is above a certain level. In such cases, the marginal tax rate would vary for
the high income and the low income groups depending upon the actual tax payments (net
of deductions etc). If no further information is provided, in such cases the surtax is not
included. For example, in Korea 1981-1990, there is a 10% defense tax on tax payable,
which is increased to 20% for higher tax payers. The 20% surtax is not included in this
database, while the 10% surtax is applied to all income levels.
Apart from the various surcharges and additional contributions imposed on the
marginal tax rates, we have had to make certain assumptions while dealing with the data.
Some of these are listed here. For more detailed notes, we would refer you to the AEI
International Tax Database.
In Saudi Arabia, Saudi owned enterprises and the Saudi portion of joint
enterprises are not subject to the corporate income tax. We have used the tax rate
applicable to foreign firms.
In Thailand for certain years, the tax rate for companies listed on the stock
exchange was lower than for those companies not listed on the exchange. We have used
the rate for companies listed on the stock exchange. This is also true of Pakistan, where
different rates apply to publicly listed companies compared to non-publicly listed
companies. We have used the rate for the former.
In Canada, the national corporate tax rate is reduced by 10% to allow the
provinces and territories room to impose corporate taxes. In general, whenever a country
allows deductions of the local corporate tax from the national tax, these deductions are
taken into account.
In Spain, there is a reduced rate for qualifying small businesses who earn up to a
certain level of income (the actual number varies across years). This is not taken into
account since it is not possible to distinguish between types of businesses or the number
of years they are in operation.
A.2 International Wage Data
The statistics on wages are obtained from the ILO‟s Key Indicators of the Labor
Market (KILM). The ILO reports average earnings per worker or, in some cases, average
wage rates. Some of the series cover wage earners (i.e. manual or production workers)
only, while others refer to salaried employees (i.e. non-manual workers), or all employees
(i.e. wage earners and salaried employees). The series cover workers of both sexes,
irrespective of age.
Earnings: The concept of earnings relates to remuneration in cash and in kind
paid to employees, as a rule at regular intervals, for time worked or work done together
with remuneration for time not worked, such as for annual vacation, other paid leave or
holidays. In general, earnings exclude employers‟ contributions in respect of their
37
employees paid to social security and pension schemes and also the benefits received by
employees under these schemes. However, some countries report any such payments
made. Earnings also exclude severance and termination pay.
Statistics of earnings should relate to employees‟ gross remuneration, i.e., the
total before any deductions are made by the employer in respect of taxes, contributions of
employees to social security and pension schemes, life insurance premiums, union dues
and other obligations of employees.
Earnings include: direct wages and salaries, remuneration for time not worked
(excluding severance and termination pay), bonuses and gratuities and housing and
family allowances paid by the employer directly to this employee. (a) Direct wages and
salaries for time worked, or work done, cover: (i) straight time pay of time-rated workers;
(ii) incentive pay of time-rated workers; (iii) earnings of piece workers (excluding
overtime premiums); (iv) premium pay for overtime, shift, night and holiday work; (v)
commissions paid to sales and other personnel. Included are: premiums for seniority and
special skills, geographical zone differentials, responsibility premiums, dirt, danger and
discomfort allowances, payments under guaranteed wage systems, cost-of-living
allowances and other regular allowances. (b) Remuneration for time not worked
comprises direct payments to employees in respect of public holidays, annual vacations
and other time off with pay granted by the employer. (c) Bonuses and gratuities cover
seasonal and end-of-year bonuses, additional payments in respect of vacation period
(supplementary to normal pay) and profit-sharing bonuses. (ii) Statistics of earnings
should distinguish cash earnings from payments in kind.
Wage rates: These include basic wages, cost-of-living allowances and other guaranteed
and regularly paid allowances, but exclude overtime payments, bonuses and gratuities,
family allowances and other social security payments made by employers. Ex gratia
payments in kind, supplementary to normal wage rates, are also excluded.
Thus broadly country coverage differs due to the following reasons: (1) whether
the reported statistic is wages or earnings (2) whether it covers employees, wage earners
or salaried employees (3) whether it includes social security contributions by employer.
When we studied the descriptions more closely, we found that certain countries like
Chile, Turkey, Colombia, Ecuador, Kenya, Kyrgyzstan, Mexico, Malaysia, Panama and
Ukraine included social security contributions by employers in the earnings data. Another
difference arises because the industrial classification changed during this period. Since
the beginning of the 1990s an increasing number of countries have made a switchover in
their data reporting systems for industrial statistics from Revision 2 to Revision 3 of the
International Standard Classification of All Economic Activities (ISIC).
Including dummies to allow for all these differences in coverage in a panel
regression (without country fixed effects) yielded a highly significant negative sign on
corporate tax rates, and no change in results for the other variables.
i See Auerbach (2005) for a more recent analysis of who bears the burden of the corporate tax.
ii Corporate taxes have other distorting effects as well. They distort choices related to organizational form
of the business, lead to reliance on debt financing of firms and discourage dividend payouts (Hines, 2001) iii
“Corporate Income Tax Rates: International Comparisons”, November 2005, CBO
38
iv Note that tax competition has been traditionally modeled as countries responding to other countries
corporate tax rates by lowering their own, to attract investment. Our notion of tax competition refers to the
flow of capital across countries in response to existing differences in tax levels. Such mobility is implicitly,
rather than explicitly, modeled since we‟re studying wage determination in mostly open economies. v This is not a balanced panel, since data on taxes is missing for several countries, both OECD and non-
OECD. vi Solon et al. (1994) suggest that aggregate wage statistics may be subject to severe composition bias. The
aggregate wage statistic is a weighted average of earnings for different groups of workers, such as high-
wage or low-wage workers. Since hours of work of low-wage workers tend to be procyclical, this gives
greater weight to low-skill workers in expansions, rather than recessions. Thus cyclically shifting weights
may be a source of measurement error in aggregate wage data. We believe that our measure of wages is
less subject to this criticism since we average the wage data for each country over five year periods,
removing much of the cyclicality. vii
Typically, real and nominal wage data are highly serially correlated (Nuniziata, 2001). However, since
we use five year averages, this is less of a concern for us. In later specifications, we do use GLS estimation
allowing for autocorrelation in the residuals, however the estimated autocorrelation coefficient is not
significant and results do not change. viii
Access to the AEI International Tax Database can be provided by writing to the authors. ix
Our specification is also similar to Barro (2003) which uses beginning of period values of the explanatory
variables to explain average growth rates over different periods of time. We have also tested our results
using the average of the log wage rates as the dependent variable. Results were similar and in most cases
the significance level went up as a result of using this specification. However, with no theory to guide us,
we report results using the log of the average wage since the arithmetic mean (rather than the geometric
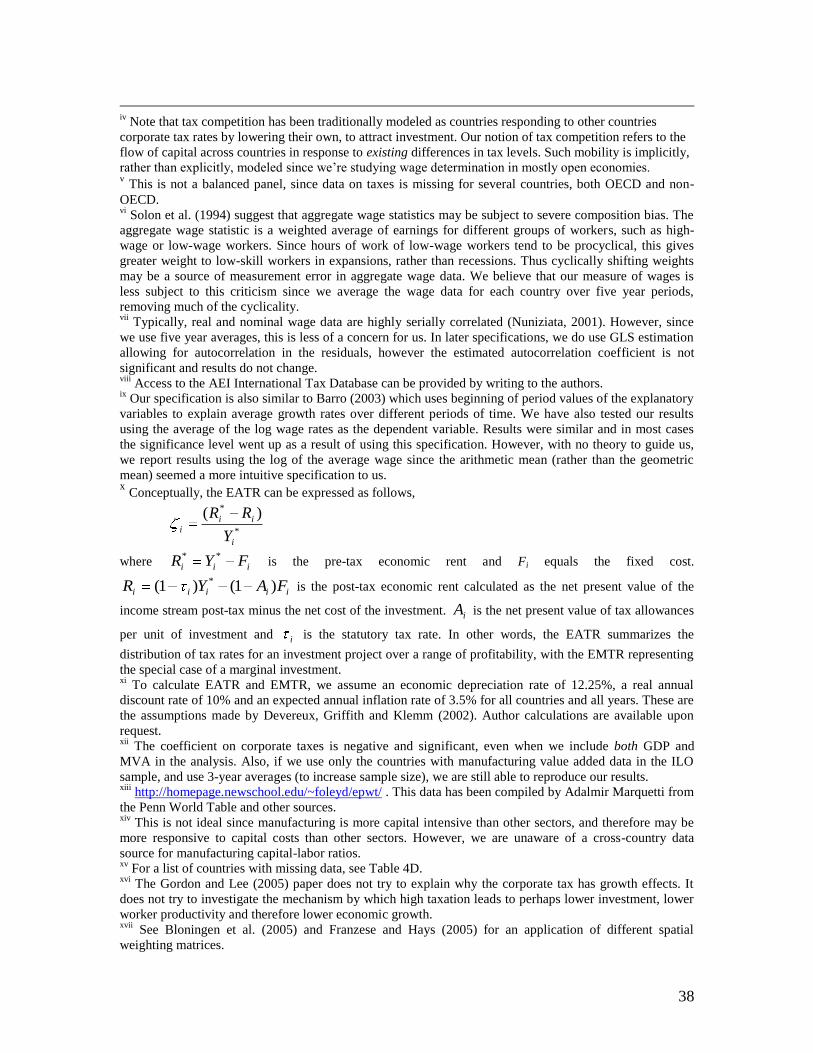
mean) seemed a more intuitive specification to us. x Conceptually, the EATR can be expressed as follows,
*
* )(
i
iii
Y
RR
where iii FYR ** is the pre-tax economic rent and Fi equals the fixed cost.
iiiii FAYR )1()1( * is the post-tax economic rent calculated as the net present value of the
income stream post-tax minus the net cost of the investment. iA is the net present value of tax allowances
per unit of investment and i is the statutory tax rate. In other words, the EATR summarizes the
distribution of tax rates for an investment project over a range of profitability, with the EMTR representing
the special case of a marginal investment. xi
To calculate EATR and EMTR, we assume an economic depreciation rate of 12.25%, a real annual
discount rate of 10% and an expected annual inflation rate of 3.5% for all countries and all years. These are
the assumptions made by Devereux, Griffith and Klemm (2002). Author calculations are available upon
request. xii
The coefficient on corporate taxes is negative and significant, even when we include both GDP and
MVA in the analysis. Also, if we use only the countries with manufacturing value added data in the ILO
sample, and use 3-year averages (to increase sample size), we are still able to reproduce our results. xiii
http://homepage.newschool.edu/~foleyd/epwt/ . This data has been compiled by Adalmir Marquetti from
the Penn World Table and other sources. xiv
This is not ideal since manufacturing is more capital intensive than other sectors, and therefore may be
more responsive to capital costs than other sectors. However, we are unaware of a cross-country data
source for manufacturing capital-labor ratios. xv
For a list of countries with missing data, see Table 4D. xvi
The Gordon and Lee (2005) paper does not try to explain why the corporate tax has growth effects. It
does not try to investigate the mechanism by which high taxation leads to perhaps lower investment, lower
worker productivity and therefore lower economic growth. xvii
See Bloningen et al. (2005) and Franzese and Hays (2005) for an application of different spatial
weighting matrices.
39
xviii
Immigration and trade flow linkages are likely to be better captured by using within region income
weights rather than across regions, since geographic distance increases the costs of labor mobility and
transportation of goods. xix
Distances are calculated as the physical distance between two capital cities. xx
Gordon and Lee (2005) estimate the impact of corporate taxes on economic growth. They use neighbor
tax rates as instruments for the domestic tax rate. We believe this is incorrect since both variables may have
independent effects on growth and wages, and both therefore need to be included in the regression. Further,
they do not consider different measures of the corporate tax rate, such as the effective average and marginal
tax rates. xxi
An OLS regression of average wages on corporate taxes, schooling and (trade/GDP) (controlling for
region effects and time dummies) alone yields significant and positive coefficients on schooling and
(trade/GDP), while still yielding a negative and significant coefficient on corporate taxes. A regression of
average wages on computerization or number of ILO conventions alone yields a positive and statistically
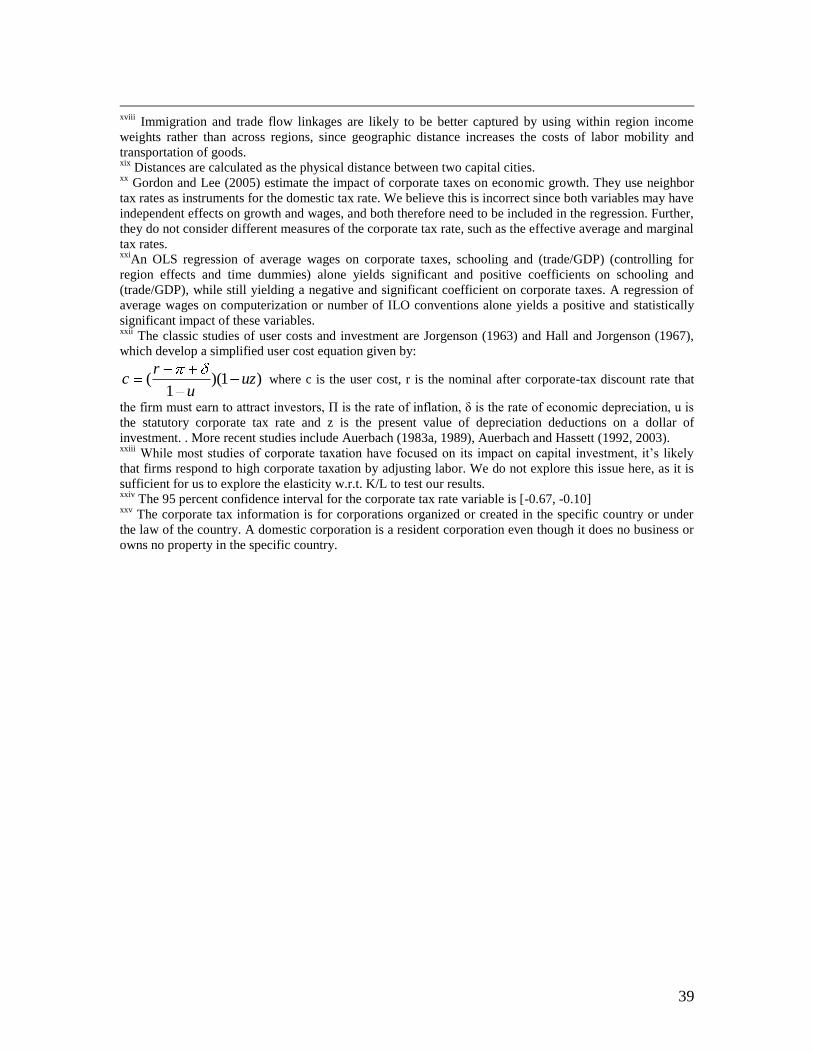
significant impact of these variables. xxii
The classic studies of user costs and investment are Jorgenson (1963) and Hall and Jorgenson (1967),
which develop a simplified user cost equation given by:
)1)(1
( uzu
rc where c is the user cost, r is the nominal after corporate-tax discount rate that
the firm must earn to attract investors, П is the rate of inflation, δ is the rate of economic depreciation, u is
the statutory corporate tax rate and z is the present value of depreciation deductions on a dollar of
investment. . More recent studies include Auerbach (1983a, 1989), Auerbach and Hassett (1992, 2003). xxiii
While most studies of corporate taxation have focused on its impact on capital investment, it‟s likely
that firms respond to high corporate taxation by adjusting labor. We do not explore this issue here, as it is
sufficient for us to explore the elasticity w.r.t. K/L to test our results. xxiv
The 95 percent confidence interval for the corporate tax rate variable is [-0.67, -0.10] xxv
The corporate tax information is for corporations organized or created in the specific country or under
the law of the country. A domestic corporation is a resident corporation even though it does no business or
owns no property in the specific country.


![Aparna Kumar.doc[1]](https://static.fdocuments.us/doc/165x107/577d26681a28ab4e1ea11f5b/aparna-kumardoc1.jpg)