SPATIAL PREDICTION AND CLASSIFICATION OF WATER … › Secure › ejournals › papers ›...
11
H.S. Al-Bahrani, Int. J. Sus. Dev. Plann. Vol. 9, No. 3 (2014) 389–399 © 2014 WIT Press, www.witpress.com ISSN: 1743-7601 (paper format), ISSN: 1743-761X (online), http://journals.witpress.com DOI: 10.2495/SDP-V9-N3-389-399 SPATIAL PREDICTION AND CLASSIFICATION OF WATER QUALITY PARAMETERS FOR IRRIGATION USE IN THE EUPHRATES RIVER (IRAQ) USING GIS AND SATELLITE IMAGE ANALYSES H.S. AL-BAHRANI Civil Engineering Department, University of Kufa, Iraq. ABSTRACT This study was conducted by analyzing data from satellite image and geographical information system (GIS) to classify water quality parameters of Euphrates River in Iraq for irrigation use. The main purpose of this research was to develop water quality classification models for Euphrates River, Iraq, using remote sensing. The water quality parameters used in this study included total dissolved solids (TDS), chlorides (Cl - ), electrical conductivity (EC), and sodium adsorption ratio (SAR). The classification models were used for spatial prediction of these four parameters to determine the water’s suitability for irriga- tion use from the satellite image. GIS techniques were used in the beginning to project the coordinates of 16 stations along the River in LANDSAT satellite image for Iraq map. Positive strong correlations between digital numbers of the satellite image at Band 2 with the water quality parameters in December, 2009, helped to build four regression mod- els between these two variables. These models could be used to predict these four water quality parameters (TDS, Cl - , EC, and SAR) at any point along the River in Iraq from the satellite image directly. The next stage depends on satellite image analyses for the sake of building water quality classification models for Euphrates River on the satellite image to classify each of these water quality parameters according to irrigation use. These water quality classification models can be used to manage the agriculture along the basin of the River and to discover the locations of pollution in the River. The general objective of this research is attaining a classification model that supports the identification, characterization and monitoring of water quality parameters that have an influence in irrigation. Keywords: Classification model, Euphrates River, GIS, remote sensing, satellite image water quality. 1 INTRODUCTION Euphrates River is a vital resource in Iraq especially for irrigation use. Satellite image analyses and geographical information system (GIS) are important tools to monitor and predict water quality parameters for rivers and lakes. These techniques are quick and cost-effective especially when deal- ing with geographically wide and inaccessible areas. These techniques were used and well documented in the following literatures. Al-Bahrani et al. [1] built a water quality classification model on LANDSAT satellite image for Bhargava water quality index on Euphrates River in Iraq. The authors classified the River based on the satellite image into five classes. The classification results were consistent with the values of the water quality index. Al-Bahrani [2] reported strong negative correlations between digital numbers (DNs) in Bands 1 and 2 of LANDSAT satellite image with water quality indices according to Bhargava and Canadian methods. These two indices were calculated for the Euphrates River from April, 2007 to December, 2010 for 16 stations along the River inside Iraqi lands, and satellite image models were built to classify the water of the River for irrigation use. Nelson et al. [3] developed a regression model to estimate water clarity as measured by Secchi disk transparency (SDT) from LANDSAT data calibrated using 93 lakes in Michigan, USA. They correlated the natural log of the SDT with the range of LANDSAT DNs of (Band 1/Band 3) and
Transcript of SPATIAL PREDICTION AND CLASSIFICATION OF WATER … › Secure › ejournals › papers ›...
H.S. Al-Bahrani, Int. J. Sus. Dev. Plann. Vol. 9, No. 3 (2014) 389–399
© 2014 WIT Press, www.witpress.comISSN: 1743-7601 (paper format), ISSN: 1743-761X (online), http://journals.witpress.comDOI: 10.2495/SDP-V9-N3-389-399
SPATIAL PREDICTION AND CLASSIFICATION OF WATER QUALITY PARAMETERS FOR IRRIGATION
USE IN THE EUPHRATES RIVER (IRAQ) USING GIS AND SATELLITE IMAGE ANALYSES
H.S. AL-BAHRANICivil Engineering Department, University of Kufa, Iraq.
ABSTRACTThis study was conducted by analyzing data from satellite image and geographical information system (GIS) to classify water quality parameters of Euphrates River in Iraq for irrigation use.
The main purpose of this research was to develop water quality classifi cation models for Euphrates River, Iraq, using remote sensing. The water quality parameters used in this study included total dissolved solids (TDS), chlorides (Cl-), electrical conductivity (EC), and sodium adsorption ratio (SAR). The classifi cation models were used for spatial prediction of these four parameters to determine the water’s suitability for irriga-tion use from the satellite image.
GIS techniques were used in the beginning to project the coordinates of 16 stations along the River in LANDSAT satellite image for Iraq map. Positive strong correlations between digital numbers of the satellite image at Band 2 with the water quality parameters in December, 2009, helped to build four regression mod-els between these two variables. These models could be used to predict these four water quality parameters (TDS, Cl-, EC, and SAR) at any point along the River in Iraq from the satellite image directly.
The next stage depends on satellite image analyses for the sake of building water quality classifi cation models for Euphrates River on the satellite image to classify each of these water quality parameters according to irrigation use. These water quality classifi cation models can be used to manage the agriculture along the basin of the River and to discover the locations of pollution in the River.
The general objective of this research is attaining a classifi cation model that supports the identifi cation, characterization and monitoring of water quality parameters that have an infl uence in irrigation.Keywords: Classifi cation model, Euphrates River, GIS, remote sensing, satellite image water quality.
1 INTRODUCTIONEuphrates River is a vital resource in Iraq especially for irrigation use. Satellite image analyses and geographical information system (GIS) are important tools to monitor and predict water quality parameters for rivers and lakes. These techniques are quick and cost-effective especially when deal-ing with geographically wide and inaccessible areas. These techniques were used and well documented in the following literatures.
Al-Bahrani et al. [1] built a water quality classifi cation model on LANDSAT satellite image for Bhargava water quality index on Euphrates River in Iraq. The authors classifi ed the River based on the satellite image into fi ve classes. The classifi cation results were consistent with the values of the water quality index.Al-Bahrani [2] reported strong negative correlations between digital numbers (DNs) in Bands 1 and 2 of LANDSAT satellite image with water quality indices according to Bhargava and Canadian methods. These two indices were calculated for the Euphrates River from April, 2007 to December, 2010 for 16 stations along the River inside Iraqi lands, and satellite image models were built to classify the water of the River for irrigation use.
Nelson et al. [3] developed a regression model to estimate water clarity as measured by Secchi disk transparency (SDT) from LANDSAT data calibrated using 93 lakes in Michigan, USA. They correlated the natural log of the SDT with the range of LANDSAT DNs of (Band 1/Band 3) and
390 H.S. Al-Bahrani, Int. J. Sus. Dev. Plann. Vol. 9, No. 3 (2014)
discovered that the use of LANDSAT to measure water clarity is sensitive to the distribution of water clarity used in the calibration set.
Sawaya et al. [4] assessed the potential of high-resolution IKONOS and QuickBird satellite imagery for mapping and analysis of land and water resources at local scales in Minnesota in a series of three applications consisting of classifying lake water clarity (r2 = 0.89), mapping of urban imper-vious surface area (r2 = 0.98), and surveying aquatic vegetation of emergent and submerging plant groups (80% accuracy).
Selman et al. [5] employed remote sensing with GIS for studying the hydrochemical properties of water at Himreen Dam Reservoir, located on Diyala River in Iraq. Analytical study on spectrum refl ectance value of study area was performed using satellite image, taken by LANDSAT.
Al-Rubai’i [6] used thermal technique of remote sensing to evaluate its capability to detect and identify water pollution that results from petroleum-related pollution. A mathematical model was developed using DNs of thermal satellite images to measure the temperature of water.
The aim of this study is to predict the spatial distribution of water quality parameters using satel-lite images.
2 METHODSWater pollution can be defi ned in general as ‘any variation either natural or artifi cial that changes the quality of water and disturbs or destroys the balance of ecosystems and natural sources, so that it: causes hazards to public health, detracts from the convenience effi ciency and wellbeing of man and his communities, and impairs the benefi cial uses of water’ [7].
There are four main water quality parameters, which increased have adverse effects on water qual-ity especially for irrigation use. These four parameters are: total dissolved solids (TDS), electrical conductivity (EC), sodium adsorption ratio (SAR), and chlorides (Cl-).
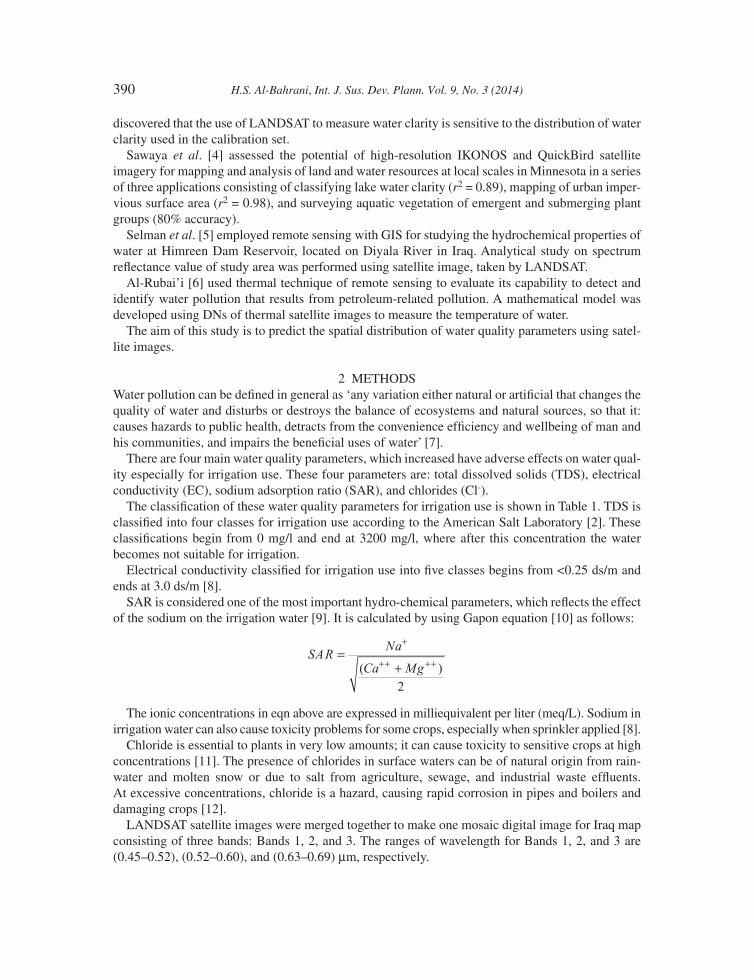
The classifi cation of these water quality parameters for irrigation use is shown in Table 1. TDS is classifi ed into four classes for irrigation use according to the American Salt Laboratory [2]. These classifi cations begin from 0 mg/l and end at 3200 mg/l, where after this concentration the water becomes not suitable for irrigation.
Electrical conductivity classifi ed for irrigation use into fi ve classes begins from <0.25 ds/m and ends at 3.0 ds/m [8].
SAR is considered one of the most important hydro-chemical parameters, which refl ects the effect of the sodium on the irrigation water [9]. It is calculated by using Gapon equation [10] as follows:
The ionic concentrations in eqn above are expressed in milliequivalent per liter (meq/L). Sodium in irrigation water can also cause toxicity problems for some crops, especially when sprinkler applied [8].
Chloride is essential to plants in very low amounts; it can cause toxicity to sensitive crops at high concentrations [11]. The presence of chlorides in surface waters can be of natural origin from rain-water and molten snow or due to salt from agriculture, sewage, and industrial waste effl uents. At excessive concentrations, chloride is a hazard, causing rapid corrosion in pipes and boilers and damaging crops [12].
LANDSAT satellite images were merged together to make one mosaic digital image for Iraq map consisting of three bands: Bands 1, 2, and 3. The ranges of wavelength for Bands 1, 2, and 3 are (0.45–0.52), (0.52–0.60), and (0.63–0.69) µm, respectively.
H.S. Al-Bahrani, Int. J. Sus. Dev. Plann. Vol. 9, No. 3 (2014) 391
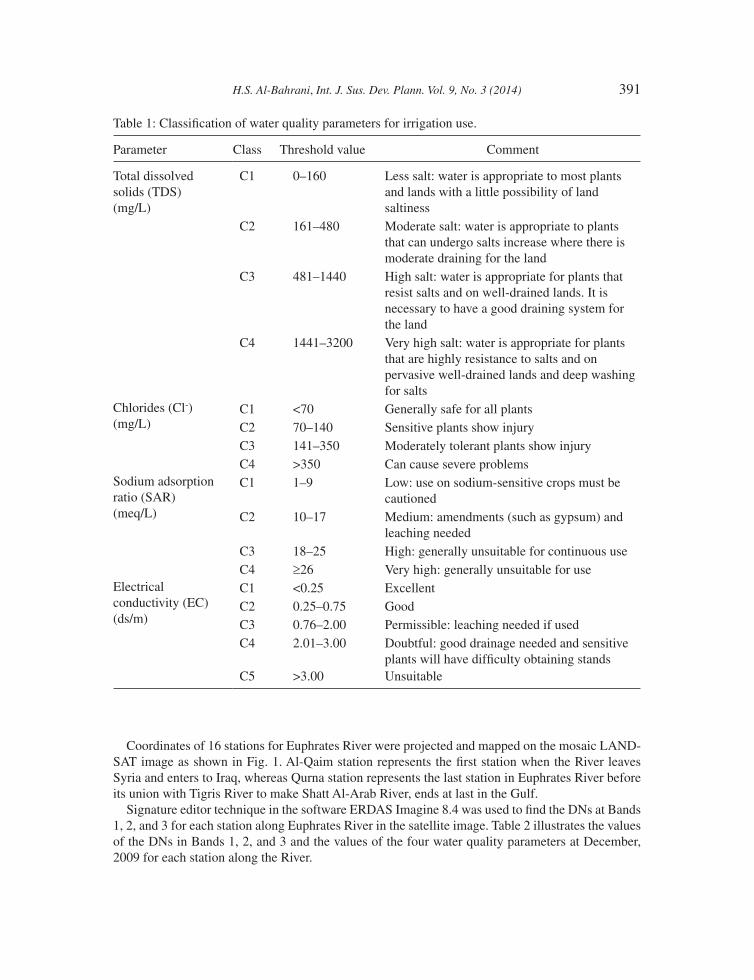
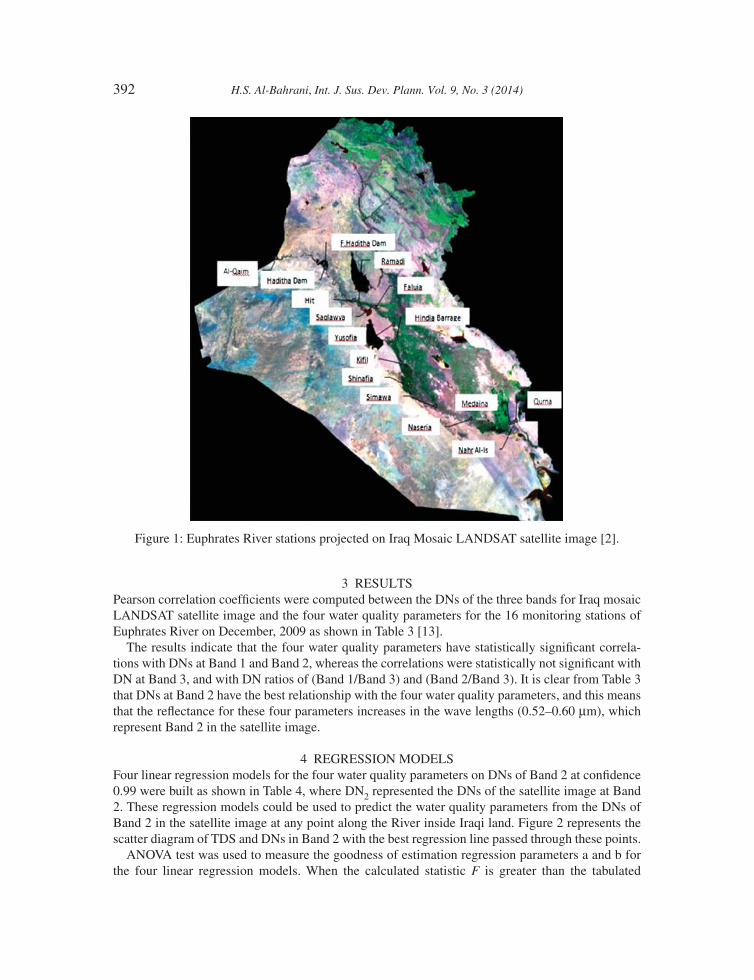
Coordinates of 16 stations for Euphrates River were projected and mapped on the mosaic LAND-SAT image as shown in Fig. 1. Al-Qaim station represents the fi rst station when the River leaves Syria and enters to Iraq, whereas Qurna station represents the last station in Euphrates River before its union with Tigris River to make Shatt Al-Arab River, ends at last in the Gulf.
Signature editor technique in the software ERDAS Imagine 8.4 was used to fi nd the DNs at Bands 1, 2, and 3 for each station along Euphrates River in the satellite image. Table 2 illustrates the values of the DNs in Bands 1, 2, and 3 and the values of the four water quality parameters at December, 2009 for each station along the River.
Table 1: Classifi cation of water quality parameters for irrigation use.
Parameter Class Threshold value Comment
Total dissolved solids (TDS) (mg/L)
C1 0–160 Less salt: water is appropriate to most plants and lands with a little possibility of land saltiness
C2 161–480 Moderate salt: water is appropriate to plants that can undergo salts increase where there is moderate draining for the land
C3 481–1440 High salt: water is appropriate for plants that resist salts and on well-drained lands. It is necessary to have a good draining system for the land
C4 1441–3200 Very high salt: water is appropriate for plants that are highly resistance to salts and on pervasive well-drained lands and deep washing for salts
Chlorides (Cl-) (mg/L)
C1 <70 Generally safe for all plantsC2 70–140 Sensitive plants show injuryC3 141–350 Moderately tolerant plants show injuryC4 >350 Can cause severe problems
Sodium adsorption ratio (SAR) (meq/L)
C1 1–9 Low: use on sodium-sensitive crops must be cautioned
C2 10–17 Medium: amendments (such as gypsum) and leaching needed
C3 18–25 High: generally unsuitable for continuous useC4 ≥26 Very high: generally unsuitable for use
Electrical conductivity (EC) (ds/m)
C1 <0.25 ExcellentC2 0.25–0.75 GoodC3 0.76–2.00 Permissible: leaching needed if usedC4 2.01–3.00 Doubtful: good drainage needed and sensitive
plants will have diffi culty obtaining standsC5 >3.00 Unsuitable
392 H.S. Al-Bahrani, Int. J. Sus. Dev. Plann. Vol. 9, No. 3 (2014)
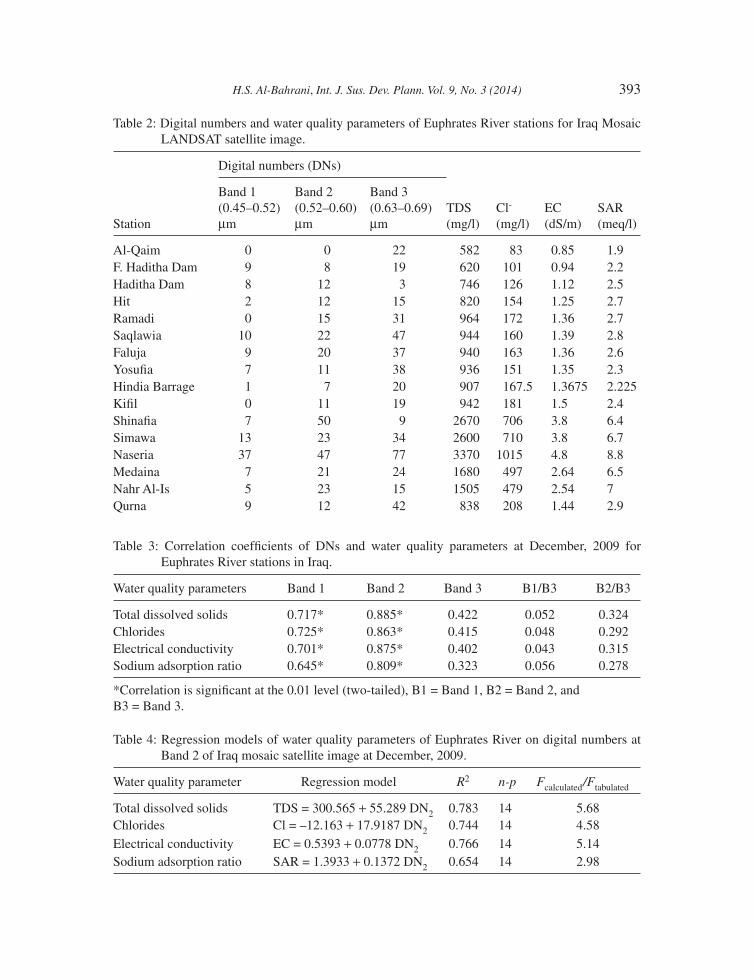
3 RESULTSPearson correlation coeffi cients were computed between the DNs of the three bands for Iraq mosaic LANDSAT satellite image and the four water quality parameters for the 16 monitoring stations of Euphrates River on December, 2009 as shown in Table 3 [13].
The results indicate that the four water quality parameters have statistically signifi cant correla-tions with DNs at Band 1 and Band 2, whereas the correlations were statistically not signifi cant with DN at Band 3, and with DN ratios of (Band 1/Band 3) and (Band 2/Band 3). It is clear from Table 3 that DNs at Band 2 have the best relationship with the four water quality parameters, and this means that the refl ectance for these four parameters increases in the wave lengths (0.52–0.60 µm), which represent Band 2 in the satellite image.
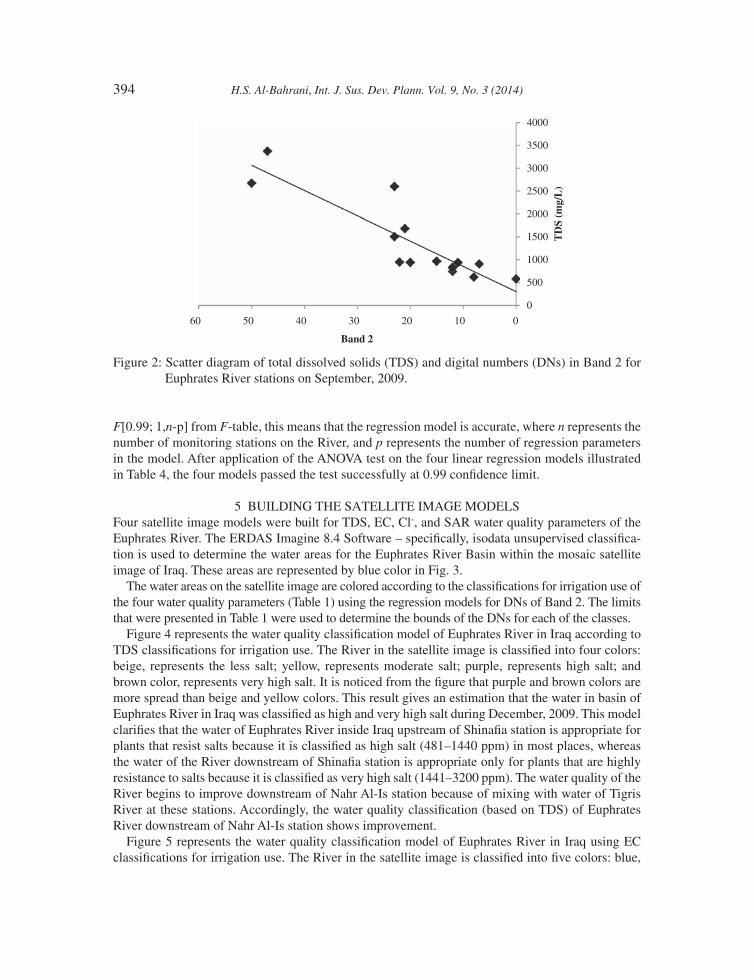
4 REGRESSION MODELSFour linear regression models for the four water quality parameters on DNs of Band 2 at confi dence 0.99 were built as shown in Table 4, where DN2 represented the DNs of the satellite image at Band 2. These regression models could be used to predict the water quality parameters from the DNs of Band 2 in the satellite image at any point along the River inside Iraqi land. Figure 2 represents the scatter diagram of TDS and DNs in Band 2 with the best regression line passed through these points.
ANOVA test was used to measure the goodness of estimation regression parameters a and b for the four linear regression models. When the calculated statistic F is greater than the tabulated
Figure 1: Euphrates River stations projected on Iraq Mosaic LANDSAT satellite image [2].
H.S. Al-Bahrani, Int. J. Sus. Dev. Plann. Vol. 9, No. 3 (2014) 393
Table 2: Digital numbers and water quality parameters of Euphrates River stations for Iraq Mosaic LANDSAT satellite image.
Station
Digital numbers (DNs)
TDS (mg/l)
Cl-
(mg/l)EC (dS/m)
SAR (meq/l)
Band 1 (0.45–0.52) µm
Band 2 (0.52–0.60) µm
Band 3 (0.63–0.69) µm
Al-Qaim 0 0 22 582 83 0.85 1.9F. Haditha Dam 9 8 19 620 101 0.94 2.2Haditha Dam 8 12 3 746 126 1.12 2.5Hit 2 12 15 820 154 1.25 2.7Ramadi 0 15 31 964 172 1.36 2.7Saqlawia 10 22 47 944 160 1.39 2.8Faluja 9 20 37 940 163 1.36 2.6Yosufi a 7 11 38 936 151 1.35 2.3Hindia Barrage 1 7 20 907 167.5 1.3675 2.225Kifi l 0 11 19 942 181 1.5 2.4Shinafi a 7 50 9 2670 706 3.8 6.4Simawa 13 23 34 2600 710 3.8 6.7Naseria 37 47 77 3370 1015 4.8 8.8Medaina 7 21 24 1680 497 2.64 6.5Nahr Al-Is 5 23 15 1505 479 2.54 7Qurna 9 12 42 838 208 1.44 2.9
Table 3: Correlation coeffi cients of DNs and water quality parameters at December, 2009 for Euphrates River stations in Iraq.
Water quality parameters Band 1 Band 2 Band 3 B1/B3 B2/B3
Total dissolved solids 0.717* 0.885* 0.422 0.052 0.324Chlorides 0.725* 0.863* 0.415 0.048 0.292Electrical conductivity 0.701* 0.875* 0.402 0.043 0.315Sodium adsorption ratio 0.645* 0.809* 0.323 0.056 0.278
*Correlation is signifi cant at the 0.01 level (two-tailed), B1 = Band 1, B2 = Band 2, and B3 = Band 3.
Table 4: Regression models of water quality parameters of Euphrates River on digital numbers at Band 2 of Iraq mosaic satellite image at December, 2009.
Water quality parameter Regression model R2 n-p Fcalculated /Ftabulated
Total dissolved solids TDS = 300.565 + 55.289 DN2 0.783 14 5.68Chlorides Cl = –12.163 + 17.9187 DN2 0.744 14 4.58
Electrical conductivity EC = 0.5393 + 0.0778 DN2 0.766 14 5.14Sodium adsorption ratio SAR = 1.3933 + 0.1372 DN2 0.654 14 2.98
394 H.S. Al-Bahrani, Int. J. Sus. Dev. Plann. Vol. 9, No. 3 (2014)
F[0.99; 1,n-p] from F-table, this means that the regression model is accurate, where n represents the number of monitoring stations on the River, and p represents the number of regression parameters in the model. After application of the ANOVA test on the four linear regression models illustrated in Table 4, the four models passed the test successfully at 0.99 confi dence limit.
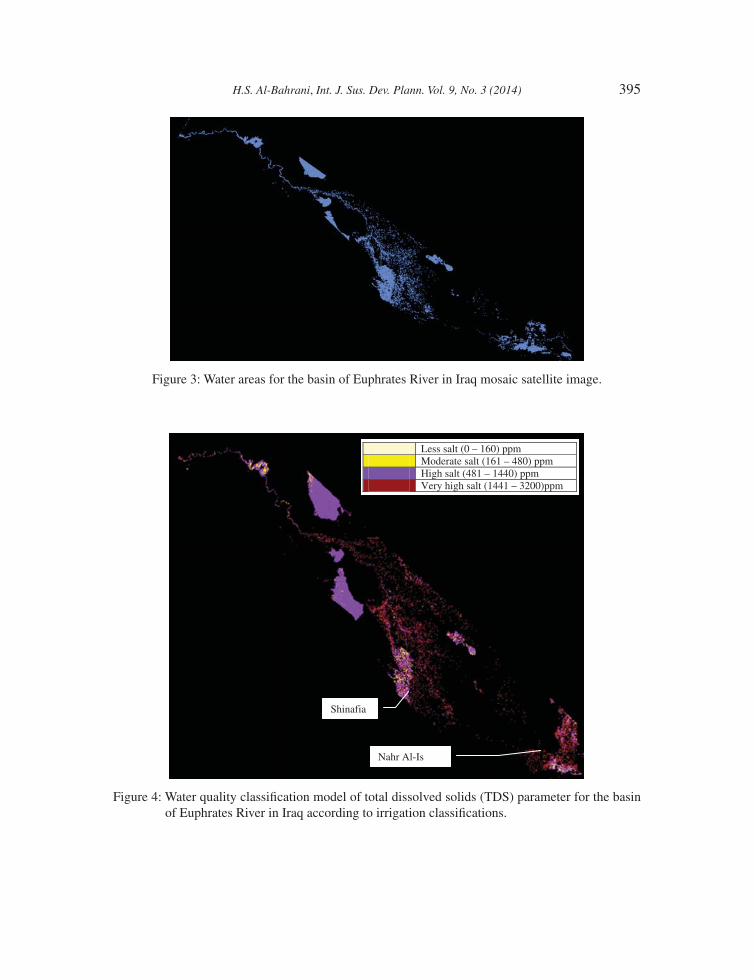
5 BUILDING THE SATELLITE IMAGE MODELSFour satellite image models were built for TDS, EC, Cl-, and SAR water quality parameters of the Euphrates River. The ERDAS Imagine 8.4 Software – specifi cally, isodata unsupervised classifi ca-tion is used to determine the water areas for the Euphrates River Basin within the mosaic satellite image of Iraq. These areas are represented by blue color in Fig. 3.
The water areas on the satellite image are colored according to the classifi cations for irrigation use of the four water quality parameters (Table 1) using the regression models for DNs of Band 2. The limits that were presented in Table 1 were used to determine the bounds of the DNs for each of the classes.
Figure 4 represents the water quality classifi cation model of Euphrates River in Iraq according to TDS classifi cations for irrigation use. The River in the satellite image is classifi ed into four colors: beige, represents the less salt; yellow, represents moderate salt; purple, represents high salt; and brown color, represents very high salt. It is noticed from the fi gure that purple and brown colors are more spread than beige and yellow colors. This result gives an estimation that the water in basin of Euphrates River in Iraq was classifi ed as high and very high salt during December, 2009. This model clarifi es that the water of Euphrates River inside Iraq upstream of Shinafi a station is appropriate for plants that resist salts because it is classifi ed as high salt (481–1440 ppm) in most places, whereas the water of the River downstream of Shinafi a station is appropriate only for plants that are highly resistance to salts because it is classifi ed as very high salt (1441–3200 ppm). The water quality of the River begins to improve downstream of Nahr Al-Is station because of mixing with water of Tigris River at these stations. Accordingly, the water quality classifi cation (based on TDS) of Euphrates River downstream of Nahr Al-Is station shows improvement.
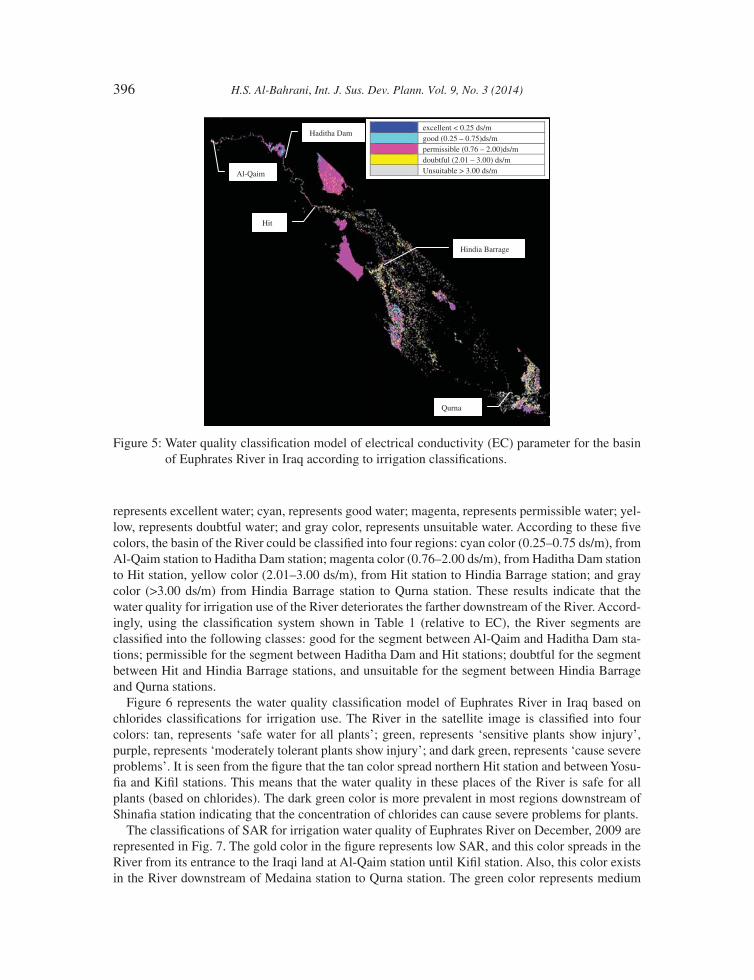
Figure 5 represents the water quality classifi cation model of Euphrates River in Iraq using EC classifi cations for irrigation use. The River in the satellite image is classifi ed into fi ve colors: blue,
0
500
1000
1500
2000
2500
3000
3500
4000
0102030405060
TD
S (m
g/L
)
Band 2
Figure 2: Scatter diagram of total dissolved solids (TDS) and digital numbers (DNs) in Band 2 for Euphrates River stations on September, 2009.
H.S. Al-Bahrani, Int. J. Sus. Dev. Plann. Vol. 9, No. 3 (2014) 395
Figure 3: Water areas for the basin of Euphrates River in Iraq mosaic satellite image.
Figure 4: Water quality classifi cation model of total dissolved solids (TDS) parameter for the basin of Euphrates River in Iraq according to irrigation classifi cations.
Less salt (0 – 160) ppm Moderate salt (161 – 480) ppm High salt (481 – 1440) ppm Very high salt (1441 – 3200)ppm
Shinafia
Nahr Al-Is
396 H.S. Al-Bahrani, Int. J. Sus. Dev. Plann. Vol. 9, No. 3 (2014)
represents excellent water; cyan, represents good water; magenta, represents permissible water; yel-low, represents doubtful water; and gray color, represents unsuitable water. According to these fi ve colors, the basin of the River could be classifi ed into four regions: cyan color (0.25–0.75 ds/m), from Al-Qaim station to Haditha Dam station; magenta color (0.76–2.00 ds/m), from Haditha Dam station to Hit station, yellow color (2.01–3.00 ds/m), from Hit station to Hindia Barrage station; and gray color (>3.00 ds/m) from Hindia Barrage station to Qurna station. These results indicate that the water quality for irrigation use of the River deteriorates the farther downstream of the River. Accord-ingly, using the classifi cation system shown in Table 1 (relative to EC), the River segments are classifi ed into the following classes: good for the segment between Al-Qaim and Haditha Dam sta-tions; permissible for the segment between Haditha Dam and Hit stations; doubtful for the segment between Hit and Hindia Barrage stations, and unsuitable for the segment between Hindia Barrage and Qurna stations.
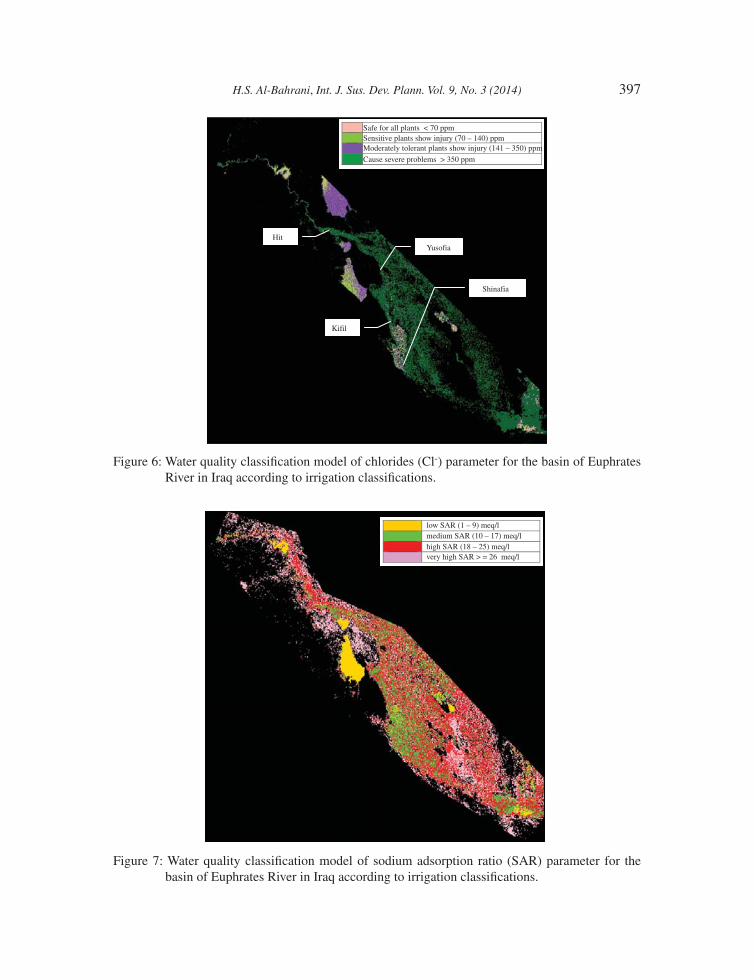
Figure 6 represents the water quality classifi cation model of Euphrates River in Iraq based on chlorides classifi cations for irrigation use. The River in the satellite image is classifi ed into four colors: tan, represents ‘safe water for all plants’; green, represents ‘sensitive plants show injury’, purple, represents ‘moderately tolerant plants show injury’; and dark green, represents ‘cause severe problems’. It is seen from the fi gure that the tan color spread northern Hit station and between Yosu-fi a and Kifi l stations. This means that the water quality in these places of the River is safe for all plants (based on chlorides). The dark green color is more prevalent in most regions downstream of Shinafi a station indicating that the concentration of chlorides can cause severe problems for plants.
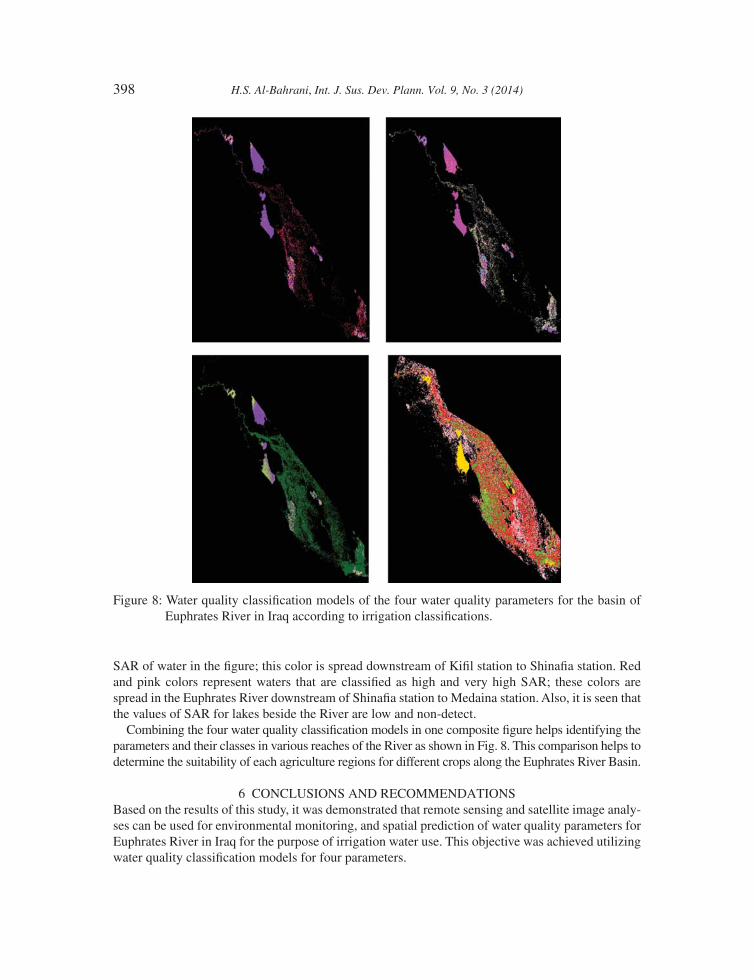
The classifi cations of SAR for irrigation water quality of Euphrates River on December, 2009 are represented in Fig. 7. The gold color in the fi gure represents low SAR, and this color spreads in the River from its entrance to the Iraqi land at Al-Qaim station until Kifi l station. Also, this color exists in the River downstream of Medaina station to Qurna station. The green color represents medium
excellent < 0.25 ds/m good (0.25 – 0.75)ds/m permissible (0.76 – 2.00)ds/m doubtful (2.01 – 3.00) ds/m Unsuitable > 3.00 ds/m
Qurna
Haditha Dam
Al-Qaim
Hit
Hindia Barrage
Figure 5: Water quality classifi cation model of electrical conductivity (EC) parameter for the basin of Euphrates River in Iraq according to irrigation classifi cations.
H.S. Al-Bahrani, Int. J. Sus. Dev. Plann. Vol. 9, No. 3 (2014) 397
Figure 6: Water quality classifi cation model of chlorides (Cl-) parameter for the basin of Euphrates River in Iraq according to irrigation classifi cations.
Safe for all plants < 70 ppm Sensitive plants show injury (70 – 140) ppm Moderately tolerant plants show injury (141 – 350) ppm
Cause severe problems > 350 ppm
Kifil
Yusofia
Shinafia
Hit
Figure 7: Water quality classifi cation model of sodium adsorption ratio (SAR) parameter for the basin of Euphrates River in Iraq according to irrigation classifi cations.
low SAR (1 – 9) meq/l medium SAR (10 – 17) meq/l high SAR (18 – 25) meq/l very high SAR > = 26 meq/l
398 H.S. Al-Bahrani, Int. J. Sus. Dev. Plann. Vol. 9, No. 3 (2014)
SAR of water in the fi gure; this color is spread downstream of Kifi l station to Shinafi a station. Red and pink colors represent waters that are classifi ed as high and very high SAR; these colors are spread in the Euphrates River downstream of Shinafi a station to Medaina station. Also, it is seen that the values of SAR for lakes beside the River are low and non-detect.
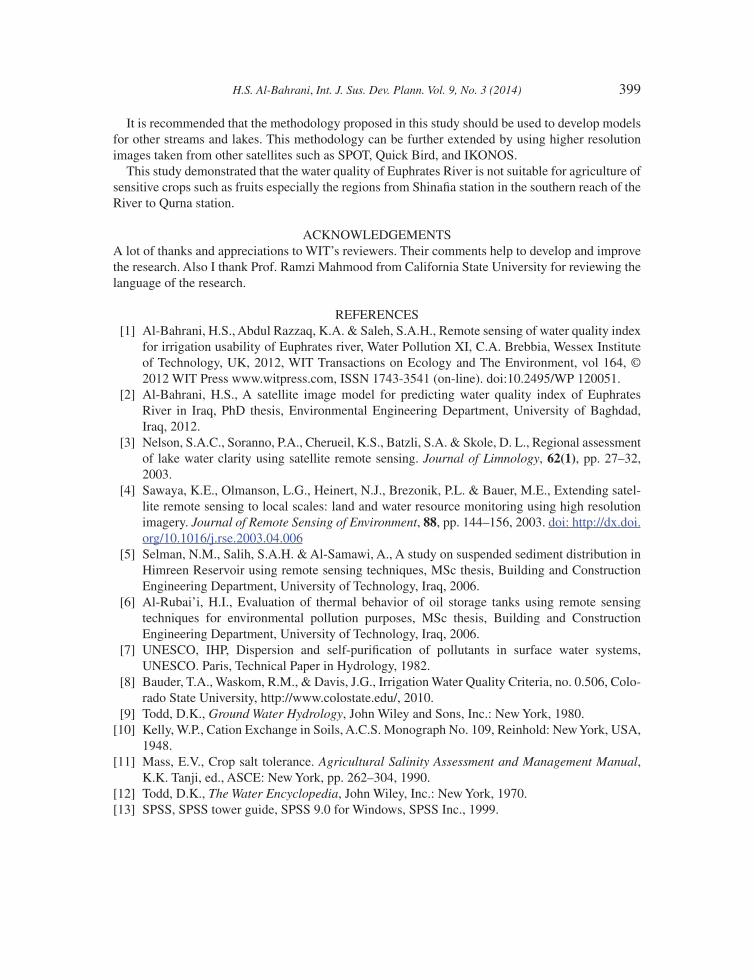
Combining the four water quality classifi cation models in one composite fi gure helps identifying the parameters and their classes in various reaches of the River as shown in Fig. 8. This comparison helps to determine the suitability of each agriculture regions for different crops along the Euphrates River Basin.
6 CONCLUSIONS AND RECOMMENDATIONSBased on the results of this study, it was demonstrated that remote sensing and satellite image analy-ses can be used for environmental monitoring, and spatial prediction of water quality parameters for Euphrates River in Iraq for the purpose of irrigation water use. This objective was achieved utilizing water quality classifi cation models for four parameters.
Figure 8: Water quality classifi cation models of the four water quality parameters for the basin of Euphrates River in Iraq according to irrigation classifi cations.
H.S. Al-Bahrani, Int. J. Sus. Dev. Plann. Vol. 9, No. 3 (2014) 399
It is recommended that the methodology proposed in this study should be used to develop models for other streams and lakes. This methodology can be further extended by using higher resolution images taken from other satellites such as SPOT, Quick Bird, and IKONOS.
This study demonstrated that the water quality of Euphrates River is not suitable for agriculture of sensitive crops such as fruits especially the regions from Shinafi a station in the southern reach of the River to Qurna station.
ACKNOWLEDGEMENTSA lot of thanks and appreciations to WIT’s reviewers. Their comments help to develop and improve the research. Also I thank Prof. Ramzi Mahmood from California State University for reviewing the language of the research.
REFERENCES[1] Al-Bahrani, H.S., Abdul Razzaq, K.A. & Saleh, S.A.H., Remote sensing of water quality index
for irrigation usability of Euphrates river, Water Pollution XI, C.A. Brebbia, Wessex Institute of Technology, UK, 2012, WIT Transactions on Ecology and The Environment, vol 164, © 2012 WIT Press www.witpress.com, ISSN 1743-3541 (on-line). doi:10.2495/WP 120051.
[2] Al-Bahrani, H.S., A satellite image model for predicting water quality index of Euphrates River in Iraq, PhD thesis, Environmental Engineering Department, University of Baghdad, Iraq, 2012.
[3] Nelson, S.A.C., Soranno, P.A., Cherueil, K.S., Batzli, S.A. & Skole, D. L., Regional assessment of lake water clarity using satellite remote sensing. Journal of Limnology, 62(1), pp. 27–32, 2003.
[4] Sawaya, K.E., Olmanson, L.G., Heinert, N.J., Brezonik, P.L. & Bauer, M.E., Extending satel-lite remote sensing to local scales: land and water resource monitoring using high resolution imagery. Journal of Remote Sensing of Environment, 88, pp. 144–156, 2003. doi: http://dx.doi.org/10.1016/j.rse.2003.04.006
[5] Selman, N.M., Salih, S.A.H. & Al-Samawi, A., A study on suspended sediment distribution in Himreen Reservoir using remote sensing techniques, MSc thesis, Building and Construction Engineering Department, University of Technology, Iraq, 2006.
[6] Al-Rubai’i, H.I., Evaluation of thermal behavior of oil storage tanks using remote sensing techniques for environmental pollution purposes, MSc thesis, Building and Construction Engineering Department, University of Technology, Iraq, 2006.
[7] UNESCO, IHP, Dispersion and self-purifi cation of pollutants in surface water systems, UNESCO. Paris, Technical Paper in Hydrology, 1982.
[8] Bauder, T.A., Waskom, R.M., & Davis, J.G., Irrigation Water Quality Criteria, no. 0.506, Colo-rado State University, http://www.colostate.edu/, 2010.
[9] Todd, D.K., Ground Water Hydrology, John Wiley and Sons, Inc.: New York, 1980.[10] Kelly, W.P., Cation Exchange in Soils, A.C.S. Monograph No. 109, Reinhold: New York, USA,
1948.[11] Mass, E.V., Crop salt tolerance. Agricultural Salinity Assessment and Management Manual,
K.K. Tanji, ed., ASCE: New York, pp. 262–304, 1990.[12] Todd, D.K., The Water Encyclopedia, John Wiley, Inc.: New York, 1970.[13] SPSS, SPSS tower guide, SPSS 9.0 for Windows, SPSS Inc., 1999.