
Spatial pattern in the abundance and structure of mollusc
12
Vol. 62: 109-120. 1990 1 l MARINE ECOLOGY PROGRESS SERIES Mar. Ecol. Prog. Ser. Published April 5 l Spatial pattern in the abundance and structure of mollusc populations in the soft sediments of a coral reef lagoon G. P. Jones', D. J. Ferrell", P. F. Sale"' School of Biological Sciences, University of Sydney, Sydney, 2006 NSW, Australia ABSTRACT. A hierarchical sampling programme, carried out during October 1985, encompassed 4 spatial scales: broad habitat zones of different depth and sebment composition; random 1 ha locations within zones; random 25 m2 sites within locations; and random 0.01 m2 air-lifted cores from each site. Of 69 species collected, we describe the patterns of distribution of the 10 most common. Spatial differences in their abundances were observed at all scales, but most of the variation (50 to 85 %) occurred at the broadest scale - between zones. Zones of peak abundance differed among species, some being most abundant in deep, fine-sediment habitats, e.g. Tellina cf. myaformis; some in deep, intermediate- sediment habitats, e.g. Exotica cf. virgulata and Pupa nitidula; others in shallow, coarse-sediments to the north, e.g. Tellina obtusalis, Umbonium guamensis; and still others in the shallow sediments to the south, e.g. Rhinoclavis aspera. In terms of population structure, tellinid bivalves reached greatest sizes in the coarse shallow zones. At the broadest scale, zones did not appear to represent homogeneous assemblages, due largely to a variable response of species to the environment at a location scale. Overall, specles richness tended to increase from fine to coarse sediment, except at the very shallow coarse sediments in the southern zone, where low numbers of species were found. INTRODUCTION A focus upon organisms either attached to, or moving over, hard substrata forms the basis of most of the ideas about the factors affecting abundance and diversity on coral reefs (see reviews by Sale 1980. Connell & Keough 1985, Huston 1985, Doherty & Williams 1988). However, lagoons and back-reef regions can be pre- dominantly made up of carbonate sands and gravel (Thomassin 1978). A cursory comparison between reefs and these uniform and superficially barren habitats might suggest that they are an unimportant part of the reef system. On the contrary, recent investigations into the biota of tropical soft sediments indicate abundant and diverse assemblages, including molluscs, crusta- ceans, echinoderms, polychaetes and nematodes (e.g. Present addresses: ' Department of Zoology, University of Auckland, Private Bag, Auckland, New Zealand " Fisheries Research Institute, PO Box 21, Cronulla, 2230 NSW, Australia "' Department of Zoology, University of New Hampshire, Durham, New Hampshire 03824, USA 8 Inter-Research/Printed in F. R. Germany Fishelson 197 1,Taylor 1971,McWilliam et al. 1981,Jones 1984, Suchanek & Colin 1986, Jacoby & Greenwood 1988). These invertebrates fall prey to a variety of teleost and elasmobranch fishes which forage over the sand (Alhelt 1981, Alheit & Scheibel 1982, Suchanek & Colin 1986, St John et al. 1989).These trophic interactions and the role played by soft sedimentsin coral reef systems are potentially important, yet poorly understood. General descriptions of species-habitat relationships in tropical soft sediments, and data on the abundances of broad and arbitrary categories, such as macrofauna or meiofauna, are readily available (e.g. Fishelson 1971, Thomassin et al. 1976, Thomassin 1978, Alheit 1981, Alheit & Scheibel 1982, Thomassin et al. 1982, Colin 1986, Grelet et al. 1987). However, a quantitative description of pattern is a necessary basis for assessing the importance of ecological processes which limit populations and structure assenlblages (Choat 1982, Andrew & Mapstone 1987). A quantitative approach has only recently been applied to tropical soft sediment communities (Hughes & Gamble 1977, Faubel 1984, Jones 1984, Suchanek & Colin 1986, Jacoby & Green- wood 1988, Riddle 1988). Molluscs may be the most
Transcript of Spatial pattern in the abundance and structure of mollusc
Vol. 62: 109-120. 1990 1 l
MARINE ECOLOGY PROGRESS SERIES Mar. Ecol. Prog. Ser.
Published April 5 l
Spatial pattern in the abundance and structure of mollusc populations in the soft sediments of a coral
reef lagoon
G. P. Jones', D. J. Ferrell", P. F. Sale"'
School of Biological Sciences, University of Sydney, Sydney, 2006 NSW, Australia
ABSTRACT. A hierarchical sampling programme, carried out during October 1985, encompassed 4 spatial scales: broad habitat zones of different depth and sebment composition; random 1 ha locations within zones; random 25 m2 sites within locations; and random 0.01 m2 air-lifted cores from each site. Of 69 species collected, we describe the patterns of distribution of the 10 most common. Spatial differences in their abundances were observed at all scales, but most of the variation (50 to 85 %) occurred at the broadest scale - between zones. Zones of peak abundance differed among species, some being most abundant in deep, fine-sediment habitats, e.g. Tellina cf. myaformis; some in deep, intermediate- sediment habitats, e.g. Exotica cf. virgulata and Pupa nitidula; others in shallow, coarse-sediments to the north, e.g. Tellina obtusalis, Umbonium guamensis; and still others in the shallow sediments to the south, e.g. Rhinoclavis aspera. In terms of population structure, tellinid bivalves reached greatest sizes in the coarse shallow zones. At the broadest scale, zones did not appear to represent homogeneous assemblages, due largely to a variable response of species to the environment at a location scale. Overall, specles richness tended to increase from fine to coarse sediment, except at the very shallow coarse sediments in the southern zone, where low numbers of species were found.
INTRODUCTION
A focus upon organisms either attached to, or moving over, hard substrata forms the basis of most of the ideas about the factors affecting abundance and diversity on coral reefs (see reviews by Sale 1980. Connell & Keough 1985, Huston 1985, Doherty & Williams 1988). However, lagoons and back-reef regions can be pre- dominantly made up of carbonate sands and gravel (Thomassin 1978). A cursory comparison between reefs and these uniform and superficially barren habitats might suggest that they are an unimportant part of the reef system. On the contrary, recent investigations into the biota of tropical soft sediments indicate abundant and diverse assemblages, including molluscs, crusta- ceans, echinoderms, polychaetes and nematodes (e.g.
Present addresses: ' Department of Zoology, University of Auckland, Private
Bag, Auckland, New Zealand " Fisheries Research Institute, PO Box 21, Cronulla, 2230
NSW, Australia " ' Department of Zoology, University of New Hampshire,
Durham, New Hampshire 03824, USA
8 Inter-Research/Printed in F. R. Germany
Fishelson 197 1, Taylor 1971, McWilliam et al. 1981, Jones 1984, Suchanek & Colin 1986, Jacoby & Greenwood 1988). These invertebrates fall prey to a variety of teleost and elasmobranch fishes which forage over the sand (Alhelt 1981, Alheit & Scheibel 1982, Suchanek & Colin 1986, St John et al. 1989). These trophic interactions and the role played by soft sedimentsin coral reef systems are potentially important, yet poorly understood.
General descriptions of species-habitat relationships in tropical soft sediments, and data on the abundances of broad and arbitrary categories, such as macrofauna or meiofauna, are readily available (e.g. Fishelson 1971, Thomassin et al. 1976, Thomassin 1978, Alheit 1981, Alheit & Scheibel 1982, Thomassin et al. 1982, Colin 1986, Grelet et al. 1987). However, a quantitative description of pattern is a necessary basis for assessing the importance of ecological processes which limit populations and structure assenlblages (Choat 1982, Andrew & Mapstone 1987). A quantitative approach has only recently been applied to tropical soft sediment communities (Hughes & Gamble 1977, Faubel 1984, Jones 1984, Suchanek & Colin 1986, Jacoby & Green- wood 1988, Riddle 1988). Molluscs may b e the most

110 Mar. Ecol. Prog. Ser. 62: 109-120, 1990
important group of invertebrates in these habitats, both in terms of biomass and as a source of food for teleosts. In contrast to the wealth of information on the distribu- tion and abundance of molluscs inhabiting soft-sedi- ments in temperate waters (see Gray 1974, 1981), there are few such studies on equivalent tropical species (but see Taylor 1971). Investigations into the ecological role played by molluscs must be founded upon fundamental information on the species present, their distribution and abundance and the relationship between abun- dance and features of the habitat.
The main aim of this investigation was to describe spatial patterns in the distribution, abundance and structure of mollusc populations inhabiting the soft sediments of One Tree Lagoon, Great Barrier Reef, Australia. Further, we wished to identify the spatial scales at which these populations respond to the lagoon environment as a preliminary step toward examining the impact of fish predation. The effects of changing the scale of focus, when describing patterns or identifying causal processes, is a major issue in contemporary ecology (see Ogden & Ebersole 1981, Dayton & Tegner 1984, Andrew & Mapstone 1987 for discussions relating to marine systems). An arbitrary decision to focus on any one scale could lead to a complete f d u r e to detect the patterns of most importance to the majority of the species. Given no prior information on these mollusc assemblages, we chose 4 scales, from a broad scale (10 km2) encompassing the major habitat zones within the lagoon, down to a fine scale (0.1 m2), represented by replicate cores. Quantifying the variance explained by each level in this hierarchy enabled us to identify the scales of most importance, in terms of the magnitude of changes in density and the size-structure of populations.
Spatial patterns in the structure of soft sediment assemblages in temperate regions have pnmarily been correlated with changes in depth and sediment charac- teristics (reviewed by Gray 1974, 1981, Whitlach 1981). Recent studies in tropical systems have detected the same sorts of trends (Jones 1984, Grelet et al. 1987). In view of this, sampling at the largest spatial scale was structured in relation to broad zones, distinguished on the basis of depth and sediment characteristics. In addition, measurements of depth and sediment grain size-frequency distributions were made at all sites sam- pled, to examine the numerical responses of individual species to these environmental factors at each scale.
METHODS
This study was carried out during October 1985 in the main lagoon of One Tree Reef, near the southern limit of the Great Banier Reef (23" 30' S, 152" 06' E). This lagoon is ca 10 km2 in area, and reaches a depth of 7 m. The
lagoon floor primarily consists of carbonate sediments, with the remainder being made up of isolated patch- reefs and reticulated reef structures. Sediments of dif- fering coarseness occur in almost concentric bands within the lagoon, with the coarse sand found in shallow water near the perimeter and the finest sediment in the deepest, central region (Davies et al. 1976, Johnstone et al. 1988). For the purposes of sampling, the lagoon was stratified into 5 zones, which could be distinguished on the basis of geographic location, depth and sediment characteristics (Fig. 1) . The North Shallow zone (NS) was characterized by relatively coarse sediments (> 250 pm) and reached a mean depth of 2.3 m. South Shallow (SS) had similar sediment composition, but only reached a mean depth of 0.6 m. The Central zone (CN), with an average depth of 3.5 m, was made up of relatively fine sediments (< 125 ,urn). North Deep (ND) and South Deep (SD) zones consisted of sedirnents of intermedate coarseness, the average depths being 2.8 m at South Deep and 4.2 m at North Deep.
A pilot survey was conducted at 2 locations in the North deep zone to ascertain to what depth sediment cores needed to be taken to sample molluscs. We wished to determine the appropriate sample unit size necessary to obtain a level of precision of 0.15 given 4 replicate cores. This was obtained following the pro- cedures suggested by Andrew & Mapstone (1988). The abundances of common molluscs were compared by means of circular cores taken at depths of 5 and 10 cm. We found no significant dfferences in estimates of mean density for any of the common species, therefore the 5 cm depth was considered adequate to sample these sub-surface dwelling species. In the shallow zones, the 5 cm layer of sediment was often the full extent of soft substratum above a compacted rubble layer. Two core sizes were examined, 0.03 and 0.06 m2. The data suggested that a core size slightly larger than 0.06 m2 was necessary to achieve the desired precision for the more abundant species. A core size of 0.1 m2 allowed us to obtain this precision but we recognized that t h s may have been too small to get meaningful estimates for rarer species. A comparison of the pro- portions of molluscs collected in nested 3, 2 and 1 mm sieves, indicated that the finest sieve was necessary to retain the smallest size classes. This mesh should retain more than the 1.4 mm mesh recommended by Thomas- sin (1978) for tropical soft sediments.
A hierarchical sampling design was employed to describe spatial patterns in abundance at 4 scales (Fig. 2). We compared differences between: (1) Broad habitat zones, together encompassing most of a 10 km2 lagoon (see Fig. 1). (2) Random 10 000 m2 locations urlthjn zones, 100 to 1000 m apart. (3) Random 25 m2 sites within locations. (4) Random 0.1 m2 cores within sites. A second pilot survey was conducted to deter-

Jones et al.: Spatial pattern of mollusc populations 111
Fig. 1. Map showing the 5 lagoon zones and locations ( A to 0). Surrounding graphs show the mean sedment grain size composition for the 5 zones. Proportions are based on
weight In each of the 1 @ classes
r.. NORTH DEEP
mine both the total number of samples which could be collected and sorted within a 2 wk period, and the best way to allocate this effort among sites and locations. During May 1985, we sampled 2 zones, 2 locations, and 3 sites, with 4 replicates from each. This indicated that we could process ca 120 cores in the time available. It also showed that zones explained much more of the variance present than the lower levels. By sampling 3 locations and 2 sites within each location, the 120 replicates were distributed in such a way as to put maximum effort into the levels where most of the varia- tion occurred, while maximizing the power of the test for differences among zones (procedures recom- mended by Underwood 1981) (Fig. 2).
The 4 replicate 0.1 m* cores from each site were collected using a diver-operated air lift attached to a SCUBA cylinder (Thomassin 1978). The sediment was deposited in nylon bags with a 1 mm mesh diameter. All living macrofauna were fixed in formaldehyde and simultaneously stained with Beibrich scarlet, to enhance visibility for sorting. All molluscs were extracted from the sediment, identified to species level and counted. Selected abundant species were also measured: bivalves - Tellina robusta, T, cf. myaformis, Exotica rhomboides, E. cf. virgulata, Fragum fragum and Fragum sp.; gastropods - Umbonium guamensis, Rhinoclavis aspera and Pupa nitidula. A complete check-list of molluscan fauna from this sampling pro- gramme appears in Table 1.
At each site, depth was measured at low tide and two
> l r NORTH SHALLOW
o r r SOUTH DEEP ' , , V >I v?'. ,:c :LASS ".,,
--
SCALE
50 m1 jars of sediment were collected from random positions. These samples were processed to quantify structure following the methods outlined by Folk (1974) for carbonate sediments. Samples, which were stored in ethanol, were first dried to a constant weight (ca 7 d at 60°C) and then wet-sieved through a 63 pm screen to remove the silt fraction. The collected sand sample was dried, re-weighed and separated into fractions with 1 4 intervals by shaking for 10 min on a geological sieve shaker. Each fraction was then weighed separately to measure the proportion of sediment in 6 size categories.
RESULTS
Taxonomic composition
The mollusc assemblage on One Tree Lagoon was found to be rich in species, with a total of 69 species dis- tributed among 27 families recorded in the pilot and main surveys (Table 1). The most speciose families were the bivalve family Tellinidae (8 species), and the gastropod families Cerithiidae (7 species) and Naticidae (7 species).
In terms of the numbers of individuals, the assemblage was dominated by 5 tellinid bivalves, including Tellina robusta, T. obtusalis, T. cf. myaformis, Exotica rhom- boides and E. cf. virgulata, the cardiid Fragum sp., and 4 gastropods in separate families - Pupa nitidula (Actaeonidae), Rhinoclavis aspera (Cerithiidae), Umbonium guarnensis (Trochidae) and Atys cylindricus
ZONES Nonh Snallow Nonh Deep South Deep South Shallow
Fig. 2. Hierarchical sampling programme """l /h /h shbwing the main sampling levels and rela- \=IONS D E F G H I J K L M N O
tionshlps between them Four replicate cores A A A A A A A A A A A A ;!TE, 1 7 3 4 5 6 7 8 Q 1 0 1 1 I 2 1 3 1 4 ~ 5 ~ 6 1 7 1 8 1 9 m 2 1 2 2 n 2 i 2 5 Z % 2 1 2 8 2 9 3 0
were taken at each site

112 Mar. Ecol. Prog Ser. 62: 109-120, 1990
Table 1. Molluscs found in sediments of One Tree Lagoon, Great Barrier Reef
GASTROPODA ARCHAEOGASTROPODA
Trochidae Chrysostoma paradoxum (Born, 1780) Mesoclanculus sp. Umbonium guamensis (Quoy & Gaimard, 1834)
Neritidae Nerita sp.
MESOGASTROPODA Cerithiidae
Cer ihum alveolus Hombron & Jacquinot, 1854 Cerithium columna Sowerby, 1834 Cerithum sp. Clypeomorus zonatus Wood, 1828 Rhinoclavis aspera (Linne, 1758) Rhinoclavis fasciata (Brugiere, 1792) Rhinoclavis vertagus Lnne, 1758
Eulimidae Eulima sp.
Strombidae Strombus gibberulus (Linne, 1758) Strombus luhuanus Linn6, 1758 Terebellum terebellum (Linne, 1758)
Naticidae Natica bougei Sowerby, 1908 Natica gualteriana Recluz, 1844 Natica onca (Roding, 1798) Natica sp. 1 Natica Sp. 2 Polinices flemingiana (Recluz. 1844) Polinices turnidus (Swainson, 1840)
NEOGASTROPODA Pyrenidae
~Mitrella ligula (Duclos, 1840)
Nassariidae Nassarius albescens (Dunker, 1846) Nassarius ecstilbus (Melvill & Standen, 1896) Nassarius shacklefordi (Melvill & Standen, 1896) Nassanus spendidulus (Dunker, 1846)
Olividae Amalda c f . edithae (Pritchard & Gatliff, 1899) Olivella sp.
Volutidae Amoria rnaculata Swainson, 1822 Cymbiolacca pulchra Sowerby, X825
Marginellidae Granula sp.
Turridae Clavus leforestien (Hervier, 1896) Eucithara delacouriana (Crosse, 1896) Eucithara funiculata (Reeve. 1846) Lophiotoma acuta (Perry, 181 1)
Conidae Conus spectrum (Linne, 1738)
ENTOMOTAENIATA Pyramidellidae
Pyramidella acus (Gmelin, 1791) CEPHALASPIDEA
Acteonidae Pupa alveola (Souverbie, 1863) Pupa nitidula (Lamarck, 1916) Pupa solidula (Linne, 1758) Pupa sulcata (Gmelin, 1791)
Scaphandridae Tornatina sandwichensis Pease, 1860 Tornatina sp.
Atyidae Atys cylindricus (Helbing, 1779)
BASOMMATOPHORA Ellobiidae
Allochroa layardi ( H . & A. Adams, 1855)
BIVALVIA SOLEMYOIDA
Solemyidae Solem ya sp.
MYTILOIDA Limidae
hmidae sp.
VENEROIDA Lucinidae
Anodontia (Cavatidens) ornissa (Iredale, 1930) Unidentified sp. 1
Kelliidae Kellia sp.
Cardiidae Fragum fragum (Linne. 1758) Fragum sp. Ful via radiata
Mesodesmatidae Ervillea sp.
Tellinidae Exotica (Loxoglypta) rhomboides (Quoy &
Galmard, 1834) Exotica c.f. virgulata (Hanley. 1845) Telhna robusta (Hanley, 1844) Tellina (Cadella) obtusalis Destayes, 1845 TelLina (Abranda) cf. myaform~s Sowerby, 1868 Tellina (Scissulina) dlspar (Conrad, 1837) Tellina (Quadrans) parvitas (Iredale, 1937) Tellina (Cadella) semen (Hanley, 1844)
Semelidae Semele sp.
Veneridae Dosinia extranea (Iredale, 1937) Lioconcha ornata (Lamarck, 1817) Timocla (Glycydonta) marica (Linnaeus, 1758) Calbsta (Callista) semisulcata (Sowerby, 1857) Circe c f . scnpta (Linne. 1758)
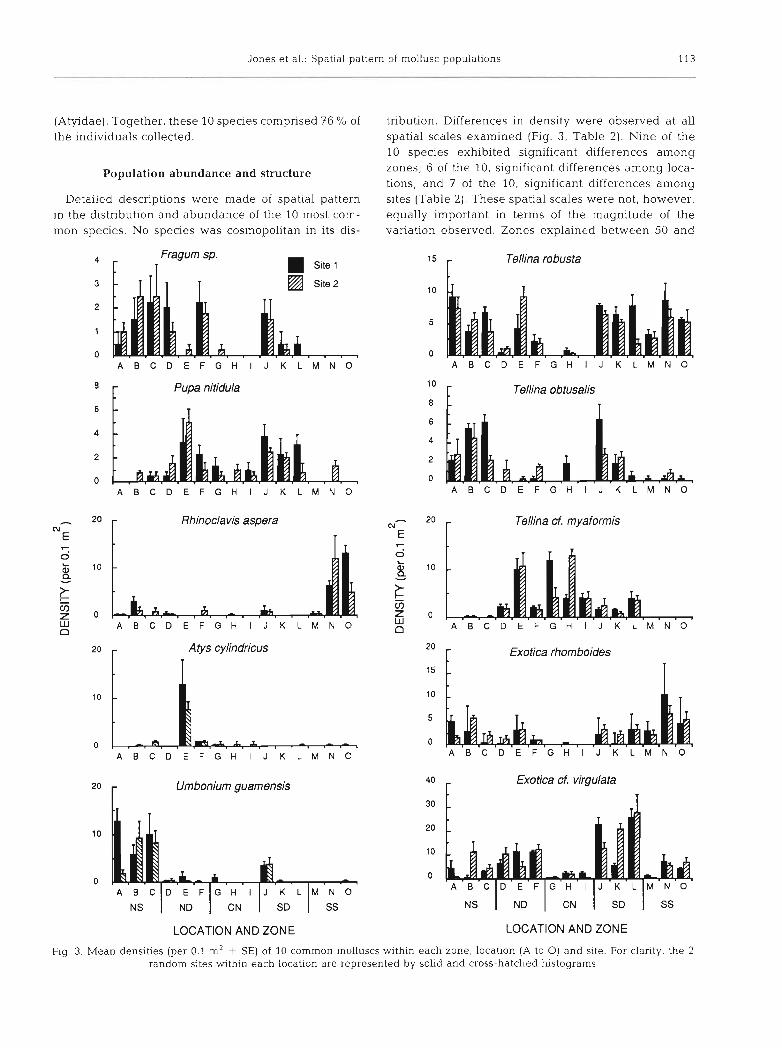
Jones et al.: Spatial pattern of mollusc populations 113
(Atyidae). Together, these 10 species comprised 76 % of tnbution. Differences in density were observed at all the individuals collected. spatial scales examined (Fig. 3, Table 2 ) . Nine of the
10 species exhibited significant differences among
Population abundance and structure zones; 6 of the 10, significant differences among loca- tions; and 7 of the 10, significant differences among
Detailed descriptions were made of spatial pattern sites (Table 2 ) . These spatial scales were not, however, in the distribution and abundance of the 10 most corn- equally important in terms of the magnitude of the mon species. No species was cosmopolitan in its dis- variation observed. Zones explained between 50 and
4 15 Tellina robusta
3 10
2
5 1
0 0 A B C D E F G H I J K L M N O A B C D E F G H I J K L M N O
Pupa nitidula l0 C Tellina obtusalis
6 8
6 4
4
2 2
0 0 A B C D E F G H I J K L M N O A B C D E F G H I J K L M N O
Rhinoclavis aspera Tellina cf. myaformis
7 7
0 0 10
L
k e, 10 a U
1 m m Z 0 z 0 W A B C D E F G H I J K L M N O W n n A B C D E F G H I J K L M N O
20 r A tys cylindricus 20 r Exotica rhomboides 15
10
5
0 l0 0 A B C D E F G H I J K L M N O 0 A B C D E F G H I J K L M N O
20 r Umbonium guarnensis I Exotica cf. virgulata
A B C D E F G H I J K L M N O n D
NS I ND I CN I SD I SS NS
LOCATION AND ZONE LOCATION AND ZONE
Flg 3. Mean densities (per 0.1 m2 t SE) of 10 common molluscs within each zone, location (A to 0) and site. For clarity, the 2 random sites within each location are represented by solid and cross-hatched histograms

114 Mar. Ecol. Prog. Ser. 62: 109-120, 1990
85 % of the variation in numbers for all species except tion in numbers declines fairly dramatically with Atys cylindncus. A. cylindncus exhibited a location decreasing scales of focus between zones and sites. effect only, and locations explained 72 of the var- There were substantial differences among species in iance observed (Table 2). Excluding A. cylindricus, their distributions among zones (Fig. 3). The 5 com- locations explained an average of 16% of the var- mon tellinids each showed a unique pattern. Tellina iance, sites 7 % and replicates 15 O h . Hence, the varia- robusta was the most widespread, being abundant in
Table 2. Analyses of variance of abundance for 10 species of mollusc in One Tree Reef lagoon. All data were transformed for F-ratios but untranslormed data were used for calculation of percent variance explained at each level. Cochran's value denoting significant heterogeneity of variances for these samples = 0.16. Degrees of freedom for each F-ratio shown in
parentheses. 'p <0.05. Percentage variance explained, calculated as descr~bed by Underwood (1981)
Species Cochran's Percent variance explained value Zone LOC. Site Zone LOC. Site Rep
(4, 10) (10, 15) (15, 90)
Tellina robusta 0.11 7. obtusalis 0.20 T. cf. myaformis 0.12 Exotica rhomboides 0.18 E. cf. virgulata 0.16 Fragum sp. 0.16 Pupa nitidula 0.22 Atys cylindricus 0.57 Rtunoclavis aspera 0.47 Umbonium guamensis 0.24
Exotica rhomboides Tellina robusta
SIZE CLASS (mm)
Exotica cf. v;rgulata
"Or NORTH SHALLOW
NORTH DEEP
SOUTH DEEP
SOUTH SHALLOW
n=99
Flg 4 . Percent frequency of indlvlduals, in 1 mm slze classes, for 3 tellinld b~valve species collected from 4 zones - Uorth Shallow, North Deep, South Deep and South Shallow. Low numbers of these spec-les In the Centre zone prc~ludes any comparison

Jones et al.: Spatial pattern of mollusc populations 115
all zones except the centre, where T. cf. myaformis dominated. T. obtusalis was most common in NS and Exotica rhomboides at SS, with E. cf. virgulata reach- ing peak abundances in the deeper channels of ND and SD. Of the other species examined, Fragum sp. and Umbonium guamensis were most abundant at NS, Rhinoclavis aspera at SS, and Pupa nitidula at ND and SD. Nearly all the Atys cylindricus at counted were confined to one location in the ND channel.
There were also consistent patterns among species in population size-structure (Fig. 4). The tellinid bi- valves common to the shallow and deep zones of the northern and southern halves of the lagoon, all reached larger sizes in the south shallow zone. The other species were too restricted in their distributions to detect such patterns, although location and site differences in population structure appeared to be common.
0 2 N2
L P A A
Fig. 5. Canonical discriminant analysis for v maximal separation of sampling locations ( A to 0) and sites ( l , 2) based on the abundan-
I I I I I I I I I ces of the 10 common molluscs plotted in Fig. -4 -3 -2 - 1 0 1 2 3 4 3. Canonical variate 1 (x-axis) vs canonical
CANONICAL VARIATE 1 variate 2 (y-axis) (see Willianls 1983). North Shallow (0); North Deep (X); Centre ( m ) ;
Fine 4 Sedirnents t Coarse South Deep (v); South Shallow (A)
Table 3. Pearson's correlation matrix between pairs of species, In terms of mean abundance for the 30 sites. Species were: (7. r.) Tellina robusta; (T, 0.1 T obtusalis; (T. m,) T. cf. myaformis; (E. r.) Exotica rhomboides; (E. v.) E. cf. virgulata; (F. sp.) Fragum sp.; (P. n.) Pupa nitidula; (A. C.) Atys cylindricus; (R. a.) Rhinoclavis aspera; and (U. g.) Umbonium guamensis. Correlations shown in
boldface are significant at p = 0.05 level for single paired comparisons
Species T. I-. 7. 0. 7. m. E. r. E. v. F. sp. P. n. A. c. R. a.
T 0. T m. E. r. E v. F sp. P. n. A. c. R. a. U. g.
116 Mar. Ecol. Prog. Ser 62. 109-120, I990
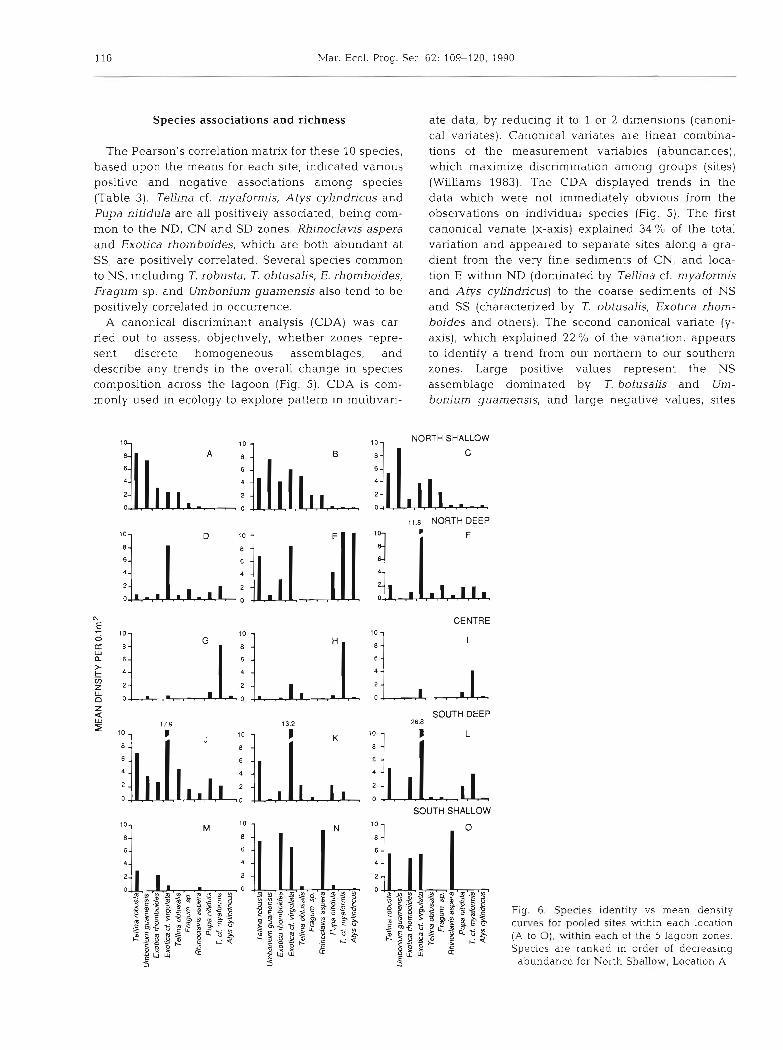
Species associations and richness
The Pearson's correIation matrix for these 10 species, based upon the means for each site, indicated various positive and negative associations among species (Table 3). Tellina cf. myaformis, Atys cylindricus and Pupa nitidula are all positively associated, being com- mon to the ND, CN and SD zones. Rhinoclavis aspera and Exotica rhomboides, which are both abundant at SS, are posihvely correlated. Several species common to NS, including T. robusta, T. obtusalis, E. rhomboides, Fragum sp. and Umbonium guamensis also tend to be positively correlated in occurrence.
A canonical discriminant analysis (CDA) was car- ried out to assess, objectively, whether zones repre- sent discrete homogeneous assemblages, and describe any trends in the overall change in species composition across the lagoon (Fig. 5). CDA is com- monly used in ecology to explore pattern in multivari-
ate data, by reducing it to 1 or 2 d~mensions (canoni- cal variates). Canonical variates are Linear combina- tions of the measurement variables (abundances), which maximize discrimination among groups (sites) (Williams 1983). The CDA displayed trends in the data which were not immediately obvious from the observations on individual species (Fig. 5). The first canonical variate (x-axis) explained 34 % of the total variation and appeared to separate sites along a gra- dient from the very fine sediments of CN, and loca- tion E within ND (dominated by Tellina cf. myaformis and Atys cylindricus) to the coarse sediments of NS and SS (characterized by T. obtusalis, Exotica rhom- boides and others). The second canonical variate (y- axis), which explained 22 O/O of the variation, appears to identify a trend from our northern to our southern zones. Large positive values represent the NS assemblage dominated by T. botusalis and Um- bonium guamensis, and large negative values, sites
10- rn , 10, NORTH SHALLOW
11.8 NORTH DEEP
N E CENTRE
SOUTH DEEP 268
SOUTH SHALLOW
Fig. 6. Species identity vs mean density curves for pooled sites within each location ( A to 0), within each of the 5 lagoon zones Species are ranked in order of decreasing
abundance for North Shallow, Location A
Jones et al .- Spatial pattc ,rn of mollusc populations 117
dominated by E. cf, virgulata in SD and Rhinoclavis aspera at SS.
On the basis of these 2 trends, detected by the CDA, zones were separated in terms of their compo- sition, and sites within locations were very similar (Fig. 5). The degree of separation of locations was variable, but somewhat intermediate between zones and sites. Only the NS and CN zones appeared to represent homogeneous assemblages. All locations at NS were dominated by a diverse assemblage includ- ing Tellina robusta, T. obtusahs, Exotica rhornboides, E. cf. virgulata, Fragum sp. and the gastropod Umbonium guanensis (Fig. 6 ) . A single species, Tel- lina cf, n~yaformis, dominated all locations at the Centre (Fig. 6).
For the other 3 zones, locations did not fall into well defined groupings (Fig. 5). The precise differ- ences upon which locations were separated, are best viewed by examining species versus abundance plots for each location in these zones (Fig. 6). In ND, for example, location E differed substantially from D and F due to the presence of high densities of Tellina cf. myaformis and Atys cylindricus. Exotica rhomboides was the only species abundant at all locations. In SS, 2 nearby locations, N and 0, were nearly identical, being dominated by the gastropod Rhinoclavis aspera and the 3 tellinids T. robusta, E. rhomboides and E. cf. virgulata. The other location, M, was extremely depauperate by comparison. The reasons for these location differences are not clear, but they may repre- sent long-shore trends in species composition. Loca- tion E was quite distant from the other 2 in the ND zone, and was the only area covered in a thin mat of algae.
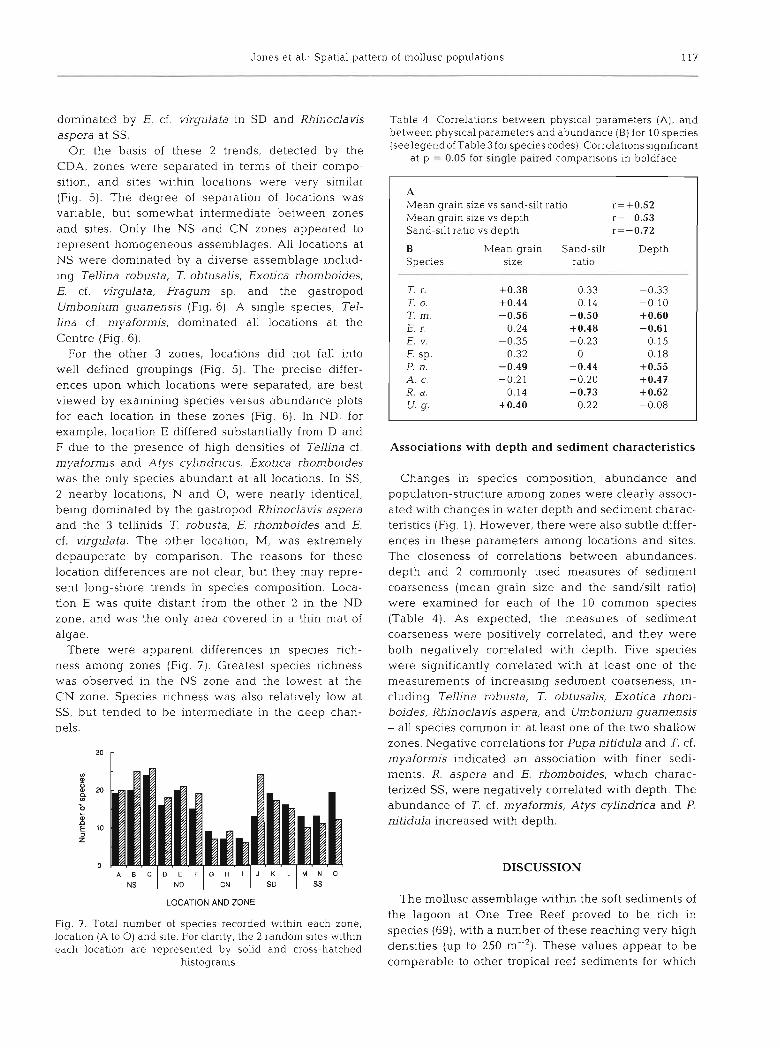
There were apparent differences in species rich- ness among zones (Fig. ?). Greatest species rlchness was observed in the NS zone and the lowest at the CN zone. Species richness was also relatively low at SS, but tended to be intermediate in the deep chan- nels.
LOCATION AND ZONE
Fig. 7. Total number of specles recorded wlthin each zone. locatlon (A to 0) and site. For clarity, the 2 random sites within each localon are represented by solid and cross-hatched
histograms
Table 4 Correlations between physical parameters (A) , and between phys~cal parameters and abundance (B) for 10 species (seelegend of Table 3 for species codes) Correlations significant
at p - 0 05 for slngle palred comparisons in boldface
A Mean grain size vs sand-silt ratio r= +0.52 h4ean grain slze vs depth K=-0.53 Sand-silt rat10 vs depth r=-0.72
B Mean grain Sand-silt Depth Species size r a l o
-
T. r. +0.38 0 33 -0.33 T. 0. +0.44 0 14 -0 10 T. n ~ . -0.56 -0.50 +0.60 E, r. 0.24 +0.48 -0.61 E, v. -0.35 -0.23 0.15 F. sp. 0.32 0 0.18 P. n. -0.49 -0.44 +OS5 A. C. -0.21 -0.20 +0.47 R. a . 0.14 +0.73 +0.62 U. g. +0.40 0.22 -0.08
Associations with depth and sediment characteristics
Changes in species composition, abundance and population-structure among zones were clearly assocl- ated with changes in water depth and sediment charac- teristics (Fig. 1). However, there were also subtle differ- ences in these parameters among locations and sites. The closeness of correlations between abundances, depth and 2 commonly used measures of sediment coarseness (mean grain size and the sand/silt ratio) were examined for each of the 10 common species (Table 4 ) . As expected, the measures of sediment coarseness were positively correlated, and they were both negatively correlated with depth. Five species were significantly correlated with at least one of the measurements of increasing sediment coarseness, in- cluding Tellina robusta, T. obtusahs, Exotica rhonl- boides, Rhinoclavis aspera, and Umbonium guamensis - all species common in at least one of the two shallow zones. Negative correlations for Pupa nitidula and T. cf. myaformis indicated an association with finer sedi- ments. R. aspera and E. rhomboides, which charac- terized SS, were negatively correlated with depth. The abundance of T. cf. myaformis, Atys cylindnca and P. nitidula increased with depth.
DISCUSSION
The mollusc assemblage within the soft sedments of the lagoon at One Tree Reef proved to be rich in species (69), wlth a number of these reaching very high densities (up to 250 rnp2). These values appear to be comparable to other tropical reef sediments for which

118 Mar. Ecol. Prog. Ser.
numerical data have been published (Taylor 197 l , Sal- vat 1972). Unfortunately, since the review by Thomas- sin (1978), little quantitative work has been done on these assemblages.
The abundances of marine organisms are charac- teristically variable at a number of spatial scales (Andrew & Mapstone 1987). Frequently, quantitative sampling programmes are inadequate to distinguish one scale of variability from another (Hurlbert 1984). Such confusion can lead to incorrect conclusions about processes structuring communities, and cause avoid- able debate over issues which are scale dependent (e.g. Ogden & Ebersole 1981, Sale & Douglas 1984). The hierarchical survey employed in this study pro- vided a clear method of distinguishing variability among strata at progressively larger scales from the variation within these strata at each level (Underwood 1981, Andrew & Mapstone 1987). Such nested designs have been used effectively in detecting the scale at which species respond to their environment in a number of ecological surveys (e.g. Caffey 1985, Choat & Bellwood 1985, Phillips & Fleeger 1985).
In terms of changes in abundance and species com- position, the most dramatic changes occurred at the largest scale examined (between habitat zones). This scale accounted for between 50 and 85 % of the varia- tion in abundance, for all but one species examined. There was moderate variation on a n intermediate scale (among broadly spaced 1 ha locations within zones), and considerably less variation within locations (among sites within locations). This suggests that the most important factors affecting the distribution and abun- dance of this fauna operate on a relatively broad spatial scale in this lagoon.
It was not possible to directly attribute the large scale variation of features of the habitat (habitats were not replicated). Depth and sediment type are clearly associated with abundance patterns in this system, however any causal effects on species distributions would have to be assessed experimentally. This is a recumng feature of mollusc communities, whether arc- tic (e.g. Carey et al. 1984), temperate (e.g. Richter & Sarnthein 1977. Oliver et al. 1980) or troplcal (e .g . Taylor 1971, Thomassin et al. 1982, Grelet et al. 1987). Although not necessarily causative factors in them- selves, depth and sediment are clearly correlated with the factors responsible for determining species dis- tributions. Species-specific settlement preferences, either for different sediment types, for different depths or other unknown but correlated factors, are an obvious potential mechanism causing the observed distribu- tions (Gray 1974). Experimental sediment transplants, such as that camed out by Richter & Sarnthein (1977) in the Wadden Sea, may be the only way to separate these factors, in terms of their relative importance.
Changes in depth and sediment composition usually relate to changes in a host of other physlcal factors (e.g. water movement, oxygen supply, nutrients) (Richter &
Sarnthein 1977, Johnstone et al. 1988). These in turn may affect a range of biological factors, such as the accumulation of detritus, productivity and microbial activity; physical factors may mediate disturbance or predator effects, whether by epibenthic organisms (e .g . Commito 1982, Arnold 1984) or fish (Van Blaricom 1982, Jones et al. 1988). The scales at which all these potentially important variables operate need to be con- sidered before meaningful experiments can be designed to examine their impact. Those factors exhibiting recognizable patterns in their intensity at larger scales would be primary targets for future re- search.
This study was conceived primarily as a basis for a future assessment of the role soft-sediment molluscs play in coral-reef food-chains. Although potential epibenthic predators, such as crabs and naticid gastro- pods, were frequently encountered in samples, num- bers were too low to get a clear idea of their patterns of distribution. It has been suggested that naticids play an important role as predators in other tropical soft sedi- ment areas (Berry 1982). Spatial variation in the abun- dance and feeding intensity of teleosts known to con- sume soft sediment molluscs have been investigated at One Tree Reef (Jones et al. 1988, unpubl.). These studies showed that there was considerable variation in teleost feeding pressure, on both zone and location scales, but little evidence of a major impact of teleosts on prey numbers, either in shallow or deep regions of the lagoon.
Species-specific patterns of change in abundance at progressively larger scales, lead to fairly predictable species groupings in some zones. However, zones do not appear to be homogeneous assemblages in terms of their biotic structure. Considerable variability in species composition was apparent, from location to location, due to the patterns exhibited by some species (e.g. Atys cylindricus was common at one location only). Trends in species richness across the lagoon may also reflect responses of individual species. Increasing species richness in relation to increasing sediment coarseness is a recurring pattern in soft sediment com- munities (see Gray 1974). Our finding of low diversity In the fine sediments of the centre of the lagoon, and high diversity in the coarse sediments of the northern periphery, is consistent with this. However, low species numbers in the coarse, shallow sediments to the south would not be expected on the basis of this generaliza- tion.
This paper presents a static pict.ure of the abundance and structure of mollusc populations in One Tree Lagoon. The obvious extension of this study, an exami-

Jones et al . . Spatial pattern of mollusc populations 119
nation of whether the patterns present at each scale remain coherent over time, is currently under way (Jones et al. unpubl.). However, the large-scale trends in species and sediment composition across the lagoon are sufficient to suggest a number of testable hypotheses about processes important In tropical soft sediment systems. This is a first step in an understand- ing of the relationship between these poorly known communities and the adjacent coral reefs.
Acknowledgements. We thank K. Lamprell, B. Long, W. Pon- der and G. &chard for helping us identify difficult species. We also thank the following people who spent many hours help- ing us collect and process the samples. P. Butcher, C. Hay- ward, L. Howitt, U. Kaly, D. Lizka, D. Meadows, M. Milicich, M. Norman, and P. Smith. The manuscript was improved by comments from N. Andrew. R. Cole, L. Howitt, B. McArdle, A. Jones, G. Skilleter and L. Stocker. This research was sup- ported by a Marine Sciences and Technologies Grant, and is a contribution from the University of Sydney's One Tree Island Field Station.
LITERATURE CITED
Alheit, J. (1981). Feeding interactions between coral reef fishes and the zoobenthos. Proc. 4th int. Coral Reef Symp., Manila 2: 545-552
Alheit, J., Scheibel, W. (1982). Benthic harpacticoids as a food source for fish. Mar. Biol. 70: 141-147
Andrew, N. L. , Mapstone, B. D. (1987). Sampling and the description of spatial pattern in marine ecology. Oceanogr. mar. Biol. A. Rev. 25: 39-90
Arnold, W S. (1984). The effects of prey size, predator size, and sediment composition on the rate of predation of the blue crab, Caltinectes sapidus Rathbun, on the hard clam, Mercenaria mercenaria (Linne). J. exp. mar Biol. Ecol. 80: 207-2 19
Berry, A. J. (1982). Predation by Natica maculosa Lamarck (Naticidae: Gastropoda) upon the trochacean gastropod Ulnbonjum vesharum (L.) on a Malaysian shore. J. exp. mar. Biol. Ecol. 64: 71-89
Caffey, H. M. (1985). Spabal and temporal variation in settle- ment and recru~tment of intertidal barnacles. Ecol. Monogr. 55: 313-332
Carey, A. G. Jr , Scott, P. H., Walters, K. R. (1984). Distributional ecology of shallow southwestern Beaufort Sea (Arctic Ocean) bivalve Mollusca. Mar. Ecol. Prog. Ser. 17: 125-134
Choat, J . H. (1982). Fish feeding and the structure benthic com- munitiesin temperate waters. A. Rev. Ecol. Syst. 13: 423-449
Choat, J. H., Bellwood, D. R. (1985). Interactions amongst herbivorous fishes on a coral reef: influence of spatial variation. Mar. Blol. 89: 221-234
Colin, P. L. (1986). Benthic community distribution in the Enewetak Atoll lagoon. Marshal1 Islands. Bull. mar. Sci. 38: 129-143
Commito, J. A. (1982). Effects of Lunatia heros predation on the population dynamics of Mya arenana and Macoma balthica in Maine, USA. Mar. Biol. 69: 187-193
Connell, J . H., Keough, M J . (1985). Disturbance and patch dynamics of subtidal marine animals on hard substrata. In: Pickett, S. T A.. White, P. S . (eds.) The ecology of natural disturbance and patch dynamics. Academic Press, New York, p. 101-124
Davies, P. J . , Radke, B. M., Robison, C. R. (1976). The evolu- tion of One Tree Reef, southern Great Barrier Reef, Queensland. BMR J. Aust. Geol. Geophys. 1 . 231-240
Dayton, P. K . , Tegner, M. J. (1984). The importance of scale in community ecology: a kelp forest example with terrestrial analogs. In: Price, P. W. , Slobodchikoff, C. N., Gaud, W. S. (eds.) A new ecology: novel approaches to interactive systems. Wiley. New York, p. 457-481
Doherty, P. J., Williams, D. McB. (1988). The replenishment of coral reef fish populations. Oceangr. mar. biol. A. Rev.. 26: 487-551
Faubel, A. (1984). On the abundance and activity pattern of zoobenthos inhabiting a tropical reef area, Cebu, Philippi- nes Coral Reefs 3: 205-213
Fishelson, L. (1971). Ecology and distribution of the benthic fauna in the shallow waters of the Red Sea. Mar. Biol. 10: 113-133
Folk, R. L. (1974). Petrology of sedimentary rocks. Hemphill, Austin
Gray. J. S. (1974). Animal-sediment relationships. Oceanogr. mar. biol. A. Rev. 12: 223-261
Gray, J. S. (1981). The ecology of marine sediments. Cam- bridge University Press, Cambridge
Grelet, Y., Falconetti, C., Thomassin, B. A., Vitiello, P . , Abu Hdal, A. H. (1987). Distribution of the macro- and meiobenthic assemblages in the littoral soft-bottoms of the Gulf of Aqaba (Jordan). Atoll Res. Bull. 308: 1-14
Hughes, R. N., Gamble, J . C . (1977). A quantitative survey of the biota of intertidal soft substrata on Aldabra Atoll, Indian Ocean. Phil. Trans. R. Soc. (Ser. B.) 279: 327-355
Hurlbert. S. H. (1984). Pseudoreplication and the design of ecological field experiments. Ecol. Monogr. 54: 187-211
Huston. M. A. (1985). Patterns of species diversity on coral reefs. A. Rev. Ecol. Syst. 16: 149-177
Jacoby, C. A , Greenwood, J. G. (1988). Spatial, temporal, and behavioural patterns in emergence of zooplankton in the lagoon of Heron Reef, Great Barrier Reef, Australia. Mar Biol. 97: 309-328
Johnstone, R. W., Koop, K., Larkum, A. W. D. (1988). Distribu- tion of organic carbon and inorganic nitrogen in sediments on a coral reef lagoon. Proc. Linn. Soc. 110: 219-227
Jones, A. R. (1984). Sedimentary relationships and community structure of benthic crustacean assemblages of reef-associ- ated sediments at Lizard Island, Great Barrier Reef. Coral Reefs 3. 101-1 11
Jones, G. P., Sale, P. F., Ferrell, D. J. (1988). Do large carnlvor- ous fishes affect the ecology of macrofauna in shallow lagoonal sediments? A pilot experiment. Proc. 6th int. Coral Reef Congr., Townsville, 2: 77-82
McWilliam, P. S., Sale, P. F., Anderson, D. T. (1981). Seasonal changes in resident zooplankton sampled by emergence traps in One Tree Lagoon, Great Bamer Reef. J , exp. mar. Biol. Ecol. 52: 185-203
Ogden, J. C., Ebersole, J. P. (1981). Scale and community structure of coral reef fishes: a long-term study of a large artificial reef. Mar. Ecol. Progr. Ser. 4: 97-103
Oliver, J. S., Slattery, P. N., Hulberg, L. W., Nybakken, J . W. (1980). Relationship between wave disturbance and zona- bon of benthic invertebrate communities along a subtidal high-energy beach in Monterey Bay, California. Fish. Bull. U.S. 78: 437-454
Phillips, F. E., Fleeger, J . W. (1985). Meiofauna meso-scale variability in two estuarine habitats. Estuar. cstl Shelf Sci. 21: 345-756
Richter, W., Sarnthein, M. (1977). Molluscan colonization of different sediments on submerged platforms in the west- ern Baltic Sea. In: Keegan, B. F , Ceidigh, P. O . , Boaden, P.
120 Mar Ecol. Prog. Ser. 62: 109-120, 1990
J. S. (eds.) The biology of benthic organisms. Pergamon Press, Oxford, p. 531-539
Riddle, M. J. (1988). Patterns in the distribution of macro- fauna1 communities in coral reef sediments on the central Great Barrier Reef. Mar Ecol. Prog. Ser. 47: 281-292
Sale, P. F. (1980). The ecology of fishes on coral reefs. Oceanogr. mar. biol. A. Rev. 18: 3 6 7 4 2 1
Sale, P. F., Douglas, W. A. (1984). Temporal variability in the community structure of fish on coral patch reefs and the relation of community structure to reef structure. Ecology 65: 409-422
Salvat, B. (1972). La faune benthique du lagon de l'atoll de Reao (Tuamotu, Polynesie). Cah. Pacif. 16: 29-109
St John, J., Jones, G. P., Sale, P. F. (in press). The distribution and abundance of soft-sedment meiofauna and a preda- tory goby m a coral reef lagoon. Coral Reefs 8: 51-57
Suchanek, T. H., Colin, P. L. (1986). Rates and effects of bioturbahon by invertebrates and fishes at Enewetak and Bikini atolls. Bull, mar. Scl. 38: 25-34
Taylor, J. D. (1971). Reef associated molluscan assemblages in the western Indian Ocean. Symp, zool. Soc. Lond. 28: 501-534
Thomassin, B. (1978). Soft-bottom communities. In: Stoddart,
This article was presented by Dr G. F. Humphrey, Sydney, Australia
D. R. , Johannes, R. E. (eds.) Coral reefs- research methods. UNESCO, p. 263-298
Thomassin, B. A., Jouin, C., Renaud-Mornant. J., Richard, G.. Salvat, B. (1982). Macrofauna and meiofauna in the coral sediments on the Tiahura Reef complex, Moorea Island (French Polynesia). Tethys 10: 392-397
Thomassin, B. A., Vivier, M.-H., Vitiello, P. (1976). Distribu- tion de la meiofaune et de la macrofaune des sables coralllens de la retenue d'eau epireclfale du grand recif de Tulear (Madagascar). J. exp. mar. Biol. Ecol. 22: 31-53
Underwood, A. J. (1981). Techniques of analysis of variance in experimental marine biology and ecology. Oceanogr. mar. biol. A. Rev. 19: 513-605
Van Blaricom, G. R. (1982). Experimental analyses of struc- tural regulahon in a marine sand community exposed to oceanic swell. Ecol. Monogr. 52: 283-305
Whitlach, R . B. (1981). Animal-sediment relationships in inter- tidal marine benthic habitats: some determinants of deposit-feeding species diversity. J . exp. mar. Biol. Ecol. 53: 31-45
Williams, B. K. (1983). Some observations on the use of discri- minant analysis in ecology. Ecology 64: 1283-1291
manuscript first received: May 31, 1989 Revised version accepted: October 17, 1989


