Spatial Estimates of Biomass in 'Mature’ Native Vegetation ...
64
national carbon accounting system technical report no. 44 Spatial Estimates of Biomass in ‘Mature’ Native Vegetation John Raison, Heather Keith, Damian Barrett, Bill Burrows and Pauline Grierson
Transcript of Spatial Estimates of Biomass in 'Mature’ Native Vegetation ...

national carbonaccounting system
tech
nica
l rep
ort n
o. 4
4 Spatial Estimates of Biomass in ‘Mature’ Native Vegetation
John Raison, Heather Keith, Damian Barrett,Bill Burrows and Pauline Grierson

The National Carbon Accounting System:• Supports Australia's position in the international development of policyand guidelines on sinks activity and greenhouse gas emissionsmitigation from land based systems.
• Reduces the scientific uncertainties that surround estimates of landbased greenhouse gas emissions and sequestration in the Australian context.
• Provides monitoring capabilities for existing land based emissions andsinks, and scenario development and modelling capabilities thatsupport greenhouse gas mitigation and the sinks development agendathrough to 2012 and beyond.
• Provides the scientific and technical basis for internationalnegotiations and promotes Australia's national interests in internationalfora.
http://www.greenhouse.gov.au/ncas
For additional copies of this report phone 1300 130 606
SPATIAL ESTIMATES OF BIOMASS IN ‘MATURE’ NATIVE VEGETATION
John Raison+, Heather Keith+, Damian Barrett*,Bill Burrows^, Pauline Grierson#
+ CSIRO Forestry and Forest Products* CSIRO Plant Industry
^ Queensland Department of Primary Industries# University of Western Australia
National Carbon Accounting System Technical Report No. 44
November 2003

Australian Greenhouse Officeii
Printed in Australia for the Australian Greenhouse Office© Australian Government 2003
This work is copyright. It may be reproduced in whole or part for study or trainingpurposes subject to the inclusion of an acknowledgement of the source and nocommercial usage or sale results. Reproduction for purposes other than those listedabove requires the written permission of the Communications Team, AustralianGreenhouse Office. Requests and enquiries concerning reproduction and rights shouldbe addressed to the Communications Team, Australian Greenhouse Office,GPO Box 621, CANBERRA ACT 2601.
For additional copies of this document please contact the Australian Greenhouse OfficePublications Hotline on 1300 130 606.
For further information please contact the National Carbon Accounting System athttp://www.greenhouse.gov.au/ncas/
Neither the Australian Government nor the Consultants responsible for undertakingthis project accepts liability for the accuracy of or inferences from the materialcontained in this publication, or for any action as a result of any person’s or group’sinterpretations, deductions, conclusions or actions in reliance on this material.
November 2003
Environment Australia Cataloguing-in-Publication
Spatial estimates of biomass in `mature’ native vegetation / John Raison *[et al.]
p. cm.
(National Carbon Accounting System technical report; no. 44)
ISSN: 1442 6838
1. Plant biomass-Australia-Measurement. 2. Vegetation mapping-Australia. I. Raison,John. II. Australian Greenhouse Office. III. Series.
577.3*0994-dc21333.9539*0994-dc21

National Carbon Accounting System Technical Report iii
TABLE OF CONTENTSPage No.
Summary iv
Background 1
1. Synthesis of Published Data 2
2. Unpublished Forest Data from South-East Australia 32
2.1 General comment: 32
2.2 Comment on AGO criteria: 32
2.2.1 Maturity of the vegetation and changes due to disturbance 32
2.2.2 Accuracy of spatial location 32
2.2.3 Size of the area sampled (plot versus stand) and representativeness of local conditions(~1 ha for stand level) 32
2.2.4 Biomass divided into above – and below-ground components 32
3. Woodland Data from Queensland 41
3.1 Materials and Methods 41
3.1.1 Permanent monitoring plots 41
3.1.2 Site representativeness 41
3.1.3 Representativeness of the climate history 42
3.1.4 Stand structure 42
3.1.5 Tree basal area 42
3.1.6 Live above-ground biomass 43
3.1.7 Above-ground biomass of standing dead trees 43
3.1.8 Estimation of the biomass of trees dead at the initial recording 44
4. Shrubland, Woodland and Forest Data from Western Australia 48
LIST OF TABLESTable 1. Fraction of total plant biomass below-ground, fb, for Australian vegetation types
(n = 20) from a range of literature studies. Dominant species were identified by theauthors of each study. Data are grouped into vegetation classes based on the AUSLIGvegetation classification scheme. 4
Table 2. Approximate standard errors as a percentage of the mean (coefficient of variance, CV)for 17 of the 45 studies in the VAST data set, which reported a measure of uncertainty.‘Prediction’ error refers to the standard error of the prediction of the least-squares linear regression by authors (allometric equation) and ‘between plot’ error refers to standarderrors reported by authors for between plot variance. 5

Australian Greenhouse Officeiv
SUMMARY
About 200 biomass estimates for native vegetationare provided for contrasting locations throughoutAustralia based upon published and unpublishedinformation. Discussion is provided in relation to‘maturity’ of the vegetation (i.e. change due to priordisturbance), accuracy of spatial location, and thesize of the area sampled (plot versus stand) andhence likely representativeness of local conditions.Much of the data do not meet the strict criteriaspecified by the Australian Greenhouse Office(AGO) in relation to these factors, and thus the datashould be evaluated very carefully prior to their useto calibrate the modelled continental productivitysurface produced by the AGO.
We recommend that additional robust verificationdata (derived from multiple inventory plots overseveral hectares) for a range of vegetation typesalong the biomass gradient, be collected to confirmthe reliability of the calibration.

National Carbon Accounting System Technical Report 1
BACKGROUND
The biomass data contained in this report wereassembled at the request of the AustralianGreenhouse Office (AGO) for the purpose ofcalibrating a modelled continental productivitysurface (Landsberg & Kesteven, 2002).
The criteria for inclusion of data were that:
1. Estimates were for ‘mature’ (or nearly mature)native vegetation;
2. Estimates were accurately spatially referenced(preferably by GPS) to +_ 200 m;
3. Estimates were at the stand level (~1 ha) ifpossible;
4. An estimate of total biomass, split into above-and below-ground components was available;and
5. A wide range of forest types andproductivities were represented.
It was often not possible to meet all these criteria,but an evaluation (discussion) in relation to thecriteria was provided for each data set.
Four major sources of data were identified asrelevant to the project that could be rapidlysummarised. Time constraints did not make itfeasible to generate new biomass estimates (e.g. by applying inventory data to existingallometric equations); but this is a cost-effectiveoption for the future to fill identified gaps in existing data. The data sources were:
1. Synthesis of published information.
Much work had already been done (Barrett2001, Barrett et al. 2001) to evaluate existinginformation. A relevant sub-set of publisheddata was assembled by Dr Damian Barrett of CSIRO.
2. Unpublished forest data from
South-East Australia.
Data were assembled for about 40 sites in sub-alpine eucalypt forest, and for Eucalyptus
obliqua forest by Dr Heather Keith of CSIRO.
3. Woodland data from Queensland.
Data were assembled for a wide range ofwoodland sites in central Queensland by Dr Bill Burrows from the QueenslandDepartment of Primary Industries.
4. Shrubland, woodland and forest data
from Western Australia (WA).
About 30 unpublished biomass estimates,mostly for shrubland and woodlandvegetation in WA, were assembled by Dr Pauline Grierson of the University of WA.
Section 1 provides a synthesis of the compiledinformation. The data tables and associateddiscussion follow in Sections 2-4 of this report.
REFERENCESBarrett, D.J. 2001. NPP Multi-Biome:VAST Calibration Data 1965-98.[http://www.daac.ornl.gov/]
Barrett, D.J. Galbally, I.E. and Graetz, R.D. 2001.Quantifying uncertainty in estimates of C emissionsfrom above-ground biomass due to historic land-usechange to cropping in Australia. Global Change
Biology, 7, 883-902, 2001.
Landsberg, J. and Kesteven, J. 2002. Spatialestimation of plant productivity. In Richards, G.P.
2002 (Editor) Biomass estimation: Approaches for
assessment of stocks and stock change. AustralianGreenhouse Office. NCAS Technical Report 27.Chapter 2. 140pp

Australian Greenhouse Office2
1. SYNTHESIS OF PUBLISHED DATA
Data were sourced from the VAST dataset (Barrett2001) with compilation methods described in Barrettet al. (2001). Note the present version of the dataset ismodified from that of Barrett et al. (2001) (it includesmore data points and some data points not used inthe earlier analysis are included here). The originalpurpose for developing the VAST data set was togenerate a representative sample of observations overas much of the climatic domain of the continent aspossible for developing model parameterization anduncertainty methods. The VAST dataset is not acomprehensive compilation of data, which wouldduplicate work being conducted elsewhere.Consequently, predictions made from modelparameterizations using these data are likely to beunbiased but the prediction standard errors will begreater than if larger more comprehensive samplesets are used.
Quality control in the data set included stipulationthat measurements had undergone scientific peerreview prior to publication. The full VAST data setcomprised above-ground fine tissue Net PrimaryProductivity (NPP), above-ground fine and coarsetissue biomass, fine tissue littermass, soil carbon (C)concentration profiles, and soil bulk density profiles.A total of 45 published papers are included in thebiomass data set provided for this report and a fullreference list of these studies is provided below.
Georeferencing of point observations used thelatitude and longitude provided by authors or,where absent, were obtained from an identifiabletopographic feature described in the study andlocatable on 1:1,000,000 or 1:2,500,000 scaleAustralian Survey and Land Information Group(AUSLIG) maps. In studies where authors presentedan age sequence of biomass, the oldest sites wereused where possible because it was reasonable toassume that these sites were less disturbed thanyounger sites. Measurements were averaged forthose studies where multiple sites were described byauthors but listed under a single latitude and
longitude. Various techniques were used by authors to sample biomass, which included directharvesting, application of existing or new allometricequations, or visual methods made on a single date.Branch biomass and lignotuber (where present) wereincluded with the stem component. In only a veryfew studies were data on below-ground biomassavailable (Table 1). These measures were stratified by AUSLIG vegetation classes (Growth Form ofTallest Stratum x Foliage Projected Cover) andexpressed as the ratio of below-ground to totalbiomass, fb.
Biomass data provided for this report were takenfrom the published literature ‘as is’ i.e. no expansionfactors have been applied to stem + branch mass.This is because above-ground biomass included bothfine and coarse tissues of the over- and under-storeywhere provided by authors. Where no-data arepresented in the accompanying tables it indicatesthat only one biomass pool (either fine or coarse)was reported in the original study.
It is important to note that the data published in the scientific literature were collected for purposesother than estimating potential above-groundbiomass. Therefore, not all details are provided fordetermining the level of disturbance or the coverageover all C-pools. In addition, the information in eachpublication must be interpreted which may itselfintroduce errors. Other interpretations may thereforegenerate different biomass values from the presentdata set (which is part of the total uncertainty ofbiomass prediction).
To establish whether biomass met the criteria of‘minimal disturbance’, two indicators were used.First, details on disturbance, fire history orharvesting were noted from papers where provided(see detailed notes below), and secondly, theauthor’s description of overstorey vegetationstructure and species composition was comparedwith the AUSLIG digital Atlas of Australian Pre-European Vegetation (1770) at the same location.Where the vegetation classification matched betweenthe contemporary study and the historical data set it
National Carbon Accounting System Technical Report 3
was assumed that the vegetation type remainedconstant during this century. Thus, biomass dataused here refer to a maximum potential biomass inthe absence of major disturbance.
The total area sampled in each study was calculatedby multiplying the individual area of each plot bythe number of plots sampled. The total area sampledranged from 0.00006 ha for quadrat sampling inherbaceous communities up to 17 ha in Tall Forests of south-east and south-west Australia. In one forest,the whole 33.2 ha was sampled by a random ‘point-quadrant’ method. The reliability of biomassmeasurements made by the authors of each studyshould be regarded as high given that each studywas peer reviewed prior to publication. Reliabilitythat all above-ground biomass pools were includedis lower given that these studies didn’t necessarilyset out to achieve this aim. The reliability of latitudeand longitude are probably reasonable given that itis likely authors obtained these from topographicmaps in most cases (although in two cases theprovided coordinates were obviously a typographicerror in the published paper). The precision of each location was 1 minute latitude and longitudebecause authors never specified locations to anygreater accuracy. This means that the locationsprovided by authors can only be accurate to within~2 km at best. In two cases latitude and longitudewere given to nearest 0.1o yielding a precision ofonly ~11 km. Where a location description wasprovided by authors, the precision varied from ~1 km up to 20 km.
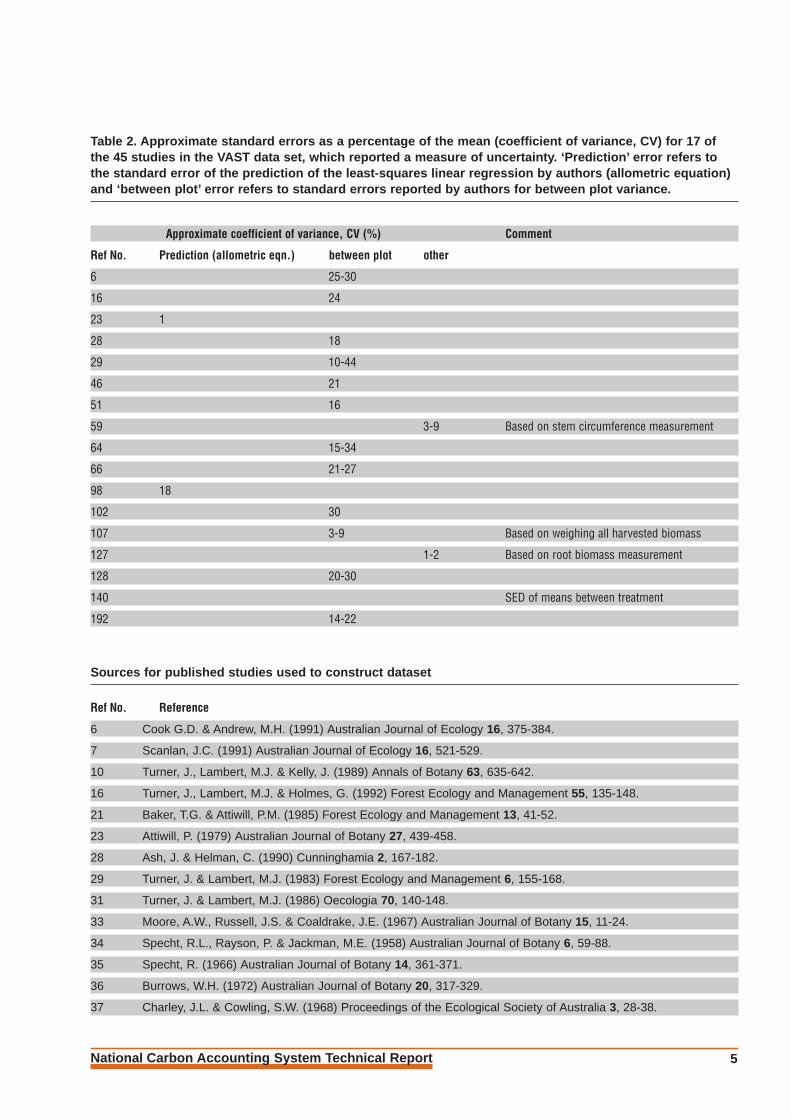
The reporting of standard errors in different studiesneed to be interpreted with some care. Somestandard errors referred to the error associated withpredictions of biomass from allometric equations.Other reporting of standard errors referred tovariation within a forest (i.e. between forest plots).Of the 45 papers available, 17 presented somemeasure of an error in estimated mean biomass. The coefficient of variance, CV (ratio of standarderror to the mean) ranged between 10 and 44%(Table 2). As a measure of landscape heterogeneity,
this is the measure of uncertainty in which we areinterested. It is a measure of total variance in theestimated biomass. Note, that the predictionstandard error of allometric equations will be lessthan the total variance. The range of CV reported inTable 2 is consistent with a minimum CV of ~25%suggested by Barrett et al. (2001) to be the practicalminimum uncertainty achievable for large scalebiomass estimation studies given financial andlogistical constraints on sampling.
REFERENCESBarrett, D.J. 2001, NPP Multi-Biome: VAST Calibration Data, 1965-1998. Available on-line[http://www.daac.ornl.gov/] from Oak RidgeNational Laboratory Distributed Active ArchiveCenter, Oak Ridge, Tennessee, U.S.A, 2001.
Barrett, D.J., Galbally, I.E., and Graetz, R.D. 2002,Quantifying uncertainty in estimates of C emissionsfrom above-ground biomass due to historic land-usechange to cropping in Australia, Global Change
Biology, 7, 883-902, 2001.

Australian Greenhouse Office4
Table 1. Fraction of total plant biomass below-ground, f b, for Australian vegetation types ( n = 20) from arange of literature studies. Dominant species were identified by the authors of each study. Data aregrouped into vegetation classes based on the AUSLIG vegetation classification scheme.
oLatitude oLongitude Dominant species fb Author Year
Tall and Medium forests (T3, T4, M4)
37.43 145.58 Eucalyptus regnans 0.08 Feller 1980
37.43 145.58 E. obliqua / E. dives 0.11 Feller 1980
34.45 116.03 E. diversicolor 0.04 Grove and Malajczuk 1985
33.55 150.37 E. maculata forest 0.15 Ash and Helman 1990
Mean 0.10
Medium and Low forests (M1, M2, M3, L3, L4)
27.28 149.75 Brigalow 0.26 Moore et al. 1967
27.70 153.45 E. signata / E.umbra 0.42 Westman and Rogers 1977
25.47 153.07 E. pilularis 0.42 Applegate 1989
33.82 151.15 Avicennia marina 0.54 Briggs 1977
35.36 148.80 E. pauciflora / E. dives 0.19 Keith et al. 1997
Mean 0.37
Low shrubs (arid and semi-arid) (L1, L2, Z1)
26.42 146.22 Eremophila gilesii 0.25 Burrows 1972
31.90 141.45 Atriplex vesicaria 0.29 Charley and Cowling 1968
23.55 133.60 Eragrostis eriopoda / Acacia aneura 0.57 Ross 1977
Mean 0.37
Tall shrubs (S1, S2, S3, Z2, Z3)
38.13 145.13 Leptospermum myrsinoides / Banksia marginata 0.86 Jones 1968
38.13 145.13 Leptospermum myrsinoides / Banksia marginata 0.88 Jones 1968
33.96 151.22 Banksia/Leptospermum / Acacia/Lepidosperma 0.62 Maggs and Pearson 1977a
35.87 140.45 Banksia, Casuarina, Xanthorrhoea, Melaleuca 0.76 Specht et al. 1958
38.87 146.40 Banksia coastal heath 0.84 Groves 1965
39.033 146.32 Leptospermum myrsinoides / Casuarina pusilla 0.66 Groves and Specht 1965
38.87 146.40 Leptospermum myrsinoides / Xanthorrhoea australis 0.50 Groves and Specht 1965
29.87 115.25 Banksia sclerophyllous scrub 0.69 Low and Lamont 1990
Mean 0.73
Grasses, Sedges and Other Herbaceous (H,G,F)
30.58 153.00 Coastal Spinifex 0.86 Maze and Whalley* 1990
35.28 149.12 Phalaris / Sub-clover pasture 0.74 D. Barrett unpub. data
* K.M. Maze and R.D.B. Whalley (1990).Aust. J. Ecol. 15, 145-153.
National Carbon Accounting System Technical Report 5
Table 2. Approximate standard errors as a percentage of the mean (coefficient of variance, CV) for 17 ofthe 45 studies in the VAST data set, which reported a measure of uncertainty. ‘Prediction’ error refers tothe standard error of the prediction of the least-squares linear regression by authors (allometric equation) and ‘between plot’ error refers to standard errors reported by authors for between plot variance.
Approximate coefficient of variance, CV (%) Comment
Ref No. Prediction (allometric eqn.) between plot other
6 25-30
16 24
23 1
28 18
29 10-44
46 21
51 16
59 3-9 Based on stem circumference measurement
64 15-34
66 21-27
98 18
102 30
107 3-9 Based on weighing all harvested biomass
127 1-2 Based on root biomass measurement
128 20-30
140 SED of means between treatment
192 14-22
Sources for published studies used to construct dataset
Ref No. Reference
6 Cook G.D. & Andrew, M.H. (1991) Australian Journal of Ecology 16, 375-384.
7 Scanlan, J.C. (1991) Australian Journal of Ecology 16, 521-529.
10 Turner, J., Lambert, M.J. & Kelly, J. (1989) Annals of Botany 63, 635-642.
16 Turner, J., Lambert, M.J. & Holmes, G. (1992) Forest Ecology and Management 55, 135-148.
21 Baker, T.G. & Attiwill, P.M. (1985) Forest Ecology and Management 13, 41-52.
23 Attiwill, P. (1979) Australian Journal of Botany 27, 439-458.
28 Ash, J. & Helman, C. (1990) Cunninghamia 2, 167-182.
29 Turner, J. & Lambert, M.J. (1983) Forest Ecology and Management 6, 155-168.
31 Turner, J. & Lambert, M.J. (1986) Oecologia 70, 140-148.
33 Moore, A.W., Russell, J.S. & Coaldrake, J.E. (1967) Australian Journal of Botany 15, 11-24.
34 Specht, R.L., Rayson, P. & Jackman, M.E. (1958) Australian Journal of Botany 6, 59-88.
35 Specht, R. (1966) Australian Journal of Botany 14, 361-371.
36 Burrows, W.H. (1972) Australian Journal of Botany 20, 317-329.
37 Charley, J.L. & Cowling, S.W. (1968) Proceedings of the Ecological Society of Australia 3, 28-38.

Australian Greenhouse Office6
Sources for published studies used to construct dataset continued
Ref No. Reference
38 Westman, W. & Rogers, R. (1977) Australian Journal of Botany 25, 171-191.
41 Hingston, F., Dimmock, G. & Turton, A. (1980) Forest Ecology and Management 3, 183-207.
44 Ashton, D.H. (1976) Journal of Ecology 64, 171-186.
46 Feller, M. (1980) Australian Journal of Ecology 5, 309-333.
51 Bradstock, R. (1981) Australian Forest Research 11, 111-127.
59 Pressland, A.J. (1975) Australian Journal of Botany 23, 965-976.
60 Noble, I.R. (1977) Australian Journal of Botany 25, 639-653.,
61 Stewart, H., Flinn, D. & Aeberli, B. (1979) Australian Journal of Botany 27, 725-740.
64 Applegate, G.B. (1989) Australian Forestry 52, 195-196.
66 Grove, T. & Malajczuk, N. (1985) Forest Ecology and Management 11, 59-74.
72 Rixon, A.J. (1969) In ‘The Biology of Atriplex’ (Ed. R. Jones) CSIRO Divn. Plant Industry, 128 p.
84 Bridge, B.J., Mott, J.J. & Hartigan, R.J. (1983) Australian Journal of Soil Research, 21, 91-104.
98 Harrington, G. (1979) Australian Journal of Botany 27, 135-143.
102 Low, A. & Lamont, B. (1990) Australian Journal of Botany 38, 351-359.
104 Friedel, M. (1981) Australian Journal of Botany 29, 219-231.
107 Jones, R. (1968) Australian Journal of Botany 16, 589-602.
115 Turner, J. (1980) Australian Forest Research 10, 289-294.
122 Andrew, M.H. & Lange, R.T. (1986) Australian Journal of Ecology. 11, 395-409.
126 Ross, M.A. (1977) Australian Journal of Ecology 2, 257-268.
127 Briggs, S.V. (1977) Australian Journal of Ecology 2, 369-373.
128 Ive, J.R. (1976) Australian Journal of Ecology 1, 185-196.
131 Robertson, G. (1988) Australian Journal of Ecology 13, 519-528.
138 Crane, W.J.B. & Raison, R.J. (1980) Australian Forestry 43, 253-260.
140 Keith, H., Raison, R.J. & Jacobsen, K.L. (1997) Plant and Soil 196, 81-99.
143 Walker, B.H. & Langridge, J.L. (1997) Journal of Biogeography 24, 813-825.
147 Maggs, J. & Pearson, C. (1977) Oecologia 31, 239-250.
154 Leigh, J.H. & Mulham, W.E. (1966) Australian Journal of Experimental Agriculture and Animal Husbandry 6, 460-467.
159 Roshier, D.A. & Nicol, H.I. (1998) Rangelands Journal 20, 3-25.
167 Groves, R.H. (1965) Australian Journal of Botany 13, 281-289.
168 Groves, R.H. & Specht, R.L. (1965) Australian Journal of Botany 13, 261-280.
192 Burrows, W.H., Hoffmann, M.B., Compton, J.F., Back, P.V. & Tait, L.J. (2000) Australian Journal of Botany, 48, 707-714.

National Carbon Accounting System Technical Report 7
Detailed notes on published papers used to generatethe VAST Biomass dataset: ‘Ref’ relates to thereference number in the above list of publishedpapers.
Ref. Notes:No.
6 Understorey of Tallgrass Savanna includinggrasses, shrubs, forbs and litter (Sorghum
intrans dominant). No soil details provided.Biomass reported in Table refers to ‘unburnt’site only. Latitude and longitude publishedto nearest minute (‘Thorak’ site). 3 x 0.25 m2
quadrats measured by clipping, bulking,drying at 80oC and weighing sub-samples.Sampled 1979/1980. No root biomass. No standard errors given for biomass (standard errors of nitrogen measurementsvaried between CV = ~25 – 30%; Figure 1 of paper).
7 Acacia harpophyla woodland community from2 years old to mature trees. Duplex soil withsandy-clay loam surface (Db1.13). Vegetationpreviously cleared at different times. Biomassapplies to ‘mature’ vegetation only [datasourced from Moore et al. (1967); Ref No. 33].Latitude and longitude published to nearestminute. Biomass determined on 50 x 2 mplot. Biomass sampled 1982 on 29 treesselected across a range of sizes. Above-ground biomass harvested, separated intotrunks, branches, leaves, and bark, ovendried and weighed and allometric equationsdeveloped. Allometric equations applied tomeasurements of basal circumference andheight for all trees on plot. No root biomass.No errors reported.
10 Subtropical rainforest in northern New SouthWales (NSW). Soils were deep basalts redclay loam with clay sub-soils (Clay >50% in surface and 70-90% in subsoils).Measurements made on ‘undisturbed’ forestplots. Latitude and longitude published tonearest minute. Plots were 0.36 ha in
diameter. Understorey biomass measuredusing 10 x 1 m2 quadrats. Eight overstoreytrees sampled to establish allometricrelationships. All understorey vegetation <2 m harvested. On two other plots,diameter measured on all trees and massestimated using allometric equations. Masswas estimated on plots in three years: 1965,1973 and 1981 (reported in the Table). Noroot biomass. No errors reported.
16 Dry sclerophyll forest of indeterminate butprobably mixed age dominated by Eucalyptussieberi with Acacia understorey. Soils are redand yellow podzolics. The authors reportedfire disturbance in 1980, which was severe inother catchments but which disturbed onlyfine litter in the study catchment (no treemortality). Latitude and longitude notpublished but taken as middle of YambullaState Forest from AUSLIG maps. Two stagesampling of trees occurred: 1000 m2 circularplot in which all trees were measured,diameter at breast height (DBHOB) and(DBH) then 2000 m2 circular plot on whichall trees >40 cm were measured DBHOB.Five ‘Strata’ sampled each with 1 to 5 ‘plots’in the State Forest. Biomass reported in Tableas mean over all strata. Mass estimated 1981.Allometric equations developed elsewhere(Turner et al. 1992; Forest CommissionResearch Paper) were used to predict mass. Understorey biomass estimated byallometric equations measured on adjacent vegetation. Standard deviation of overstorey + understorey vegetation was53.8 + 18.79 tDW ha-1 (CV = 24%). No rootbiomass.
21 Vegetation is Eucalyptus obliqua forest of age between 70 and 90 years. Soils weredescribed as ‘clay-loam’ and ‘loam’. Two E. obliqua sites were measured nearupper and lower end of productivity for the Gippsland area. Latitude and longitudegiven to nearest minute. Sample plots were

Australian Greenhouse Office8
0.1 ha. Allometric equations of Attiwill (1962;Aust. J Bot. 28, 199-222) used to estimate themass of the ‘average’ trees in 5 or 6 classeson each plot. No understorey componentmeasured. Plot descriptions were done in1980 (Table 1 of paper). No date given formeasurements. No root biomass. No error given.
23 ‘Open eucalypt (Eucalyptus obliqua) forestwith well developed understorey’, Victoria.Soils are highly weathered red-brown friableclay loams uniform to 1 m. Biomass in Tableapplies to 66 year old forest. Latitude andlongitude not supplied but given in anotherstudy to nearest minute. All measurementswere made on a 0.1 ha square plot in eachstand (Polglase et al. 1992 Plant and Soil, 142, 167 – 176). Allometric relationshipsestablished previously (Attiwill, 1962; Aust.
J Bot. 28, 199-222) with a further 10 treesfelled for this study. Allometric relationshipswere applied to measurements of DBHOB.Overstorey components only weremeasured. No standard errors given for 66 year old (y.o.) forest. For 50 y.o. forest,reported biomass was 298 tDM ha-1 withstandard error of 2 (CV = 1%); althoughAttiwill cautioned on using these precisionestimates as they apply only to theregression models not the plot and they were developed for a different location at adifferent time. Allometric measurementswere made in 1962 and 66 year old DBHOBmeasurements were made in 1977. No rootbiomass.
28 Vegetation comprises both eucalyptsclerophyll forest and subtropical rainforest.Soils are grey leached sands overlying ayellow-grey B horizon of high clay contenton weathered sandstone. Forest has beenselectively logged since 1880s with anintense period between 1910 and 1926.Latitude and longitude given to nearest
minute. Measurements were made in 1981and 1984. ‘Point-centred quarter surveymethod’ was used where points are locatedrandomly throughout the forest and nearesttrees >5 cm DBH in each compass quadrantare measured. Forest area sampled 33.2 ha.Allometric relationships were determined for fallen trees in and around the catchmentusing separate wood density estimates. Root biomass of uprooted trees was alsodetermined. Thirty 0.1 m2 pits 40 to 90 cmdeep were excavated and root biomass <5 cm measured in each. Standard errors for biomass density are given for eucalypts,rainforest trees, shrubs and herbs (CV ~ 18%).
29 Tall wet sclerophyll forests dominated byflooded gum (Eucalyptus grandis). Soils are‘moderate to high fertility’. Forest wasdestroyed by fire in 1951 and replanted to E. grandis in 1962. Forests 27 years old.Approximate location only given in CoffsHarbour Forestry Region. Destructivesampling conducted in 1978 on adjacentplots to establish allometric equations.Biomass measured on plots using DBHOB. No root biomass measurements. Plot areasnot given. No errors given for biomass(standard errors of nitrogen measurementsare between CV = 10 and 44%).
31 Tall eucalypt forests of mixed speciescomposition (dominant species E. seiberi,
E. muellerana, E. obliqua, E. consideniana,
E. agglomerata). Soils are red-yellowpodzolics with poor structure and lownutrient status, rooting depths from 40 to 100 cm. Forest has been logged for sawlogand pulpwood and regenerates from existingseed bed. Stands selected for measurementwere ‘fully stocked to represent an upperlevel of accumulation’ of biomass. Unknowndate of measurements. Approximate locationonly in ‘Eden Forestry Region’ south-east
National Carbon Accounting System Technical Report 9
NSW. Biomass was estimated for trees onplots using existing allometric equations forthe area. Plots of unknown size. No rootbiomass measurements. No standard errorsgiven for biomass.
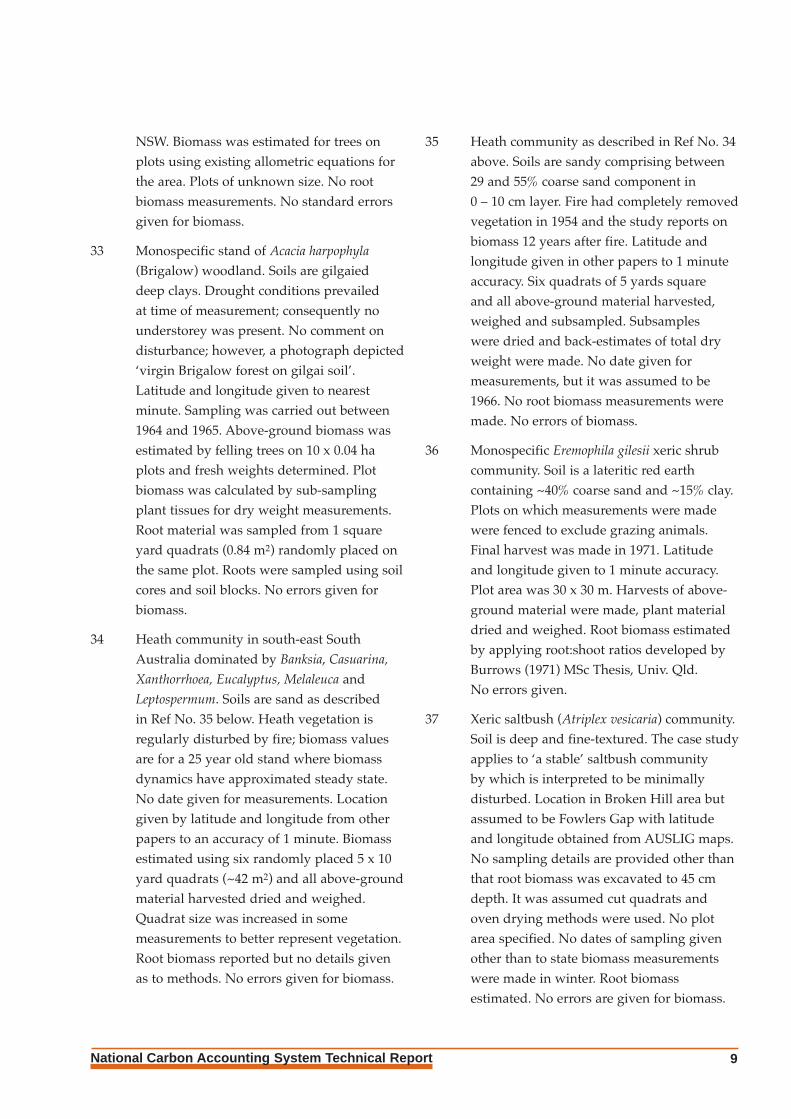
33 Monospecific stand of Acacia harpophyla
(Brigalow) woodland. Soils are gilgaied deep clays. Drought conditions prevailed at time of measurement; consequently nounderstorey was present. No comment ondisturbance; however, a photograph depicted‘virgin Brigalow forest on gilgai soil’.Latitude and longitude given to nearestminute. Sampling was carried out between1964 and 1965. Above-ground biomass wasestimated by felling trees on 10 x 0.04 haplots and fresh weights determined. Plotbiomass was calculated by sub-samplingplant tissues for dry weight measurements.Root material was sampled from 1 squareyard quadrats (0.84 m2) randomly placed onthe same plot. Roots were sampled using soilcores and soil blocks. No errors given forbiomass.
34 Heath community in south-east SouthAustralia dominated by Banksia, Casuarina,
Xanthorrhoea, Eucalyptus, Melaleuca andLeptospermum. Soils are sand as described in Ref No. 35 below. Heath vegetation isregularly disturbed by fire; biomass valuesare for a 25 year old stand where biomassdynamics have approximated steady state.No date given for measurements. Locationgiven by latitude and longitude from otherpapers to an accuracy of 1 minute. Biomassestimated using six randomly placed 5 x 10yard quadrats (~42 m2) and all above-groundmaterial harvested dried and weighed.Quadrat size was increased in somemeasurements to better represent vegetation.Root biomass reported but no details givenas to methods. No errors given for biomass.
35 Heath community as described in Ref No. 34above. Soils are sandy comprising between29 and 55% coarse sand component in 0 – 10 cm layer. Fire had completely removedvegetation in 1954 and the study reports onbiomass 12 years after fire. Latitude andlongitude given in other papers to 1 minuteaccuracy. Six quadrats of 5 yards square and all above-ground material harvested,weighed and subsampled. Subsamples were dried and back-estimates of total dryweight were made. No date given formeasurements, but it was assumed to be1966. No root biomass measurements weremade. No errors of biomass.
36 Monospecific Eremophila gilesii xeric shrubcommunity. Soil is a lateritic red earthcontaining ~40% coarse sand and ~15% clay.Plots on which measurements were madewere fenced to exclude grazing animals.Final harvest was made in 1971. Latitudeand longitude given to 1 minute accuracy.Plot area was 30 x 30 m. Harvests of above-ground material were made, plant materialdried and weighed. Root biomass estimatedby applying root:shoot ratios developed byBurrows (1971) MSc Thesis, Univ. Qld. No errors given.
37 Xeric saltbush (Atriplex vesicaria) community.Soil is deep and fine-textured. The case studyapplies to ‘a stable’ saltbush community by which is interpreted to be minimallydisturbed. Location in Broken Hill area butassumed to be Fowlers Gap with latitudeand longitude obtained from AUSLIG maps.No sampling details are provided other thanthat root biomass was excavated to 45 cmdepth. It was assumed cut quadrats andoven drying methods were used. No plotarea specified. No dates of sampling givenother than to state biomass measurementswere made in winter. Root biomassestimated. No errors are given for biomass.

Australian Greenhouse Office10
38 Low sclerophyll forest to 15 m on StradbrokeIsland, Queensland (Eucalyptus, Tristania,
Angophora, and Banksia) with a welldeveloped understorey of herbs, grasses andforbs. No details of disturbance are given but field site part of a long term study ofproduction and nutrient cycling. Forestsgrow on a sand dune substrate of very lownutrient status. Latitude and longitude werepublished to nearest minute; althoughlongitude is in error. A correction was madebased on the longitude of Stradbroke Is. Plotarea was 0.25 ha (50 x 50 m) and establishedin 1973. Biomass censused on the plot byharvesting 31 study trees and excavatingroot systems. Sub-sampling was used todetermine dry weight of tree material.Understorey biomass determined byharvesting ten 1 x 1 m quadrats, drying andweighing material. Allometric equationswere developed from the mass of treecomponents. No standard errors reported.
41 Dry sclerophyll eucalypt forest (Eucalyptus
marginata and E. calophylla) with understoreytrees, shrubs and herbs (Banksia, Persoonia,
Macrozamia, Xanthorrhoea, Hakea and Acacia).The site was logged before 1920, thinned in1963 and subject to hazard reduction burnson 5 to 7 year intervals. Latitude andlongitude obtained from Figure 1 ofpublication. Soils are lateritic sandy gravelsoften containing large amounts of gravel and low nutrients. Measurements were made on a single 0.36 ha plot in 1977. Ten representative trees of each overstoreyspecies were felled and measured for above-ground biomass. Allometric equations wereused to estimate total above-ground biomassin trees from measurements of DBHOB.Understorey trees, shrubs and plants >1.5 mhigh were also sampled to generateallometric equations and biomass estimatedby measurement of DBH. Ground-cover
plants were harvested from 48 x 1 m2
quadrats. No standard error given. No rootbiomass given.
44 Two examples of sclerophyll forest weresampled at the one location; wet sclerophyllforest (dominated by E. regnans) withunderstorey of small trees (Acacia) andshrubs; dry Sclerophyll forest (E. sieberi andE. obliqua) with more open understorey. Soils in wet sclerophyll forest are coarselytextured brown loams to 60 cm depthgrading to red-brown clay loams to 1.6 mthen weathered clays to 5.5 m. Soil in the drysclerophyll forests are fine structured brownto dark-grey-brown soil up to 25 – 75 cmgrading to yellowish brown compact clayloams to 1.5 – 2.2 m overlaying weatheredclays to <3.0 m. Forest was severely burnt in1939 fires and the dry sclerophyll forestshave been repeatedly burnt in the meantime(although it is interpreted that thesedisturbed sites were avoided in biomassestimation). Geographic description of thelocation given, from which latitude andlongitude were obtained from AUSLIGtopographic map. Forest was 27 years old attime of sampling (in 1967). A representativeset of trees was felled and subsamplescollected for dry mass determination andallometric equations were generated. Forestbiomass was estimated over an undisclosedarea using measurements of DBHOB andallometric equations. Understorey biomasswas cut from ‘several’ 10 x 10 m quadrats.Root mass (interpreted as fine root mass)was estimated from 20 soil blocks, 25 x 25 cm in area and 12.5 cm deep. No standard errors reported.
46 Two forest plots were sampled at the onelocation. Vegetation was wet and drysclerophyll tall forests in Victoria. The wetsclerophyll forest was dominated by E. regnans
with and understorey of Acacia and shrubs.

National Carbon Accounting System Technical Report 11
The dry sclerophyll forest was dominated byE. obliqua and E. dives with an Acacia andshrub understorey. Plots were burnt in the 1939 bushfires but not burnt since.Measurements were done in 1978 (Forest was 39 years old). Latitude and longitudegiven to nearest minute. Allometricequations were developed for 6 E. regnans, 5 Acacias, 6 E. obliqua and 5 E. dives trees overa wide range of sizes. Subsamples weretaken from each component for dry massdetermination. Stand level biomass densityestimates were made by measuring diameterand height of all trees on a 20 x 20 m plotwithin each forest type. Understorey biomasswas calculated by sampling above-groundbiomass in five 2 x 2 m plots per forest type and subsamples taken for dry massdetermination. Root biomass was sampledfrom 3 x 1 m2 plots per forest type at twodepths 0 – 20 and 20 – 50 cm. Standard errorsof predicted biomass were calculated fromallometric equations. It was assumed thatplot level standard errors were estimated bymultiplying tree level standard errors ofpredicted biomass by number of trees (see Table 4 of paper). CV of above-groundbiomass was 21% and for roots CV was 22%.
51 Vegetation type is a 27 year old Eucalyptus
grandis plantation near Coffs Harbour NSW,planted from tube-stock immediately after awildfire with no site preparation. Soils werederived from ‘Lower Permian sediments’.Location was given as ‘Boyds Deviation’ 8 km from coast in Coffs Harbour ForestryRegion and an approximate latitude andlongitude were derived from AUSLIG andNSW State Forest maps. It was assumed thatmeasurements were made in 1978. Biomasswas estimated by developing allometricequations for representative range of trees onsubsidiary forest plots (of 20 x 20 m) adjacentto a main undisturbed plot (of 20 m widthand a length which enclosed ~100 trees in the
plantation) on which DBHOB measurementswere made on all trees. Felled trees weresubsampled for dry mass determination.Mean values and standard deviations wereestimated from data on all three plots.Standard deviations for above-ground treebiomass are supplied (CV = 16%). No rootbiomass was given.
59 Mulga (Acacia aneura) vegetation of south-western Queensland. No soils informationwas available. Allometric relationships weredeveloped for representative trees from arange of sizes at 8 sites in the Charlevilledistrict, Queensland. Three of these sitescould be located on AUSLIG maps to obtainlatitude and longitude. It appeared thatmeasurements were made in 1972 and 1975.No information was available on disturbancealthough only ‘healthy trees with no brokenmain branches were used’ in an ‘open forestsituation’. 33 trees were felled, subsampledand dry mass determined. Root biomass wasestimated using 20 soil cores 3.6 cm diameterand 120 cm deep in concentric circles up to4.0 m from the tree bole. Roots were washedfrom soil and dry mass determined. Treedensities were determined for all sites and amean circumference reported. Biomass wasestimated using mean forest circumferenceand allometric equations. Standard errors ofmean tree circumference were between 3 and9% of the mean. No area estimates weregiven over which measurements were made.
60 Vegetation is an arid saltbush and chenopodshrubland and mixed grassland of centralnorth South Australia (SA) dominated byAtriplex vesicaria and Maireana sedifolia. No soils data supplied. Study site located on TGB Osborne Vegetation Reserve atKoonamore, SA on which sheep and rabbitswere fenced out since 1925. Latitude andlongitude were given to nearest minute.Photographic records from fixed photo-

Australian Greenhouse Office12
points were begun in 1926 and conducted at3 month intervals until 1931. Since 1950photographs have been taken at irregularintervals. Final record was 1972 in the study.Photographs were used to develop a rankingof biomass dynamics of vegetation. Biomasscalibration of the photographs was achievedby developing correlation coefficients withleaf dry weights of more than 50 bushes eachfor the two major shrub species. A maximumbiomass (‘carrying capacity’) of theshrubland over the 46 years of record wasused as the maximum biomass of the site.No root biomass was recorded. No standarderrors are given.
61 Vegetation is an uneven-aged sclerophyllforest up to 40 m high dominated byEucalyptus agglomerata, E. muellerana, and E. sieberi. Understorey consists of trees,shrubs and herbs (Acacia, Casuarina, Banksia,and other shrubs). Soils are duplex with ahard-setting loamy surface over mottledyellow clay subsoils ranging in depth from50 cm to 200 cm. Latitude and longitude aresupplied to nearest minute. Measurementswere made in 1976. Age of forest notsupplied. Natural fires caused by lightningand fuel control burns have left fire scars on trees. The DBHOB of all trees on 17 x 0.1 ha plots was measured and then 31 trees were selected from a range of species and size classes. Trees were felledsubsampled, dry mass determined andallometric equations were developed.Equations were applied to all other trees to determine plot biomass. Understoreyvegetation was measured by harvestingvegetation in 15 x 0.04 ha plots. No rootbiomass sampled. No standard errors aregiven.
64 Vegetation is blackbutt forests on FraserIsland Qld (Eucalyptus pilularis) growing onnutrient poor siliceous sands. No further soil
details are given. Measurements are from anold growth forest of about 500 years age.Location was described as ‘Deep’ on FraserIs. No plot area was given. No year ofmeasurement available. Above and below-ground biomass was estimated by a ‘harvesttechnique’ which appeared to comprisefelling trees, excavating roots and weighingplant parts. Mean biomass and standarderror as a percentage of the mean is given(Trees: 34%, Understorey: 15%). Noallometric equations were available.
66 Tall open forest of WA dominated byEucalyptus diversicolor with denseunderstorey. Soils are described by soilgroup as ‘Red Earth’. Location given as ‘BigBrook Forest’ 6 km north-west of Pemberton,WA (latitude and longitude obtained fromAUSLIG maps). Forests are managed forsawlog and pulp production. Stand was 36 years old with last control burn 9 yearsprior to measurement. Overstorey wasmeasured 3 years prior by Hingston et al.(1979) (Ref No. 41) which makes year ofmeasurement in present study 1980. On younger sites (4, 8 and 11 years old) 11 individual trees across the range of sizeswere harvested for dry mass determinationsand allometric relationships developedbetween mass and DBHOB. Fine rootbiomass was measured in a previous study.Plots for overstorey biomass determinationwere 50 x 50 m. Understorey biomass wasmeasured on ten plots each 2 x 2 m bydeveloping allometric equations for smalltrees and shrubs. Standard errors areavailable for understorey biomass estimation(CV~21–27%) and for overstoreycomponents in younger forests.
72 Vegetation is arid saltbush communitydominated by Atriplex vesicaria and Kochiaaphylla, intermixed with annual grasses andperennial herbs. No soils description isprovided. Location is given by description

National Carbon Accounting System Technical Report 13
of study site in Ref No. 154 and latitude andlongitude determined from AUSLIG maps.Biomass was sampled in 1969. Plant materialwas harvested and a mean of five replicatesis presented. No plot area given. Biomassdensity determined as weighted average ofbeneath and between vegetation clumpsbased on Figure 1 of paper and assumptionthat figure is to scale. No root biomass. No standard errors available.
84 Vegetation is open woodland dominated by Eucalyptus foelscheana with a grassunderstorey. Soil was described as‘representative of the widespread Tipperafamily of the Katherine-Darwin area’. Soilrespiration measurement was the primaryaim of the study but root biomass wasmeasured at the completion of respirationmeasurements on soil cores removed fromthe site. Latitude and longitude werepublished to nearest 0.1o. Root biomass only was reported for ‘natural grassland’ (i.e. unburnt). No above-ground data wereavailable. Measurements were made in 1979.Biomass was sampled in a 7 x 7 m plotwithin three 30 x 30 m sites free ofovergrazing effects within an area of‘protected natural grassland’. No standarderrors were available.
98 Vegetation was poplar box open woodland ofcentral-west NSW (Eucalyptus populnea) withextensive shrub understorey comprisingEremophila, Cassia, Myoporum and Acacia. No soils information supplied; althoughreference is made to Moore et al. (1970) in‘Australian Grasslands’ for general soil-shrubassociations. Latitude and longitudesupplied by authors to nearest 1 minute. Noyear of measurement supplied. Overstoreyallometric equations were developed frommeasured DBH and harvesting of above-ground biomass on 20 trees. Shrub allometricequations were developed using DBH
measurements and felling shrubs at groundlevel and weighing plant parts. Biomassestimates were made from 85 quadrats eachof 40 x 50 m from application of allometricequations to DBH measurements. Standarderrors are supplied based on regressionequations applied to sample plots (an overallCV of 18% is quoted as accuracy of predictedbiomass based on the regression equations.The author states that between-plot errorshave been ignored because they ‘woulddominate the final estimation of biomass perhectare’. Hence the true error would belarger than 18%). No root biomass available.
102 Overstorey vegetation was a sclerophyllousscrub-heath in south-west WA dominated byBanksia with a shrub and herb understorey.Soils were deep freely drained sands to atleast 10m depth. Vegetation was disturbed 12 years prior to measurement by fire butnot since. Sampling was conducted in 1984.Latitude and longitude supplied to nearestminute. Biomass was harvested from six 4 x 2 m plots located randomly in the Banksia
stand separated into tissues, dried and massdetermined. Roots were excavated from oneplot at 15 cm intervals to 180 cm depth andthen bulked from 180 to 250 cm. Other rootmass measurements were made by backhoe.Standard deviations are given for above-ground biomass (CV ~30%). Root mass wasreported for one plot only (no standarderrors).
104 Three vegetation communities weresampled; Astrebla grasslands, Openwoodlands and Acacia shrublands. Datacollected pertain to understorey only. Soilsare red, coarse-structured clays. Latitude and longitude supplied to nearest minute. Sitewas enclosed in 1976 to reduce grazingpressure (data reported in Table refer to‘excellent’ range condition class only).Samples were collected at 10 week intervals

Australian Greenhouse Office14
between 1976 and 1977. The site area was 100 x 100 and samples were obtained fromeight 4 x 0.25 m quadrats. No root biomass.No standard errors.
107 Vegetation is a sclerophyllous heathdominated by Leptospermum, Casuarina andBanksia with a secondary layer of shrubs.Soils are described as deep sands of very lowfertility. The stand had been burnt in 1960and final measurements were made in 1966(biomass values appeared to fluctuatearound a constant mean by 4.5 years ofgrowth). Latitude and longitude to nearestminute was supplied by Specht and Jones(1971; Aust. J. Bot, 19, 311 – 326). Biomasswas sampled using 12 x 1 m2 quadratsrandomly placed at the site. All biomass washarvested from within the vertical projectionof each quadrat and dry mass determined. A range of standard errors for total above-ground biomass of 3 – 9% of mean valuewere supplied. No details of below-groundharvesting are supplied but root biomassvalues are given.
115 Vegetation overstorey is a sclerophyll forest dominated by Eucalyptus radiata and E. dalrympleana and an Acacia dominatedunderstorey. Soils are described as ‘red,permeable soils derived from Ordoviciangranite’. Latitude and longitude are suppliedto nearest 0.1o. The forest was cleared in 1927and plots were located in areas of naturallyregenerated forest. The adjacent Douglas-firforest was 50 years old (assume same age asnaturally regenerated eucalypt forest). This would make the year of measurement1977. Tree biomass was determined usingpreviously established allometric equations.Tree DBH was measured for all trees on 6 x 20 m circular plots. No root dataavailable. No standard errors available.
122 Vegetation is arid chenopod shrubland inmid-north SA dominated by Acacia aneura
overstorey, Atriplex vesicaria and Maireana
sedifolia shrubs and various grasses. Soils are a brown calcareous earth containingcarbonate nodules at about 20 cm depth.(Vegetation and soil descriptions given inAndrew and Lange (1986) Aust. J. Ecol. 11,395 – 409.) Latitude and longitude providedto nearest minute. Measurements were madein 1975, 1976 and 1977. The site was in ‘nearpristine condition’ at the commencement of the study and grazing animals wereexcluded by fencing. Shrub biomass wasestimated by the ‘Adelaide Technique’; avisual method of rapidly estimating biomass.Biomass was estimated in 6 plots of 30 x 1.5 m area. Biomass reported in theTable represents average biomass over 15 months of shrubs and grass for the fenced(ungrazed) plots obtained from Figure 2 and Figure 7 of the paper. No standarderrors were supplied by authors. No rootbiomass was supplied.
126 Arid grassland community in centralAustralia dominated by the perennial grassEragrostis eriopoda. Soil was a gradationalred-earth and sandy loam surface. Latitudeand longitude were supplied to nearestminute. Five fixed quadrats 2 x 2 m in areawas established in grass communities.Biomass was estimated by a non-destructivevisual method using regressions of clippedweights against visual weights to calibratethe technique. On additional plots, soil cores 5 cm in diameter to 50 cm depth were takenand roots washed from soil. No details ofpasture condition were provided butbiomass fluctuated about a constant meanfor last 12 months of the study (from whichbiomass was obtained). Latitude andlongitude were supplied to nearest minute.Above-ground measurements were madebetween 1973 and 1975 and root biomass

National Carbon Accounting System Technical Report 15
measurements between 1974 and 1975(biomass reported in Table refers to 12 monthperiod 1974 – 1975). No standard errorsgiven for individual biomass measurements.
127 Vegetation was a temperate mangrovecommunity dominated by Avicennia marina.No soil information provided. Latitude and longitude supplied to nearest minute. No disturbance information provided. Two 30 x 30 m plots were marked off.Measurements were made in 1972. Above-ground tree biomass on plots was estimatedfor trunks only from estimated volume(radius and height measurements) andmeasured woody density. Seedling biomassfrom harvesting selected seedlings in a 50 x 50 cm quadrat dried and weighed. Drymass was calculated by multiplying mass per seedling by seedling abundance. Below-ground mass was determined from five soilcores 8 cm diameter and 40 cm deep. Rootswere washed and dried. Biomass reported in Table is mean of the 2 sites. Standard errorsare supplied for measured root biomass only(~1 – 3% of mean).
128 A Townsville Stylo perennial pasture system.Soils were a ‘Tippera’ clay loam. Latitudeand longitude were supplied to nearestminute. Site was cleared in 1951, croppeduntil 1967 when it was converted to pastureand grazed. Phosphate fertilizer had been applied at variable rates for 20 years prior toexperiment. Measurements were made in1971. Three plots were used 10 x 10 m inarea. Vegetation was harvested in one 0.5 x 0.5 m quadrat in each plot, subsampled,dried and weighed. No root biomass wassupplied. Standard errors are supplied ongraphs of biomass dynamics. Biomassreported in Table was taken from finalbiomass measurements in 1971.
131 Vegetation is pasture in an arid grazingsystem dominated by black box (Eucalyptus
largiflorens) and chenopod shrubs. Soils are amix of heavy-textured grey clay soils andlight-textured red sand soils. Site is locatedinside the Kinchega National Park andfenced since 1967 to exclude grazinganimals. Latitude and longitude areprovided to nearest minute. Measurementswere made between 1980 and 1984. Three0.25 m2 circular plots were positioned atrandom within each site. Photographicstandards were generated for plots of knownbiomass and plot biomass was estimatedvisually as it changed over time. A linearmodel of pasture biomass as a function ofprevious 12 months rainfall was developed.The biomass reported in Table is the pasturebiomass from the linear model at meanannual rainfall. No standard errors wereprovided although the residual standarddeviation of the linear model was provided.No root biomass was provided.
138 Vegetation was two almost pure stands ofEucalyptus delegatensis tall forest. Soils weredeep red-earths. Two sites were studied 49and 25 years old, but only the older forestwas used to obtain data used in Table 1.Location provided from which latitude andlongitude was obtained from AUSLIG maps.No year of measurement was supplied butmust be pre-1980. Five 0.1 ha plots werelocated randomly in the 49 y.o. forest andDBHOB of all trees was measured. Threetrees of ‘about the mean cross-sectional area’were felled and sampled for wood density.Plot biomass was estimated from woodvolume and wood density. The paper reportson dry matter of wood and bark in stemonly. No standard errors were provided. No root mass was provided.

Australian Greenhouse Office16
140 Vegetation was a mature stand of Eucalyptus
pauciflora in the Brindabella Range, nearCanberra. Soil details provided in Keith et al.
(1997; Plant and Soil, 190, 127 – 141). Thestand regenerated naturally from wildfire in 1939 which killed most of the overstorey.The site was last burnt by a fuel reductionburn in 1980. Measurements were made in1993–1994. Plots were 0.04 ha in size andreplicated three times. Biomass data reportedin Table refer to unfertilized plots. Thelocation of the field site was described andlatitude and longitude obtained fromAUSLIG maps. Allometric equations wereestablished from 12 harvested trees and 18 fallen branches and foliage biomassestimated by adding up branch units.Diameter measurements of all trees on each plot were combined with allometricequations to estimate above-ground biomass.Root biomass was estimated from existingliterature sources for root allometricequations and measurements of above-ground biomass. Standard errors ofdifference of means between unfertilized and fertilized plots are reported.
143 Vegetation data obtained for a diverse range of sites located throughout savannawoodlands of Australia ranging fromMitchell Grasslands, semi-arid mulgasavannah to semi-arid woodlands. Soils atthese sites range from cracking clays throughduplex to sandy loams. Of the 21 sitesavailable 9 were selected based on opinion of the authors that these were lowdisturbance sites. Latitude and longitudewere obtained from AUSLIG maps based on location details provided by authors. No year of measurement was provided.Biomass was obtained from measurementson 50 x 50 m plots of height and diameterusing existing allometric equations. No rootbiomass was provided. No standard errors
were supplied; although 95% confidenceintervals of regression models for leafbiomass are provided.
147 Vegetation is a dry sclerophyll scrub systemdominated by Banksia. No soil descriptionswere provided other than to state thatvegetation was growing on ‘windblownnorth-south sand ridges’. Latitude andlongitude were derived from AUSLIG mapsbased on details provided in the paper.Vegetation is situated inside a golf courseand (based on leaf whorl scars of the Banksia)was 28 years old. The shorter vegetation was13 years old but most plots were located inthe tall, older scrub. Measurements weremade in 1975 and 1976. Overstorey biomasswas determined by estimating volume ofstem components and converting this tobiomass using a constant wood density.Understorey vegetation biomass washarvested from 8 x 1 m2 quadrats. Below-ground biomass was estimated by sievingsoil from eight 50 x 75 x 70 cm deep pits. All biomass was oven dried and weighed.No standard errors are provided.
154 Vegetation is an arid saltbush plantcommunity dominated by Atriplex. Soildetails are not provided. The site had beensubjected to normal grazing practice, and it was representative of surrounding area.Location details were provided and latitude and longitude obtained from AUSLIG maps. The experimental plot was 5 acres (~2 ha) inarea. Measurements were made in 1962, 1963and 1964. Biomass was estimated using avisual technique comprising three observersand calibrated using harvested biomass from20 x 1 m2 quadrats. In the experimental plot,50 quadrats were sampled for biomassdetermination. No root biomass wasprovided. No standard errors were provided.

National Carbon Accounting System Technical Report 17
159 Vegetation was arid chenopod shrublanddominated by Atriplex and Maireana in thefar west of NSW. Soils were desert loams orbrown gibbers. The study was performedbetween 1990 and 1993 in which a severedrought occurred from 1991 until 1992 whenrains restored biomass maximal levelsobserved over the three year study. Latitudeand longitude were provided to nearestminute. The study was conducted over fiveproperties, two paddocks per property andsix sites per paddock. Each site comprisedfour permanent 4 x 4 m plots on whichpasture measurements were made. Themethod used to estimate pasture biomasswas the ‘comparative yield technique’calibrated against three quadrats ofharvested biomass. Biomass measures wereobtained from 180 x 0.56 m2 quadrats in eachpaddock measured four times per year.Biomass values used in the Table weremeasured in 1992 after drought breaking rain and comprised an average over fiveproperties and two paddocks per property.No standard errors were provided forbiomass dynamics in the paper. No rootbiomass was provided.
167 Heath vegetation dominated by Banksia,Victoria. Soils are described as sandy.Vegetation was 5 years old and was selectedto be as uniform as possible. Latitude andlongitude were obtained from other studiesby the authors. Measurements were made on 6 x 18 m2 quadrats per harvest. Allvegetation was cut and weighed. Subsamplesdried and weighed. Two soil cores (4.2 cmdiameter and 27 cm depth) were taken ineach quadrat, roots were wet sieved and dryweight determined. Harvests for biomasswere made on six occasions between 1962and 1963. Biomass reported in Table is theaverage over six harvests for unfertilizedcontrol plots. No standard errors wereprovided.
168 Heath vegetation on sandy soils of lownutrient status at three sites (two in Victoriaand one in SA). Time dynamics of biomasspresented from which upper limits wereobtained (i.e. approximate steady statevalues). A location diagram was providedfrom which latitude and longitude wasdetermined using AUSLIG maps. No year ofmeasurement was provided. Above-groundbiomass was harvested from quadrats ofvarious sizes (required because of differencesin vegetation structure) from ~ 1 m2 up to 50 m2. Numbers of quadrats ranged from 6 to 20. Biomass was immediately weighedafter harvesting, sub-sampled and dryweights determined. Soil coring wasperformed on the same quadrats as above(4.2 cm in diameter and up to 150 cm depth)and roots were wet sieved prior to dryweight determinations. No standard errorswere provided.
192 Vegetation was semi-arid woodlandsthroughout Queensland dominated byEucalyptus crebra, E. melanophloia and E. populnea. No soils information wasprovided for sites in the paper. All sites usedin developing allometric equations were‘intact woodlands’ defined as sites notsubject to mechanical or chemical treeclearing for 30 years prior to sampling. Latitude and longitude were provided by theauthors to nearest minute. Permanent sitesconsist of 5 x 100m long transects. Plotscomprise the 100 m transect and are 4 mwide. Allometric equations were developedfor ‘average trees with respect to vigour andfoliage cover for a particular size class’. Siteswere last measured between 1983 and 1998(see Table). Between 20 and 22 stems werefelled in each woodland type adjacent topermanent sites. Plant tissues were sorted,weighed, sub-sampled and dry weightsdetermined. Root biomass was estimated byexcavating lignotubers and also by soil

Australian Greenhouse Office18
coring (4.35 cm diameter to 100 cm depth).Allometric equations were applied to aselection of permanent plots deemed notdisturbed in last 30 years. Componentbiomass values for sites were obtained fromauthors and, as reported in the Table,lignotuber data were grouped with stemmass and root data comprise only fine roots.Standard errors are given in the paper for all biomass components and total biomass(CV between ~14 and 22%).

National Carbon Accounting System Technical Report 19
Site
Desc
riptio
n So
il Ty
pe*
Loca
tion
Loca
tion
Abov
e-
Belo
w-
Year
whe
n M
etho
d of
Cal
cula
tion
Area
Est
imat
eRo
ot:s
hoot
Data
sou
rce
Relia
bilit
yCo
mm
ents
(veg
etat
ion,
soi
l)(L
atitu
de)
(Lon
gitu
de)
grou
ndgr
ound
biom
ass
(Allo
met
ric, e
xpan
sion
and
Basi
s(~
R/S)
(Ref
No.
, (A
GO
Biom
ass
Biom
ass
estim
ated
fact
or e
tc)
(ha,
plo
ts e
tc)
unpu
blis
hed)
Crite
ria)
(t/ha
, (t/
ha,
varia
nce)
varia
nce)
Dry
scle
roph
yll e
ucal
ypt
Dr2.
21-3
7.27
149.
4029
8.57
1981
Prev
ious
ly d
evel
oped
1
ha, p
lot
Ref N
o. 1
6 T
urne
r,fo
rest
(Euc
alyp
tus
sieb
eri)
allo
met
ric e
quat
ions
La
mbe
rt an
d Ho
lmes
, w
ith A
caci
aun
ders
tore
y. ap
plie
d.
Fore
st E
colo
gy a
nd
Red
and
yello
w p
odzo
lic s
oils
.M
anag
emen
t, 19
92
Subt
ropi
cal r
ainf
ores
t. Ba
salt
Gn4.
4-2
8.50
153.
0038
3.30
1965
Tree
s ha
rves
ted,
0.
36 h
a, p
lot
Ref N
o. 1
0 T
urne
r, re
d cl
ay-lo
am s
urfa
ce s
oils
al
lom
etric
equ
atio
nsLa
mbe
rt an
d Ke
lly,
with
cla
y su
b-so
ils.
deve
lope
d an
d ap
plie
d to
An
nals
of B
otan
y, 19
89fo
rest
plo
ts. U
nder
stor
ey
clip
ped
quad
rats
.
Subt
ropi
cal r
ainf
ores
t. Gn
4.4
-28.
5015
3.00
372.
1219
73Tr
ees
harv
este
d,
0.36
ha,
plo
tRe
f No.
10
Tur
ner,
Lam
bert
Basa
lt re
d cl
ay-lo
am s
urfa
ce
allo
met
ric e
quat
ions
and
Kelly
, Ann
als
of
soils
with
cla
y su
b-so
ils.
deve
lope
d an
d Bo
tany
, 198
9ap
plie
d to
fore
st p
lots
.Un
ders
tore
y cl
ippe
d qu
adra
ts.
Subt
ropi
cal r
ainf
ores
t. Gn
4.4
-28.
5015
3.00
385.
0419
81Tr
ees
harv
este
d,
0.36
ha,
plo
tRe
f No.
10
Tur
ner,
Lam
bert
Basa
lt re
d cl
ay-lo
am
allo
met
ric e
quat
ions
and
Kelly
, Ann
als
of
surfa
ce s
oils
with
cla
y de
velo
ped
and
Bota
ny, 1
989
sub-
soils
.ap
plie
d to
fore
st p
lots
. Un
ders
tore
y cl
ippe
d qu
adra
ts.
Euca
lypt
us o
bliq
uafo
rest
. Dy
3.41
-38.
3314
6.25
328.
00Un
know
nPr
evio
usly
dev
elop
ed0.
2 ha
, plo
tRe
f No.
21
Bak
er a
nd A
ttiw
ill,
Clay
-loam
and
loam
soi
ls.
allo
met
ric e
quat
ions
Fo
rest
Eco
logy
and
ap
plie
d.M
anag
emen
t, 19
85
Euca
lypt
us o
bliq
uafo
rest
Gn
4.14
-37.
4314
5.13
374.
5019
77Pr
evio
usly
dev
elop
ed
0.1
ha, p
lot
Ref N
o. 2
3 A
ttiw
ill, A
ustra
lian
with
wel
l dev
elop
ed
allo
met
ric e
quat
ions
Jo
urna
l of B
otan
y, 19
79un
ders
tore
y. Hi
ghly
ap
plie
d.w
eath
ered
bro
wn
friab
le
clay
-loam
s un
iform
to 1
m.
Tall
wet
scl
erop
hyll
fore
st
Dr2.
21-3
0.20
153.
1343
6.06
1978
Tree
s ha
rves
ted,
Un
know
nRe
f No.
29
Tur
ner a
nd L
ambe
rt,
(Euc
alyp
tus
gran
dis)
on
allo
met
ric e
quat
ions
Fo
rest
Eco
logy
and
‘m
oder
ate
to h
igh
ferti
lity’
de
velo
ped
and
appl
ied
Man
agem
ent,
1983
soils
.to
fore
st p
lots
.

Australian Greenhouse Office20
Site
Desc
riptio
n So
il Ty
pe*
Loca
tion
Loca
tion
Abov
e-
Belo
w-
Year
whe
n M
etho
d of
Cal
cula
tion
Area
Est
imat
eRo
ot:s
hoot
Data
sou
rce
Relia
bilit
yCo
mm
ents
(veg
etat
ion,
soi
l)(L
atitu
de)
(Lon
gitu
de)
grou
ndgr
ound
biom
ass
(Allo
met
ric, e
xpan
sion
and
Basi
s(~
R/S)
(Ref
No.
, (A
GO
Biom
ass
Biom
ass
estim
ated
fact
or e
tc)
(ha,
plo
ts e
tc)
unpu
blis
hed)
Crite
ria)
(t/ha
, (t/
ha,
varia
nce)
varia
nce)
Tall
euca
lypt
fore
st o
f mix
ed
Dr2.
21-3
7.00
149.
5043
5.50
Unkn
own
Prev
ious
ly d
evel
oped
Un
know
nRe
f No.
31
Tur
ner a
ndsp
ecie
s. S
oils
are
red-
yello
w
allo
met
ric e
quat
ions
La
mbe
rt, O
ecol
ogia
, 198
6po
dzol
ics
with
poo
r stru
ctur
e ap
plie
d.
and
low
nut
rient
sta
tus.
Wet
scl
erop
hyll
fore
st
Gn4.
14-3
7.42
145.
1383
1.10
1967
Tree
s ha
rves
ted,
Un
know
nRe
f No.
44
Ash
ton,
Jou
rnal
(Euc
alyp
tus
regn
ans)
al
lom
etric
equ
atio
ns
of E
colo
gy, 1
976
with
shr
ub u
nder
stor
ey.
deve
lope
d an
d Co
arse
text
ured
bro
wn
loam
s ap
plie
d to
fore
st p
lots
.to
60
cm g
radi
ng to
red-
br
own
clay
loam
s to
1.6
m.
Dry
scle
roph
yll f
ores
t Gn
4.14
-37.
4214
5.13
928.
5019
67Tr
ees
harv
este
d,
Unkn
own
Ref N
o. 4
4 A
shto
n, J
ourn
al
(Euc
alyp
tus
sieb
eria
nd
allo
met
ric e
quat
ions
of
Eco
logy
, 197
6E.
obl
iqua
). Fi
ne s
truct
ured
de
velo
ped
and
brow
n to
dar
k-gr
ey c
lays
, ap
plie
d to
fore
st p
lots
.gr
adin
g to
yel
low
-bro
wn
clay
s to
1.5
- 2.
2 m
.
Wet
scl
erop
hyll
fore
st
Dy3.
4-3
7.43
145.
5865
4.30
63.2
019
78Tr
ees
harv
este
d,
0.08
ha,
plo
t0.
09Re
f No.
46
Fel
ler,
(Euc
alyp
tus
regn
ans)
with
al
lom
etric
equ
atio
ns
Aust
ralia
n Jo
urna
l of
shru
b un
ders
tore
y. W
ell
deve
lope
d an
d ap
plie
d Ec
olog
y, 19
80st
ruct
ured
dar
k-br
own
to fo
rest
plo
ts.
soil
grad
ing
to y
ello
w-
Unde
rsto
rey
clip
ped
brow
n cl
ays
at d
epth
.qu
adra
ts.
Dry
scle
roph
yll f
ores
t Dy
3.4
-37.
4314
5.58
373.
4045
.40
1978
Tree
s ha
rves
ted,
0.
08 h
a, p
lot
0.11
Ref N
o. 4
6 F
elle
r, (E
ucal
yptu
s ob
liqua
and
allo
met
ric e
quat
ions
Au
stra
lian
Jour
nal o
f E.
div
es).
Soils
wer
e w
ell
deve
lope
d an
d ap
plie
d Ec
olog
y, 19
80st
ruct
ured
with
gre
y
to fo
rest
plo
ts.
surfa
ce g
radi
ng to
ora
nge-
Un
ders
tore
y cl
ippe
d br
own
clay
s at
dep
th.
quad
rats
.
Plan
tatio
n fo
rest
(Euc
alyp
tus
Dy3.
41-3
0.42
153.
0043
6.06
1978
Tree
s ha
rves
ted,
Un
know
nRe
f No.
51
Bra
dsto
ck,
gran
dis)
. Soi
ls w
ere
deriv
ed
allo
met
ric e
quat
ions
Au
stra
lian
Fore
st
form
Low
er P
erm
ian
deve
lope
d an
d ap
plie
d Re
sear
ch, 1
981
sedi
men
ts.
to fo
rest
plo
ts.

National Carbon Accounting System Technical Report 21
Unev
en-a
ged
scle
roph
yll
Dr2.
21-3
7.42
149.
5532
7.30
1976
Tree
s ha
rves
ted,
1.
7 ha
, plo
tRe
f No.
61
Ste
war
t, Fl
inn
fore
st (E
ucaly
ptus
agg
lom
erat
a,al
lom
etric
equ
atio
ns
and
Aebe
rli, A
ustra
lian
E. m
uelle
rana
, E. s
iebe
ri)
deve
lope
d an
d Jo
urna
l of B
otan
y, 19
79w
ith d
evel
oped
und
erst
orey
ap
plie
d to
fore
st
on D
uple
x so
ils o
f loa
ms
on
plot
s. U
nder
stor
ey
mot
tled
yello
w c
lays
).cl
ippe
d qu
adra
ts.
Tall
open
scl
erop
hyll
fore
st
Dy3.
62-3
4.45
116.
0324
9.59
10.5
219
80Tr
ees
harv
este
d,
0.25
ha,
plo
t0.
04Re
f No.
66
Gro
ve a
nd
(Euc
alyp
tus
dive
rsic
olor
) with
al
lom
etric
equ
atio
ns
Mal
ajcz
uk ,
Fore
st E
colo
gy
dens
e un
ders
tore
y. ‘R
ed E
arth
’ de
velo
ped
and
and
Man
agem
ent,
soils
.ap
plie
d to
fore
st p
lots
. 19
85a
& b
Unde
rsto
rey
clip
ped
quad
rats
.
Sem
i-arid
woo
dlan
ds
Ug5.
1-2
2.98
150.
2718
4.74
1997
Tree
s ha
rves
ted,
1
ha, p
lot
Ref N
o. 1
92 B
urro
ws,
(E
ucal
yptu
s cr
ebra
). (1
997)
.al
lom
etric
equ
atio
ns
Hoffm
ann,
Com
pton
, No
soi
ls in
form
atio
n de
velo
ped
and
appl
ied
Back
and
Tai
t, pr
ovid
ed.
to w
oodl
and
plot
s.Au
stra
lian
Jour
nal
of B
otan
y, 20
00
Sem
i-arid
woo
dlan
ds
Gn3.
12-2
3.07
150.
2015
8.24
1992
Deve
lope
d al
lom
etric
1
ha, p
lot
Ref N
o. 1
92 B
urro
ws,
(E
ucal
yptu
s cr
ebra
). (1
992)
. eq
uatio
ns a
pplie
d Ho
ffman
n, C
ompt
on,
No s
oils
info
rmat
ion
to w
oodl
and
plot
s.Ba
ck a
nd T
ait,
prov
ided
.Au
stra
lian
Jour
nal
of B
otan
y, 20
00
Sem
i-arid
woo
dlan
ds
Ug5.
2-2
2.45
148.
7299
.70
1994
Deve
lope
d al
lom
etric
1
ha, p
lot
Ref N
o. 1
92 B
urro
ws,
(E
ucal
yptu
s po
puln
ea).
equa
tions
app
lied
Hoffm
ann,
Com
pton
, (1
994)
. No
soils
to
woo
dlan
d pl
ots.
Back
and
Tai
t, in
form
atio
n pr
ovid
ed.
Aust
ralia
n Jo
urna
l of
Bot
any,
2000
Tallg
rass
Sav
anna
. No
soils
Dy
3.43
-12.
6713
2.92
3.10
1980
Clip
ped
quad
rats
.0.
0075
ha,
Re
f No.
6 C
ook
and
Andr
ew,
deta
ils p
rovi
ded.
quad
rat
Aust
ralia
n Jo
urna
l of E
colo
gy,
1991
Tallg
rass
Sav
anna
. No
soils
Dy
3.43
-12.
6713
2.92
3.00
1980
Clip
ped
quad
rats
.0.
0075
ha,
Re
f No.
6 C
ook
and
Andr
ew,
deta
ils p
rovi
ded.
quad
rat
Aust
ralia
n Jo
urna
l of E
colo
gy,
1991
Acac
iaha
rpop
hylla
Ug5.
2-2
4.50
149.
8011
8.80
1982
Tree
s ha
rves
ted,
0.
01 h
a, p
lot
Ref N
o. 7
Sca
nlan
, w
oodl
and.
Dup
lex
soil
with
al
lom
etric
equ
atio
ns
Aust
ralia
n Jo
urna
l sa
ndy
clay
-loam
sur
face
de
velo
ped
and
appl
ied
of E
colo
gy, 1
991
laye
r.to
fore
st p
lots
.

Australian Greenhouse Office22
Site
Desc
riptio
n So
il Ty
pe*
Loca
tion
Loca
tion
Abov
e-
Belo
w-
Year
whe
n M
etho
d of
Cal
cula
tion
Area
Est
imat
eRo
ot:s
hoot
Data
sou
rce
Relia
bilit
yCo
mm
ents
(veg
etat
ion,
soi
l)(L
atitu
de)
(Lon
gitu
de)
grou
ndgr
ound
biom
ass
(Allo
met
ric, e
xpan
sion
and
Basi
s(~
R/S)
(Ref
No.
, (A
GO
Biom
ass
Biom
ass
estim
ated
fact
or e
tc)
(ha,
plo
ts e
tc)
unpu
blis
hed)
Crite
ria)
(t/ha
, (t/
ha,
varia
nce)
varia
nce)
Euca
lypt
and
sub
tropi
cal
Gn2.
74-3
3.55
150.
3750
0.75
91.8
019
81 &
Al
lom
etric
equ
atio
ns
33.2
ha,
0.
15Re
f No.
28
Ash
and
ra
info
rest
. Soi
ls a
re g
rey
1984
deve
lope
d fro
m
poin
t-He
lman
, Cun
ning
ham
ia,
leac
hed
sand
s ov
erly
ing
a fa
llen
trees
in
sam
plin
g19
90ye
llow
-gre
y cl
ay B
hor
izon.
adja
cent
fore
st.
Woo
dlan
d (A
caci
aGn
2.12
-27.
2814
9.75
118.
8040
.70
1964
/196
5Bi
omas
s ha
rves
ted
0.4
ha, p
lot
0.26
Ref N
o. 3
3 M
oore
, Rus
sell
harp
ophy
lla) o
n gi
lgai
ed
on p
lots
.an
d Co
aldr
ake,
cl
ay s
oils
.Au
stra
lian
Jour
nal o
f Bo
tany
, 196
7
Xeric
shr
ub c
omm
unity
Uc
1.2
-26.
4214
6.22
0.78
1971
Biom
ass
harv
este
d 0.
09 h
a, p
lot
Ref N
o. 3
6 B
urro
ws,
(E
rem
ophi
la g
ilesi
i) on
on
plo
ts.
Aust
ralia
nla
terit
ic re
d ea
rth s
oils
.Jo
urna
l of B
otan
y, 19
72
Xeric
shr
ub c
omm
unity
Um
5.41
-31.
9014
1.45
0.91
Unkn
own
Clip
ped
quad
rats
.Un
know
nRe
f No.
37
Cha
rley
and
(Atri
plex
ves
icar
ia).
Soils
Co
wlin
g, P
roce
edin
gs o
f ar
e de
ep a
nd fi
ne te
xtur
ed.
the
Ecol
ogic
al S
ocie
ty o
f Au
stra
lia, 1
968
Low
scl
erop
hyll
fore
st
Uc1.
21-2
7.70
153.
4510
3.63
76.4
919
73Bi
omas
s ha
rves
ted
0.02
5 ha
, plo
t0.
42Re
f No.
38
Wes
tman
and
(E
ucal
yptu
s) w
ith a
wel
l on
plo
ts.
Roge
rs, A
ustra
lian
Jour
nal
deve
lope
d un
ders
tore
y of
of
Bot
any,
1977
shru
bs, g
rass
es a
nd h
erbs
. Sa
ndy
soils
.
Dry
scle
roph
yll f
ores
t KS
-Uc4
.2-3
2.67
116.
0826
6.20
1977
Tree
s ha
rves
ted,
0.
36 h
a, p
lot
Ref N
o. 4
1 H
ings
ton,
(E
ucal
yptu
s m
argi
nata
allo
met
ric e
quat
ions
Di
mm
ock
and
Turto
n,
and
E. c
alop
hylla
) with
de
velo
ped
and
Fore
st E
colo
gy a
nd
unde
rsto
rey
of s
hrub
s an
d ap
plie
d to
fore
st
Man
agem
ent,
1980
/81
herb
s. S
oils
are
late
ritic
pl
ots.
sand
y gr
avel
s.
Mul
ga v
eget
atio
n in
sou
th-
Gn2.
12-2
6.68
146.
1748
.37
1972
/Bi
omas
s ha
rves
ted
Unkn
own
Ref N
o. 5
9 P
ress
land
, w
est Q
ueen
slan
d (A
caci
a19
75on
plo
ts.
Aust
ralia
n Jo
urna
l of
aneu
ra).
No s
oils
info
rmat
ion
Bota
ny, 1
975
prov
ided
.
Mul
ga v
eget
atio
n in
sou
th-
Dr1.
33-2
6.33
146.
2746
.64
1972
/Bi
omas
s ha
rves
ted
Unkn
own
Ref N
o. 5
9 P
ress
land
, w
est Q
ueen
slan
d (A
caci
a19
75on
plo
ts.
Aust
ralia
n Jo
urna
l of
aneu
ra).
No s
oils
info
rmat
ion
Bota
ny, 1
975
prov
ided
.

National Carbon Accounting System Technical Report 23
Mul
ga v
eget
atio
n in
sou
th-
Ug5.
2-2
6.38
146.
2541
.89
1972
/Bi
omas
s ha
rves
ted.
Unkn
own
Ref N
o. 5
9 P
ress
land
, w
est Q
ueen
slan
d (A
caci
a19
75Au
stra
lian
Jour
nal o
f an
eura
). No
soi
ls in
form
atio
n on
plo
ts.
Bota
ny, 1
975
prov
ided
.
Arid
sal
tbus
h an
d ch
enop
od
Um5.
11-3
2.12
139.
371.
3419
72Vi
sual
met
hod
usin
g Un
know
n,Re
f No.
60
Nob
le ,
shru
blan
d (A
tripl
ex v
esic
aria
phot
o-po
ints
po
int-s
ampl
ing
Aust
ralia
n Jo
urna
l of
and
Mai
rean
a se
difo
lia).
No
calib
rate
d by
clip
ped
Bota
ny, 1
977
soils
info
rmat
ion
prov
ided
.qu
adra
ts.
Scler
ophy
ll fo
rest
on
Fras
er Is
.Uc
1.21
-25.
4715
3.07
267.
4019
3.00
Unkn
own
Biom
ass
harv
este
d Un
know
n0.
42Re
f No.
64
App
lega
te,
(Euc
alyp
tus
pilu
laris
) gro
win
g on
plo
ts.
Aust
ralia
n Fo
rest
ry,
on n
utrie
nt p
oor s
ilice
ous
1989
sand
s.
Arid
sal
tbus
h sh
rubl
and
Ug5.
2-3
5.03
144.
973.
5419
69Cl
ippe
d qu
adra
ts.
Unkn
own
Ref N
o. 7
2 R
ixon
, In
(Atri
plex
ves
icar
iaan
d ‘T
he B
iolo
gy o
f Atri
plex
’, Ko
chia
aph
ylla
), gr
asse
s 19
69an
d he
rbs.
No
soils
in
form
atio
n pr
ovid
ed.
Open
woo
dlan
d (E
ucal
yptu
sGn
2.12
-14.
6013
2.20
19.6
019
79So
il co
res
and
0.01
47 h
a,
Ref N
o. 8
4 B
ridge
, Mot
t fo
elsc
hean
a) w
ith g
rass
ro
ot e
xtra
ctio
n.pl
otan
d Ha
rtiga
n, A
ustra
lian
unde
rsto
rey.
Soils
Jo
urna
l of S
oil R
esea
rch,
‘re
pres
enta
tive
of th
e 19
83w
ides
prea
d Ti
pper
a fa
mily
of
the
Kath
erin
e-Da
rwin
ar
ea’.
Open
woo
dlan
d (E
ucal
yptu
sGn
2.13
-30.
9214
6.50
54.7
2Un
know
nAl
lom
etric
equ
atio
ns
17 h
a, p
lot
Ref N
o. 9
8 H
arrin
gton
, po
puln
ea) w
ith s
hrub
de
velo
ped
for s
mal
l Au
stra
lian
Jour
nal o
f un
ders
tore
y (E
rem
ophi
la,
trees
and
shr
ubs
and
Bota
ny, 1
979
Cass
ia, M
yopo
rum
& A
caci
a).
appl
ied
to w
oodl
and
No s
oils
info
rmat
ion
supp
lied.
plot
s.
Astre
bla
gras
slan
ds o
n re
d,
Uc5.
21-2
3.70
133.
884.
019
76/
Clip
ped
quad
rats
.0.
0008
ha,
Re
f No.
104
Frie
del P
art I
, co
arse
-stru
ctur
ed c
lays
.19
77qu
adra
tAu
stra
lian
Jour
nal o
f Bo
tany
, 198
1
Open
woo
dlan
d on
red,
Uc
5.21
-23.
7013
3.88
2.6
1976
/Cl
ippe
d qu
adra
ts.
0.00
08 h
a,
Ref N
o. 1
04 F
riede
l Par
t I,
coar
se-s
truct
ured
cla
ys.
1977
quad
rat
Aust
ralia
n Jo
urna
l of
Bota
ny, 1
981
Acac
iash
rubl
ands
on
red,
Uc
5.21
-23.
7013
3.88
1.3
1976
/Cl
ippe
d qu
adra
ts.
0.00
08 h
a,
Ref N
o. 1
04 F
riede
l Par
t I,
coar
se-s
truct
ured
cla
ys.
1977
quad
rat
Aust
ralia
n Jo
urna
l of
Bota
ny, 1
981

Australian Greenhouse Office24
Site
Desc
riptio
n So
il Ty
pe*
Loca
tion
Loca
tion
Abov
e-
Belo
w-
Year
whe
n M
etho
d of
Cal
cula
tion
Area
Est
imat
eRo
ot:s
hoot
Data
sou
rce
Relia
bilit
yCo
mm
ents
(veg
etat
ion,
soi
l)(L
atitu
de)
(Lon
gitu
de)
grou
ndgr
ound
biom
ass
(Allo
met
ric, e
xpan
sion
and
Basi
s(~
R/S)
(Ref
No.
, (A
GO
Biom
ass
Biom
ass
estim
ated
fact
or e
tc)
(ha,
plo
ts e
tc)
unpu
blis
hed)
Crite
ria)
(t/ha
, (t/
ha,
varia
nce)
varia
nce)
Scle
roph
yll f
ores
t Gn
2.14
-35.
6014
8.10
133.
6219
77Pr
evio
usly
dev
elop
ed
0.75
4 ha
, Re
f No.
115
Tur
ner,
(Euc
alyp
tus
radi
ata
&
allo
met
ric e
quat
ions
pl
otAu
stra
lian
Fore
st
E. d
alry
mpl
eana
) with
ap
plie
d.Re
sear
ch, 1
980
Acac
iaun
ders
tore
y on
re
d, p
erm
eabl
e so
ils
deriv
ed fr
om O
rdov
icia
n gr
anite
.
Arid
che
nopo
d sh
rubl
and
Gc1.
12-3
2.88
137.
380.
519
75/
Visu
al m
etho
d 0.
027
ha, p
lot
Ref N
o. 1
22 A
ndre
w a
nd
(Aca
cia
aneu
ra, A
tripl
ex
1976
/ca
libra
ted
by c
lippe
d La
nge,
Aus
tralia
n ve
sica
ria&
Mai
rean
a19
77qu
adra
ts.
Jour
nal o
f Eco
logy
, 198
6se
difo
lia).
Soils
are
a b
row
n ca
lcar
eous
earth
con
tain
ing
carb
onat
e no
dule
s at
abo
ut
20 c
m d
epth
.
Arid
che
nopo
d sh
rubl
and
Gc1.
12-3
2.88
137.
380.
519
75/
Visu
al m
etho
d 0.
027
ha,
Ref N
o. 1
22 A
ndre
w a
nd
(Aca
cia
aneu
ra, A
tripl
ex19
76/
calib
rate
d by
clip
ped
plot
Lang
e, A
ustra
lian
vesi
caria
& M
aire
ana
1977
quad
rats
.Jo
urna
l of E
colo
gy, 1
986
sedi
folia
). So
ils a
re a
bro
wn
calc
areo
usea
rth c
onta
inin
g ca
rbon
ate
nodu
les
at a
bout
20
cm
dep
th.
Tem
pera
te m
angr
ove
Dy3.
41-3
3.82
151.
1512
8.50
153.
8019
72Pr
evio
usly
dev
elop
ed0.
18 h
a, p
lot
0.54
Ref N
o. 1
27 B
riggs
, co
mm
unity
(Avi
cenn
ia m
arin
a).
allo
met
ric e
quat
ions
Aust
ralia
n Jo
urna
l No
soi
ls in
form
atio
n pr
ovid
ed.
appl
ied.
of
Eco
logy
, 197
7
Tow
nsvi
lle-S
tylo
per
enni
al
Gn2.
12-1
4.47
132.
322.
019
71Cl
ippe
d qu
adra
ts.
0.03
ha,
plo
tRe
f No.
128
Ive
, pa
stur
e. S
oils
wer
e a
Aust
ralia
n Jo
urna
l ‘T
ippe
ra’ c
lay
loam
.of
Eco
logy
, 197
6
Past
ure
in a
n ar
id g
razin
g Ug
5.2
-32.
4214
2.42
0.4
1980
Vi
sual
met
hod
usin
g0.
0000
6 ha
, Re
f No.
131
Rob
erts
on,
syst
em d
omin
ated
by
& 1
984
phot
o-po
ints
quad
rat
Aust
ralia
n Jo
urna
l Eu
caly
ptus
larg
iflor
ens
and
calib
rate
d by
of
Eco
logy
, 198
8ch
enop
od s
hrub
s. S
oils
are
a
clip
ped
quad
rats
.m
ix o
f hea
vy te
xtur
e gr
ey c
lays
an
d lig
ht te
xtur
ed re
d sa
nds.
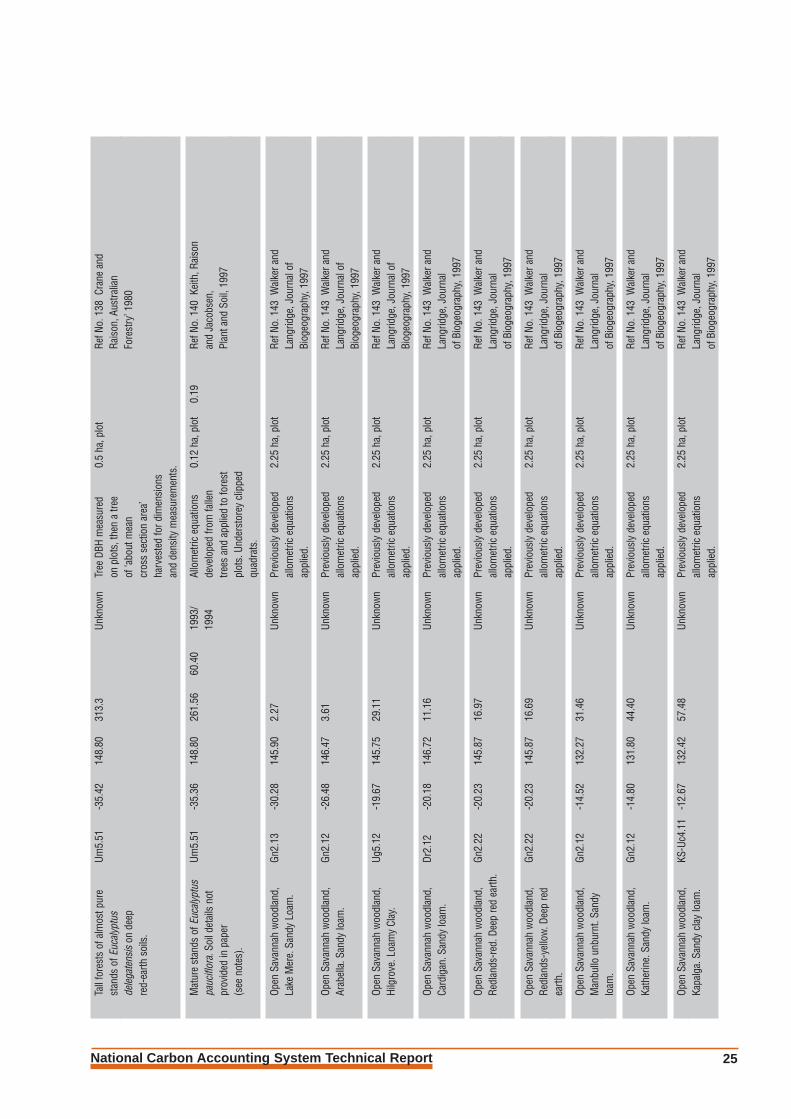
National Carbon Accounting System Technical Report 25
Tall
fore
sts
of a
lmos
t pur
e Um
5.51
-35.
4214
8.80
313.
3Un
know
nTr
ee D
BH m
easu
red
0.5
ha, p
lot
Ref N
o. 1
38 C
rane
and
stan
ds o
f Euc
alyp
tus
on p
lots
, the
n a
tree
Rais
on, A
ustra
lian
dele
gate
nsis
on d
eep
of ‘a
bout
mea
nFo
rest
ry’ 1
980
red-
earth
soi
ls.
cros
s se
ctio
n ar
ea’
harv
este
d fo
r dim
ensi
ons
and
dens
ity m
easu
rem
ents
.
Mat
ure
stan
ds o
f Euc
alyp
tus
Um5.
51-3
5.36
148.
8026
1.56
60.4
019
93/
Allo
met
ric e
quat
ions
0.12
ha,
plo
t0.
19Re
f No.
140
Kei
th, R
aiso
npa
ucifl
ora.
Soi
l det
ails
not
19
94de
velo
ped
from
falle
nan
d Ja
cobs
en,
prov
ided
in p
aper
tre
es a
nd a
pplie
d to
fore
st
Plan
t and
Soi
l, 19
97(s
ee n
otes
).pl
ots.
Und
erst
orey
clip
ped
quad
rats
.
Open
Sav
anna
h w
oodl
and,
Gn
2.13
-30.
2814
5.90
2.27
Unkn
own
Prev
ious
ly d
evel
oped
2.25
ha,
plo
tRe
f No.
143
Wal
ker a
nd
Lake
Mer
e. S
andy
Loa
m.
allo
met
ric e
quat
ions
La
ngrid
ge, J
ourn
al o
f ap
plie
d.Bi
ogeo
grap
hy, 1
997
Open
Sav
anna
h w
oodl
and,
Gn
2.12
-26.
4814
6.47
3.61
Unkn
own
Prev
ious
ly d
evel
oped
2.
25 h
a, p
lot
Ref N
o. 1
43 W
alke
r and
Ar
abel
la. S
andy
loam
.al
lom
etric
equ
atio
ns
Lang
ridge
, Jou
rnal
of
appl
ied.
Bi
ogeo
grap
hy, 1
997
Open
Sav
anna
h w
oodl
and,
Ug
5.12
-19.
6714
5.75
29.1
1Un
know
nPr
evio
usly
dev
elop
ed
2.25
ha,
plo
tRe
f No.
143
Wal
ker a
nd
Hilg
rove
. Loa
my
Clay
.al
lom
etric
equ
atio
ns
Lang
ridge
, Jou
rnal
of
appl
ied.
Bi
ogeo
grap
hy, 1
997
Open
Sav
anna
h w
oodl
and,
Dr
2.12
-20.
1814
6.72
11.1
6Un
know
nPr
evio
usly
dev
elop
ed
2.25
ha,
plo
tRe
f No.
143
Wal
ker a
nd
Card
igan
. San
dy lo
am.
allo
met
ric e
quat
ions
La
ngrid
ge, J
ourn
al
appl
ied.
of
Bio
geog
raph
y, 19
97
Open
Sav
anna
h w
oodl
and,
Gn
2.22
-20.
2314
5.87
16.9
7Un
know
nPr
evio
usly
dev
elop
ed2.
25 h
a, p
lot
Ref N
o. 1
43 W
alke
r and
Redl
ands
-red
. Dee
p re
d ea
rth.
allo
met
ric e
quat
ions
La
ngrid
ge, J
ourn
alap
plie
d.
of B
ioge
ogra
phy,
1997
Open
Sav
anna
h w
oodl
and,
Gn
2.22
-20.
2314
5.87
16.6
9Un
know
nPr
evio
usly
dev
elop
ed2.
25 h
a, p
lot
Ref N
o. 1
43 W
alke
r and
Re
dlan
ds-y
ello
w. D
eep
red
allo
met
ric e
quat
ions
Lang
ridge
, Jou
rnal
ea
rth.
appl
ied.
of
Bio
geog
raph
y, 19
97
Open
Sav
anna
h w
oodl
and,
Gn
2.12
-14.
5213
2.27
31.4
6Un
know
nPr
evio
usly
dev
elop
ed
2.25
ha,
plo
tRe
f No.
143
Wal
ker a
nd
Man
bullo
unb
urnt
. San
dy
allo
met
ric e
quat
ions
La
ngrid
ge, J
ourn
al
loam
.ap
plie
d.
of B
ioge
ogra
phy,
1997
Open
Sav
anna
h w
oodl
and,
Gn
2.12
-14.
8013
1.80
44.4
0Un
know
nPr
evio
usly
dev
elop
ed
2.25
ha,
plo
tRe
f No.
143
Wal
ker a
nd
Kath
erin
e. S
andy
loam
.al
lom
etric
equ
atio
ns
Lang
ridge
, Jou
rnal
ap
plie
d.
of B
ioge
ogra
phy,
1997
Open
Sav
anna
h w
oodl
and,
KS
-Uc4
.11
-12.
6713
2.42
57.4
8Un
know
nPr
evio
usly
dev
elop
ed
2.25
ha,
plo
tRe
f No.
143
Wal
ker a
nd
Kapa
lga.
San
dy c
lay
loam
.al
lom
etric
equ
atio
ns
Lang
ridge
, Jou
rnal
ap
plie
d.
of B
ioge
ogra
phy,
1997

Australian Greenhouse Office26
Site
Desc
riptio
n So
il Ty
pe*
Loca
tion
Loca
tion
Abov
e-
Belo
w-
Year
whe
n M
etho
d of
Cal
cula
tion
Area
Est
imat
eRo
ot:s
hoot
Data
sou
rce
Relia
bilit
yCo
mm
ents
(veg
etat
ion,
soi
l)(L
atitu
de)
(Lon
gitu
de)
grou
ndgr
ound
biom
ass
(Allo
met
ric, e
xpan
sion
and
Basi
s(~
R/S)
(Ref
No.
, (A
GO
Biom
ass
Biom
ass
estim
ated
fact
or e
tc)
(ha,
plo
ts e
tc)
unpu
blis
hed)
Crite
ria)
(t/ha
, (t/
ha,
varia
nce)
varia
nce)
Arid
sal
tbus
h do
min
ated
by
Ug5.
2-3
5.03
144.
972.
8319
62Vi
sual
met
hod
0.00
2 ha
, Re
f No.
154
Lei
gh a
nd
Atrip
lex
vesi
caria
. No
soils
ca
libra
ted
by
quad
rat
Mul
ham
, Aus
tralia
n in
form
atio
n pr
ovid
ed.
clip
ped
quad
rats
.Jo
urna
l of E
xper
imen
tal
Agric
ultu
re a
nd A
nim
al
Husb
andr
y, 19
66
Arid
sal
tbus
h do
min
ated
by
Ug5.
2-3
5.03
144.
972.
7119
63Vi
sual
met
hod
0.00
2 ha
, Re
f No.
154
Lei
gh a
nd
Atrip
lex
vesi
caria
. No
soils
ca
libra
ted
by
quad
rat
Mul
ham
, Aus
tralia
n in
form
atio
n pr
ovid
ed.
clip
ped
quad
rats
.Jo
urna
l of E
xper
imen
tal
Agric
ultu
re a
nd A
nim
al
Husb
andr
y, 19
66
Arid
sal
tbus
h do
min
ated
by
Ug5.
2-3
5.03
144.
972.
7719
64Vi
sual
met
hod
0.00
2 ha
,Re
f No.
154
Lei
gh a
nd
Atrip
lex
vesi
caria
. No
soils
ca
libra
ted
by
quad
rat
Mul
ham
, Aus
tralia
n in
form
atio
n pr
ovid
ed.
clip
ped
quad
rats
.Jo
urna
l of E
xper
imen
tal
Agric
ultu
re a
nd A
nim
al
Husb
andr
y, 19
66
Arid
che
nopo
d sh
rubl
and
Um5.
41-3
1.90
141.
501.
1019
92Vi
sual
met
hod
0.01
01 h
a,
Ref N
o. 1
59 R
oshi
er
(Atri
plex
vei
scar
ia&
ca
libra
ted
by
quad
rat
and
Nico
l, Ra
ngel
and
Mai
rean
a se
difo
lia).
clip
ped
quad
rats
.Jo
urna
l, 19
98So
ils w
ere
dese
rt lo
ams
or b
row
n gi
bber
s.
Sem
i-arid
woo
dlan
ds
Gn2.
11-2
3.08
149.
3368
.91
1997
Tree
s ha
rves
ted,
1
ha, p
lot
Ref N
o. 1
92 B
urro
ws,
(E
ucal
yptu
s cr
ebra
). (1
997)
. al
lom
etric
equ
atio
ns
Hoffm
ann,
Com
pton
, No
soi
ls in
form
atio
n de
velo
ped
and
appl
ied
Back
and
Tai
t, pr
ovid
ed.
to w
oodl
and
plot
s.Au
stra
lian
Jour
nal o
f Bo
tany
, 200
0
Sem
i-arid
woo
dlan
ds
Um1.
43-2
2.85
147.
3244
.60
1994
Deve
lope
d al
lom
etric
1
ha, p
lot
Ref N
o. 1
92 B
urro
ws,
(E
ucal
yptu
s cr
ebra
). eq
uatio
ns a
pplie
d to
Ho
ffman
n, C
ompt
on,
(199
4). N
o so
ils
woo
dlan
d pl
ots.
Ba
ck a
nd T
ait,
Aust
ralia
nin
form
atio
n pr
ovid
ed.
Jour
nal o
f Bot
any,
2000
Sem
i-arid
woo
dlan
ds
Db1.
13-2
4.95
149.
8078
.64
1992
Deve
lope
d al
lom
etric
1
ha, p
lot
Ref N
o. 1
92 B
urro
ws,
(E
ucal
yptu
s cr
ebra
). eq
uatio
ns a
pplie
d to
Ho
ffman
n, C
ompt
on,
(199
2). N
o so
ils
woo
dlan
d pl
ots.
Ba
ck a
nd T
ait,
Aust
ralia
n in
form
atio
n pr
ovid
ed.
Jour
nal o
f Bot
any,
2000

National Carbon Accounting System Technical Report 27
Sem
i-arid
woo
dlan
ds
Dy3.
42-2
2.57
149.
5318
4.06
1992
Deve
lope
d al
lom
etric
1
ha, p
lot
Ref N
o. 1
92 B
urro
ws,
(Euc
alyp
tus
creb
ra).
equa
tions
app
lied
to
Hoffm
ann,
Com
pton
, (1
992)
. No
soils
w
oodl
and
plot
s.Ba
ck a
nd T
ait,
Aust
ralia
n in
form
atio
n pr
ovid
ed.
Jour
nal o
f Bot
any,
2000
Sem
i-arid
woo
dlan
ds
Uf6.
61-2
3.58
150.
9044
.91
1992
Deve
lope
d al
lom
etric
1 ha
, plo
tRe
f No.
192
Bur
row
s,
(Euc
alyp
tus
creb
ra).
equa
tions
app
lied
to
Hoffm
ann,
Com
pton
, (1
992)
. No
soils
w
oodl
and
plot
s.Ba
ck a
nd T
ait,
Aust
ralia
nin
form
atio
n pr
ovid
ed.
Jour
nal o
f Bot
any,
2000
Sem
i-arid
woo
dlan
ds
Dy2.
43-2
3.82
149.
9098
.42
1992
Deve
lope
d al
lom
etric
1
ha, p
lot
Ref N
o. 1
92 B
urro
ws,
(E
ucal
yptu
s cr
ebra
). eq
uatio
ns a
pplie
d to
Ho
ffman
n, C
ompt
on, B
ack
(199
2). N
o so
ils
woo
dlan
d pl
ots.
and
Tait,
Aus
tralia
n Jo
urna
lin
form
atio
n pr
ovid
ed.
of B
otan
y, 20
00
Sem
i-arid
woo
dlan
ds
Gn2.
11-2
3.68
149.
5214
2.20
1995
Deve
lope
d al
lom
etric
1
ha, p
lot
Ref N
o. 1
92 B
urro
ws,
(E
ucal
yptu
s cr
ebra
). eq
uatio
ns a
pplie
d to
Ho
ffman
n, C
ompt
on,
(199
5). N
o so
ils
woo
dlan
d pl
ots.
Ba
ck a
nd T
ait,
Aust
ralia
n in
form
atio
n pr
ovid
ed.
Jour
nal o
f Bot
any,
2000
Sem
i-arid
woo
dlan
ds
Dr2.
12-2
0.30
147.
3537
.82
1998
Deve
lope
d al
lom
etric
1 ha
, plo
tRe
f No.
192
Bur
row
s,(E
ucal
yptu
s cr
ebra
). eq
uatio
ns a
pplie
d to
Ho
ffman
n, C
ompt
on, B
ack
(199
8). N
o so
ilsw
oodl
and
plot
s.
and
Tait,
Aus
tralia
n in
form
atio
n pr
ovid
ed.
Jour
nal o
f Bot
any,
2000
Sem
i-arid
woo
dlan
ds
Ug5.
12-2
1.32
148.
358.
1519
98De
velo
ped
allo
met
ric
1 ha
, plo
tRe
f No.
192
Bur
row
s,
(Euc
alyp
tus
creb
ra).
equa
tions
app
lied
toHo
ffman
n, C
ompt
on, B
ack
(199
8). N
o so
ils
woo
dlan
d pl
ots.
an
d Ta
it, A
ustra
lian
info
rmat
ion
prov
ided
.Jo
urna
l of B
otan
y, 20
00
Sem
i-arid
woo
dlan
ds
Dr2.
12-2
4.18
150.
1346
.39
1995
Deve
lope
d al
lom
etric
1 ha
, plo
tRe
f No.
192
Bur
row
s,
(Euc
alyp
tus
mel
anop
hloi
a).
equa
tions
app
lied
to
Hoffm
ann,
Com
pton
, Bac
k(1
995)
. No
soils
w
oodl
and
plot
s.an
d Ta
it, A
ustra
lian
info
rmat
ion
prov
ided
.Jo
urna
l of B
otan
y, 20
00
Sem
i-arid
woo
dlan
ds
Dr2.
31-2
4.92
148.
3512
6.92
1995
Deve
lope
d al
lom
etric
1 ha
, plo
tRe
f No.
192
Bur
row
s,(E
ucal
yptu
s m
elan
ophl
oia)
. eq
uatio
ns a
pplie
d to
Ho
ffman
n, C
ompt
on, B
ack
(199
5). N
o so
ils
woo
dlan
d pl
ots.
and
Tait,
Aus
tralia
nin
form
atio
n pr
ovid
ed.
Jour
nal o
f Bot
any,
2000
Sem
i-arid
woo
dlan
ds
Db1.
13-2
4.92
148.
6090
.75
1986
Deve
lope
d al
lom
etric
1 ha
, plo
tRe
f No.
192
Bur
row
s,(E
ucal
yptu
s m
elan
ophl
oia)
. eq
uatio
ns a
pplie
d to
Hoffm
ann,
Com
pton
, Bac
k(1
986)
. No
soils
w
oodl
and
plot
s.an
d Ta
it, A
ustra
lian
info
rmat
ion
prov
ided
.Jo
urna
l of B
otan
y, 20
00

Australian Greenhouse Office28
Site
Desc
riptio
n So
il Ty
pe*
Loca
tion
Loca
tion
Abov
e-
Belo
w-
Year
whe
n M
etho
d of
Cal
cula
tion
Area
Est
imat
eRo
ot:s
hoot
Data
sou
rce
Relia
bilit
yCo
mm
ents
(veg
etat
ion,
soi
l)(L
atitu
de)
(Lon
gitu
de)
grou
ndgr
ound
biom
ass
(Allo
met
ric, e
xpan
sion
and
Basi
s(~
R/S)
(Ref
No.
, (A
GO
Biom
ass
Biom
ass
estim
ated
fact
or e
tc)
(ha,
plo
ts e
tc)
unpu
blis
hed)
Crite
ria)
(t/ha
, (t/
ha,
varia
nce)
varia
nce)
Sem
i-arid
woo
dlan
ds
Dy2.
43-2
2.90
147.
0333
.41
1987
Deve
lope
d al
lom
etric
1
ha, p
lot
Ref N
o. 1
92 B
urro
ws,
(E
ucal
yptu
s m
elan
ophl
oia)
. eq
uatio
ns a
pplie
d to
Ho
ffman
n, C
ompt
on, B
ack
(198
7). N
o so
ils
woo
dlan
d pl
ots.
an
d Ta
it, A
ustra
lian
info
rmat
ion
prov
ided
.Jo
urna
l of B
otan
y, 20
00
Sem
i-arid
woo
dlan
ds
Gn2.
12-2
3.75
146.
0347
.34
1996
Tree
s ha
rves
ted,
1
ha, p
lot
Ref N
o. 1
92 B
urro
ws,
(E
ucal
yptu
s m
elan
ophl
oia)
. al
lom
etric
equ
atio
ns
Hoffm
ann,
Com
pton
, Bac
k(1
996)
. No
soils
de
velo
ped
and
appl
ied
and
Tait,
Aus
tralia
nin
form
atio
n pr
ovid
ed.
to w
oodl
and
plot
s.Jo
urna
l of B
otan
y, 20
00
Sem
i-arid
woo
dlan
ds
Gn2.
12-2
3.68
146.
5211
0.15
1995
Deve
lope
d al
lom
etric
1
ha, p
lot
Ref N
o. 1
92 B
urro
ws,
(Euc
alyp
tus
mel
anop
hloi
a).
equa
tions
app
lied
to
Hoffm
ann,
Com
pton
, Bac
k(1
995)
. No
soils
w
oodl
and
plot
s.
and
Tait,
Aus
tralia
nin
form
atio
n pr
ovid
ed.
Jour
nal o
f Bot
any,
2000
Sem
i-arid
woo
dlan
ds
Gn2.
12-2
3.18
146.
5752
.75
1997
Deve
lope
d al
lom
etric
1
ha, p
lot
Ref N
o. 1
92 B
urro
ws,
(E
ucal
yptu
s m
elan
ophl
oia)
. eq
uatio
ns a
pplie
d to
Hoffm
ann,
Com
pton
, Bac
k(1
997)
. No
soils
w
oodl
and
plot
s.
and
Tait,
Aus
tralia
n in
form
atio
n pr
ovid
ed.
Jour
nal o
f Bot
any,
2000
Sem
i-arid
woo
dlan
ds
Dy3.
41-2
5.67
150.
9744
.43
1997
Deve
lope
d al
lom
etric
1
ha, p
lot
Ref N
o. 1
92 B
urro
ws,
(E
ucal
yptu
s m
elan
ophl
oia)
. eq
uatio
ns a
pplie
d to
Hoffm
ann,
Com
pton
, Bac
k(1
997)
. No
soils
w
oodl
and
plot
s.
and
Tait,
Aus
tralia
n in
form
atio
n pr
ovid
ed.
Jour
nal o
f Bot
any,
2000
Sem
i-arid
woo
dlan
ds
Gn2.
12-2
6.75
147.
5778
.56
1998
Deve
lope
d al
lom
etric
1
ha, p
lot
Ref N
o. 1
92 B
urro
ws,
(E
ucal
yptu
s m
elan
ophl
oia)
. eq
uatio
ns a
pplie
d to
Hoffm
ann,
Com
pton
, Bac
k(1
998)
. No
soils
w
oodl
and
plot
s.
and
Tait,
Aus
tralia
n in
form
atio
n pr
ovid
ed.
Jour
nal o
f Bot
any,
2000
Sem
i-arid
woo
dlan
ds
Dy2.
43-2
0.97
145.
8527
.01
1997
Deve
lope
d al
lom
etric
1
ha, p
lot
Ref N
o. 1
92 B
urro
ws,
(E
ucal
yptu
s m
elan
ophl
oia)
. eq
uatio
ns a
pplie
d to
Hoffm
ann,
Com
pton
, Bac
k(1
997)
. No
soils
w
oodl
and
plot
s.
and
Tait,
Aus
tralia
n in
form
atio
n pr
ovid
ed.
Jour
nal o
f Bot
any,
2000
Sem
i-arid
woo
dlan
ds
Dy3.
22-2
5.02
150.
7845
.81
1997
Deve
lope
d al
lom
etric
1
ha, p
lot
Ref N
o. 1
92 B
urro
ws,
(E
ucal
yptu
s m
elan
ophl
oia)
. eq
uatio
ns a
pplie
d to
Hoffm
ann,
Com
pton
, Bac
k(1
997)
. No
soils
w
oodl
and
plot
s.
and
Tait,
Aus
tralia
nin
form
atio
n pr
ovid
ed.
Jour
nal o
f Bot
any,
2000

National Carbon Accounting System Technical Report 29
Sem
i-arid
woo
dlan
ds
Dy2.
43-2
3.58
149.
3096
.34
1983
Deve
lope
d al
lom
etric
1 ha
, plo
tRe
f No.
192
Bur
row
s,
(Euc
alyp
tus
popu
lnea
). eq
uatio
ns a
pplie
d to
Hoffm
ann,
Com
pton
, Bac
k(1
983)
. No
soils
w
oodl
and
plot
s.an
d Ta
it, A
ustra
lian
info
rmat
ion
prov
ided
.Jo
urna
l of B
otan
y, 20
00
Sem
i-arid
woo
dlan
ds
Dy3.
41-2
3.17
150.
5599
.23
1992
Deve
lope
d al
lom
etric
1 ha
, plo
tRe
f No.
192
Bur
row
s,
(Euc
alyp
tus
popu
lnea
). eq
uatio
ns a
pplie
d to
Hoffm
ann,
Com
pton
, Bac
k (1
992)
. No
soils
w
oodl
and
plot
s.an
d Ta
it, A
ustra
lian
info
rmat
ion
prov
ided
.Jo
urna
l of B
otan
y, 20
00
Sem
i-arid
woo
dlan
ds
Gn2.
11-2
3.90
149.
6348
.22
1995
Deve
lope
d al
lom
etric
1 ha
, plo
tRe
f No.
192
Bur
row
s,
(Euc
alyp
tus
popu
lnea
). eq
uatio
ns a
pplie
d to
Ho
ffman
n, C
ompt
on, B
ack
(199
5). N
o so
ils
woo
dlan
d pl
ots.
and
Tait,
Aus
tralia
nin
form
atio
n pr
ovid
ed.
Jour
nal o
f Bot
any,
2000
Sem
i-arid
woo
dlan
ds
Ug5.
24-2
3.63
150.
6310
0.43
1992
Deve
lope
d al
lom
etric
1 ha
, plo
tRe
f No.
192
Bur
row
s,
(Euc
alyp
tus
popu
lnea
). eq
uatio
ns a
pplie
d to
Hoffm
ann,
Com
pton
, Bac
k (1
992)
. No
soils
w
oodl
and
plot
s.an
d Ta
it, A
ustra
lian
info
rmat
ion
prov
ided
.Jo
urna
l of B
otan
y, 20
00
Sem
i-arid
woo
dlan
ds
Dy2.
43-2
3.63
149.
4241
.29
1996
Tree
s ha
rves
ted,
1
ha, p
lot
Ref N
o. 1
92 B
urro
ws,
(E
ucal
yptu
s po
puln
ea).
allo
met
ric e
quat
ions
Hoffm
ann,
Com
pton
, Bac
k(1
996)
. No
soils
de
velo
ped
and
appl
ied
and
Tait,
Aus
tralia
nin
form
atio
n pr
ovid
ed.
to w
oodl
and
plot
s.Jo
urna
l of B
otan
y, 20
00
Sem
i-arid
woo
dlan
ds
Dy2.
43-2
3.62
149.
4279
.88
1996
Tree
s ha
rves
ted,
1
ha, p
lot
Ref N
o. 1
92 B
urro
ws,
(E
ucal
yptu
s po
puln
ea).
allo
met
ric e
quat
ions
Ho
ffman
n, C
ompt
on, B
ack
(199
6). N
o so
ils
deve
lope
d an
d ap
plie
d an
d Ta
it, A
ustra
lian
info
rmat
ion
prov
ided
.to
woo
dlan
d pl
ots.
Jour
nal o
f Bot
any,
2000
Sem
i-arid
woo
dlan
ds
Dy2.
43-2
3.60
149.
4359
.49
1996
Tree
s ha
rves
ted,
1
ha, p
lot
Ref N
o. 1
92 B
urro
ws,
(E
ucal
yptu
s po
puln
ea).
allo
met
ric e
quat
ions
Ho
ffman
n, C
ompt
on, B
ack
(199
6). N
o so
ils
deve
lope
d an
d ap
plie
d an
d Ta
it, A
ustra
lian
info
rmat
ion
prov
ided
.to
woo
dlan
d pl
ots.
Jour
nal o
f Bot
any,
2000
Sem
i-arid
woo
dlan
ds
Gn2.
22-2
3.00
145.
8366
.33
1997
Deve
lope
d al
lom
etric
1
ha, p
lot
Ref N
o. 1
92 B
urro
ws,
(E
ucal
yptu
s po
puln
ea).
equa
tions
app
lied
to
Hoffm
ann,
Com
pton
, Bac
k (1
997)
. No
soils
w
oodl
and
plot
s.an
d Ta
it, A
ustra
lian
info
rmat
ion
prov
ided
.Jo
urna
l of B
otan
y, 20
00
Sem
i-arid
woo
dlan
ds
Gn2.
12-2
7.63
148.
8710
8.98
1997
Deve
lope
d al
lom
etric
1 ha
, plo
tRe
f No.
192
Bur
row
s,
(Euc
alyp
tus
popu
lnea
). eq
uatio
ns a
pplie
d to
Hoffm
ann,
Com
pton
, Bac
k (1
997)
. No
soils
w
oodl
and
plot
s.an
d Ta
it, A
ustra
lian
info
rmat
ion
prov
ided
.Jo
urna
l of B
otan
y, 20
00
Sem
i-arid
woo
dlan
ds
Ug5.
22-2
4.67
145.
9310
5.58
1997
Deve
lope
d al
lom
etric
1 ha
, plo
tRe
f No.
192
Bur
row
s,
(Euc
alyp
tus
mel
anop
hloi
a).
equa
tions
app
lied
toHo
ffman
n, C
ompt
on, B
ack
(199
7). N
o so
ils
woo
dlan
d pl
ots.
and
Tait,
Aus
tralia
n in
form
atio
n pr
ovid
ed.
Jour
nal o
f Bot
any,
2000

Australian Greenhouse Office30
Site
Desc
riptio
n So
il Ty
pe*
Loca
tion
Loca
tion
Abov
e-
Belo
w-
Year
whe
n M
etho
d of
Cal
cula
tion
Area
Est
imat
eRo
ot:s
hoot
Data
sou
rce
Relia
bilit
yCo
mm
ents
(veg
etat
ion,
soi
l)(L
atitu
de)
(Lon
gitu
de)
grou
ndgr
ound
biom
ass
(Allo
met
ric, e
xpan
sion
and
Basi
s(~
R/S)
(Ref
No.
, (A
GO
Biom
ass
Biom
ass
estim
ated
fact
or e
tc)
(ha,
plo
ts e
tc)
unpu
blis
hed)
Crite
ria)
(t/ha
, (t/
ha,
varia
nce)
varia
nce)
Heat
h co
mm
unity
Uc
2.21
-35.
8714
0.45
26.4
481
.50
Unkn
own
Clip
ped
quad
rats
.0.
0252
ha,
0.
76Re
f No.
34
Spe
cht,
Rays
on,
dom
inat
ed b
yBa
nksi
a,
quad
rat
Jack
man
, Aus
tralia
n Ca
suar
ina,
Xan
thor
rhoe
a,
Jour
nal o
f Bot
any,
1958
Euca
lypt
uson
ver
y sa
ndy
soils
.
Heat
h co
mm
unity
dom
inat
ed
Uc2.
21-3
5.87
140.
459.
1519
66Cl
ippe
d qu
adra
ts.
0.01
25 h
a,
Ref N
o. 3
5 S
pech
t, by
Ban
ksia
, Cas
uarin
a,
quad
rat
Aust
ralia
n Jo
urna
l of
Xant
horr
hoea
, Euc
alyp
tus
Bota
ny, 1
966
on v
ery
sand
y so
ils.
Scle
roph
yllo
us h
eath
Uc
2.21
-29.
8711
5.25
13.9
830
.74
1984
Clip
ped
quad
rats
.0.
0048
ha,
0.
69Re
f No.
102
Low
and
(B
anks
ia) w
ith s
hrub
and
pl
otLa
mon
t, Au
stra
lian
herb
und
erst
orey
on
deep
Jo
urna
l of B
otan
y, 19
90dr
aini
ng s
ands
.
Scle
roph
yllo
us h
eath
Um
2.12
-38.
1314
5.13
9.47
60.1
319
66Cl
ippe
d qu
adra
ts.
0.00
12 h
a,
0.86
Ref N
o. 1
07 J
ones
, (L
epto
sper
mum
, qu
adra
tAu
stra
lian
Jour
nal
Casu
arin
aan
d Ba
nksi
a)
of B
otan
y, 19
68w
ith s
econ
dary
shr
ub la
yer.
Soils
wer
e de
ep s
ands
of
very
low
ferti
lity.
Scle
roph
yllo
us h
eath
Um
2.12
-38.
1314
5.13
10.1
274
.49
1966
Clip
ped
quad
rats
.0.
0012
ha,
0.
88Re
f No.
107
Jon
es,
(Lep
tosp
erm
um, C
asua
rina
quad
rat
Aust
ralia
n Jo
urna
l an
d Ba
nksi
a) w
ith s
econ
dary
of
Bot
any,
1968
shru
b la
yer.
Soils
wer
e de
ep
sand
s of
ver
y lo
w fe
rtilit
y.
Arid
per
enni
al g
rass
land
Gn
2.12
-23.
5513
3.60
14.9
020
.10
1973
/Vi
sual
met
hod
0.00
2 ha
, 0.
57Re
f No.
126
Ros
s,
com
mun
ity (E
ragr
ostis
1975
calib
rate
dqu
adra
tAu
stra
lian
Jour
nal o
f er
iopo
da).
Soils
wer
e a
by c
lippe
d Ec
olog
y, 19
77gr
adat
iona
l red
-ear
th w
ith
quad
rats
.a
sand
y lo
am s
urfa
ce.
Open
sav
anna
h w
oodl
and,
Gn
2.12
-23.
5713
3.57
5.92
Unkn
own
Prev
ious
ly d
evel
oped
2.
25 h
a,
Ref N
o. 1
43
Alic
e Sp
rings
-ope
n al
lom
etric
equ
atio
nspl
otW
alke
r and
Lan
grid
ge,
woo
dlan
d. E
arth
. ap
plie
d.
Jour
nal o
f Bio
geog
raph
y, 19
97
Open
Sav
anna
h w
oodl
and,
Ug
5.37
-20.
3514
2.63
10.0
9Un
know
nPr
evio
usly
dev
elop
ed
2.25
ha,
Re
f No.
143
Wal
ker a
nd
Runn
ymea
d. S
andy
loam
.al
lom
etric
equ
atio
ns
plot
Lang
ridge
, Jou
rnal
of
appl
ied.
Bi
ogeo
grap
hy, 1
997

National Carbon Accounting System Technical Report 31
Dry
scle
roph
yll s
crub
Uc
2.3
-33.
9615
1.22
48.0
079
.90
1975
/Vo
lum
e es
timat
es m
ade
0.00
08 h
a,
0.62
Ref N
o. 1
47 M
aggs
and
sy
stem
dom
inat
ed b
y 19
76an
d co
mbi
ned
with
qu
adra
tPe
arso
n, O
ecol
ogia
, Ba
nksi
agr
owin
g on
w
ood
dens
ity
1977
asa
nd-r
idge
s.m
easu
rem
ents
.
Heat
h ve
geta
tion
Uc2.
3-3
8.87
146.
407.
7241
.70
1962
/Cl
ippe
d qu
adra
ts.
0.01
08 h
a,
0.84
Ref N
o. 1
67 G
rove
s,
dom
inat
ed b
y Ba
nksi
a19
63qu
adra
tAu
stra
lian
Jour
nal o
f on
san
dy s
oils
.Bo
tany
, 196
5
Heat
h ve
geta
tion
on lo
w
Dy5.
43-3
6.03
140.
5028
.00
Unkn
own
Clip
ped
quad
rats
.0.
002
to
Ref N
o. 1
68 G
rove
s an
d nu
trien
t, sa
ndy
soils
.0.
03 h
a,
Spec
ht, A
ustra
lian
quad
rat
Jour
nal o
f Bot
any,
1965
Heat
h ve
geta
tion
on lo
w
Uc1.
11-3
9.03
146.
3218
.00
34.5
3Un
know
nCl
ippe
d qu
adra
ts.
0.00
2 to
0.
66Re
f No.
168
Gro
ves
and
nutri
ent,
sand
y so
ils.
0.03
ha,
Sp
echt
, Aus
tralia
n qu
adra
tJo
urna
l of B
otan
y, 19
65
Heat
h ve
geta
tion
on lo
w
Uc2.
3-3
8.87
146.
4013
.50
13.3
1Un
know
nCl
ippe
d qu
adra
ts.
0.00
2 to
0.
50Re
f No.
168
Gro
ves
and
nutri
ent,
sand
y so
ils.
0.03
ha,
Sp
echt
, Aus
tralia
n qu
adra
tJo
urna
l of B
otan
y, 19
65
* At
las
of A
ustra
lian
Soils
Prin
cipl
e Fo
rm

Australian Greenhouse Office32
2. UNPUBLISHED FOREST DATAFROM SOUTH-EAST AUSTRALIA
Notes accompanying unpublished spatial biomassestimates.
2.1 GENERAL COMMENTThe reported estimates of biomass on a plot basis areconsidered to have a high level of accuracy wheresite and species specific allometric equations havebeen applied. Greater uncertainty exists where non-specific equations have been applied.
Spatial extrapolation of plot estimates of biomass to the stand level introduces the next level ofuncertainty, which is related to forest heterogeneity.Extensive testing with inventory data is required toquantify this uncertainty.
2.2 COMMENT ON AGO CRITERIA
2.2.1 Maturity of the vegetation and changes due to disturbance
All stands are considered ‘mature’ native vegetation.Notes are provided about known disturbancehistory.
The Brindabella sites (Sites 1 – 4) represent standsregenerated after the 1939 wildfire, but include somesurvivors and trees aged by dendrochronology at >100 years old. Sites 1 and 3 have had someprescribed burning that has damaged some treesand killed a few small trees. These stands all consistof multi-ages and sizes of trees.
The stands in Bago State Forest are all fully - stocked with a range of tree age and size classes.Regeneration has occurred following selectiveharvesting and some wildfires. Inventory plots thathad been recently logged or had low stocking due to poor regeneration have not been included.
The E. obliqua sites in Tasmania and NSW werespecifically selected to represent mature stands.They are fully-stocked, multi-aged stands that haveregenerated following selective harvesting orwildfire.
Further information could be obtained aboutdisturbance history from forest compartmentrecords.
2.2.2 Accuracy of spatial location
All sites are permanently marked in the field andcan be located. Geo-referencing of plots usedlatitude and longitude from 1:25 000 scale AUSLIGmaps. Plots were carefully located in relation totopographic features while in the field and accuracywould be within 25 m. GPS locations could beobtained by returning to each plot, for Sites 1–4 and35–39. Sites 5–34 have been located by GPS.
2.2.3 Size of the area sampled (plot versusstand) and representativeness of local conditions (~1 ha for stand level)
Sites 1–4 , 21–34 and 35–39 were selected to berepresentative of the surrounding forest stand of >1 ha. Sites 5–20 were selected from a grid-basedinventory design across the State Forest. However,based on knowledge of the surrounding forest, theseplots are considered representative of >1 ha stand.Notes on actual sizes of inventory plots at each siteare given in the following table.
Although these plots are considered ‘representative’of a 1 ha stand, great heterogeneity exists in forestsdue to topography, environmental conditions anddisturbance history (even within a ‘mature’ forest).This heterogeneity is exemplified by the varianceamong 6 plots within several ha at Site 1, and therange in values for sites 5 to 26 that occur in BagoState Forest with the same species and soil type.
2.2.4 Biomass divided into above – and below-ground components
There are no estimates of below-ground biomass atthese sites. A root / shoot ratio cannot be appliedbecause there is inadequate information about soiltype, species and environmental controls onallocation to apply a ratio from another site.

National Carbon Accounting System Technical Report 33
Quality control can be assessed because CSIROForestry and Forest Products staff were involved inthe collection, processing and measurements. Notesare provided for each site about the quality ofallometric equations and inventory data.
The accuracy of biomass estimates depends on:
1. Representativeness of harvested trees andcomponents;
2. Methods of sampling biomass components;
3. Derivation of allometric equations; and
4. Application of equations to inventory data.
Sites 1–4: Trees and components were sampledopportunistically from material available and tocover a size range of trees within the study area.Samples of components were weighed, multipliedby volume and converted by ratios of fresh mass:drymass. Logarithmic allometric equations werecalculated and applied to inventory data for theplots.
Sites 5–28: Species specific allometric equations fromthe Brindabellas were applied to inventory datafrom Bago State Forest. Structure of the trees issimilar but the errors associated with site differenceshave not been tested.
Sites 29–34: The closest possible allometric equationwas selected from those available in south-eastAustralia (NCAS Technical Report 5b, AustralianGreenhouse Office, 2000), in terms of species andenvironmental conditions. Errors associated withspecies and site differences have not been tested.
Sites 35–39: Trees were sampled systematically at a site to cover the range in sizes and structures.Samples were selected by random branch samplingand importance sampling to ensure an unbiasedsample with the greatest accuracy for the amount ofmaterial harvested. Logarithmic allometric equationswere calculated, and these species and site specificequations were applied to inventory data for thesame site.
All data presented were calculated for the purposeof estimating standing above-ground biomass oftrees. Inventory data includes trees only >10 cmdiameter, and does not include biomass of smalltrees, understorey, groundcover, dead trees or litter.
Estimation of errors –
The error associated in estimating biomass at a siteconsists of four components:
1. Error involved in the derivation of theallometric equation;
2. Error involved in any application of theallometric equation to trees beyond the sizerange from which it was derived;
3. Error due to prediction using an allometricequation for individual trees within a plot;and
4. The variance among replicate plots within a site.
Information exists for the current sites on errors of type (3) at Sites 5–20 and type (4) at Site 1.Additional information about errors could becalculated for some of these sites.
The total error in the estimation of biomass is thesum of all these types of errors. It is important thateach type of error is not confused, and that anindividual type of error is not taken as the totalerror.

Australian Greenhouse Office34
Site
Desc
riptio
n Lo
catio
nBi
omas
s Ye
ar w
hen
Met
hod
of
Area
Est
imat
e Ro
ot b
iom
ass
Data
sou
rce
Relia
bilit
yCo
mm
ents
(veg
etat
ion,
soi
l)(t/
ha,
biom
ass
Calc
ulat
ion
and
Basi
s or
root
:sho
ot
(Ref
No.
,(A
GO C
riter
ia)
varia
nce)
estim
ated
(Allo
met
ric,
(ha,
plo
ts e
tc)
(t/ha
, ~R/
S)un
publ
ishe
d)ex
pans
ion
fact
or, e
tc)
1PS
E. p
auci
flora
- Pi
ccad
illy
210.
9 (m
ean)
Bi
omas
s Al
lom
etric
6 x
0.04
ha
Keith
H.,
Rais
on
1) L
ocat
ion:
Pos
ition
Ot
her d
ata
60 y
ear-o
ld
catc
hmen
t, 18
8.1
sam
ples
equa
tion
plot
s w
ithin
an
R. J
. and
Jac
obse
nof
plo
ts is
acc
urat
ely
avai
labl
e at
the
rege
nera
tion.
Br
inda
bella
(var
ianc
e 1)
colle
cted
in
(site
spe
cific
)ar
ea o
f sev
eral
ha
K.L.
199
7.
loca
ted
on 1
:250
00si
te: 1
) Det
aile
dM
onta
ne c
ool
Rang
e, A
CT.
appr
ox. 1
980.
Al
loca
tion
of
topo
grap
hic
map
, so
il an
alys
es,
tem
pera
te e
ucal
ypt
35 2
1’ 4
9”S
Allo
met
ricca
rbon
in a
mat
ure
perm
anen
tly lo
cate
d 2)
Inve
ntor
y da
ta
fore
st. M
atur
e st
and
148
48’ 1
1”E
equa
tion
euca
lypt
fore
st
in th
e fie
ld, a
nd
for a
n ad
ditio
nal
of m
ixed
age
/ si
ze
Elev
atio
n 12
00 m
de
rived
and
an
d so
me
effe
cts
coul
d be
loca
ted
21 p
lots
, lon
g-te
rmcl
asse
s, m
ainl
y 50
km
W o
f st
and
biom
ass
of s
oil p
hosp
horu
s by
GPS
. an
d on
-goi
ng,
rege
nera
tion
from
Ca
nber
ra.
calc
ulat
ed in
av
aila
bilit
y. Pl
ant a
nd
2) A
rea
estim
ate:
3)
Gro
wth
dat
ath
e 19
39 w
ildfir
e 19
95. I
nven
tory
So
il 19
6:81
-99.
Plot
s co
ver f
ores
t in
term
s of
w
ith s
ome
larg
e da
ta is
long
repr
esen
tativ
e of
an
nual
DBH
re
sidu
al tr
ees.
Soi
l te
rm a
nd
>1 h
a.in
crem
ent,
type
is a
Red
Ear
th
on-g
oing
.3)
Mat
urity
: The
4)
Bud
gets
of C
, w
ith h
igh
orga
nic
fore
st s
tand
is
N an
d P
in th
e m
atte
r con
tent
.co
nsid
ered
‘mat
ure’
, ec
osys
tem
and
w
ith tr
ees
appr
ox. 6
0 5)
Spe
cies
list
s.ye
ars
old
and
a ra
nge
of a
ges.
Dis
turb
ance
hi
stor
y in
clud
es
rege
nera
tion
afte
r the
19
39 w
ildfir
e an
d re
gula
r pr
escr
ibed
bur
ning
.
2FS
E. p
auci
flora
- Fe
rny
catc
hmen
t, 14
5.7
t/ha
Inve
ntor
y da
ta
Allo
met
ric
1 x
0.25
ha
plot
unpu
blis
hed
1) L
ocat
ion:
Pos
ition
Ot
her d
ata
avai
labl
e un
burn
t for
est.
Brin
dabe
llafro
m 1
984.
eq
uatio
nof
plo
ts is
acc
urat
ely
at th
e si
te: 1
) Som
e (a
s ab
ove)
Ra
nge,
ACT
. (a
s ab
ove)
(site
spe
cific
)lo
cate
d on
1:2
5000
so
il an
alys
es35
22’
35”
S
topo
grap
hic
map
, 2)
Gro
wth
dat
a14
8 48
’ 11”
E
perm
anen
tly lo
cate
din
term
s of
in
the
field
, and
cou
ld b
e an
nual
DBH
loca
ted
by G
PS. 2
) Are
a in
crem
ent o
f es
timat
e: P
lot c
over
s fo
rest
sele
cted
tree
s an
dre
pres
enta
tive
of >
1 ha
. 3)
Spe
cies
list
s.3)
Mat
urity
: The
fore
st
stan
d is
con
side
red
‘mat
ure’
, with
tree
s >1
00
year
s ol
d an
d a
rang
e of
ag
es. N
o fir
es w
ithin
kn
own
hist
ory.

National Carbon Accounting System Technical Report 35
3PD
E. d
eleg
aten
sis
- Pi
ccad
illy
287.
8 t/h
aIn
vent
ory
data
Allo
met
ric1
x 0.
25 h
a pl
otun
publ
ishe
d1)
Loc
atio
n: P
ositi
onOt
her d
ata
avai
labl
e60
yea
r-old
ca
tchm
ent,
from
199
4.eq
uatio
n of
plo
ts is
acc
urat
ely
at th
e si
te: 1
) Som
e re
gene
ratio
n.
Brin
dabe
lla(a
s ab
ove)
(site
spe
cific
)lo
cate
d on
1:2
5000
so
il an
alys
es, 2
) M
onta
ne c
ool
Rang
e, A
CT.
topo
grap
hic
map
, Gr
owth
dat
a in
te
mpe
rate
euc
alyp
t 35
21’
43”
S
perm
anen
tly lo
cate
d te
rms
of a
nnua
l fo
rest
. Mat
ure
stan
d 14
8 48
’ 23”
Ein
the
field
, and
DB
H in
crem
ent
of m
ixed
age
/ si
ze
coul
d be
loca
ted
of s
elec
ted
clas
ses,
mai
nly
by G
PS. 2
) Are
a tre
es a
nd 3
) re
gene
ratio
n fro
m
estim
ate:
Plo
t cov
ers
Spec
ies
lists
.th
e 19
39 w
ildfir
e fo
rest
repr
esen
tativ
ew
ith s
ome
larg
e of
>1
ha. 3
) Mat
urity
: re
sidu
al tr
ees.
Th
e fo
rest
sta
nd is
Soil
type
is a
Red
co
nsid
ered
‘mat
ure’
, Ea
rth w
ith h
igh
with
tree
s 60
yea
rs
orga
nic
mat
ter
old
and
a ra
nge
cont
ent.
of a
ges.
Dis
turb
ance
hist
ory
incl
udes
rege
nera
tion
afte
r the
19
39 w
ildfir
e an
dre
gula
r pre
scrib
edbu
rnin
g.
4FD
E. d
eleg
aten
sis
- Fe
rny
catc
hmen
t, 44
7.8
t/ha
Inve
ntor
y da
ta
Allo
met
ric1
x 0.
25 h
a pl
otun
publ
ishe
d1)
Loc
atio
n: P
ositi
onOt
her d
ata
avai
labl
eun
burn
t for
est.
Brin
dabe
lla R
ange
, fro
m 1
994.
eq
uatio
nof
plo
ts is
acc
urat
ely
at th
e si
te:
(as
abov
e)
ACT.
35
22’ 2
8” S
(a
s ab
ove)
(site
spe
cific
)lo
cate
d on
1:2
5000
1)
Som
e so
il 14
8 49
’ 30”
Eto
pogr
aphi
c m
ap,
anal
yses
, 2) G
row
thpe
rman
ently
loca
ted
inda
ta in
term
s th
e fie
ld, a
nd c
ould
be
of a
nnua
l DBH
lo
cate
d by
GPS
. 2) A
rea
incr
emen
t of
estim
ate:
Plo
t cov
ers
fore
st
sele
cted
tree
s an
d re
pres
enta
tive
of >
1 ha
. 3)
Spe
cies
list
s.3)
Mat
urity
: The
fore
st
stan
d is
con
side
red
‘mat
ure’
, with
tree
s60
yea
rs o
ld a
nd a
rang
e of
age
s. N
o fir
es in
kno
wn
hist
ory.
PGP
1E.
del
egat
ensi
s.
Bago
Sta
te F
ores
t.56
3.0
Inve
ntor
y da
ta
Allo
met
ric1
x 0.
1 ha
plo
tun
publ
ishe
d1)
Loc
atio
n: P
ositi
onOt
her d
ata
avai
labl
eTa
ll m
onta
ne c
ool
Altit
udin
al ra
nge
149.
5 fro
m 1
996.
eq
uatio
nof
plo
ts is
acc
urat
ely
at th
e si
te:
tem
pera
te e
ucal
ypt
800
to 1
500
m.
(SD
2)(d
eriv
ed fr
om
loca
ted
by G
PS a
nd1)
Det
aile
d so
il fo
rest
. For
est
AMG
zone
55
Brin
dabe
llam
appe
d on
the
anal
yses
man
aged
for
6041
30 E
da
ta)
Bago
GIS
. 2) A
rea
2) G
row
th d
ata
inse
lect
ive
timbe
r 60
5624
6 N
estim
ate:
Plo
t cov
ers
term
s of
ann
ual
prod
uctio
n fo
r fo
rest
repr
esen
tativ
eDB
H in
crem
ent a
nd>1
00 y
ears
. Mat
ure
of >
1 ha
. 3) M
atur
ity:
dend
roch
ron-
stan
d of
mul
tiple
age
The
fore
st s
tand
is
olog
ical
stu
dies
,/ s
ize c
ohor
ts. D
eep
cons
ider
ed ‘m
atur
e’,
3) S
peci
es li
sts
gran
odio
rite
soils
.w
ith a
fully
sto
cked
, an
d 4)
His
toric
al
mul
tiple
-age
d st
and.
re
cord
s of
Rege
nera
tion
has
occu
rred
m
anag
emen
t and
follo
win
g se
lect
ive
and
dist
urba
nce
harv
estin
g an
d so
me
even
ts.
wild
fires
.

Site
Desc
riptio
n Lo
catio
nBi
omas
s Ye
ar w
hen
Met
hod
of
Area
Est
imat
e Ro
ot b
iom
ass
Data
sou
rce
Relia
bilit
yCo
mm
ents
(veg
etat
ion,
soi
l)(t/
ha,
biom
ass
Calc
ulat
ion
and
Basi
s or
root
:sho
ot
(Ref
No.
,(A
GO C
riter
ia)
varia
nce)
estim
ated
(Allo
met
ric,
(ha,
plo
ts e
tc)
(t/ha
, ~R/
S)un
publ
ishe
d)ex
pans
ion
fact
or, e
tc)
6PG
P 2
AMG
zone
55
244.
9 60
4130
E
65.0
(SD
2)60
5624
6 N
8PG
P 4
AMG
zone
55
495.
5 60
9177
E
122.
0(SD
2)
6053
686
N
9 PG
P 5
AMG
zone
55
241.
6 60
4139
E64
.1 (S
D 2)
6053
727
10 P
GP 6
AMG
zone
55
655.
4 60
6574
E
174.
0 (S
D 2)
6053
624
N
11 P
GP 7
AMG
zone
55
283.
9 60
1568
E
75.4
(SD
2)60
5361
9 N
13 P
GP 9
AMG
zone
55
407.
7 60
1685
E
108.
2 (S
D 2)
6051
007
N
14 P
GP 1
0AM
G zo
ne 5
5 15
2.3
6043
73 E
40
.4 (S
D 2)
6050
916
N
15 P
GP 1
1AM
G zo
ne 5
5 31
8.6
6090
84 E
84
.6 (S
D 2)
6051
087
N
16 P
GP 1
2AM
G zo
ne 5
5 24
4.1
6091
80 E
64
.8 (S
D 2)
6048
615
N
18 P
GP 1
4AM
G zo
ne 5
5 24
2.2
5992
14 E
64
.3 (S
D 2)
6046
015
N
19 P
GP 1
6AM
G zo
ne 5
5 22
2.7
6091
14 E
59
.1 (S
D 2)
6046
175
N
20 P
GP 1
8AM
G zo
ne 5
5 21
3.8
6117
35 E
56
.8 (S
D 2)
6043
738
N
Australian Greenhouse Office36

National Carbon Accounting System Technical Report 37
21 B
MP
1E.
del
egat
ensi
s.Ba
go S
tate
For
est.
475.
0In
vent
ory
data
Allo
met
ric1
x 0.
1 ha
plo
tun
publ
ishe
d1)
Loc
atio
n: P
ositi
onOt
her d
ata
avai
labl
eTa
ll m
onta
ne c
ool
35.6
2298
Sfro
m 2
001.
eq
uatio
nof
plo
ts is
acc
urat
ely
at th
e si
te: 1
) te
mpe
rate
euc
alyp
t14
8.14
3043
E(d
eriv
ed fr
om
loca
ted
by G
PS a
ndDe
taile
d so
il an
d fo
rest
. For
est
East
ing
6035
10Br
inda
bella
map
ped
on th
e Ba
gofo
liage
ana
lyse
s,m
anag
ed fo
r No
rthin
g 60
5725
2da
ta)
GIS.
2) A
rea
estim
ate:
2)
Gro
wth
dat
a in
sele
ctiv
e tim
ber
Plot
cov
ers
fore
st
term
s of
ann
ual
prod
uctio
n fo
r re
pres
enta
tive
of >
1 ha
.DB
H in
crem
ent,
>100
yea
rs. M
atur
e 3)
Mat
urity
: The
fore
st3)
Spe
cies
list
s,st
and
of m
ultip
lest
and
is c
onsi
dere
d 4)
His
toric
al
age
/ size
coh
orts
.‘m
atur
e’, w
ith a
fully
reco
rds
ofst
ocke
d, m
ultip
le-a
ged
man
agem
ent a
ndst
and.
Reg
ener
atio
n ha
s di
stur
banc
eoc
curr
ed fo
llow
ing
sele
ctiv
e ev
ents
and
harv
estin
g an
d so
me
5) re
mot
ew
ildfir
es.
sens
ing
cove
rage
.
22
as a
bove
35
.642
50 S
62
9.1
as a
bove
as
abo
ve
as a
bove
as
abo
ve
as a
bove
as
abo
veBM
P 3
148.
1794
89 E
Ea
stin
g 60
6785
No
rthin
g 60
5504
9
23
as a
bove
35
.610
89 S
38
4.5
as a
bove
as
abo
ve
as a
bove
as
abo
ve
as a
bove
as
abo
ve
BMP
414
8.14
8658
E
East
ing
6040
34
North
ing
6058
587
24
as a
bove
35
.701
21 S
44
6as
abo
ve
as a
bove
as
abo
ve
as a
bove
as
abo
ve
as a
bove
BM
P 8
148.
1256
98 E
Ea
stin
g 60
1840
No
rthin
g 60
4859
3
25
as a
bove
35
.654
69 S
41
4as
abo
ve
as a
bove
as
abo
ve
as a
bove
as
abo
ve
as a
bove
BM
P 16
148.
1504
38 E
Ea
stin
g 60
4139
No
rthin
g 60
5372
7
26
as a
bove
35
.659
62 S
26
4as
abo
ve
as a
bove
as
abo
ve
as a
bove
as
abo
ve
as a
bove
BMP
118
148.
1568
06 E
Ea
stin
g 60
4709
No
rthin
g 60
5317
3
27 S
G 1
E. p
auci
flora
/Ba
go S
tate
For
est.
331
as a
bove
as
abo
ve
as a
bove
as
abo
ve
as a
bove
Ot
her d
ata
avai
labl
eE.
dal
rym
plea
na.
35.6
6450
Sat
the
site
: Ba
go S
tate
For
est.
148.
1707
50 E
1) F
olia
ge a
naly
ses
Low
coo
l tem
pera
te
East
ing
6059
64an
d 2)
rem
ote
euca
lypt
fore
st. M
atur
e No
rthin
g 60
5262
1se
nsin
g co
vera
ge.
stan
d of
mul
tiple
age
/ si
ze c
ohor
ts.
28 S
G 2
E. p
auci
flora
/ Ba
go S
tate
For
est.
275
as a
bove
as
abo
ve
as a
bove
as
abo
ve
as a
bove
as
abo
ve
E. d
alry
mpl
eana
. 35
.687
00 S
Lo
w c
ool t
empe
rate
148.
1573
00 E
euca
lypt
fore
st. M
atur
eEa
stin
g 60
4718
stan
d of
mul
tiple
age
/ No
rthin
g 60
5014
0si
ze c
ohor
ts.

Site
Desc
riptio
n Lo
catio
nBi
omas
s Ye
ar w
hen
Met
hod
of
Area
Est
imat
e Ro
ot b
iom
ass
Data
sou
rce
Relia
bilit
yCo
mm
ents
(veg
etat
ion,
soi
l)(t/
ha,
biom
ass
Calc
ulat
ion
and
Basi
s or
root
:sho
ot
(Ref
No.
,(A
GO C
riter
ia)
varia
nce)
estim
ated
(Allo
met
ric,
(ha,
plo
ts e
tc)
(t/ha
, ~R/
S)un
publ
ishe
d)ex
pans
ion
fact
or, e
tc)
29 P
M 1
E. ra
diat
a /
Bago
Sta
te F
ores
t.35
8as
abo
ve
Allo
met
ric
as a
bove
as
abo
ve
as a
bove
as
abo
veE.
dal
rym
plea
na.
35.5
7282
Seq
uatio
nLo
w c
ool t
empe
rate
148.
2011
17 E
(der
ived
from
euca
lypt
fore
st. M
atur
eEa
stin
g 60
8837
the
clos
est d
ata
stan
d of
mul
tiple
age
/ No
rthin
g 60
6275
3fo
r the
spe
cies
)si
ze c
ohor
ts.
30 P
M 2
E. ra
diat
a /
Bago
Sta
te F
ores
t.21
8as
abo
ve
Allo
met
ric
as a
bove
as
abo
ve
as a
bove
as
abo
veE.
dal
rym
plea
na.
35.5
7662
Seq
uatio
nLo
w c
ool t
empe
rate
148.
2115
83 E
(der
ived
from
eu
caly
pt fo
rest
. Mat
ure
East
ing
6097
80th
e cl
oses
t dat
ast
and
of m
ultip
le a
ge /
North
ing
6062
320
for t
he s
peci
es)
size
coh
orts
.
31 S
B 1
E. m
acro
rhyn
cha
/ Ba
go S
tate
For
est.
228
as a
bove
Al
lom
etric
as
abo
ve
as a
bove
as
abo
ve
as a
bove
Acac
ia m
elan
oxyl
on.
35.8
7452
Seq
uatio
nLo
w c
ool t
empe
rate
148.
1265
17 E
(der
ived
from
eu
caly
pt fo
rest
.Ea
stin
g 60
1693
the
clos
est d
ata
Mat
ure
stan
d of
North
ing
6029
369
for t
he s
peci
es)
mul
tiple
age
/ si
zeco
horts
.
32 S
B 2
E. m
acro
rhyn
cha
/ Ba
go S
tate
For
est.
136
as a
bove
Al
lom
etric
as
abo
ve
as a
bove
as
abo
ve
as a
bove
Acac
ia m
elan
oxyl
on.
35.8
8223
Seq
uatio
n (d
eriv
ed
Low
coo
l tem
pera
te
148.
1097
17 E
from
the
clos
est
euca
lypt
fore
st. M
atur
eEa
stin
g 60
0167
data
for t
he s
peci
es)
stan
d of
mul
tiple
age
/No
rthin
g 60
2853
1si
ze c
ohor
ts.
33 B
L 1
E. b
icos
tata
/ Ba
go S
tate
For
est.
635
as a
bove
Al
lom
etric
as a
bove
as
abo
ve
as a
bove
as
abo
ve
E. ra
diat
a.Ta
ll co
ol35
.758
38 S
eq
uatio
n (d
eriv
edte
mpe
rate
euc
alyp
t 14
8.11
0317
Efro
m th
e cl
oses
tfo
rest
. Mat
ure
stan
dEa
stin
g 60
0377
data
for t
he s
peci
es)
of m
ultip
le a
ge /
North
ing
6042
268
size
coh
orts
.
34 B
L 2
E. b
icos
tata
/ Ba
go S
tate
For
est.
446
as a
bove
Al
lom
etric
as
abo
ve
as a
bove
as
abo
ve
as a
bove
E. ra
diat
a. T
all c
ool
35.7
5372
Seq
uatio
n (d
eriv
edte
mpe
rate
euc
alyp
t14
8.09
2933
Efro
m th
e cl
oses
tfo
rest
. Mat
ure
stan
d Ea
stin
g 59
8811
data
for t
he s
peci
es)
of m
ultip
le a
ge /
North
ing
6042
803
size
coh
orts
.
Australian Greenhouse Office38

National Carbon Accounting System Technical Report 39
35
E. o
bliq
ua.
Pict
on v
alle
y87
6Al
lom
etric
Al
lom
etric
1
x 0.
2 ha
plo
tKe
ith H
. 199
9 1)
Loc
atio
n:
Othe
r dat
a Ta
s w
et
Tall
cool
tem
pera
tein
SW
Tas
man
ia.
equa
tion
and
equa
tion
Gene
ralis
ed
Posi
tion
of p
lots
avai
labl
e at
hi
gheu
caly
pt fo
rest
. Ea
stin
g 47
5940
inve
ntor
y da
ta
(site
spe
cific
)al
lom
etric
equ
atio
ns
is a
ccur
atel
y th
e si
te:
Mat
ure
stan
dsNo
rthin
gco
llect
ed in
fo
r est
imat
ing
loca
ted
on
1) S
oil a
naly
ses
of m
ultip
le a
ge /
5215
940
1998
. Cou
pes
the
abov
e-to
pogr
aphi
c an
dan
d 2)
Inve
ntor
y si
ze c
ohor
ts. F
ertil
eha
rves
ted
in
grou
nd b
iom
ass
of
com
partm
ent
data
.do
lerit
ic s
oils
.19
98.
Aust
ralia
’s fo
rest
s:
map
s. 2
) Are
aSy
nthe
sis
of re
sults
estim
ate:
Plo
tfro
m d
estru
ctiv
e co
vers
fore
st
harv
estin
g of
re
pres
enta
tive
of
Euca
lypt
us o
bliq
ua>1
ha.
3) M
atur
ity:
in N
SW a
nd
The
fore
st s
tand
isTa
sman
ia.
cons
ider
ed
‘mat
ure’
, with
afu
lly s
tock
ed,
mul
tiple
-age
dst
and.
Rege
nera
tion
has
occu
rred
follo
win
gse
lect
ive
harv
estin
gan
d so
me
wild
fires
.
36
E. o
bliq
ua.
Arve
Val
ley
in
883
1 x
0.2
ha p
lot
1) L
ocat
ion:
Ta
s w
et
Tall
cool
tem
pera
teSW
Tas
man
ia.
Posi
tion
of p
lots
hi
gheu
caly
pt fo
rest
.Ea
stin
g 48
5290
is a
ccur
atel
y lo
cate
d M
atur
e st
ands
of
North
ing
on to
pogr
aphi
c an
d m
ultip
le a
ge /
size
52
2829
0co
mpa
rtmen
t map
s.
coho
rts. F
ertil
e 2)
Are
a es
timat
e:
dole
ritic
soi
ls.
Plot
cov
ers
fore
st
repr
esen
tativ
e of
>1
ha.
3) M
atur
ity: T
he fo
rest
st
and
is ‘o
ld g
row
th’,
with
a
fully
sto
cked
, mul
tiple
-ag
ed s
tand
.
37
E. o
bliq
ua.
Arve
val
ley
in80
Allo
met
ric
Allo
met
ric
1 x
0.1
ha p
lot
as a
bove
1)
Loc
atio
n: P
ositi
on
as a
bove
Tas
wet
Ta
ll co
ol
SW T
asm
ania
. eq
uatio
neq
uatio
nof
plo
ts is
acc
urat
ely
low
tem
pera
teEa
stin
g 48
6400
and
inve
ntor
y (s
ite s
peci
fic)
loca
ted
on to
pogr
aphi
ceu
caly
pt fo
rest
. No
rthin
gda
ta c
olle
cted
an
d co
mpa
rtmen
tM
atur
e st
ands
of
5224
500
in 1
998.
map
s. 2
) Are
a es
timat
e:
mul
tiple
age
/ si
ze
Plot
cov
ers
fore
stco
horts
. Soi
ls o
f re
pres
enta
tive
of
low
ferti
lity
onst
rips
arou
nd th
esa
ndst
one.
edge
of s
wam
ps
that
may
be
<100
m
wid
e. 3
) Mat
urity
: Th
e fo
rest
sta
nd is
co
nsid
ered
‘mat
ure’
, w
ith a
fully
sto
cked
, m
ultip
le-a
ged
stan
d.

Site
Desc
riptio
n Lo
catio
nBi
omas
s Ye
ar w
hen
Met
hod
of
Area
Est
imat
e Ro
ot b
iom
ass
Data
sou
rce
Relia
bilit
yCo
mm
ents
(veg
etat
ion,
soi
l)(t/
ha,
biom
ass
Calc
ulat
ion
and
Basi
s or
root
:sho
ot
(Ref
No.
,(A
GO C
riter
ia)
varia
nce)
estim
ated
(Allo
met
ric,
(ha,
plo
ts e
tc)
(t/ha
, ~R/
S)un
publ
ishe
d)ex
pans
ion
fact
or, e
tc)
38
E. o
bliq
ua.
Talla
gand
a St
ate
497
as a
bove
as
abo
ve
3 x
0.04
ha
plot
sas
abo
ve1)
Loc
atio
n: P
ositi
on
as a
bove
NS
W
Med
ium
tem
pera
teFo
rest
, NSW
.of
plo
ts is
acc
urat
ely
dry
high
euca
lypt
fore
st.
149
36’ 2
1” E
loca
ted
on to
pogr
aphi
c M
atur
e st
ands
of
35 3
0’ 3
7” S
and
com
partm
ent m
aps.
mul
tiple
age
/ si
ze2)
Are
a es
timat
e: P
lot
coho
rts. S
oils
of
cove
rs fo
rest
m
oder
ate
- hig
hre
pres
enta
tive
of >
1 ha
ferti
lity
on ig
neou
s3)
Mat
urity
: The
fore
stpa
rent
mat
eria
l.st
and
is c
onsi
dere
d‘m
atur
e’, w
ith a
fully
st
ocke
d, m
ultip
le-a
ged
stan
d. R
egen
erat
ion
has
occu
rred
follo
win
g se
lect
ive
harv
estin
g an
d so
me
wild
fires
.
39
E. o
bliq
ua.
Bend
oura
Sta
te49
3as
abo
ve
as a
bove
3
x 0.
04 h
a pl
ots
as a
bove
1)
Loc
atio
n: P
ositi
on
as a
bove
NSW
M
ediu
m te
mpe
rate
Fore
st, N
SW.
of p
lots
is a
ccur
atel
ydr
y lo
weu
caly
pt fo
rest
. Mat
ure
149
41’ 0
7” E
loca
ted
on to
pogr
aphi
cst
ands
of m
ultip
le
35 3
7’ 2
2” S
map
s. 2
) Are
a es
timat
e:ag
e / s
ize c
ohor
ts.
Plot
cov
ers
fore
st
Soils
of l
ow fe
rtilit
yre
pres
enta
tive
of >
1 ha
.on
sed
imen
tary
3)
Mat
urity
: The
fore
st
pare
nt m
ater
ial.
stan
d is
con
side
red
‘mat
ure’
, with
a fu
lly
stoc
ked,
mul
tiple
-age
d st
and.
Reg
ener
atio
n ha
s oc
curr
ed fo
llow
ing
som
e w
ildfir
es.
Note
s:1)
All s
ites
coul
d be
loca
ted
agai
n in
the
field
and
are
acc
urat
ely
loca
ted
on to
pogr
aphi
c m
aps.
GPS
loca
tions
cou
ld b
e ob
tain
ed.
2)Va
rianc
e ca
n be
cal
cula
ted
for t
hese
bio
mas
s es
timat
es in
two
way
s: (1
) rep
licat
ed p
lots
at a
site
, how
ever
, the
re a
re fe
w e
xam
ples
whe
re th
ese
data
exi
st, o
r (2)
the
erro
r due
to p
redi
ctio
n us
ing
an
allo
met
ric e
quat
ion
for i
ndiv
idua
l tre
es w
ithin
a p
lot;
this
err
or te
rm c
an b
e ca
lcul
ated
for a
ll si
tes.
Australian Greenhouse Office40

National Carbon Accounting System Technical Report 41
3. WOODLAND DATA FROM QUEENSLAND
These notes have been extracted from: Growth andcarbon stock change in eucalypt woodlands in north-east Australia: ecological and greenhouse sinkimplications, W.H. Burrows, B.K. Henry, P.V. Back,M.B. Hoffmann, L.J. Tait, E.R. Anderson, N. Menke,T. Danaher, J.O. Carter and G.M. McKeon (2002).Global Change Biology 8, 769-784.
3.1 MATERIALS AND METHODS
3.1.1 Permanent monitoring plots
Data on vegetation structure and growth in thisstudy are from the Queensland Department ofPrimary Industries’ network of permanentvegetation monitoring sites established withingrazed woodland communities since 1982. A largenumber of different operators (>10) have beenresponsible for site selection over the years, avoidingareas close to obvious points of ongoing disturbancesuch as fences, yards and watering points. The siteswere not randomly selected in a statistical sense, but have been progressively established on rurallandholdings to provide a broad cover of vegetationcommunity and prehistory, dominant species andgeographical location across Queensland’s grazedwoodlands.
Woody plant composition and structure on thesesites were determined using the transect recordingand processing system (TRAPS) methodology (Back et al. 1997; 1999) for monitoring permanentlypositioned transect lines within representative standsof woodlands (Burrows et al. 2000). A standard sitecomprised five parallel belt transects 100 m longarranged along a north-south axis 25 m apart. Each transect set was contained within a minimum300 m x 300 m buffer of similar vegetation. Stemcircumference at 30 cm above-ground and heightwere measured for all live and dead woody plants(but see later) within a 2 m band either side of thetransect line, at each successive recording.
3.1.2 Site representativeness
Fifty seven TRAPS sites dominated by Eucalyptus
and/or Corymbia spp. were selected for analysis of woody vegetation growth and carbon stockchange. Selection was based on field inspection and information supplied by landholders so as toexclude sites subject to tree clearing activity duringthe period of observation and sites regrowing fromtree clearing within the previous 20 years.
The study area was delimited to the north by 17 degrees south latitude, and to the west by either141 degrees longitude, or the 450 mm rainfallisohyet, whichever was further east. The extent ofeucalypt woodlands within this area was defined byfirstly determining the historic coverage of eucalyptdominant woodlands from the Carnahan (1976) mapof subjectively estimated pre-European vegetationcover and then assessing the current area from thewoody vegetation cover in 1997, as mapped fromsatellite imagery (Department of Natural Resources1999).
The representativeness of the subset of 57 TRAPSsites in the present study was assessed in relation to a) rainfall; b) temperature; c) soils; and d) standbasal area based on the approach of Austin &Meyers (1996) for assessing the distribution of study plots in both environmental (defined by temperature, rainfall and lithology) andgeographical space, for evidence of spatial bias insampling. Environmental representativeness wasassessed using an approach similar to commonstratification techniques for vegetation resourcesurveys (for example, Thackway & Cresswell 1992)based on the attributes of rainfall and temperature of the wettest quarter, and soil texture classes.Temperature and rainfall data were also used toassess how well the 57 sites represented spatialvariation in the interaction of these environmentalparameters.
Climatic variables were derived from the ANUCLIMmodule which utilises topographic data to obtainclimatic interpolations of high resolution (McMahon

Australian Greenhouse Office42
et al. 1996) and soil classification was from the Atlasof Australian Soils (Northcote et al. 1960-1968).Frequency distributions of average rainfall andtemperature and of soil classes for the eucalyptwoodlands of the study area, obtained by extractingthe variable values at the intersections of a 5 kmgrid, were compared qualitatively and by χ2 testwith those for the TRAPS sites. To assess therepresentativeness of the interaction of temperatureand rainfall, averaged data for the study area andTRAPS sites were classified into discrete classes of 1oC and 50 mm increments. All areas withenvironmental conditions represented by at least one TRAPS site were mapped and the proportion of eucalypt woodlands sampled was determined.
The representativeness in terms of tree basal areawas assessed by comparing the stand basal area atthe TRAPS sites with values measured using acombination of remote sensing and site data in theStatewide Landcover and Trees Study (SLATS)project (Danaher et al., 1992). The tree (or woody)basal area frequency distribution had beencalculated from a raster of woody vegetation cover(foliage projective cover) from Landsat TM (30 mresolution) data using a relationship derived byKuhnell et al. (1998). This relationship applies onlyto mature stands of vegetation and therefore was not applied to areas mapped as young regrowth.Kuhnell et al. (1998) estimated stand basal area atbreast height (approximately 130 cm above-ground)whereas basal area at the TRAPS sites was measuredat 30 cm. To enable comparison of the two datasets arelationship between circumference (mm) at 30 cmand at 130 cm above-ground level was developedbased on circumference (C) at the two heightsmeasured on 54 eucalypt trees (3 species) harvestedfor biomass measurement (Burrows et al. 2000), C130 cm = 0.789 C30 cm (r2 through the origin = 0.89).
3.1.3 Representativeness of the climate history
To determine how well the TRAPS measurementperiods represented the available climate history, therainfall for each observation period at each site was
compared to the long-term rainfall records for thatsite. Rainfall for 1889 to 2000 (SILO database 2000 -see Jeffrey et al. 2001) for individual TRAPS sites was subdivided into observation records (movingwindows) corresponding to the same calendar startday and duration of individual observation periods.This ensured the same sequence of seasons wascompared throughout the climatic record. Rainfallduring the TRAPS observation period, expressed as a percentile of rainfall in all moving windows(Kendall & Buckland 1971) gave the rainfall for each site ranked in relationship to all availableobservations. The frequency of ranked sitepercentiles thus summarises the relativedryness/wetness during the observation period,allowing comparison between sites.
3.1.4 Stand structure
Eucalyptus and/or Corymbia spp. plants alive at theinitial and final recording of each site were groupedinto 200 mm circumference classes (0 - 200, 200 - 400,…… 3600 - 3800 mm) to examine the size classdistribution and interpret stand growth status. Basal area in each class was calculated andconverted to carbon biomass as described below.There was a wide diversity of size class distributionsamongst the 57 sites and statistical methods wereused to select examples for illustration. Sites werefirstly characterised using variables such as standprehistory together with measures of standarddeviation, skewness and kurtosis. Divisive Clusteranalysis (Mathsoft, 1997) was used to group the sites and the stand structure of a representativeindividual site from each of the eight largest groupswas subjectively selected for display.
3.1.5 Tree basal area
Tree basal area at each site was calculated from thecircumference at 30 cm for the live and standingdead pools shown. The two major groups of woody plants, eucalypts and non-eucalypts, wererecorded separately. Circumference measurements of all live woody plants at each observation enabledbasal area to be calculated for those plants live at

National Carbon Accounting System Technical Report 43
both initial and final recordings, plants live at the initial recording but which died during theobservation period, and plants which establishedduring the observation period (ingrowth). Standingdead woody plants were measured at the finalrecording enabling calculation of basal area forplants that died during the observation period andplants that were dead also at the initial observation(see later). The position of standing dead trees wasrecorded at the initial observation, but circumferencewas not measured. Coarse woody debris was notmeasured in this study. A small minority of plantsthat both established and died between the initialand final
1recordings was ignored. The mean tree
basal area increment (m2 ha-1 y-1) for all live treespresent at both initial and final recordings wasdetermined as the average across all sites andobservation periods. This increment was alsoexpressed as the mean percentage of the originalbasal area of live trees in each stand.
3.1.6 Live above-ground biomass
The procedure for calculating live biomass fromstem circumference used in this analysis is a furtherdevelopment of the procedure described by Burrowset al. (2000) and outlined here in points 1 to 4.
1. Woodland stands within the same area asused in the present study were selected torepresent three dominant species (Eucalyptus
crebra, E. melanophloia, E. populnea).
2. The above- and below-ground biomass of 20-40 plants of each species was measured and used to derive tree species allometricequations (Table 2, Burrows et al. 2000) and ageneralised eucalypt equation (Fig. 1, Burrowset al. 2000).
3. Specific or generalised equations for above-ground biomass were applied to individualeucalypt trees for 33 TRAPS sites whereeucalypts contributed >75% of stand basalarea. If the basal area of any individualeucalypt was greater than that of the largest
tree used in developing the above equationsthen the biomass was set to the maximumbiomass of trees measured in developing theequations.
4. Total above-ground biomass of the eucalyptcomponent of the stand was calculated andregressed on stand eucalypt live tree basal area(Fig. 3, Burrows et al. 2000) suggesting thatstand biomass could be simply estimated fromstand live tree basal area for the eucalypts.
The following additional steps were taken to extendthis calculation procedure to other stands and othercomponents of eucalypt stands:
5. Step 3 was repeated for an additional 24TRAPS sites with eucalypt compositiongreater than 50% and a new relationshipbetween stand live above-ground biomass and eucalypt basal area established.
6. The relationship derived in Step 5 wasapplied to total stand live tree basal areaassuming that the biomass density (t drymatter per m2 stand basal area) of eucalypttrees holds also for non-eucalypts. Theappropriateness of this assumption isdiscussed later.
3.1.7 Above-ground biomass of standing dead trees
A decay function for standing dead E. populnea treeswas derived in 1997 for a site in the Dingo region of central Queensland that had reliable records ofindividual trees ringbarked (girdled) or killed bychemical injection between 1933 and 1987 (Burrows,unpublished data). Standing dead trees (with nobark remaining) contributing to this function wereharvested and weighed. Correction factors derivedfrom harvesting tree fractions used to deriveallometrics (Burrows et al. 2000) enabled over barkcircumference at time of tree death, and hence finallive weight, to be estimated. For decay periods lessthan 64 years, the biomass change can be derivedfrom:
1The most recent observation is referred to as the ‘final’ observation for purposes of this paper.

Australian Greenhouse Office44
y = 24.4 + 75.6 e -0.14x (r2 = 0.99, p <0.001) (1),
where y = % of original live standing above-groundbiomass remaining; x = time in years since treedeath; n = 14.
The relationship was not extrapolated beyond theequivalent time range over which it was derived.
For trees that died during the observation period,the biomass at the initial recording was calculatedfrom basal area using the generalised biomass tobasal area conversion derived as above. Since thetime of death within the observation period was not known, death was assumed to have occurredimmediately following the first measurement and the decay function (1) used to estimate theproportion of the initial biomass remaining at thefinal observation. This assumption of maximumdecay period, gave a conservative estimate of thefinal biomass.
3.1.8 Estimation of the biomass of trees dead at the initial recording
Standing trees that were dead at the initial recordingwere measured only at the final observation. Thesedead plants were mostly trunks with a few largelateral branches but with no small branches, leavesor bark remaining. We estimated that such deadtrees on the TRAPS sites had been dead for anaverage of 20 years before the initial recording,based on our field observations of dead trees ofknown age. The same procedure used to derive theabove decay function enabled conversion of stemcircumferences of standing dead trunks, measuredfree of bark, to the original over bark circumference.
The generalised biomass to basal area relationshipdescribed previously was divided by the mean ratioof standing biomass to trunk mass for woodlandeucalypt trees (Burrows et al. 2000) to give aconversion factor for the basal area (corrected toover bark) to biomass of trunk of standing dead. The derived trunk mass was assumed toapproximate the standing dead tree mass at the final recording (t2). The biomass of standing dead
at the initial recording date (t1) was estimated using the above decay function (1):
Biomass remaining at initial observation, t1
(20 years since death),
Biomass at final observation, t2
Thus, (2)
where t1 = 20 years; t2 = 20 + (years between initialand final recording); B0 = biomass at time of death; = standing dead biomass at t1; = standing deadbiomass at t2. Maximum time (t2) since estimateddeath for standing dead trees on the oldestestablished TRAPS site was 38 years – well withinthe time range of the derived decay function.
REFERENCESAustin, M.P., Meyers, & J.A. (1996) Currentapproaches to modelling the environmental niche ofeucalypts: implication for management of forestbiodiversity. Forest Ecology and Management, 85, 95-106.
Back, P.V., Anderson, E.R., Burrows, W.H., Kennedy,M.K.K. & Carter, J.O. (1997) TRAPS - transect
recording and processing system: field guide and software
manual. Queensland Department of PrimaryIndustries, Rockhampton, 36 pp.
Back, P.V., Burrows, W.H. & Hoffmann, M.B. (1999)TRAPS: a method for monitoring the dynamics oftrees and shrubs in rangelands. Proceedings VIth
International Rangeland Congress, 2, 742-744.
Bt1= ––— (24.4 + 75.6e -0.14t1)100
B0
Bt2= ––— (24.4 + 75.6e -0.14t2)100
B0
Bt1= Bt2
––——————— ,24.4 + 75.6e -0.14t1
24.4 + 75.6e -0.14t2

National Carbon Accounting System Technical Report 45
Burrows, W.H., Hoffmann, M.B., Compton, J.F., Back,P.V. & Tait, L.J. (2000) Allometric relationships andcommunity biomass estimates for some dominanteucalypts in Central Queensland woodlands.Australian Journal of Botany, 48, 707-714.
Carnahan, J.A. (1976) Natural Vegetation, Map withaccompanying booklet commentary. In: Atlas of
Australian Resources. Second Series, Department ofNational Resources, Canberra.
Danaher, T., Carter, J.O., Brook, K.D. & Dudgeon, G.(1992) Broadscale vegetation mapping using NOAAAVHRR imagery. In Proceedings of the 6th Australasian
Remote Sensing and Photogrammetry Conference,
2-6 November 1992, Wellington, New Zealand, Vol.3, pp.128-137.
Department of Natural Resources (1999) Land Cover Change in Queensland 1995-1997, A StatewideLandcover and Trees Study (SLATS) report, August1999. http://www.dnr.qld.gov.au/slats
Jeffrey, S.J., Carter, J.O., Moodie, K.B. & Beswick,A.R. (2001) Using spatial interpolation to construct acomprehensive archive of Australian climate data.Journal of Environmental Modelling and Software, 16,309-330.
Kendall, M.G. & Buckland, W.R. (1971) A dictionaryof statistical terms / prepared for the InternationalStatistical Institute 3rd ed. revised and enlarged.Published for the International Statistical Institute by Oliver and Boyd, Edinburgh.
Kuhnell, C., Goulevitch, B., Danaher, T. & Harris, D.(1998) Mapping woody vegetation cover over theState of Queensland using Landsat TM imagery. In: Proceedings of the 9th Australasian Remote Sensing
and Photogrammetry Conference, Sydney, Australia,July 1998.
McMahon, J.P., Hutchinson, M.F., Nix, H.A. & Ord, K.D. (1996) ANUCLIM Version 1 User’s Guide. ANU CRES, Canberra.http://cres.anu.edu.au/outputs/software.html
Mathsoft (1997) S-PLUS User’s Guide Data AnalysisProducts Division, Mathsoft, Seattle.
Northcote, K.H., Beckman, G.G. & Bettenay, E. et al.
(1960-1968) Atlas of Australian Soils, Sheets 1 to 10
with explanatory data. CSIRO and MelbourneUniversity Press, Melbourne.
Thackway, R. & Cresswell, I.D. (1992) Environmental
regionalisations of Australia : a user-oriented approach.
Environmental Resources Information Network,Canberra.

Australian Greenhouse Office46
Site
Desc
riptio
n So
il Lo
catio
n Lo
catio
n Eu
caly
ptus
Eu
caly
ptus
M
etho
d of
Bi
omas
sTo
tal D
ead
Year
whe
nAr
eaRo
otDa
taRe
liabi
lity
Com
men
tsof
Woo
dlan
dsty
peLa
titud
e.Lo
ngitu
de.
Biom
ass
Biom
ass
Calc
ulat
ion
of O
ther
Bi
omas
s bi
omas
sEs
timat
ebi
omas
sso
urce
(AGO
(t/
ha)
(S.E
.E.)
spp.
(t/
ha)*
**es
timat
edan
d (e
uc) (
t/ha,
Cr
iteria
(t/ha
)**
Basi
s*fro
m R
:S
ratio
of 0
.26)
1E.
pop
ulne
aGn
2.12
27o 8’
146o 59
’59
.85
14.6
6Al
lom
etric
39.4
533
.16
2000
ha, p
lots
15.5
6aUn
publ
ishe
d
2E.
fibro
saUg
5.1
22o 58
’15
0o 16’
189.
9326
.06
Allo
met
ric0.
004.
1019
99ha
, plo
ts49
.38a
Unpu
blis
hed
3E.
mel
anop
hloi
aDy
3.33
21o 35
’14
5o 42’
51.4
714
.89
Allo
met
ric2.
860.
1519
99ha
, plo
ts13
.38a
Unpu
blis
hed
4E.
bro
wni
iUm
4.2
21o 17
’14
7o 17’
44.0
811
.49
Allo
met
ric8.
1130
.62
2000
ha, p
lots
11.4
6aUn
publ
ishe
d
5E.
mel
anop
hloi
aGn
2.12
23o 10
’14
6o 34’
48.6
616
.52
Allo
met
ric8.
6525
.01
1999
ha, p
lots
12.6
5aUn
publ
ishe
d
6E.
mel
anop
hloi
aDr
2.12
24o 10
’15
0o 6’46
.10
7.56
Allo
met
ric0.
451.
3419
99ha
, plo
ts11
.99a
Unpu
blis
hed
7E.
mel
anop
hloi
aDr
2.12
25o 40
’15
0o 58’
41.9
810
.51
Allo
met
ric0.
132.
6919
99ha
, plo
ts10
.92a
Unpu
blis
hed
8E.
cre
bra
Dy2.
4321
o 19’
148o 21
’4.
713.
20Al
lom
etric
0.06
25.1
720
00ha
, plo
ts1.
22a
Unpu
blis
hed
9E.
cre
bra
Gn2.
2124
o 57’
149o 49
’68
.98
16.6
3Al
lom
etric
23.5
70.
0019
92ha
, plo
ts17
.94a
Unpu
blis
hed
10E.
citr
iodo
raDy
3.41
25o 41
’15
1o 21’
155.
4156
.06
Allo
met
ric8.
1612
.04
2000
ha, p
lots
40.4
1aUn
publ
ishe
d
11E.
qua
dric
osta
taUc
2.21
20o 17
’14
5o 31’
71.1
314
.19
Allo
met
ric1.
843.
5219
99ha
, plo
ts18
.49a
Unpu
blis
hed
12E.
cre
bra
Dy3.
4222
o 34’
149o 32
’14
0.99
27.1
4Al
lom
etric
0.43
7.06
2000
ha, p
lots
36.6
6aUn
publ
ishe
d
13E.
pop
ulne
aDy
2.42
23o 10
’15
0o 33’
106.
2117
.32
Allo
met
ric0.
484.
8119
99ha
, plo
ts27
.61a
Unpu
blis
hed
14E.
pla
typh
ylla
Dy3.
4320
o 36’
147o 31
’29
.50
7.48
Allo
met
ric0.
812.
7020
00ha
, plo
ts7.
67a
Unpu
blis
hed
15E.
org
adop
hila
Ug5.
1222
o 41’
148o 2’
26.2
84.
71Al
lom
etric
2.03
1.29
1998
ha, p
lots
6.83
aUn
publ
ishe
d
16E.
mel
anop
hloi
aGn
2.12
23o 34
’14
6o 57’
67.3
820
.23
Allo
met
ric4.
260.
2319
99ha
, plo
ts17
.52a
Unpu
blis
hed
17E.
whi
tei
Gn2.
2221
o 57’
144o 50
’18
.93
5.35
Allo
met
ric2.
403.
1919
99ha
, plo
ts4.
92a
Unpu
blis
hed
18E.
sim
ilis
Gn2.
1120
o 50’
145o 5’
36.5
88.
56Al
lom
etric
9.95
1.01
1999
ha, p
lots
9.51
aUn
publ
ishe
d
19E.
mel
anop
hloi
aGn
2.12
26o 45
’14
7o 34’
72.3
617
.32
Allo
met
ric5.
529.
6520
00ha
, plo
ts18
.81a
Unpu
blis
hed
20E.
cre
bra
Gn2.
1123
o 4’14
9o 20’
127.
5927
.51
Allo
met
ric8.
402.
5919
99ha
, plo
ts33
.17b
Unpu
blis
hed
21E.
xan
thoc
lada
Dr2.
1220
o 28’
146o 43
’20
.91
11.1
8Al
lom
etric
0.92
5.57
1998
ha, p
lots
5.44
aUn
publ
ishe
d
22E.
xan
thoc
lada
Dr2.
1220
o 24’
146o 43
’5.
063.
80Al
lom
etric
0.45
17.5
919
98ha
, plo
ts1.
32a
Unpu
blis
hed
23E.
cre
bra
Gn2.
1123
o 56’
149o 36
’73
.52
11.0
4Al
lom
etric
6.19
4.19
1999
ha, p
lots
19.1
2aUn
publ
ishe
d
24E.
cre
bra
Dr2.
1220
o 9’14
6o 28’
15.1
28.
87Al
lom
etric
1.62
0.86
1998
ha, p
lots
3.93
aUn
publ
ishe
d
25E.
mel
anop
hloi
aGn
2.94
20o 58
’14
5o 51’
25.9
412
.48
Allo
met
ric9.
7322
.01
1999
ha, p
lots
6.74
aUn
publ
ishe
d
26E.
cre
bra
Dy3.
4124
o 47’
151o 38
’12
4.69
30.4
3Al
lom
etric
23.4
95.
7619
90ha
, plo
ts32
.42a
Unpu
blis
hed
27E.
pop
ulne
aUg
5.24
23o 38
’15
0o 38’
93.3
49.
06Al
lom
etric
1.64
4.33
1999
ha, p
lots
24.2
7aUn
publ
ishe
d
28E.
xan
thoc
lada
Dr2.
1219
o 50’
146o 35
’27
.66
7.07
Allo
met
ric0.
037.
0619
98ha
, plo
ts7.
19a
Unpu
blis
hed

National Carbon Accounting System Technical Report 47
29E.
xan
thoc
lada
Dr2.
1219
o 50’
146o 35
’14
.09
5.15
Allo
met
ric0.
0011
.37
1998
ha, p
lots
3.66
aUn
publ
ishe
d
30E.
tere
ticor
nis
Db1.
3323
o 44’
147o 19
’11
7.79
22.0
4Al
lom
etric
0.01
1.31
2000
ha, p
lots
30.6
2aUn
publ
ishe
d
31E.
mic
rone
ura
Uc4.
1218
o 15’
143o 32
’50
.90
14.3
0Al
lom
etric
6.67
0.05
1998
ha, p
lots
13.2
4aUn
publ
ishe
d
32E.
cre
bra
Dy3.
4123
o 1’15
0o 12’
120.
7929
.12
Allo
met
ric3.
938.
0519
99ha
, plo
ts31
.41a
Unpu
blis
hed
33E.
cre
bra
Dr2.
1220
o 18’
147o 53
’46
.83
14.0
4Al
lom
etric
8.58
5.62
2000
ha, p
lots
12.1
8aUn
publ
ishe
d
34E.
bro
wni
iGn
2.22
19o 58
’14
5o 46’
61.6
111
.02
Allo
met
ric0.
2910
.68
1999
ha, p
lots
16.0
2aUn
publ
ishe
d
35E.
mic
rone
ura
Uc4.
1218
o 17’
143o 24
’56
.81
12.8
2Al
lom
etric
16.3
42.
5319
98ha
, plo
ts14
.77a
Unpu
blis
hed
36E.
citr
iodo
raDy
3.41
24o 12
’15
1o 20’
96.9
812
.99
Allo
met
ric14
.65
9.72
1999
ha, p
lots
25.2
1aUn
publ
ishe
d
37E.
cre
bra
Gn3.
1218
o 33’
144o 47
’70
.34
14.5
9Al
lom
etric
0.63
0.54
1998
ha, p
lots
18.2
9aUn
publ
ishe
d
38E.
mel
anop
hloi
aDr
2.31
24o 54
’14
8o 20’
109.
6627
.54
Allo
met
ric2.
876.
7819
99ha
, plo
ts28
.51a
Unpu
blis
hed
39E.
mel
anop
hloi
aDy
3.22
25o 1’
150o 47
’52
.26
14.7
1Al
lom
etric
0.00
3.09
1999
ha, p
lots
13.5
9aUn
publ
ishe
d
40E.
mol
ucca
naDy
3.41
23o 41
’15
1o 1’20
0.81
31.4
9Al
lom
etric
0.00
11.0
819
99ha
, plo
ts52
.21a
Unpu
blis
hed
41E.
cre
bra
Dy3.
4225
o 8’15
0o 45’
129.
2122
.14
Allo
met
ric0.
189.
7519
99ha
, plo
ts33
.60a
Unpu
blis
hed
42E.
org
adop
hila
Ug5.
124
o 8’14
8o 7’30
.03
7.90
Allo
met
ric21
.45
4.92
2000
ha, p
lots
7.81
aUn
publ
ishe
d
43C.
ery
thro
phlo
iaDr
2.12
20o 19
’14
6o 47’
21.7
15.
26Al
lom
etric
1.18
9.79
1998
ha, p
lots
5.64
aUn
publ
ishe
d
44C.
ery
thro
phlo
iaDr
2.12
20o 19
’14
6o 47’
10.7
14.
71Al
lom
etric
0.50
4.85
1998
ha, p
lots
2.78
aUn
publ
ishe
d
45E.
mel
anop
hloi
aGn
2.12
23o 45
’14
6o 2’51
.33
10.7
3Al
lom
etric
1.99
4.48
1999
ha, p
lots
13.3
5bUn
publ
ishe
d
46E.
mel
anop
hloi
aDy
5.41
25o 19
’14
8o 01’
61.3
710
.37
Allo
met
ric25
.44
2.26
2000
ha, p
lots
15.9
6aUn
publ
ishe
d
47E
sim
ilis
Gn2.
1222
o 25’
145o 31
’23
.93
6.00
Allo
met
ric5.
264.
4419
99ha
, plo
ts6.
22a
Unpu
blis
hed
48E.
pop
ulne
aGn
2.22
23o 33
’14
5o 50’
57.6
011
.89
Allo
met
ric10
.60
4.04
1999
ha, p
lots
14.9
8aUn
publ
ishe
d
49E.
pap
uana
Uc5.
1123
o 46’
145o 14
’26
.77
5.52
Allo
met
ric4.
181.
6319
99ha
, plo
ts6.
96a
Unpu
blis
hed
50E.
cre
bra
Gn2.
1123
o 41’
149o 31
’10
8.19
31.9
0Al
lom
etric
21.9
25.
2919
99ha
, plo
ts28
.13a
Unpu
blis
hed
51E.
mel
anop
hloi
aGn
2.11
23o 40
’14
9o 30’
115.
5614
.53
Allo
met
ric1.
814.
9919
98ha
, plo
ts30
.05a
Unpu
blis
hed
52E.
mol
ucca
naGn
2.11
23o 41
’14
9o 32’
85.9
031
.07
Allo
met
ric10
.40
16.5
319
99ha
, plo
ts22
.33a
Unpu
blis
hed
53E.
bro
wni
iDr
2.12
22o 22
’14
6o 41’
48.3
317
.10
Allo
met
ric1.
2915
.46
2000
ha, p
lots
12.5
6aUn
publ
ishe
d
54E.
pop
ulne
aDy
2.43
23o 38
’14
9o 25’
38.3
710
.28
Allo
met
ric3.
955.
4119
98ha
, plo
ts9.
98a
Unpu
blis
hed
55E.
pop
ulne
aDy
2.43
23o 37
’14
9o 25’
70.8
110
.22
Allo
met
ric13
.46
1.41
1998
ha, p
lots
18.4
1bUn
publ
ishe
d
56E.
pop
ulne
aDy
2.43
23o 36
’14
9o 26’
55.6
111
.67
Allo
met
ric12
.19
5.07
1998
ha, p
lots
14.4
6aUn
publ
ishe
d
57E.
pop
ulne
aGn
2.12
27o 38
’14
8o 52’
90.2
214
.72
Allo
met
ric17
.09
8.12
2000
ha, p
lots
23.4
6aUn
publ
ishe
d
*Pl
ot a
rea
100
m x
100
m -
sam
pled
with
5 b
elt tr
anse
cts
100
m x
4 m
.**
Calcu
lated
by
stan
d all
omet
rics
***
Tota
l of d
ead
Euca
lyptu
s an
d Ot
her s
pp.
aDa
ta b
ased
on
mea
n va
lues
as
dete
rmin
ed b
y Bu
rrow
s et
al.
(200
0).
bDa
ta b
ased
on
actu
al m
easu
rem
ents
(see
Bur
row
set
al.
(200
0).

Australian Greenhouse Office48
4. SHRUBLAND, WOODLAND AND FORESTDATA FROM WESTERN AUSTRALIA
The following analysis of above-ground biomassand its C content for the shrubland and woodlandcommunities in the Pilbara encompassed:
• Field work at 35 sites within an area coveringmore than 60,000 km2.
• Dimensional analysis of >2300 trees andshrubs and >100 analyses of the physicaldimensions of tussock and hummock grasses.
• Harvesting and destructive sampling (fordimensions and mass) of >200 trees andshrubs and >60 grass hummocks / tussocks.
• Gravimetric analysis of >5000 plant samples.
• Statistically rigorous (the number of sub-plots,n, varied between 3 and 11) measures ofbiomass and C content for 27 sites.
The projected area of the canopy of trees and shrubs,as well as the area occupied by the tussocks orhummocks of the major grasses, provided robust,independent variables for the estimation of biomassof individual plants (explaining up to 97% of thevariation in mass). In many instances, canopy areaprovided a better estimation of mass than the moretraditionally used DBHOB for trees or basaldiameter for shrubs. This finding suggests potentialto use remote sensing to estimate biomass and Ccontent of vegetation.
The C content of above-ground biomass varied from as little as 0.5 t ha-1 to just over 25 t ha-1. The majority of study sites contained less than 5 t ha-1. Dense stands of Mulga (Acacia aneura)associated with the deepest soils (e.g. Mulga‘groves’) and/or the major rivers (e.g. Fortescue -floodplains) contained the most biomass C in thePilbara, followed by examples of Snappy gum(Eucalyptus leucophloia) tree-steppe (between 10 and17 t ha-1). However, even these vegetation ‘types’showed high spatial variation with <2 t ha-1
recorded for several stands of Mulga.
Spinifex (Triodia spp.) contributed a high proportionof above-ground biomass at many sites containing up to 7 t C ha-1 but more typically around 2 t C ha-1.Buffel grass (Cenchrus spp.), a major component ofthe vegetation on the floodplains at Ethel CreekStation, always contained <2 t C ha-1.
The data collected suggest that for the Pilbara and elsewhere in Australia, arid and semi-aridcommunities contain considerably less C than has been estimated from ‘international’ models. The reasons for this are probably high temperaturesand low rainfall coupled in many instances withsoils having poor physical properties.
This study has highlighted several features of thePilbara vegetation. First, above-ground biomass andits C content are generally far less than ‘default’values ascribed by the Intergovernmental Panel onClimate Change (IPCC) and used in the past by theAGO. Secondly, the ‘carbon density’ varies stronglyaccording to the vegetation type (e.g. grasslandswith few trees or shrubs contain often <1 t C ha-1
whilst nearby groves of Mulga may contain ~15 t C ha-1) and also to the availability of water to the vegetation. It should be noted that by far the largest areas of the Pilbara are dominated byspinifex with scattered shrubs, usually acacias. This vegetation ‘type’ will nearly always contain <5 t C ha-1 in the above-ground biomass.
Details for specific ecosystems are contained in the following table.
REFERENCESAdams, M.A., Grierson, P.F., Bussau, A. & Dorling,K. (2001). Biomass and carbon in vegetation of thePilbara region, Western Australia. Final reportsubmitted to Hamersley Iron, BHP and Robe, July2001. Ecosystems Research Group, The University of Western Australia, Crawley. 118 pp.
Ingram, L.J. (2001). Growth, nutrient cycling andgrazing of three perennial tussock grasses of thePilbara region of NW Australia. PhD Thesis,
The University of Western Australia.
National Carbon Accounting System Technical Report 49
Grierson, P.F. & Adams, M.A. (2002). Temporal andspatial variations in biomass and 13C of fine roots ina jarrah (Eucalyptus marginata (Donn ex Sm)) forest in south-western Australia. Oecologia (submitted)

Australian Greenhouse Office50
Site
Desc
riptio
n Lo
catio
nIn
divi
dual
Bi
omas
sYe
ar
Met
hod
of C
alcu
latio
nAr
ea E
stim
ate
Root
bio
mas
sDa
ta s
ourc
e Re
liabi
lity
Com
men
tsAr
ea in
the
(veg
etat
ion,
soi
l)si
tes
(t/ha
) (t/
ha, S
E)
whe
n(A
llom
etric
, exp
ansi
onan
d Ba
sis
(ha,
plo
ts e
tc)
or ro
ot:s
hoot
(R
ef, u
npub
lishe
d)(A
GO
Pilb
ara
note
: bi
omas
set
c)(t/
ha, ~
R/S)
Crite
ria)
regi
on o
f ab
ove-
grou
nd
estim
ated
this
biom
ass
vege
tatio
n fa
ctor
ty
pe (h
a x
ONLY
1000
)
1“P
eren
nial
gra
ssla
nds
- tus
sock
n=
122.
19 (.
714)
1996
/97
Allo
met
rics
deriv
ed fo
r Pe
renn
ial a
nd e
phem
eral
M
ean
root
In
gram
, L.J
. 200
1.gr
ass
(Ast
rebl
a, T
hem
eda,
ea
ch s
peci
es, i
nclu
ding
pl
ant b
iom
ass,
as
wel
l as
biom
ass
acro
ss
PhD
thes
is, U
WA.
Erag
rost
issp
ecie
s). S
oil
cove
r/bio
mas
s re
latio
nshi
pslit
terfa
ll, w
ere
sam
pled
al
l site
s, a
ll cl
assi
ficat
ion1
Ug
5.38
Ug
5.36
an
d by
des
truct
ive
sam
plin
g.fro
m b
oth
ungr
azed
sp
ecie
s, a
llUg
5.3
8(1
ha,
fenc
ed to
exc
lude
sam
plin
gSo
il de
scrip
tions
: fin
ely
text
ured
, ca
ttle
and
kang
aroo
s)
perio
dscr
acki
ng c
lays
; uni
form
text
ure;
an
d gr
azed
(1 h
a, o
pen
1.13
8, .3
63no
n-ca
lcar
eous
fine
ly te
xtur
ed,
to g
razin
g) p
lots
for t
hecr
acki
ng c
lays
; uni
form
text
ure;
pe
renn
ial t
usso
ck g
rass
eshi
ghly
cal
care
ous;
und
erly
ing
A. p
ectin
ata,
T. t
riand
ra
calc
rete
dep
osits
fine
ly te
xtur
ed,
and
E. x
erop
hila
crac
king
cla
ys; u
nifo
rm te
xtur
e;
calc
areo
us a
t dep
th”.
A. p
ectin
ata
graz
ed
22°
17.5
8 S
/1.
665
1996
/97
117°
41.2
0 E
A. p
ectin
ata
ungr
azed
22
°17
.58
S /
1.85
1996
/97
117°
41.2
0 E
T. tr
iand
ra g
raze
d 22
°17
.58
S /
4.94
919
96/9
711
7°41
.20
E
T. tr
iand
raun
graz
ed
22°
17.5
8 S
/5.
378
1996
/97
117°
41.2
0 E
E. x
erop
hila
gra
zed
20°
53.0
9 S
/1.
782
1996
/97
116°
40.0
5 E
E. x
erop
hila
ung
raze
d20
°53
.09
S /
1.85
519
96/9
711
6°40
.05
E
2Pe
renn
ial g
rass
land
s -h
umm
ock
22°
57.4
37 S
/ 1.
064.
49,
2000
Allo
met
rics
deriv
ed fo
r all
E. le
ucop
hloi
aw
as n
otIn
suffi
cien
t dat
a Ad
ams,
M.A
., Gr
ierso
n, P
.F.,
4082
gras
s/sp
inife
x co
mm
uniti
es11
7°09
.529
E1.
71sp
ecie
s co
mbi
ned
with
quan
tifie
d at
this
site
to
pre
dict
with
Bu
ssau
, A. &
Dor
ling,
K.
(Trio
dia
spec
ies)
.Nor
th-fa
cing
slope
(S
E)si
te in
vent
ory
data
.be
caus
e it
was
ver
y co
nfid
ence
.(2
001)
Bio
mas
s an
dan
d ha
d ro
cky
skel
etal
soi
l with
sp
arse
(gre
ater
than
ca
rbon
in v
eget
atio
nso
me
rock
out
crop
s. D
omin
ant
100
m b
etw
een
trees
). of
the
Pilb
ara
regi
on,
spec
ies
wer
e Tr
iodi
a pu
ngen
s w
ith
Spin
ifex
plan
ts in
thre
e W
este
rn A
ustra
lia. F
inal
sc
atte
red
Euca
lypt
usle
ucop
hloi
a.
10 m
x 1
0 m
qua
drat
s w
ere
repo
rt su
bmitt
ed to
m
easu
red
for h
eigh
t and
Ha
mer
sley
Iron
, BHP
circ
umfe
renc
e. N
ine
and
Robe
, Jul
y 20
01.
hum
moc
ks o
f Trio
dia
Ecos
yste
ms
Rese
arch
pung
ens
wer
e ha
rves
ted
Grou
p, T
he U
nive
rsity
of
at th
is s
ite.
Wes
tern
Aus
tralia
, Cra
wle
y. 11
8 pp
.
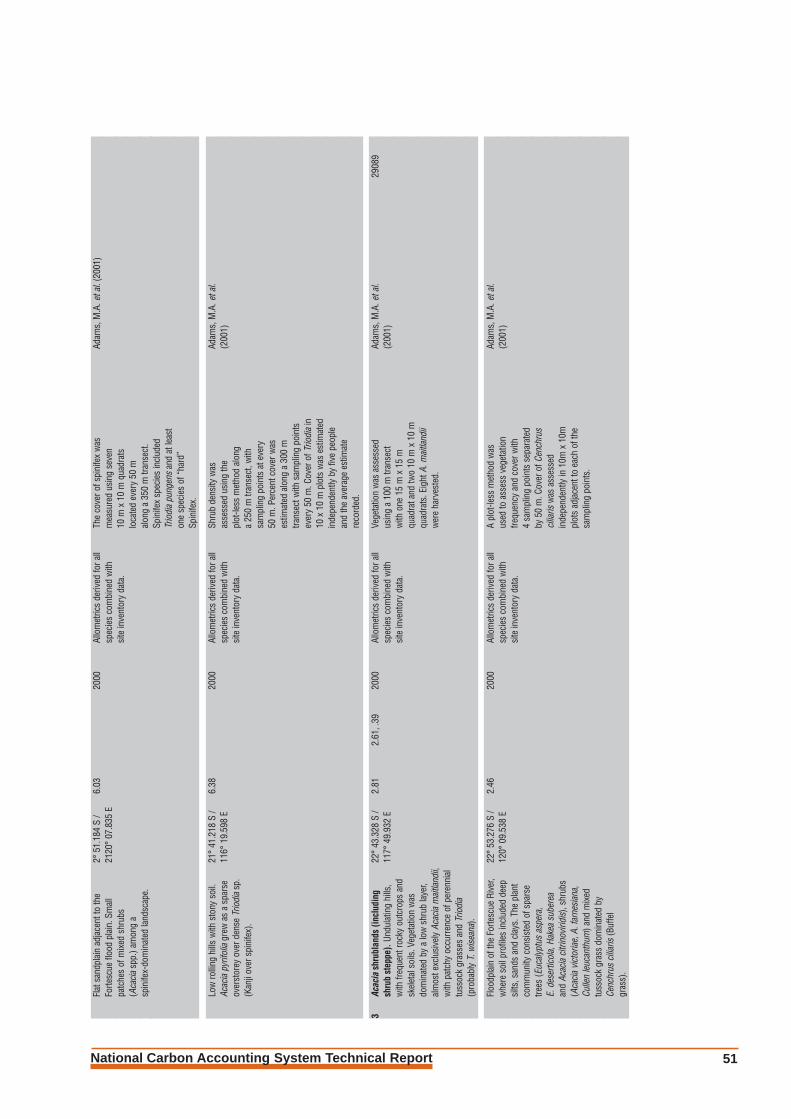
National Carbon Accounting System Technical Report 51
Flat
san
dpla
in a
djac
ent t
o th
e 2°
51.1
84 S
/ 6.
0320
00Al
lom
etric
s de
rived
for a
ll Th
e co
ver o
f spi
nife
x w
as
Adam
s, M
.A. e
t al.
(200
1)
Forte
scue
floo
d pl
ain.
Sm
all
2120
°07
.835
Esp
ecie
s co
mbi
ned
with
mea
sure
d us
ing
seve
n pa
tche
s of
mix
ed s
hrub
s si
te in
vent
ory
data
.10
m x
10
m q
uadr
ats
(Aca
cia
spp.
) am
ong
a lo
cate
d ev
ery
50 m
sp
inife
x-do
min
ated
land
scap
e.al
ong
a 35
0 m
tran
sect
. Sp
inife
x sp
ecie
s in
clud
ed
Trio
dia
pung
ens
and
at le
ast
one
spec
ies
of “
hard
” Sp
inife
x.
Low
rolli
ng h
ills
with
sto
ny s
oil.
21°
41.2
18 S
/ 6.
3820
00Al
lom
etric
s de
rived
for a
llSh
rub
dens
ity w
as
Adam
s, M
.A. e
t al.
Acac
ia p
yrifo
lia g
rew
as
a sp
arse
11
6°19
.598
Esp
ecie
s co
mbi
ned
with
as
sess
ed u
sing
the
(200
1)
over
stor
ey o
ver d
ense
Trio
dia
sp.
site
inve
ntor
y da
ta.
plot
-less
met
hod
alon
g(K
anji
over
spi
nife
x).
a 25
0 m
tran
sect
, with
sa
mpl
ing
poin
ts a
t eve
ry
50 m
. Per
cent
cov
er w
as
estim
ated
alo
ng a
300
m
trans
ect w
ith s
ampl
ing
poin
ts
ever
y 50
m. C
over
of T
riodi
ain
10
x 1
0 m
plo
ts w
as e
stim
ated
in
depe
nden
tly b
y fiv
e pe
ople
an
d th
e av
erag
e es
timat
e re
cord
ed.
3Ac
acia
shru
blan
ds (i
nclu
ding
22
°43
.328
S /
2.81
2.61
, .39
2000
Allo
met
rics
deriv
ed fo
r all
Vege
tatio
n w
as a
sses
sed
Adam
s, M
.A. e
t al.
2908
9sh
rub
step
pe).
Und
ulat
ing
hills
, 11
7°49
.932
Esp
ecie
s co
mbi
ned
with
us
ing
a 10
0 m
tran
sect
(2
001)
w
ith fr
eque
nt ro
cky
outc
rops
and
si
te in
vent
ory
data
.w
ith o
ne 1
5 m
x 1
5 m
sk
elet
al s
oils
. Veg
etat
ion
was
qu
adra
t and
two
10 m
x 1
0 m
do
min
ated
by
a lo
w s
hrub
laye
r, qu
adra
ts. E
ight
A. m
aitla
ndii
alm
ost e
xclu
sive
ly A
caci
a m
aitla
ndii,
w
ere
harv
este
d.w
ith p
atch
y oc
curr
ence
of p
eren
nial
tu
ssoc
k gr
asse
s an
d Tr
iodi
a(p
roba
bly
T. w
isea
na).
Floo
dpla
in o
f the
For
tesc
ue R
iver
, 22
°53
.276
S /
2.46
2000
Allo
met
rics
deriv
ed fo
r all
A pl
ot-le
ss m
etho
d w
as
Adam
s, M
.A. e
t al.
whe
re s
oil p
rofil
es in
clud
ed d
eep
120°
09.5
38 E
spec
ies
com
bine
d w
ith
used
to a
sses
s ve
geta
tion
(200
1)
silts
, san
ds a
nd c
lays
. The
pla
nt
site
inve
ntor
y da
ta.
frequ
ency
and
cov
er w
ith
com
mun
ity c
onsi
sted
of s
pars
e 4
sam
plin
g po
ints
sep
arat
ed
trees
(Euc
alyp
tus
aspe
ra,
by 5
0 m
. Cov
er o
f Cen
chru
sE.
des
ertic
ola,
Hak
ea s
uber
ea
cilia
risw
as a
sses
sed
and
Acac
ia c
itrin
oviri
dis)
, shr
ubs
inde
pend
ently
in 1
0m x
10m
(A
caci
a vi
ctor
iae,
A. f
arne
sian
a,
plot
s ad
jace
nt to
eac
h of
the
Culle
n le
ucan
thum
) and
mix
ed
sam
plin
g po
ints
.tu
ssoc
k gr
ass
dom
inat
ed b
y Ce
nchr
us c
iliar
is (B
uffe
l gr
ass)
.

Australian Greenhouse Office52
Site
Desc
riptio
n Lo
catio
nIn
divi
dual
Bi
omas
sYe
ar
Met
hod
of C
alcu
latio
nAr
ea E
stim
ate
Root
bio
mas
sDa
ta s
ourc
e Re
liabi
lity
Com
men
tsAr
ea in
the
(veg
etat
ion,
soi
l)si
tes
(t/ha
) (t/
ha, S
E)
whe
n(A
llom
etric
, exp
ansi
onan
d Ba
sis
(ha,
plo
ts e
tc)
or ro
ot:s
hoot
(R
ef, u
npub
lishe
d)(A
GO
Pilb
ara
note
: bi
omas
set
c)(t/
ha, ~
R/S)
Crite
ria)
regi
on o
f ab
ove-
grou
nd
estim
ated
this
biom
ass
vege
tatio
n fa
ctor
ty
pe (h
a x
ONLY
1000
)
Floo
dpla
in o
f the
For
tesc
ue R
iver
, 22
°55
.360
S /
1.46
2000
Allo
met
rics
deriv
ed fo
r all
Both
ass
essm
ent t
echn
ique
s Ad
ams,
M.A
. et a
l.so
ils w
ere
deep
san
dy lo
ams
and
120°
13.3
34 E
spec
ies
com
bine
d w
ith
wer
e us
ed a
t thi
s si
te -
thre
e(2
001)
sa
ndy-
clay
loam
s. V
eget
atio
n w
as
site
inve
ntor
y da
ta.
10 m
x 1
0 m
qua
drat
s w
ere
mix
ed s
hrub
s an
d gr
asse
s. S
enna
esta
blis
hed
alon
g a
150
m
arte
mis
ioid
es s
pp. o
ligop
hlla
and
trans
ect,
and
a th
e pl
ot-le
ss
Acac
ia v
icto
riae
wer
e th
e do
min
ant
tech
niqu
e w
as a
lso
empl
oyed
shru
bs, w
ith a
spa
rse
grou
ndco
ver
with
six
sam
plin
g po
ints
of
gra
sses
(pos
sibl
y Ar
istid
asp
) sp
aced
40
m a
part
alon
g a
and
forb
s.
240
m tr
anse
ct. C
over
of
Cenc
hrus
cili
aris
was
ass
esse
d in
10
m x
10
m p
lots
adj
acen
t to
each
of t
he s
ampl
ing
poin
ts.
Floo
dpla
in o
f the
For
tesc
ue R
iver
, 23
°55
.702
S /
2.1
2000
Allo
met
rics
deriv
ed fo
r all
Plan
t dim
ensi
ons
and
Adam
s, M
.A. e
t al.
soils
wer
e de
ep s
andy
loam
s an
d 12
0°11
.196
Esp
ecie
s co
mbi
ned
with
site
di
strib
utio
n w
ere
mea
sure
d (2
001)
sa
ndy-
clay
loam
s. D
omin
ant p
lant
s in
vent
ory
data
.us
ing
the
plot
-less
met
hod
wer
e Cu
llen
leuc
anth
um, A
caci
a w
ith 6
sam
plin
g po
ints
eve
ryvi
ctor
iae
and
Cenc
hrus
cili
aris
. 40
m. C
over
of C
ench
rus
cilia
risw
as a
sses
sed
in
10 m
x 1
0 m
plo
ts a
djac
ent
to e
ach
of th
e sa
mpl
ing
poin
ts.
Forte
scue
Riv
er fl
oodp
lain
, 23
°02
.879
S /
n/a
2000
Allo
met
rics
deriv
ed fo
r all
Vege
tatio
n w
as a
sses
sed
for
Adam
s, M
.A. e
t al.
allu
vial
loam
and
cla
y-lo
am
120°
09.4
80 E
spec
ies
com
bine
d w
ith s
itede
nsity
and
dim
ensi
ons
(200
1)
soils
. Dom
inan
t spe
cies
wer
e in
vent
ory
data
.us
ing
the
plot
-less
met
hod,
Ac
acia
ane
ura,
A. c
itrin
oviri
dis,
w
ithsi
x sa
mpl
ing
poin
ts
A. v
icto
riae,
Cul
len
leuc
anth
um
sepa
rate
d by
100
m. N
o an
d m
ixed
tuss
ock
gras
ses.
pl
ants
wer
e ha
rves
ted
at
Ther
e w
as e
vide
nce
of re
cent
th
is s
ite.
flood
ing
in th
is a
rea.
Low
er p
arts
of
the
land
scap
e ha
d de
ad p
lant
s (u
sual
ly S
enna
arte
mis
ioid
es s
pp.
olig
ophl
laan
d Ce
nchr
us c
iliar
is)
that
wer
e no
t inc
lude
d in
the
asse
ssm
ent.
Floo
dpla
in o
f Yan
dico
ogin
a 22
°39
.391
S /
2.54
2000
Allo
met
rics
deriv
ed fo
r all
Only
gra
ss c
over
(prim
arily
Ad
ams,
M.A
. et a
l.Cr
eek.
Soi
ls w
ere
allu
vial
, mai
nly
119°
26.6
75 E
spec
ies
com
bine
d w
ith s
iteCe
nchr
us c
iliar
is) w
as
(200
1)
sand
to fi
ne s
and
with
occ
asio
nal
inve
ntor
y da
ta.
estim
ated
alo
ng a
300
m
pebb
les
and
larg
er ro
cks.
The
tra
nsec
t with
sam
plin
g ve
geta
tion
cons
iste
d of
spa
rse
poin
ts e
very
50
m. C
over
in
woo
dlan
d ov
er m
ixed
tuss
ock
gras
s.
10 x
10
m p
lots
was
est
imat
ed
Dom
inan
t tre
es in
clud
ed B
lood
woo
d in
depe
nden
tly b
y fiv
e pe
ople
.(E
ucal
yptu
s de
serti
colia
), an
d Ha
kea
sube
ra.

National Carbon Accounting System Technical Report 53
Rela
tivel
y fla
t san
d pl
ain
adja
cent
21
°46
.672
S /
4.33
2000
Allo
met
rics
deriv
ed fo
r all
Shru
b de
nsity
was
ass
esse
d Ad
ams,
M.A
. et a
l.to
the
Forte
scue
Riv
er fl
ood
plai
n.
116°
39.8
77 E
spec
ies
com
bine
d w
ith s
iteus
ing
the
plot
-less
met
hod
(200
1)
Plan
t spe
cies
incl
uded
Aca
cia.
in
vent
ory
data
.al
ong
a 25
0 m
tran
sect
, py
rifol
ia, A
. bin
ervo
sa,
with
sam
plin
g po
ints
at
A. a
ncis
troca
rpa,
Hak
ea
ever
y 50
m. C
over
of T
riodi
asu
bere
a an
dSe
nna
glut
inos
a.
in 1
0 x
10 m
plo
ts w
as
inde
pend
ently
est
imat
ed b
y fiv
e pe
ople
.
4Sn
appy
gum
(Euc
alyp
tus
22°
21.6
90 S
/ 16
.86
19.8
1, 3
.65
2000
Allo
met
rics
deriv
ed fo
r all
Vege
tatio
n w
as a
sses
sed
Adam
s, M
.A. e
t al.
12,2
48le
ucop
hloi
aco
mm
uniti
es
117°
35.4
90 E
spec
ies
com
bine
d w
ith s
ite
alon
g a
trans
ect w
ith th
ree
(200
1)
(tree
-ste
ppe)
. Low
sto
ney
hills
in
vent
ory
data
.50
m x
50
m p
lots
at 1
00 m
with
ske
leta
l soi
l am
idst
rock
y in
terv
als.
Can
opy
dim
ensi
ons,
ou
tcro
ps. V
eget
atio
n in
clud
ed
heig
ht a
nd s
tem
dia
met
ers
at
10 s
peci
es o
f Aca
cia,
2 o
f 10
cm
of a
ll tre
es a
nd s
hrub
s Eu
caly
ptus
and
1 of
Sen
na.
wer
e m
easu
red.
Lar
ger t
rees
Tr
iodi
a w
isea
naw
as e
xten
sive
. w
ere
also
mea
sure
d fo
r ste
mEu
caly
ptus
leuc
ophl
oia
and
diam
eter
at c
row
n br
eak.
E. d
eser
ticol
aw
ere
spar
se,
whi
le A
caci
a pr
uino
carp
a,
A. o
rthoc
arpa
and
Senn
a gl
utin
osw
ere
rela
tivel
y co
mm
on a
nd in
pl
aces
form
ed a
low
can
opy.
Ridg
elin
e of
a s
outh
-faci
ng
22°
51.1
01 S
/ 26
.99
2000
Allo
met
rics
deriv
ed fo
r all
Tree
den
sity
of E
. leu
coph
loia
Ad
ams,
M.A
. et a
l.sl
ope
and
had
patc
hes
of
118°
37.3
41 E
spec
ies
com
bine
d w
ith s
itew
as e
stim
ated
usi
ng th
e pl
ot-le
ss
(200
1)sk
elet
al s
oil a
nd ro
cky
outc
rops
. in
vent
ory
data
.m
etho
d w
ith fi
ve s
ampl
ing
Dom
inan
t spe
cies
wer
e po
ints
sep
arat
ed b
y 10
0 m
. Eu
caly
ptus
leuc
ophl
oia
over
Co
ver o
f Trio
dia
spp.
was
Tr
iodi
a sp
p.as
sess
ed in
10
m x
10
m
plot
s ad
jace
nt to
eac
h of
the
sam
plin
g po
ints
. Fou
r bra
nche
s fro
m th
ree
E. le
ucop
hloi
aan
d fiv
e hu
mm
ocks
of T
riodi
asp
p.
wer
e ha
rves
ted
at th
is s
ite.
Undu
latin
g hi
lls a
nd h
ad
22°
14.5
41 S
/ 31
.38
2000
Allo
met
rics
deriv
ed fo
r all
Tree
den
sity
of E
. leu
coph
loia
Ad
ams,
M.A
. et a
l.ro
cky
skel
etal
soi
l with
11
7°57
.567
Esp
ecie
s co
mbi
ned
with
site
w
as e
stim
ated
usi
ng th
e pl
ot-le
ss(2
001)
so
me
rock
out
crop
s.
inve
ntor
y da
ta.
met
hod
with
five
sam
plin
g po
ints
Dom
inan
t spe
cies
wer
e se
para
ted
by 5
0 m
. Cov
er o
fEu
caly
ptus
leuc
ophl
oia
Trio
dia
spp.
was
ass
esse
d in
ov
er T
riodi
a sp
p.10
m x
10
m p
lots
adj
acen
t to
each
of
the
sam
plin
g po
ints
. Tw
o br
anch
es fr
om
two
E. le
ucop
hloi
aan
d th
ree
hum
moc
ks
of T
riodi
asp
p. w
ere
harv
este
d at
this
site
.
Mid
-way
up
Mt S
heila
22
°13
.738
S /
22.3
920
00Al
lom
etric
s de
rived
for a
ll Tr
ee d
ensi
ty o
f E. l
euco
phlo
iaw
as
Adam
s, M
.A. e
t al.
on a
sou
th-fa
cing
ridg
e 11
7°35
.817
Esp
ecie
s co
mbi
ned
with
site
es
timat
ed u
sing
the
plot
-less
met
hod
(200
1)w
ith ro
cky,
skel
etal
soi
l in
vent
ory
data
.w
ith fi
ve s
ampl
ing
poin
ts s
epar
ated
and
frequ
ent r
ock
outc
rops
. by
50
m. C
over
of T
riodi
asp
p. w
asDo
min
ant s
peci
es w
ere
asse
ssed
in 1
0m
x 1
0m
plo
tsEu
caly
ptus
leuc
ophl
oia
adja
cent
to e
ach
of th
e sa
mpl
ing
over
Trio
dia
spp.
po
ints
. Fou
r bra
nche
s fro
m tw
o di
ffere
nt E
. leu
coph
loia
wer
e ha
rves
ted
at th
is s
ite.

Australian Greenhouse Office54
Site
Desc
riptio
n Lo
catio
nIn
divi
dual
Bi
omas
sYe
ar
Met
hod
of C
alcu
latio
nAr
ea E
stim
ate
Root
bio
mas
sDa
ta s
ourc
e Re
liabi
lity
Com
men
tsAr
ea in
the
(veg
etat
ion,
soi
l)si
tes
(t/ha
) (t/
ha, S
E)
whe
n(A
llom
etric
, exp
ansi
onan
d Ba
sis
(ha,
plo
ts e
tc)
or ro
ot:s
hoot
(R
ef, u
npub
lishe
d)(A
GO
Pilb
ara
note
: bi
omas
set
c)(t/
ha, ~
R/S)
Crite
ria)
regi
on o
f ab
ove-
grou
nd
estim
ated
this
biom
ass
vege
tatio
n fa
ctor
ty
pe (h
a x
ONLY
1000
)
Broa
d rid
ge in
the
north
-22
°51
.276
S /
6.71
2000
Allo
met
rics
deriv
ed fo
r all
Tree
den
sity
of E
. leu
coph
loia
Adam
s, M
.A. e
t al.
east
ern
foot
hills
of t
he
119°
15.7
14 E
spec
ies
com
bine
d w
ith s
itew
as e
stim
ated
usi
ng th
e (2
001)
Ham
ersl
ey R
ange
and
had
in
vent
ory
data
.pl
ot-le
ss m
etho
d w
ith 5
sk
elet
al s
oils
and
rock
sa
mpl
ing
poin
ts s
epar
ated
ou
tcro
ps. D
omin
ant s
peci
es
by 1
00 m
. Cov
er o
f Trio
dia
spp.
w
ere
Euca
lypt
us le
ucop
hloi
aw
as a
sses
sed
in 1
0 m
x 1
0 m
over
Trio
dia
spp.
Tre
e pl
ots
adja
cent
to e
ach
of th
ede
nsity
of E
. leu
coph
loia
was
sa
mpl
ing
poin
ts. N
o pl
ants
estim
ated
usi
ng th
e pl
ot-le
ss
wer
e ha
rves
ted
at th
is s
ite.
met
hod
with
5 s
ampl
ing
poin
ts
sepa
rate
d by
100
m. C
over
of
Trio
dia
spp.
was
ass
esse
d in
10
m x
10
m p
lots
adj
acen
t to
each
of t
he s
ampl
ing
poin
ts.
No p
lant
s w
ere
harv
este
d at
th
is s
ite.
Valle
y/go
rge
side
s be
twee
n tw
o 21
°42
.218
S /
14.5
420
00Al
lom
etric
s de
rived
for a
ll Tr
ee d
ensi
ty o
f mat
ure
Adam
s, M
.A. e
t al.
flat-t
oppe
d hi
lls (“
mes
a”) c
lose
11
6°16
.556
Esp
ecie
s co
mbi
ned
with
site
E.
leuc
ophl
oia
was
est
imat
ed b
y (2
001)
to
Pan
naw
onic
a. S
oils
wer
e in
vent
ory
data
.co
untin
g tre
es a
long
bot
h si
des
skel
etal
and
rock
y. Do
min
ant
of th
e va
lley
alon
g 20
0 m
spec
ies
wer
e Eu
caly
ptus
trans
ects
. Shr
ub d
ensi
ty w
asle
ucop
hloi
aw
ith m
ixed
aca
cia
calc
ulat
ed u
sing
the
plot
-less
shru
bs a
nd T
riodi
a sp
p.
met
hod
with
five
sam
plin
g po
ints
se
para
ted
by 1
00 m
, rep
eate
d on
bo
th s
ides
of t
he v
alle
y. Co
ver o
f Tr
iodi
asp
p. w
as a
sses
sed
in th
ree
20 m
x 2
0 m
plo
ts o
n bo
th s
ides
of
the
valle
y. Br
anch
es fr
om fo
ur
E. le
ucop
hloi
a an
d on
e w
hole
tree
w
ere
harv
este
d at
this
site
.
5Ac
acia
anu
era
woo
dlan
ds
22°
36.0
73 S
/ 5.
3418
.57,
7.5
020
00Al
lom
etric
s de
rived
for a
ll Pl
ant d
ensi
ty w
as e
stim
ated
in
Adam
s, M
.A. e
t al.
5,61
3(m
ulga
).Br
oad
allu
vial
pla
in
118°
04.0
55 E
spec
ies
com
bine
d w
ith s
ite
thre
e 50
m x
50
m q
uadr
ats
(200
1)
near
Mar
ando
o. S
oils
wer
e in
vent
ory
data
.pl
aced
50
m a
part
alon
g a
trans
ect
allu
vial
loam
s an
d cl
ay-lo
ams
with
ru
nnin
g ea
st-w
est.
All i
ndiv
idua
lsfre
quen
t peb
bles
in th
e pr
ofile
. of
A. a
neur
a an
d E.
forr
estii
Ve
geta
tion
was
an
over
stor
ey o
f w
ere
mea
sure
d fo
r hei
ght a
nd
smal
l mul
ga (A
caci
a an
eura
) tre
es
cano
py d
imen
sion
s. A
ll A.
ane
ura
with
an
unde
rsto
rey
dom
inat
ed b
y w
ere
also
mea
sure
d fo
r dia
met
ers
Erem
ophi
la fo
rres
tiian
d m
ixed
of
eac
h st
em a
t 0.1
m, 0
.5 m
, 1.3
m
gras
s an
d fo
rbs.
an
d cr
own
brea
k, c
anop
y de
pth
and
asse
ssm
ent o
f for
m (s
ee S
ectio
n 2)
. Te
nE.
forr
estii
and
six
A. a
neur
a w
ere
dest
ruct
ivel
y sa
mpl
ed fo
r bot
h ab
ove-
and
bel
ow-g
roun
d bi
omas
s.

National Carbon Accounting System Technical Report 55
Broa
d al
luvi
al p
lain
nea
r 22
°36
.267
S /
2.82
2000
Allo
met
rics
deriv
ed fo
r all
Plan
t den
sity
was
est
imat
ed
Adam
s, M
.A. e
t al.
Mar
ando
o. S
oils
wer
e al
luvi
al
118°
02.2
13 E
spec
ies
com
bine
d w
ith s
iteby
mea
surin
g al
l A. a
neur
a (2
001)
lo
ams
and
clay
-loam
s w
ith
inve
ntor
y da
ta.
and
E. fo
rres
tii in
thre
e fre
quen
t peb
bles
in th
e pr
ofile
. 20
m x
20
m q
uadr
ats
Vege
tatio
n w
as a
n ov
erst
orey
Se
para
ted
by 2
0 m
as
of s
mal
l mul
ga (A
caci
a an
eura
) de
scrib
ed a
bove
. No
plan
ts
trees
with
an
unde
rsto
rey
wer
e ha
rves
ted
at th
is s
ite.
dom
inat
ed b
y Er
emop
hila
fo
rres
tii a
nd m
ixed
gra
ss
and
forb
s.
Som
e ev
iden
ce o
f rec
ent
23°
01.4
81 S
/ 26
.620
00Al
lom
etric
s de
rived
for a
ll Pl
ant d
ensi
ty w
as e
stim
ated
Adam
s, M
.A. e
t al.
flood
ing
and
soil
wer
e 11
8°46
.719
Esp
ecie
s co
mbi
ned
with
site
by
mea
surin
g al
l A. a
neur
a(2
001)
al
luvi
al c
lay-
loam
s. T
all m
ulga
in
vent
ory
data
.in
thre
e 50
m x
50
m q
uadr
ats
woo
dlan
d, d
omin
ated
by
sepa
rate
d by
50
m a
long
A. a
neur
a w
ith p
atch
es o
f an
eas
t-wes
t tra
nsec
t. sc
atte
d Eu
caly
ptus
vic
trix
One
larg
e A.
ane
ura
was
with
Mar
sile
a sp
. (Na
rdoo
fern
) ha
rves
ted
at th
is s
ite.
and
Junc
acea
e sp
. cov
erin
g m
ost o
f the
gro
und.
Exte
nsiv
e fla
t pla
in e
ast o
f 23
°01
.325
S /
36.1
920
00Al
lom
etric
s de
rived
for a
ll Ve
geta
tion
was
ass
esse
d fo
rAd
ams,
M.A
. et a
l.th
e Fo
rtesc
ue R
iver
with
fine
12
0°26
.884
Esp
ecie
s co
mbi
ned
with
site
dens
ity a
nd d
imen
sion
s us
ing
(200
1)
sand
y lo
am o
r cla
y lo
am s
oils
. in
vent
ory
data
.th
e pl
ot-le
ss m
etho
d, w
ith s
ixVe
geta
tion
was
dis
tribu
ted
as
sam
plin
g po
ints
sep
arat
edirr
egul
ar p
atch
es o
r gro
ves
of
by 5
0 m
. Tw
o A.
ane
ura
wer
eAc
acia
spp.
Veg
etat
ion
was
ha
rves
ted
for a
bove
-gro
und
dom
inat
ed b
y A.
ane
ura
with
bi
omas
s at
this
site
.ot
her m
ixed
shr
ubs,
incl
udin
g A.
vic
toria
e, S
enna
arte
mis
ioid
es
spp.
Olig
ophl
la.T
here
was
littl
e or
no
vege
tatio
n be
twee
n gr
oves
.
Exte
nsiv
e fla
t pla
in e
ast o
f the
23
°01
.882
S /
1.97
2000
Allo
met
rics
deriv
ed fo
r all
Vege
tatio
n w
as a
sses
sed
for
Adam
s, M
.A. e
t al.
Forte
scue
Riv
er w
ith fi
ne s
andy
12
0°28
.859
Esp
ecie
s co
mbi
ned
with
site
de
nsity
and
dim
ensi
ons
usin
g (2
001)
loam
or c
lay
loam
soi
ls. V
eget
atio
n in
vent
ory
data
.th
e pl
ot-le
ss m
etho
d, w
ith s
ixw
as d
istri
bute
d as
irre
gula
r pat
ches
sa
mpl
ing
poin
ts s
epar
ated
or g
rove
s of
Aca
cia
spp.
Veg
etat
ion
by 1
00 m
. No
plan
ts w
ere
was
dom
inat
ed b
y A.
ane
ura
with
oth
er
harv
este
d at
this
site
.m
ixed
shr
ubs,
incl
udin
g A.
vic
toria
e,
Senn
a ar
tem
isio
ides
spp.
Olig
ophl
la.
Ther
e w
as li
ttle
or n
o ve
geta
tion
betw
een
grov
es.
Floo
dpla
in o
f the
For
tesc
ue
22°
34.3
50 S
/ 51
.920
00Al
lom
etric
s de
rived
for a
ll Pl
ant d
ensi
ty (a
nd
Adam
s, M
.A. e
t al.
Rive
r with
allu
vial
loam
and
11
9°31
.675
Esp
ecie
s co
mbi
ned
with
site
dim
ensi
ons)
was
(200
1)
clay
-loam
soi
ls. V
eget
atio
n in
vent
ory
data
.es
timat
ed u
sing
the
was
arr
ange
d in
irre
gula
r pl
ot-le
ss m
etho
d w
ith s
ixpa
tche
s or
gro
ves
and
was
sa
mpl
ing
poin
ts s
epar
ated
dom
inat
ed b
y Ac
acia
ane
ura,
by
20
m. N
o pl
ants
wer
eEr
emop
hila
forr
estii
and
mix
ed
harv
este
d at
this
site
.gr
ass
and
forb
s.

Australian Greenhouse Office56
Site
Desc
riptio
n Lo
catio
nIn
divi
dual
Bi
omas
sYe
ar
Met
hod
of C
alcu
latio
nAr
ea E
stim
ate
Root
bio
mas
sDa
ta s
ourc
e Re
liabi
lity
Com
men
tsAr
ea in
the
(veg
etat
ion,
soi
l)si
tes
(t/ha
) (t/
ha, S
E)
whe
n(A
llom
etric
, exp
ansi
onan
d Ba
sis
(ha,
plo
ts e
tc)
or ro
ot:s
hoot
(R
ef, u
npub
lishe
d)(A
GO
Pilb
ara
note
: bi
omas
set
c)(t/
ha, ~
R/S)
Crite
ria)
regi
on o
f ab
ove-
grou
nd
estim
ated
this
biom
ass
vege
tatio
n fa
ctor
ty
pe (h
a x
ONLY
1000
)
Adja
cent
to th
e flo
od p
lain
22
°34
.700
S /
5.2
2000
Allo
met
rics
deriv
ed fo
r all
Plan
t den
sity
(and
Ad
ams,
M.A
. et a
l.of
the
Forte
scue
Riv
er w
ith
119°
26.6
75 E
spec
ies
com
bine
d w
ith s
itedi
men
sion
s) w
as
(200
1)
allu
vial
loam
and
cla
y-lo
am
inve
ntor
y da
ta.
estim
ated
usi
ng th
e pl
ot-le
ss
soils
and
clo
se to
site
20
and
met
hod
with
six
sam
plin
g 22
. Dom
inan
t spe
cies
wer
e po
ints
sep
arat
ed b
y 50
m.
Acac
ia a
neur
a, A
, xip
hyop
hylla
, No
pla
nts
wer
e ha
rves
ted
A. v
icto
riae
and
gras
s an
d fo
rbs
at th
is s
ite.
(incl
udin
g Ch
enop
ods)
.
This
ana
lysi
s of
abo
ve-g
roun
d bi
omas
s an
d its
car
bon
cont
ent f
or th
e Pi
lbar
a en
com
pass
ed:
Fiel
d w
ork
at 2
7 si
tes
with
in a
n ar
ea o
f >60
,000
km
2 .
Dim
ensi
on a
naly
sis
of >
2300
tree
s an
d sh
rubs
and
>10
0 an
alys
es o
f the
phy
sica
l dim
ensi
ons
of tu
ssoc
k an
d hu
mm
ock
gras
ses.
Harv
estin
g an
d de
stru
ctiv
e sa
mpl
ing
(for d
imen
sion
s an
d m
ass)
of >
200
trees
and
shr
ubs
and
>60
gras
s hu
mm
ocks
/ tu
ssoc
ks.
Grav
imet
ric a
naly
sis
of >
5000
pla
nt s
ampl
es.
Stat
istic
ally
rigo
rous
(the
num
ber o
f sub
-plo
ts, n
, var
ied
betw
een
3 an
d 11
) mea
sure
s of
bio
mas
s an
d ca
rbon
con
tent
for 2
7 si
tes.
1Ja
rrah
(Euc
alyp
tus
mar
gina
ta)
Amph
ion
82 t
ha-1
1998
Allo
met
rics
deriv
ed fo
r Fu
ll as
sess
men
t of a
ll st
ems
Mea
n fin
e Gr
iers
on a
nd
fore
st. S
oils
are
Fer
ric
Fore
st
incl
udes
dom
inan
t und
erst
orey
of
E. m
argi
nata
over
stor
eyro
ot b
iom
ass
- Ad
ams,
Xa
ntho
sols
(lat
eriti
c gr
avel
ly
Bloc
k,
unde
rsto
rey
and
over
stor
ey s
peci
es.
and
unde
rsto
rey
B. g
rand
is
mea
n 12
.5 t
ha-1
Oeco
logi
a sa
nds)
. Site
har
vest
ed ~
1922
. Dw
ellin
gup.
of B
. gra
ndis
.in
6 5
0x50
m2
plot
s ac
ross
(incl
udin
g (s
ubm
itted
)Th
inne
d in
196
0 - p
rote
cted
32
°48
’, a
~100
ha
site
.se
ason
al a
nd
from
fire
for a
t lea
st 7
0 ye
ars.
116°
03’).
sp
ecie
sAv
erag
e ra
infa
ll va
riatio
ns).
for t
he s
ite is
To
tal r
oot
1235
mm
and
bi
omas
s no
t el
evat
ion
is
mea
sure
d.26
7 m
Series 1 Publications Set the framework for development of the National Carbon Accounting System (NCAS) anddocument initial NCAS-related technical activities (see http://www.greenhouse.gov.au/ncas/ publications).
Series 2 Publications Provide targeted technical information aimed at improving carbon accounting for Australianland based systems (see http://www.greenhouse.gov.au/ncas/publications).
Series 3 PublicationsDetail protocols for biomass estimation and the development of integrated carbon accountingmodels for Australia (see http://www.greenhouse.gov.au/ncas /publications).Of particular note is Technical Report No.
28. The FullCAM Carbon Accounting Model: Development, Calibration and Implementationfor the National Carbon Accounting System.
Series 4 PublicationsProvide an integrated analysis of soil carbon estimation and modelling for the National CarbonAccounting System, incorporating data from paired site sampling in NSW, Qld and WA.A preliminary assessment of nitrous oxide emissions from Australian agriculture is also included(see http://www.greenhouse.gov.au/ncas/publications).
Series 5 Publications include:
39. Continuous Improvement of the National Carbon Accounting System Land CoverChange Mapping.
40. Modelling Change in Litter and Soil Carbon Following Afforestation or Reforestation -Calibration of the FullCAM ‘Beta’ Model.
41. Calibration of the FullCAM Model to Eucalyptus globulus and Pinus radiata andUncertainty Analysis.
42. Outcomes from the Workshop: Deriving Vegetation Canopy Cover Estimates.
43. The Impact of Tillage on Changes in Soil Carbon Density with Special Emphasis onAustralian Conditions.
44. Spatial Estimates of Biomass in ‘Mature’ Native Vegetation.

The National Carbon Accounting System provides a complete
accounting and forecasting capability for human-induced sources and
sinks of greenhouse gas emissions from Australian land based
systems. It will provide a basis for assessing Australia’s progress
towards meeting its international emissions commitments.
http://www.greenhouse.gov.au
technical report no. 44 Spatial Estimates of Biom
ass in ‘Mature’ N
ative Vegetation