SPATIAL DEVELOPMENT TREND OF INDUSTRIES WITHIN DHAKA ...
173
SPATIAL DEVELOPMENT TREND OF INDUSTRIES WITHIN DHAKA METROPOLITAN DEVELOPMENT PLAN (DMDP) AREA A.K.M. ALAMGIR KABIR DEWAN MASTER OF URBAN AND REGIONAL PLANNING DEPARTMENT OF URBAN AND REGIONAL PLANNING BANGLADESH UNIVERSITY OF ENGINEERING AND TECHNOLOGY DHAKA, BANGLADESH
Transcript of SPATIAL DEVELOPMENT TREND OF INDUSTRIES WITHIN DHAKA ...

SPATIAL DEVELOPMENT TREND OF INDUSTRIES
WITHIN DHAKA METROPOLITAN DEVELOPMENT
PLAN (DMDP) AREA
A.K.M. ALAMGIR KABIR DEWAN
MASTER OF URBAN AND REGIONAL PLANNING
DEPARTMENT OF URBAN AND REGIONAL PLANNING
BANGLADESH UNIVERSITY OF ENGINEERING AND TECHNOLOGY
DHAKA, BANGLADESH
SPATIAL DEVELOPMENT TREND OF INDUSTRIES
WITHIN DHAKA METROPOLITAN DEVELOPMENT
PLAN (DMDP) AREA
By
A.K.M. ALAMGIR KABIR DEWAN
MASTER OF URBAN AND REGIONAL PLANNING
DEPARTMENT OF URBAN AND REGIONAL PLANNING
BANGLADESH UNIVERSITY OF ENGINEERING AND TECHNOLOGY
DHAKA, BANGLADESH
August 2009

SPATIAL DEVELOPMENT TREND OF INDUSTRIES
WITHIN DHAKA METROPOLITAN DEVELOPMENT
PLAN (DMDP) AREA
By
A.K.M. ALAMGIR KABIR DEWAN
A Thesis
Submitted to the Department of Urban and Regional
Planning in partial fulfillment for the degree of Master of
Urban and Regional Planning
DEPARTMENT OF URBAN AND REGIONAL PLANNING
BANGLADESH UNIVERSITY OF ENGINEERING AND TECHNOLOGY
DHAKA, BANGLADESH
August 2009

THESIS ACCEPTANCE FORM
Spatial Development Trend of Industries within Dhaka Metropolitan
Development Plan (DMDP) Area
By
A.K.M. ALAMGIR KABIR DEWAN
Thesis Approved as to Style and Content by
Dr. Ishrat Islam (Supervisor)
Assistant Professor, Department of Urban and
Regional Planning, Bangladesh University of
Engineering and Technology (BUET), Dhaka
Chairperson
Dr. Sarwar Jahan
Professor and Head, Department of Urban and
Regional Planning, Bangladesh University of
Engineering and Technology (BUET), Dhaka
Member
Dr. Mohammad Sakil Akther
Assistant Professor, Department of Urban and
Regional Planning, Bangladesh University of
Engineering and Technology (BUET), Dhaka
Member
Dr. Nurul Islam Nazem
Professor, Department of Geography &
Environment, University of Dhaka, Dhaka
Member

CANDIDATE’S DECLARATION
It is hereby declared that this thesis has been prepared in partial
fulfillment of the requirements for the Degree of Master of Urban
and Regional Planning at the Bangladesh University of
Engineering and Technology, Dhaka and has not been submitted
anywhere else for any other degree.
A.K.M. Alamgir Kabir Dewan
Student No. 040415037
URP, BUET, Dhaka

Dedicated
To
My
Parents
And
Only Daughter

xi
List of Abbreviations
GDP Gross Domestic Product
BSCIC Bangladesh Small and Cottage Industries Corporation
DMDP Dhaka Metropolitan Development Plan
BETS Bangladesh engineering Technical Services
CMI Census on Manufacturing Industries
BBS Bangladesh Bureau of Statistics
DAP Detailed Area Plan
STP Strategic Transport Plan
SPSS Statistical Package for Social Survey
GIS Geographical Information System
GPS Global Positioning System
RAJUK Rajdhani Unnayan Kartipakkha
TPE Total Personnel Employed
BIDS Bangladesh Institute of Development Studies
UNDP United Nations Development Programme
UDD Urban Development Directorate
MURP Master of Urban and Regional Planning
BUET Bangladesh University of Engineering and Technology
DCC Dhaka City Corporation
RMG Readymade Garment
GoB Government of Bangladesh
DoE Department of Environment
ETP Effluent Treatment Plant
TIN Triangulated Irregular Network
ii
Abstract
Industrial development is very important for a developing country like Bangladesh. Being
in the heart of the country, Dhaka is facing tremendous industrial pressure. But the way it
is happening, ultimately becoming a threat to the environment and the lives of millions of
people residing in Dhaka. So, there is a need to study how and why the industrial
development is occurring in this way. This research focused on spatial distribution trend
of industries within Dhaka Metropolitan Development Plan (DMDP) area, particularly the
large scale manufacturing industries. This research covered two broad objectives. The
first objective was to analyze the development trend of large scale manufacturing
industries and the spatial distribution of these industries within DMDP area through
industrial census data and Geographic Information System (GIS) data. The trend analysis
carried out dividing the whole study period (1903 to 2007) into four periods; the British
Period, the Pakistan Period, the Pre DMDP Bangladesh period and the Post DMDP
period. The study area includes both the Dhaka Metropolitan Police (DMP) area and the
Areas outside DMP. The GIS map was prepared using data from recently completed
physical feature survey of Detailed Area Plan Project of RAJUK (The Capital City
Development Authority).
The Second objective was to analyze the compatibility of present industrial development
with DMDP Structure Plan and to find out the factors influencing industrial location
decision. According to DMDP Structure Plan, new industries should be established only
in four Special Incentive Zones such as Savar, Tongi and Gazipur Municipality and the
Dhamsona area and one Special Rehabilitation Incentive Zone in Narayanganj. There
should not be any industries within the area surrounded by the Turag, Balu, Tongi Khal
and the Buriganga River which is the present jurisdiction of DMP and the areas
designated as Flood Flow Zones and Agriculture Zones in the Structure Plan. For
compatibility analysis, the GIS data of industrial locations was overlaid on the delineated
GIS Data of DMDP Structure Plan. To find out the factors influencing industrial location
decision, a standard questionnaire was designed to interview the industry owners to
identify the factors that influence industrial location decision. It has been identified
whether they have violated the DMDP Structure Plan. Finally a comparison was done

iii
between DMDP proposed location and present location of industries. A list of factors was
found that influenced the present location decision.
This research identified that DMP area is accommodating less than half of total (44.95%)
of the industries of DMDP area. The process of industrialization in this area became
faster in the late eighties. Though the area outside DMP is accommodating more than half
(55.05%) of the industries of DMDP area but the trend of establishment of industries
outside DMP has been declining after the year 1990.
Tough DMDP Structure Plan doesn’t allow any new industrial development within the
DMP area; but this area is showing increasing trend of industrial establishment in this
period (1998 and onward). Area outside DMP is showing declining trend during the post
DMDP period. Savar and Keraniganj thana have showed significant industrial
development. Around 10.33% of industrial structures were established in the Agricultural
Zone and some 6.51% are found in the Flood Flow Zones. The questionnaire survey
revealed that the prominent factor for establishing new industries is land value; second
crucial factor is availability of skilled labour. The study also tried to compare the
weightage of different factors assigned by the industrial owners in case of DMDP
specified locations and the present location of the industries. This research strongly
recommends that industrial development should happen in a clustered manner and these
clusters must be categorized according to hazard classification of DoE (i.e. red, orange
and green category), there is a need for transport infrastructure and labor intensiveness. It
also recommends that there should be a one window cell with direct participation of all
the line agencies and the development control authority to review the permit for new
industrial development so that there is no scope of blaming each other for haphazard and
unplanned industrial development.

i
Acknowledgement
The author expresses his heartiest gratitude to Dr. Ishrat Islam, Assistant Professor,
Department of Urban and Regional Planning, Bangladesh University of Engineering and
Technology (BUET) under whose constant guidance and advice, this research has been
accomplished.
The author is grateful to Dr. Mohammad Shakil Akther, Assistant Professor, Department
of Urban and Regional Planning, Bangladesh University of Engineering and Technology
(BUET) who guided this research through providing advices to carry out the
questionnaire survey.
The author expresses his gratitude to Planner Al Ameen and Planner Khondaker M. Ansar
Hossain of EPC Limited for their continuous encouragement to complete this research.
The author is also grateful to his colleagues in the Consultancy Division of Sheltech
(Pvt.) Ltd. Without their support it would not be possible to carry out the research work
amid tremendous workload.
The author also expresses his gratitude to his wife who has sacrificed a lot for the sake of
successful completion of this research.
He is also grateful to his father who was always after him to foster the inspiration to
complete the research for attaining the Master Degree.

iv
Table of Contents
Page No.
Acknowledgement i
Abstract ii
List of Tables vii
List of Figures viii
List of Maps x
List of Abbreviations xi
Chapter-1: Introduction
1.1 Background of the Study 1
1.2 Objective of the Study 4
1.3 Methodology 4
1.3.1 Selection of the Study Area 4
1.3.2 Literature Review 4
1.3.3 Data Collection from Primary Sources 5
1.3.4 Data Collection from Secondary Sources 5
1.3.5 Data Analysis 5
1.4 Scope of the Study 5
1.5 Limitation of the Study 6
1.6 Organization of the Study 6
Chapter-2 Industrial Location theories and Major Factors Influencing
Industrial Growth.
2.1 Introduction 7
2.2 Industrial Location Theories 7
2.3 Industrial Location Studies in the Context of Bangladesh 9
2.4 Industrial Location Studies in the Context of Dhaka
Metropolitan Development Plan (DMDP) Area 11
2.5 Policies and Need for Research on Industrial Location. 13
2.6 Factors Influencing Industrial Location and Growth 13

v
2.6.1 Accessibility to Market 14
2.6.2 Accessibility to Raw Material 14
2.6.3 Availability of Labour 14
2.6.4 Capital 15
2.6.5 Transport and Communication 15
2.6.6 Infrastructure Facilities 16
2.6.7 Agglomeration and External Economy 17
2.6.8 Government Policy 17
2.6.9 Historical Accident and Personal Preference 17
2.6.10 Environmental Factor 18
2.7 Conclusion 18
Chapter-3 Spatial distribution pattern and development trend of
industries in Dhaka
3.1 Introduction 19
3.2 Development trend of industries since 1903 19
3.2.1 Trend in British Period 20
3.2.2 Trend in Pakistan Period 20
3.2.3 Trend in Pre DMDP Bangladesh period 23
3.2.4 Trend in Post DMDP period 25
3.3 Analysis of Spatial Distribution Pattern 28
3.3.1 Point Pattern Analysis 29
3.4 Spatial Distribution of Industries 37
3.4.1 Distribution of Industries within DMP Area 37
3.4.2 Distribution of Industries within Area outside DMP 41
3.4.3 Location of Red Category Industries 43
3.4.3.1 Red Category Industries and Location of
Water bodies 48
3.4 Conclusion 50
Chapter-4 Location compatibility with DMDP and analyze the factors
influencing industrial location choice.
4.1 Introduction 51
4.2 Location Wise Compatibility of Industrial Development within
DMDP 51

vi
4.3 Location Choice and Views of Industrial Management 55
4.3.1 Comparison by the Interviewee between DMDP
Proposed Location and Their Present Industrial
Location 55
4.3.2 Industrial Sector and Mode of Transport 56
4.3.3 Knowledge about DMDP 59
4.3.4 Awareness about Environmental Laws 61
4.3.5 Labor Residence 61
4.3.6 Relation between Location of industries and Residence
of top Management 62
4.3.7 Availability of Effluent Treatment Plant (ETP) 64
4.3.8 Different industrial sector and renewal of Department
of Environment (DoE) Certificate 65
4.3.9 Priority of Factors influencing Location Decision 66
4.3.10 Multiple Responses Regarding Relocation of Industries 71
4.4 Conclusion 71
Chapter-5 Recommendation and Conclusion
5.1 Introduction 73
5.2 Major Findings 73
5.3 Policy Recommendations 75
References 76
Annexure -3.1 Table Showing the Descriptive analysis (VMR Calculation)
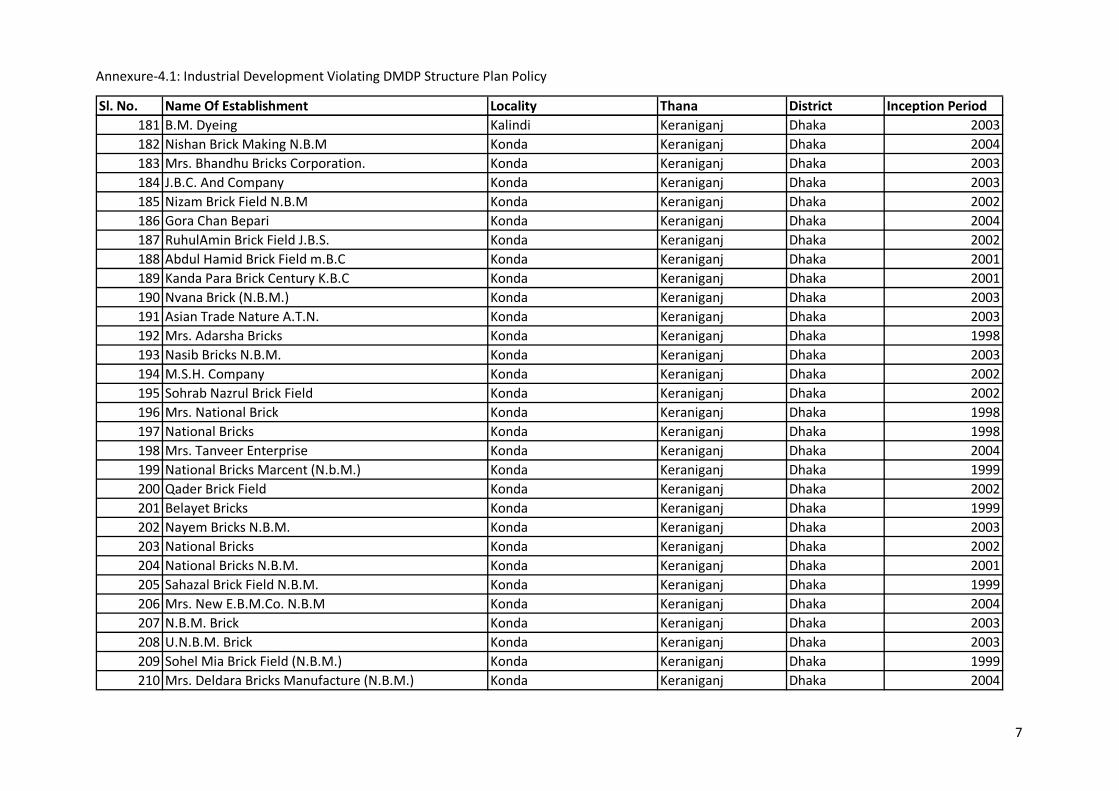
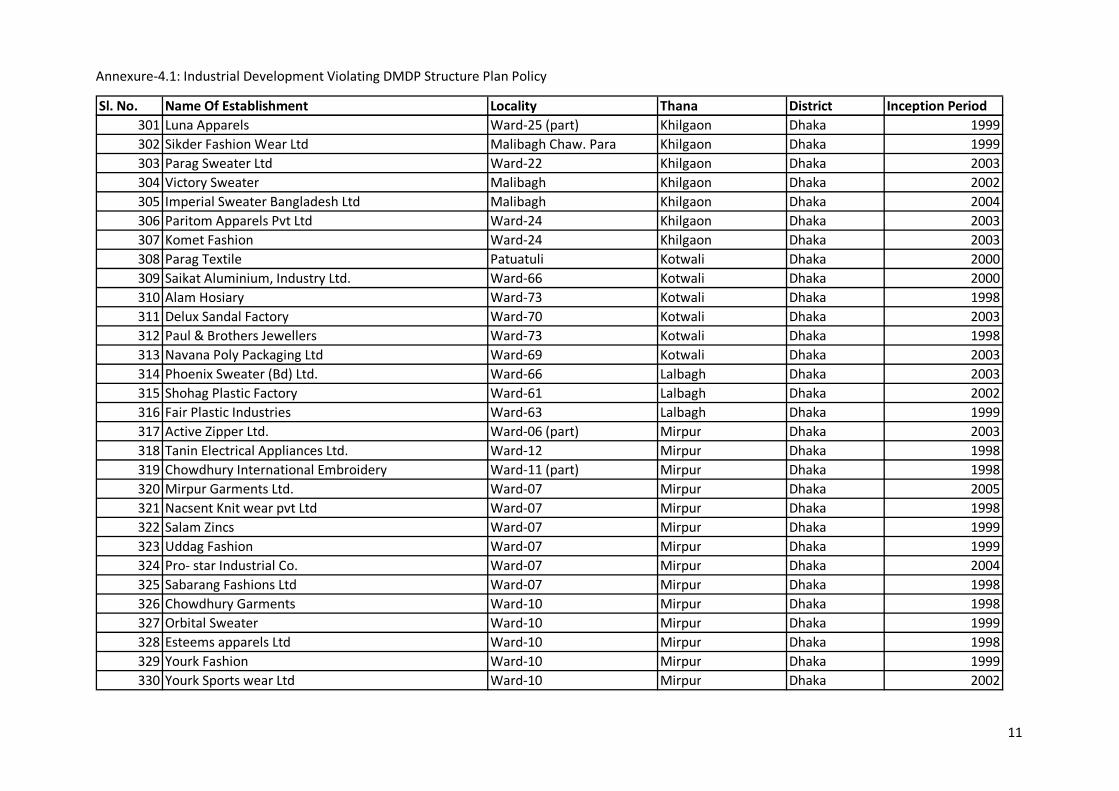
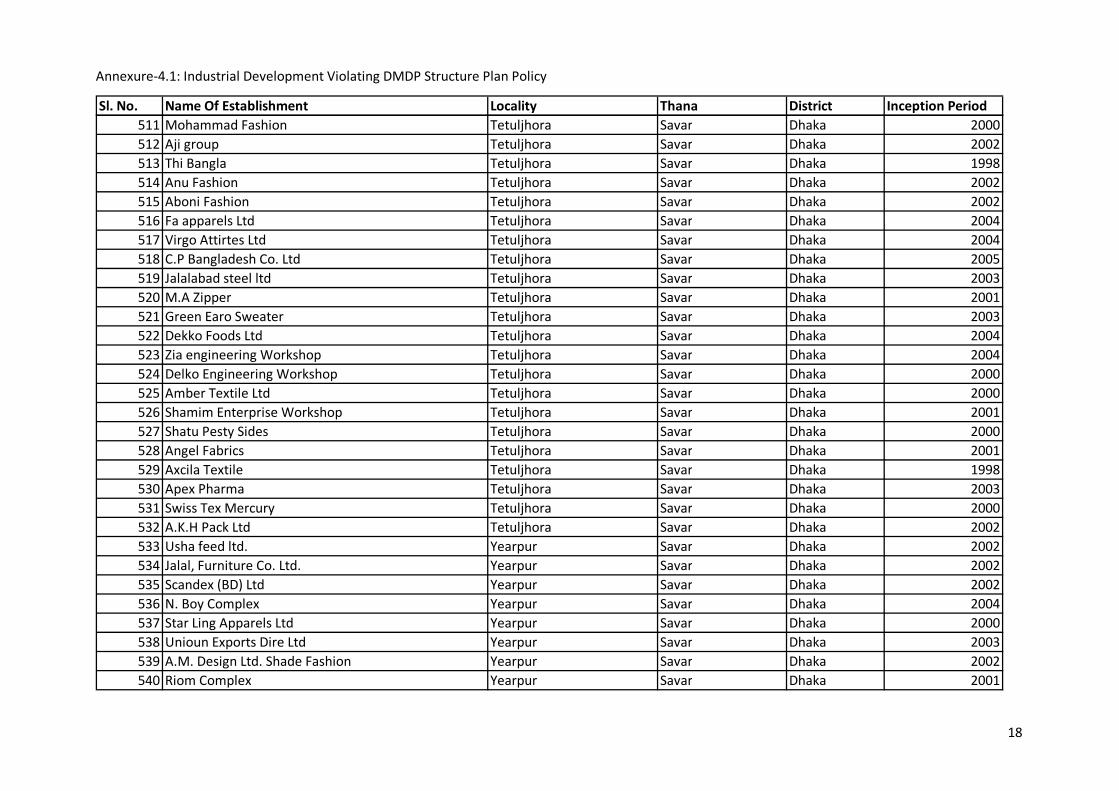
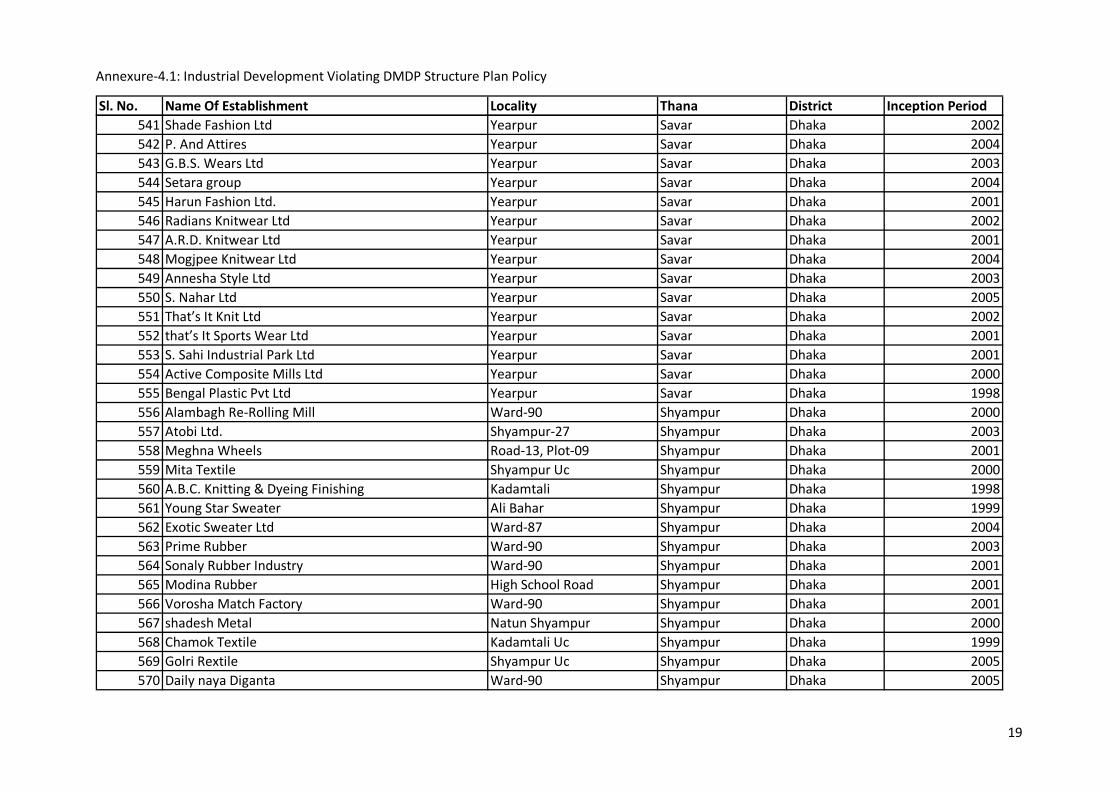
Annexure-4.1 Industrial Development Violating DMDP Structure Plan Policy
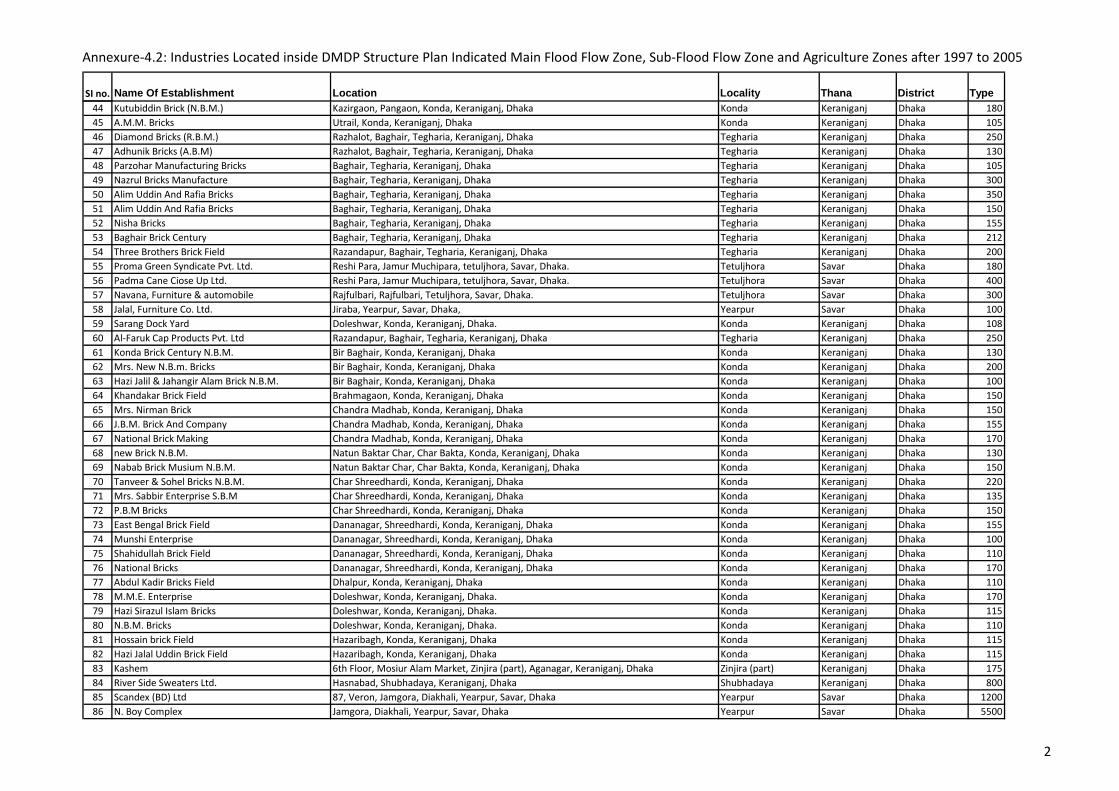
Annexure-4.2 Industries Located inside DMDP Structure Plan Indicated Main Flood
Flow Zone, Sub-Flood Flow Zone and Agriculture Zones after 1997
Annexure-4.3 Standard Questionnaire for Interview with Industrial top Management
Annexure-4.4 Comparison between DMDP Proposed Location and Present Industrial
location
Annexure-4.5 Frequency distribution of priorities ascertained by the interviewee

1 | P a g e
Annexure-3.1: Table Showing the Descriptive analysis (VMR Calculation):
No. of points inquadrant (xi)
Observeddistribution (fi) VAR Mean VMR Remarks
0 7748
60.37515 1.345497 44.87202Highlyclustered
1 365
2 188
3 118
4 93
5 66
6 50
7 37
8 32
9 32
10 30
11 21
12 23
13 27
14 16
15 14
16 13
17 16
18 18
19 10
20 5
21 10
22 10
23 6
24 9
25 10
26 10
27 6
28 5
29 4
30 3
31 2
32 4
33 1
34 2
35 1
36 2
37 2
38 1
39 4

2 | P a g e
No. of points inquadrant (xi)
Observeddistribution (fi) VAR Mean VMR Remarks
40 3
41 1
42 4
43 4
44 3
45 2
46 2
47 1
48 3
49 1
50 0
51 1
52 2
53 1
54 0
55 2
56 2
57 1
58 2
59 0
60 2
61 1
68 1
70 2
71 1
74 2
83 1
87 1
90 1
95 1
96 2
98 1
107 1
123 1
128 1
185 1
191 1
214 1
294 1
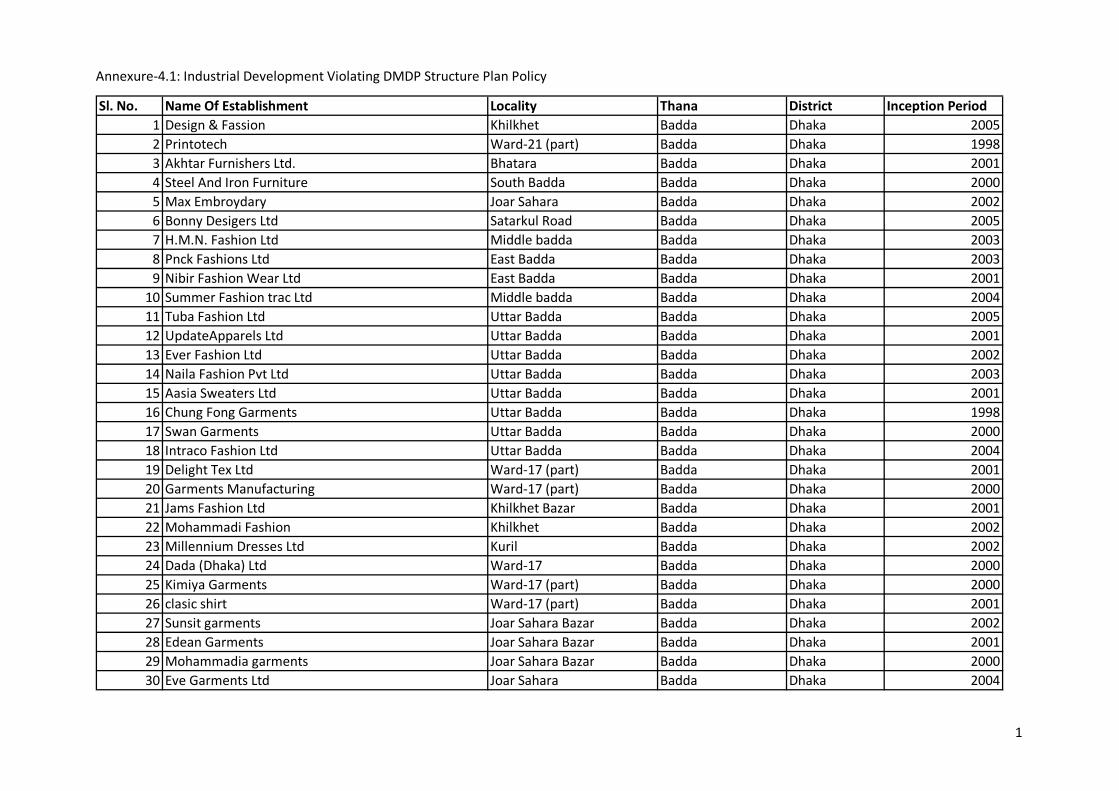
Annexure-4.1: Industrial Development Violating DMDP Structure Plan Policy
Sl. No. Name Of Establishment Locality Thana District Inception Period
1 Design & Fassion Khilkhet Badda Dhaka 2005
2 Printotech Ward-21 (part) Badda Dhaka 1998
3 Akhtar Furnishers Ltd. Bhatara Badda Dhaka 2001
4 Steel And Iron Furniture South Badda Badda Dhaka 2000
5 Max Embroydary Joar Sahara Badda Dhaka 2002
6 Bonny Desigers Ltd Satarkul Road Badda Dhaka 2005
7 H.M.N. Fashion Ltd Middle badda Badda Dhaka 2003
8 Pnck Fashions Ltd East Badda Badda Dhaka 2003
9 Nibir Fashion Wear Ltd East Badda Badda Dhaka 2001
10 Summer Fashion trac Ltd Middle badda Badda Dhaka 2004
11 Tuba Fashion Ltd Uttar Badda Badda Dhaka 2005
12 UpdateApparels Ltd Uttar Badda Badda Dhaka 2001
13 Ever Fashion Ltd Uttar Badda Badda Dhaka 2002
14 Naila Fashion Pvt Ltd Uttar Badda Badda Dhaka 2003
15 Aasia Sweaters Ltd Uttar Badda Badda Dhaka 2001
16 Chung Fong Garments Uttar Badda Badda Dhaka 1998
17 Swan Garments Uttar Badda Badda Dhaka 2000
18 Intraco Fashion Ltd Uttar Badda Badda Dhaka 2004
19 Delight Tex Ltd Ward-17 (part) Badda Dhaka 2001
20 Garments Manufacturing Ward-17 (part) Badda Dhaka 2000
21 Jams Fashion Ltd Khilkhet Bazar Badda Dhaka 2001
22 Mohammadi Fashion Khilkhet Badda Dhaka 2002
23 Millennium Dresses Ltd Kuril Badda Dhaka 2002
24 Dada (Dhaka) Ltd Ward-17 Badda Dhaka 2000
25 Kimiya Garments Ward-17 (part) Badda Dhaka 2000
26 clasic shirt Ward-17 (part) Badda Dhaka 2001
27 Sunsit garments Joar Sahara Bazar Badda Dhaka 2002
28 Edean Garments Joar Sahara Bazar Badda Dhaka 2001
29 Mohammadia garments Joar Sahara Bazar Badda Dhaka 2000
30 Eve Garments Ltd Joar Sahara Badda Dhaka 2004
1
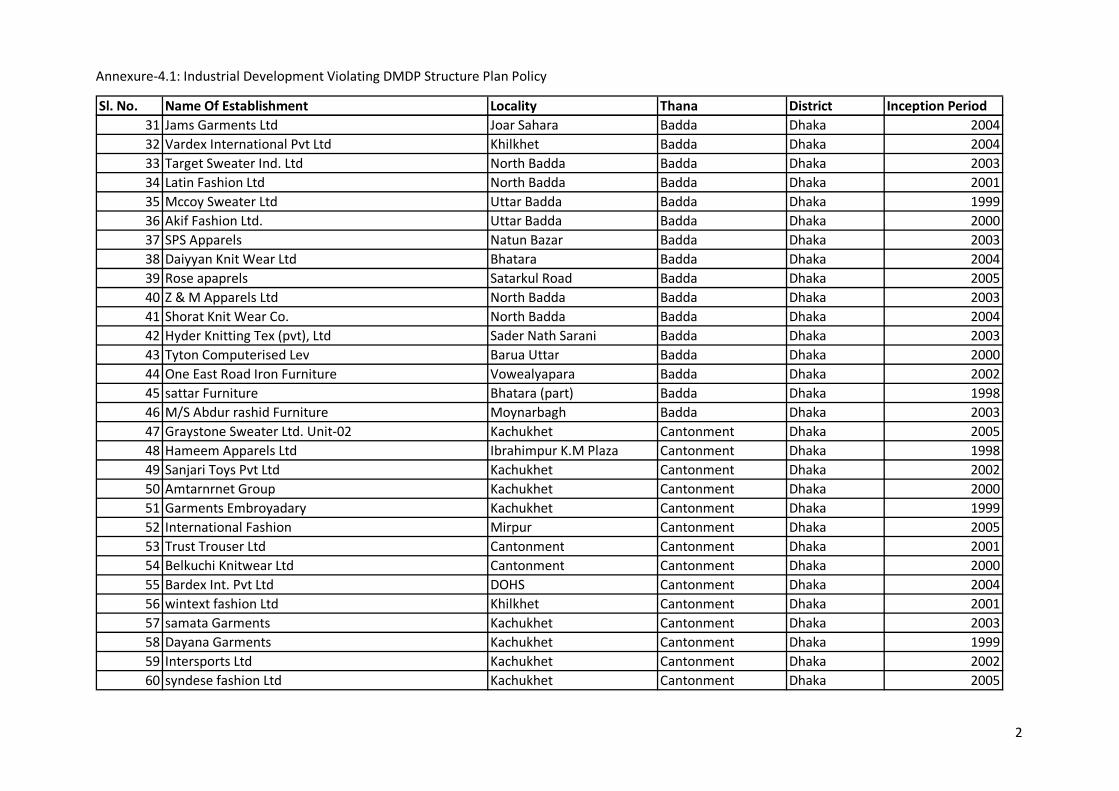
Annexure-4.1: Industrial Development Violating DMDP Structure Plan Policy
Sl. No. Name Of Establishment Locality Thana District Inception Period
31 Jams Garments Ltd Joar Sahara Badda Dhaka 2004
32 Vardex International Pvt Ltd Khilkhet Badda Dhaka 2004
33 Target Sweater Ind. Ltd North Badda Badda Dhaka 2003
34 Latin Fashion Ltd North Badda Badda Dhaka 2001
35 Mccoy Sweater Ltd Uttar Badda Badda Dhaka 1999
36 Akif Fashion Ltd. Uttar Badda Badda Dhaka 2000
37 SPS Apparels Natun Bazar Badda Dhaka 2003
38 Daiyyan Knit Wear Ltd Bhatara Badda Dhaka 2004
39 Rose apaprels Satarkul Road Badda Dhaka 2005
40 Z & M Apparels Ltd North Badda Badda Dhaka 2003
41 Shorat Knit Wear Co. North Badda Badda Dhaka 2004
42 Hyder Knitting Tex (pvt), Ltd Sader Nath Sarani Badda Dhaka 2003
43 Tyton Computerised Lev Barua Uttar Badda Dhaka 2000
44 One East Road Iron Furniture Vowealyapara Badda Dhaka 2002
45 sattar Furniture Bhatara (part) Badda Dhaka 1998
46 M/S Abdur rashid Furniture Moynarbagh Badda Dhaka 2003
47 Graystone Sweater Ltd. Unit-02 Kachukhet Cantonment Dhaka 2005
48 Hameem Apparels Ltd Ibrahimpur K.M Plaza Cantonment Dhaka 1998
49 Sanjari Toys Pvt Ltd Kachukhet Cantonment Dhaka 2002
50 Amtarnrnet Group Kachukhet Cantonment Dhaka 2000
51 Garments Embroyadary Kachukhet Cantonment Dhaka 1999
52 International Fashion Mirpur Cantonment Dhaka 2005
53 Trust Trouser Ltd Cantonment Cantonment Dhaka 2001
54 Belkuchi Knitwear Ltd Cantonment Cantonment Dhaka 2000
55 Bardex Int. Pvt Ltd DOHS Cantonment Dhaka 2004
56 wintext fashion Ltd Khilkhet Cantonment Dhaka 2001
57 samata Garments Kachukhet Cantonment Dhaka 2003
58 Dayana Garments Kachukhet Cantonment Dhaka 1999
59 Intersports Ltd Kachukhet Cantonment Dhaka 2002
60 syndese fashion Ltd Kachukhet Cantonment Dhaka 2005
2

Annexure-4.1: Industrial Development Violating DMDP Structure Plan Policy
Sl. No. Name Of Establishment Locality Thana District Inception Period
61 Geatime Designs Ltd Mousumi Bhaban Plaza Cantonment Dhaka 2002
62 The Overseas Apparels Ltd Kachukhet Cantonment Dhaka 2001
63 Hossaf Dresses Rahman Bhaban Cantonment Dhaka 2004
64 Al-Madina Food Products Matuail Demra Dhaka 2000
65 Al-Modina Food Products Piyati Demra Dhaka 2000
66 Munni Bakery Dhaken Tera Demra Dhaka 2003
67 Habib Food And Allied Industries Ltd. Matuail Demra Dhaka 2004
68 Taj Salt Matuail Demra Dhaka 1999
69 M/S Altafun Nesa Textile Ltd. Matuail Demra Dhaka 2001
70 Bismilla Dyeing Matuail Demra Dhaka 2002
71 Al-Aksa Steel Mills Ltd. Srulia Demra Dhaka 2005
72 Dalai Factory Matuail Demra Dhaka 2002
73 Electric Fans Factory annyashs Corporation. Dhania Demra Dhaka 1998
74 Shariat Cap Factory Dhania Demra Dhaka 2003
75 I.I Tube Mills Ltd Matuail Demra Dhaka 2001
76 Onex Kintxe Ward-86 Demra Dhaka 1998
77 Mega Tex Ltd Ward-86 Demra Dhaka 2000
78 Pole star Apparels Pvt Ltd Sombag Demra Dhaka 1999
79 Neous Textile East Para Demra Dhaka 1999
80 Zoom Sweater Ltd Paiti Road Demra Dhaka 2002
81 P.K. Commodities Ltd Pity Matuail Demra Dhaka 2005
82 Asian Furniture Erasullah Road Demra Dhaka 2005
83 Karmo Foam Factory Konapara Demra Dhaka 2001
84 Just Leather Demra Demra Dhaka 2005
85 Surjo Vita Agro Complex Ltd. Ward-52 Dhanmondi Dhaka 2004
86 Star Light Knitwear Ltd Ward-52 Dhanmondi Dhaka 2002
87 Parade International Ltd Ward-52 Dhanmondi Dhaka 2000
88 SP Fashion Ward-52 Dhanmondi Dhaka 2005
89 Greenleaf Apparels Ward-48 (part) Dhanmondi Dhaka 2004
90 Shark Knit Wear Ward-50 Dhanmondi Dhaka 1998
3

Annexure-4.1: Industrial Development Violating DMDP Structure Plan Policy
Sl. No. Name Of Establishment Locality Thana District Inception Period
91 Popular Pharmaceuticals Ltd Ward-49 Dhanmondi Dhaka 2002
92 Hamdard Lab Ward-50 Dhanmondi Dhaka 1998
93 Concord Readymix & Concrete Products Ltd. Gulshan-02 Gulshan Dhaka 2003
94 Apparels Mart Ltd. Ward-19 (part) Gulshan Dhaka 1998
95 Vogue Garments Gulshan South Avnue Gulshan Dhaka 1999
96 Pearls Trading Inta. Ward-19 (part) Gulshan Dhaka 1999
97 Hollywood Fashion Gulshan-02 Gulshan Dhaka 2003
98 Oryx North Gulshan Gulshan Dhaka 2002
99 Apparels Mart Ltd. Circle -01 Gulshan Dhaka 2002
100 Bani Garments & Ind Ltd Gulshan -02 Gulshan Dhaka 2002
101 Capital Mircury Apparels Ltd Gulshan -02 Gulshan Dhaka 2003
102 Challenger Garment Ltd Road-28 Gulshan Dhaka 2003
103 Conception Garments Ltd Gulshan South Avnue Gulshan Dhaka 2002
104 Crystal Group Road-79 Gulshan Dhaka 2002
105 data fashion Ltd Gulshan-01 Gulshan Dhaka 2002
106 Dipta Garments Ltd Gulshan -02 Gulshan Dhaka 2002
107 Chun-Gi, Knit Ltd Ward-19 Gulshan Dhaka 2003
108 M.S. Islam Garments Ltd Ward-19 Gulshan Dhaka 1998
109 Haidory Textile & Garments Ward-19 Gulshan Dhaka 2000
110 Searock Apparels Ltd Ward-19 Gulshan Dhaka 1999
111 Newyork Garments Ltd Ward-19 Gulshan Dhaka 2000
112 Arena Industries Ltd Gulshan-1 Gulshan Dhaka 2003
113 Safi Processing Ind Ltd Banani Gulshan Dhaka 1998
114 Goory Ong Dhaka Gulshan-02 Gulshan Dhaka 2003
115 Harvest Rich Ltd Gulshan-01 Gulshan Dhaka 2003
116 Hi And Fung Gulshan North C/A Gulshan Dhaka 2003
117 Interanare & associates Gulshan-02 Gulshan Dhaka 2002
118 Lin Mark Gulshan-02 Gulshan Dhaka 2003
119 Nestle Bd Ltd Gulshan-02 Gulshan Dhaka 2003
120 Matador Ball Pen Industries Ward-58 (part) Hazaribagh Dhaka 2000
4

Annexure-4.1: Industrial Development Violating DMDP Structure Plan Policy
Sl. No. Name Of Establishment Locality Thana District Inception Period
121 RMM Leather Industry Ward-48(part) Hazaribagh Dhaka 2000
122 M/S Mostra K. JV Ltd Moneshor Road Hazaribagh Dhaka 1998
123 M/S Rupali Tennery Moneshor Road Hazaribagh Dhaka 2000
124 Rumi Leather Ind 76/A Hazaribagh Dhaka 1999
125 M/S Creative Leather Crafts Moneshor Road Hazaribagh Dhaka 2001
126 M/S Velox Agencies Ltd Hazaribagh Dhaka 2000
127 Bangal Leather Complex Ward-58 (part) Hazaribagh Dhaka 2001
128 Lord tooth Brash, Ballpen Manufacturing Anwer Ward-58 (part) Hazaribagh Dhaka 1998
129 M/S Deshma Shoe Ind Ltd Kazi Nazrul Islam Av Hazaribagh Dhaka 2000
130 M/S Bay Tenneries Hazaribagh Hazaribagh Dhaka 2000
131 M/S Bay footwear Ltd Hazaribagh Hazaribagh Dhaka 1998
132 M/S Azmir Leather Hazaribagh Hazaribagh Dhaka 2000
133 M/S Mukta Tennary Hazaribagh Hazaribagh Dhaka 2000
134 Aziz Tennery Ward-48 part Hazaribagh Dhaka 2004
135 Maitri Printing Indusrries. Ward-04 Kafrul Dhaka 1999
136 Modina Print. Senpara Kafrul Dhaka 2004
137 Luna Flog Printers. Senpara Kafrul Dhaka 2002
138 Centex Fashion ltd. Ward-16 Kafrul Dhaka 2004
139 Tranquil Fabrics Ltd. Ward-16 Kafrul Dhaka 1998
140 Phila Delphiaap Ltd Ward-16 Kafrul Dhaka 1998
141 Elentine Apparels Ltd Ward-16 Kafrul Dhaka 2003
142 F.F. Garments Ward-16 Kafrul Dhaka 2003
143 Flat L.P.R Garments Ward-16 Kafrul Dhaka 1998
144 Out Right Fashion Ward-14 (part) Kafrul Dhaka 1998
145 Milinar Garments Ward-14 Kafrul Dhaka 2002
146 Out Fit Factory Ward-14 Kafrul Dhaka 2000
147 K-Tex Industrial co. Ward-14 Kafrul Dhaka 2003
148 Spicy Fashion Ltd Ward-14 Kafrul Dhaka 2005
149 M & M Dresses Ltd. Ward-14 Kafrul Dhaka 1999
150 Oditi Fashion Apparels Ltd Ward-14 Kafrul Dhaka 2004
5

Annexure-4.1: Industrial Development Violating DMDP Structure Plan Policy
Sl. No. Name Of Establishment Locality Thana District Inception Period
151 Sea Moss Knit Wear Ltd Ward-14 Kafrul Dhaka 2001
152 Out Wear Fashion Shewrapara Main Road Kafrul Dhaka 2000
153 Hoshen Dresses Ltd Ward-15 (part) Kafrul Dhaka 1998
154 Many Max Garments Ward-16 Kafrul Dhaka 1998
155 Onupam Fashion Ward-14 Kafrul Dhaka 2001
156 Outfit Fashion Ward-14 (part) Kafrul Dhaka 2000
157 Design sweater Shen Para Kafrul Dhaka 2005
158 Mayc & Garments Ltd Shen Para Kafrul Dhaka 2000
159 Teco Tex Garments Ltd Shen Para Kafrul Dhaka 2005
160 Basic Shirts Ltd Shen Para Kafrul Dhaka 2001
161 C.B.M International Ltd Shen Para Kafrul Dhaka 1998
162 Angal Fashion Shen Para Kafrul Dhaka 2004
163 Wega Apparels Shen Para Kafrul Dhaka 2001
164 Europe Apparels Ltd. Ward-04 Kafrul Dhaka 2002
165 Moonlit Apprels Ltd Ward-04 Kafrul Dhaka 2002
166 R.R. Products Ward-04 Kafrul Dhaka 1998
167 Four Wing Ltd Ward-04 Kafrul Dhaka 1998
168 Sharaj Garments Ltd Ward-04 Kafrul Dhaka 1998
169 Sharaj Apparels Ltd Ward-04 Kafrul Dhaka 1998
170 Golam Morshed And Brothers Ward-04 Kafrul Dhaka 2005
171 Lodes Star Fashions Ltd Ward-04 Kafrul Dhaka 2002
172 Mid Asia Fashins Ltd Ward-04 Kafrul Dhaka 2002
173 Absoliute Quality Wear Ltd Ward-04 Kafrul Dhaka 2000
174 New Alpa Printer Ltd Shen Para Kafrul Dhaka 2005
175 Harvest Moon Furniture Weard-14 Kafrul Dhaka 2001
176 Wool Tex Sweater Ltd Main Road Kafrul Dhaka 1998
177 Shajalal Sweater Factory Ward-16 Kafrul Dhaka 1998
178 Brb Knit Wear Ltd Ward-16 Kafrul Dhaka 2003
179 Zee Shan Box Ward-16 Kafrul Dhaka 2001
180 Daina Inter National Rohitpur Keraniganj Dhaka 2005
6
Annexure-4.1: Industrial Development Violating DMDP Structure Plan Policy
Sl. No. Name Of Establishment Locality Thana District Inception Period
181 B.M. Dyeing Kalindi Keraniganj Dhaka 2003
182 Nishan Brick Making N.B.M Konda Keraniganj Dhaka 2004
183 Mrs. Bhandhu Bricks Corporation. Konda Keraniganj Dhaka 2003
184 J.B.C. And Company Konda Keraniganj Dhaka 2003
185 Nizam Brick Field N.B.M Konda Keraniganj Dhaka 2002
186 Gora Chan Bepari Konda Keraniganj Dhaka 2004
187 RuhulAmin Brick Field J.B.S. Konda Keraniganj Dhaka 2002
188 Abdul Hamid Brick Field m.B.C Konda Keraniganj Dhaka 2001
189 Kanda Para Brick Century K.B.C Konda Keraniganj Dhaka 2001
190 Nvana Brick (N.B.M.) Konda Keraniganj Dhaka 2003
191 Asian Trade Nature A.T.N. Konda Keraniganj Dhaka 2003
192 Mrs. Adarsha Bricks Konda Keraniganj Dhaka 1998
193 Nasib Bricks N.B.M. Konda Keraniganj Dhaka 2003
194 M.S.H. Company Konda Keraniganj Dhaka 2002
195 Sohrab Nazrul Brick Field Konda Keraniganj Dhaka 2002
196 Mrs. National Brick Konda Keraniganj Dhaka 1998
197 National Bricks Konda Keraniganj Dhaka 1998
198 Mrs. Tanveer Enterprise Konda Keraniganj Dhaka 2004
199 National Bricks Marcent (N.b.M.) Konda Keraniganj Dhaka 1999
200 Qader Brick Field Konda Keraniganj Dhaka 2002
201 Belayet Bricks Konda Keraniganj Dhaka 1999
202 Nayem Bricks N.B.M. Konda Keraniganj Dhaka 2003
203 National Bricks Konda Keraniganj Dhaka 2002
204 National Bricks N.B.M. Konda Keraniganj Dhaka 2001
205 Sahazal Brick Field N.B.M. Konda Keraniganj Dhaka 1999
206 Mrs. New E.B.M.Co. N.B.M Konda Keraniganj Dhaka 2004
207 N.B.M. Brick Konda Keraniganj Dhaka 2003
208 U.N.B.M. Brick Konda Keraniganj Dhaka 2003
209 Sohel Mia Brick Field (N.B.M.) Konda Keraniganj Dhaka 1999
210 Mrs. Deldara Bricks Manufacture (N.B.M.) Konda Keraniganj Dhaka 2004
7

Annexure-4.1: Industrial Development Violating DMDP Structure Plan Policy
Sl. No. Name Of Establishment Locality Thana District Inception Period
211 Zuthi Enterprise Konda Keraniganj Dhaka 2003
212 Shaparan Bricks Konda Keraniganj Dhaka 2004
213 Momin Company Brick Field Konda Keraniganj Dhaka 2004
214 Md. Zakir Hossain Brick Field Konda Keraniganj Dhaka 2001
215 M.H. Brick Field Konda Keraniganj Dhaka 2003
216 Md. Abul Kashem M.K.B. Konda Keraniganj Dhaka 2001
217 Mizanur Rahman Babul Brick Field Konda Keraniganj Dhaka 2003
218 Rafiq Brick Field N.B.M. Konda Keraniganj Dhaka 1998
219 Hazi Samsar Brick Field P.B.M. Konda Keraniganj Dhaka 2003
220 Kutubiddin Brick (N.B.M.) Konda Keraniganj Dhaka 2003
221 A.M.M. Bricks Konda Keraniganj Dhaka 2001
222 Diamond Brciks (R.B.M.) Tegharia Keraniganj Dhaka 2004
223 Adhunik Bricks (A.B.M) Tegharia Keraniganj Dhaka 2004
224 Parzohar Manufacturing Bricks Tegharia Keraniganj Dhaka 2005
225 Nazrul Bricks Manufacture Tegharia Keraniganj Dhaka 2003
226 Alim Uddin And Rafia Bricks Tegharia Keraniganj Dhaka 2003
227 Alim Uddin And Rafia Bricks Tegharia Keraniganj Dhaka 2000
228 Nisha Bricks Tegharia Keraniganj Dhaka 2004
229 Baghair Brick Century Tegharia Keraniganj Dhaka 2003
230 Three Brothers Brick Field Tegharia Keraniganj Dhaka 2002
231 Sarang Dock Yard Konda Keraniganj Dhaka 2005
232 Al-Faruk Cap Products Pvt. Ltd Tegharia Keraniganj Dhaka 2002
233 Konda Brick Century N.B.M. Konda Keraniganj Dhaka 2003
234 Mrs. New N.B.m. Bricks Konda Keraniganj Dhaka 2005
235 Hazi Jalil & Jahangir Alam Brick N.B.M. Konda Keraniganj Dhaka 2004
236 Khandakar Brick Field Konda Keraniganj Dhaka 2000
237 Mrs. Nirman Brick Konda Keraniganj Dhaka 2003
238 J.B.M. Brick And Company Konda Keraniganj Dhaka 2003
239 National Brick Making Konda Keraniganj Dhaka 2003
240 new Brick N.B.M. Konda Keraniganj Dhaka 2004
8

Annexure-4.1: Industrial Development Violating DMDP Structure Plan Policy
Sl. No. Name Of Establishment Locality Thana District Inception Period
241 Nabab Brick Musium N.B.M. Konda Keraniganj Dhaka 2005
242 Tanveer & Sohel Bricks N.B.M. Konda Keraniganj Dhaka 2002
243 Mrs. Sabbir Enterprise S.B.M Konda Keraniganj Dhaka 2001
244 P.B.M Bricks Konda Keraniganj Dhaka 2003
245 East Bengal Brick Field Konda Keraniganj Dhaka 1999
246 Munshi Enterprise Konda Keraniganj Dhaka 1999
247 Shahidullah Brick Field Konda Keraniganj Dhaka 1999
248 National Bricks Konda Keraniganj Dhaka 2003
249 Abdul Kadir Bricks Field Konda Keraniganj Dhaka 2005
250 M.M.E. Enterprise Konda Keraniganj Dhaka 2003
251 Hazi Sirazul Islam Bricks Konda Keraniganj Dhaka 2004
252 N.B.M. Bricks Konda Keraniganj Dhaka 2004
253 Hossain brick Field Konda Keraniganj Dhaka 1998
254 Hazi Jalal Uddin Brick Field Konda Keraniganj Dhaka 2002
255 Kashem Zinjira (part) Keraniganj Dhaka 2002
256 River Side Sweaters Ltd. Shubhadaya Keraniganj Dhaka 2002
257 Relience Jute Mill Ltd Rohitpur Keraniganj Dhaka 2004
258 Bashed Steel Pvt Ltd Tetuljhora Keraniganj Dhaka 2005
259 Nasiruddin Dockyard Konda Keraniganj Dhaka 2005
260 Enamul Haque Dockyard Konda Keraniganj Dhaka 2001
261 Basundhara River View Konda Keraniganj Dhaka 2002
262 Sayed Mia Subhadya (part) Keraniganj Dhaka 1998
263 Mausumi Overseas Matuail Keraniganj Dhaka 2000
264 Diamond Melamine Kalindi Keraniganj Dhaka 1998
265 Glob Metal Aganagar Keraniganj Dhaka 1998
266 Hossain Steel Sakta Keraniganj Dhaka 2004
267 Keraniganj Jute Fiber Ltd Rohitpur Keraniganj Dhaka 1998
268 Crown Malamine Industries Ltd Sakta Keraniganj Dhaka 1999
269 Global Heavy Chemical Ltd Shubhadaya (part) Keraniganj Dhaka 2002
270 S.N. Jerin Painting. Ward-26 (part-01) Khilgaon Dhaka 2003
9

Annexure-4.1: Industrial Development Violating DMDP Structure Plan Policy
Sl. No. Name Of Establishment Locality Thana District Inception Period
271 Liriquin Ind (pvt) Ltd Garments. Ward-22 (part) Khilgaon Dhaka 2001
272 Naturul Apparels Ward-22 (part) Khilgaon Dhaka 2000
273 Fashion Costumes Ltd. Ward-22 (part) Khilgaon Dhaka 2001
274 Komando Garments Ward-22 (part) Khilgaon Dhaka 1999
275 Liriq Apparels Ltd. Ward-22 (part) Khilgaon Dhaka 2002
276 Super Sign Apparels Ward-22 Khilgaon Dhaka 2000
277 R.M. Sweater Pvt Ltd. Ward-22 (part) Khilgaon Dhaka 1999
278 weeny apparels Ltd. Ward-22 (part) Khilgaon Dhaka 1999
279 Esex Limited. Ward-22 (part) Khilgaon Dhaka 1998
280 Latest Fashion Ward-22 Khilgaon Dhaka 2000
281 Sweater Farms Ltd. Ward-23 Khilgaon Dhaka 2000
282 Fahami apparels Ltd Ward-23 Khilgaon Dhaka 2002
283 M.U. Fashion Ward-23 Khilgaon Dhaka 2005
284 Aim Garments Ward-23 Khilgaon Dhaka 2004
285 Pinakal Sweater Ward-23 Khilgaon Dhaka 1999
286 New world Apparels Ltd Ward-23 Khilgaon Dhaka 1998
287 Bonny apparels pvt. Ward-23 Khilgaon Dhaka 1999
288 Super Shine Garments Ward-23 Khilgaon Dhaka 1998
289 Bedita Enterprise Ltd. Ward-23 Khilgaon Dhaka 2002
290 Venix Bangladesh Ltd. Chaw Para Khilgaon Dhaka 2000
291 Fontina Fashion Ltd. Chaw Para Khilgaon Dhaka 2001
292 B. Brothers Garments Ltd Chaw Para Khilgaon Dhaka 1999
293 Trans Allied Gmt Ltd. Chaw Para Khilgaon Dhaka 2005
294 Smee apparels Ltd Chaw Para Khilgaon Dhaka 2005
295 Kas Knit Wear Ltd. Chaw Para Khilgaon Dhaka 2003
296 Voyager Apparels Ltd Chaw Para Khilgaon Dhaka 2000
297 Evoke Fashion Ltd. Chaw Para Khilgaon Dhaka 2001
298 Tamizuddin Fashion Ltd Chaw Para Khilgaon Dhaka 2002
299 Cost to Cost Fashion Ltd. Ward-24 Khilgaon Dhaka 1998
300 Cost to Cost Apparels Ltd. Ward-24 Khilgaon Dhaka 1999
10
Annexure-4.1: Industrial Development Violating DMDP Structure Plan Policy
Sl. No. Name Of Establishment Locality Thana District Inception Period
301 Luna Apparels Ward-25 (part) Khilgaon Dhaka 1999
302 Sikder Fashion Wear Ltd Malibagh Chaw. Para Khilgaon Dhaka 1999
303 Parag Sweater Ltd Ward-22 Khilgaon Dhaka 2003
304 Victory Sweater Malibagh Khilgaon Dhaka 2002
305 Imperial Sweater Bangladesh Ltd Malibagh Khilgaon Dhaka 2004
306 Paritom Apparels Pvt Ltd Ward-24 Khilgaon Dhaka 2003
307 Komet Fashion Ward-24 Khilgaon Dhaka 2003
308 Parag Textile Patuatuli Kotwali Dhaka 2000
309 Saikat Aluminium, Industry Ltd. Ward-66 Kotwali Dhaka 2000
310 Alam Hosiary Ward-73 Kotwali Dhaka 1998
311 Delux Sandal Factory Ward-70 Kotwali Dhaka 2003
312 Paul & Brothers Jewellers Ward-73 Kotwali Dhaka 1998
313 Navana Poly Packaging Ltd Ward-69 Kotwali Dhaka 2003
314 Phoenix Sweater (Bd) Ltd. Ward-66 Lalbagh Dhaka 2003
315 Shohag Plastic Factory Ward-61 Lalbagh Dhaka 2002
316 Fair Plastic Industries Ward-63 Lalbagh Dhaka 1999
317 Active Zipper Ltd. Ward-06 (part) Mirpur Dhaka 2003
318 Tanin Electrical Appliances Ltd. Ward-12 Mirpur Dhaka 1998
319 Chowdhury International Embroidery Ward-11 (part) Mirpur Dhaka 1998
320 Mirpur Garments Ltd. Ward-07 Mirpur Dhaka 2005
321 Nacsent Knit wear pvt Ltd Ward-07 Mirpur Dhaka 1998
322 Salam Zincs Ward-07 Mirpur Dhaka 1999
323 Uddag Fashion Ward-07 Mirpur Dhaka 1999
324 Pro- star Industrial Co. Ward-07 Mirpur Dhaka 2004
325 Sabarang Fashions Ltd Ward-07 Mirpur Dhaka 1998
326 Chowdhury Garments Ward-10 Mirpur Dhaka 1998
327 Orbital Sweater Ward-10 Mirpur Dhaka 1999
328 Esteems apparels Ltd Ward-10 Mirpur Dhaka 1998
329 Yourk Fashion Ward-10 Mirpur Dhaka 1999
330 Yourk Sports wear Ltd Ward-10 Mirpur Dhaka 2002
11

Annexure-4.1: Industrial Development Violating DMDP Structure Plan Policy
Sl. No. Name Of Establishment Locality Thana District Inception Period
331 Amico Garments Ward-10 Mirpur Dhaka 2001
332 Golden Ducks Garment Ward-10 Mirpur Dhaka 2005
333 Babylon garments Ward-10 Mirpur Dhaka 2000
334 Apparels Export Ltd Ward-10 Mirpur Dhaka 2003
335 Diamond Sweater Industries Ltd. Ward-10 Mirpur Dhaka 2003
336 Peerless sweater Bangladesh Ltd Ward-10 Mirpur Dhaka 2004
337 Florscent Garments Ward-13 (part) Mirpur Dhaka 2001
338 tangail Apparels Ltd Ward-13 Mirpur Dhaka 2005
339 Sahjalal group (Knit Fashion) Ward-13 Mirpur Dhaka 2001
340 Prime Knits Ltd Ward-13 Mirpur Dhaka 2002
341 A.F.M sweaters Ltd Ward-13 (part) Mirpur Dhaka 2005
342 Maptex Wear Ltd Ward-13 (part) Mirpur Dhaka 1999
343 Fine Apparels Ward-13 (part) Mirpur Dhaka 2000
344 Mozaded Garments Ward-13 Mirpur Dhaka 2005
345 Ratul Fabrics Ward-14 Mirpur Dhaka 2005
346 Wintex Apparels Ltd Ward-14 Mirpur Dhaka 1999
347 Pakarsh apparels Ward-12 (part) Mirpur Dhaka 2000
348 Aziz fashion Pvt Ltd Ward-12 (part) Mirpur Dhaka 1999
349 Pear Less Ward-12 (part) Mirpur Dhaka 1999
350 Swapan Kumar Garments (S.K. Garments) Ward-12 (part) Mirpur Dhaka 1998
351 Omega Sweaters Ltd Ward-12 (part) Mirpur Dhaka 2000
352 Blazer Apparels Ltd Ward-11 (part) Mirpur Dhaka 1999
353 simco fashion Ward-11 Mirpur Dhaka 2005
354 thandard Knit Wear Ltd Ward-11 Mirpur Dhaka 2005
355 Apparels & Apparel Ward-11 Mirpur Dhaka 2005
356 Ayasha & Galeya Fashion Ltd Ward-11 Mirpur Dhaka 2005
357 Hyfoid Girls Fashion Ltd Ward-11 Mirpur Dhaka 2005
358 Zenith Fashion Ltd Ward-11 Mirpur Dhaka 2003
359 Hyfoid Lingeries Ltd Ward-11 Mirpur Dhaka 2001
360 Needs Fashion Ltd Ward-11 Mirpur Dhaka 2000
12

Annexure-4.1: Industrial Development Violating DMDP Structure Plan Policy
Sl. No. Name Of Establishment Locality Thana District Inception Period
361 Angshok Ltd Ward-11 Mirpur Dhaka 2000
362 Jahanara Fashion Ward-12 (part) Mirpur Dhaka 1998
363 Barnaly International Ward-07 Mirpur Dhaka 2000
364 Cotton Home Ltd Ward-07 Mirpur Dhaka 2003
365 Meghna Washing Plant Ward-08 Mirpur Dhaka 2000
366 Tunghai Sweater Ltd Ward-10 Mirpur Dhaka 2002
367 Sweater Manufacture Ward-10 Mirpur Dhaka 2002
368 Tamanna Fabrics Ward-12 (part) Mirpur Dhaka 2004
369 Marmaid Sweater pvt Ltd Ward-12 (part) Mirpur Dhaka 2003
370 Radiance International Ward-12 (part) Mirpur Dhaka 2000
371 Peerage Knit wear Ltd Ward-12 Mirpur Dhaka 2002
372 Armin Sweater Ward-13 (part) Mirpur Dhaka 2001
373 T.S. sweater Ward-14 Mirpur Dhaka 2002
374 Fouad Furniture Ward-11 Mirpur Dhaka 1998
375 Furnitex Furniture Ward-14 Mirpur Dhaka 2000
376 Decent printing Ward-12 Mirpur Dhaka 2004
377 Modern Plastic Ward-13 Mirpur Dhaka 1998
378 Sarf Dyeing And Printing Ward-07 Mirpur Dhaka 2003
379 Sarf International Ward-07, Mirpur Dhaka 2005
380 Sarker Design Ward-07 Mirpur Dhaka 2005
381 Florescent International Ward-12 Mirpur Dhaka 2001
382 Khan Screen Print Ward-12 (part) Mirpur Dhaka 1999
383 Khan Design Fair Eward-10, Mirpur Dhaka 1999
384 Naj Fashion Shamoly Mohammadpur Dhaka 2000
385 Azim Garments Sher-E-Bangla Road Mohammadpur Dhaka 2005
386 Samrana Enterprise Ward-46 Mohammadpur Dhaka 2000
387 Nazia Fashion Tazmohol Road Mohammadpur Dhaka 2000
388 ABM Garments Ward-43 Mohammadpur Dhaka 1998
389 Florida Fashion Ward-43 Mohammadpur Dhaka 2000
390 Akar Fashion Shamoly Mohammadpur Dhaka 2002
13

Annexure-4.1: Industrial Development Violating DMDP Structure Plan Policy
Sl. No. Name Of Establishment Locality Thana District Inception Period
391 Delux Garments Shamoly Mohammadpur Dhaka 2005
392 Macro Knit wear Ltd Tajmahal Raod Mohammadpur Dhaka 2001
393 R.N Sweater Ward-43 Mohammadpur Dhaka 1998
394 J.F sweater Ward-43 Mohammadpur Dhaka 2000
395 Tex-Co Ltd Agargaon Mohammadpur Dhaka 2000
396 M.N.S Printing Shamoly Mohammadpur Dhaka 2002
397 Glorious Fashion And Design P.C Culture Housing Mohammadpur Dhaka 2005
398 Combind Embroydary Mohammadpur Mohammadpur Dhaka 2003
399 Ma-Fashion Shamoly Mohammadpur Dhaka 2005
400 Zhas Garments Ward-32 Motijheel Dhaka 2003
401 Reo Fashion Ward-32 Motijheel Dhaka 2004
402 Mita Garments Ward-32 Motijheel Dhaka 2005
403 Omi Apparels Ward-35 Motijheel Dhaka 2002
404 The bay Super Textile Mills Ltd Ward-36 Motijheel Dhaka 1998
405 Majumdar Apparels Ltd. Ward-36 Motijheel Dhaka 1998
406 Mita fashion And Saam Business Ward-32 Motijheel Dhaka 2005
407 Koronic Industries Ltd ward-36 Motijheel Dhaka 2001
408 Barnomala Printing Press Ward-36 Motijheel Dhaka 2002
409 Narun Nahar Knit wear Ltd Ward-06 Pallabi Dhaka 2005
410 Joint Tex Knit wear Ward-06 Pallabi Dhaka 2003
411 Alps Apparels Ltd Ward-06 Pallabi Dhaka 2000
412 Capital Sweater Milk Vita Road Pallabi Dhaka 1998
413 April Fashion Ward-06 (part) Pallabi Dhaka 2003
414 Pioneer apparels Ltd Ward-06 (part) Pallabi Dhaka 2001
415 Aba Sweater Ltd Ward-06 (part) Pallabi Dhaka 2000
416 IB apparels Ward-06 (part) Pallabi Dhaka 2005
417 BR Apparels Ltd Ward-06 (part) Pallabi Dhaka 2003
418 K.G Garments Ward-06 (part) Pallabi Dhaka 1998
419 Kestler Fashion Ward-06 (part) Pallabi Dhaka 2002
420 Chllo of Bangladesh Ltd Ward-06 (part) Pallabi Dhaka 2000
14

Annexure-4.1: Industrial Development Violating DMDP Structure Plan Policy
Sl. No. Name Of Establishment Locality Thana District Inception Period
421 Epylion Knit Wears Ltd Ward-06 (part) Pallabi Dhaka 2003
422 Arba garments & Ind. Ltd Ward-06 (part) Pallabi Dhaka 2003
423 Z-3 Saraga Ind, Ltd. Ward-06 (part) Pallabi Dhaka 2001
424 P & R Fashion Ward-06 (part) Pallabi Dhaka 2003
425 Madina Wear House Ltd Ward-03 Pallabi Dhaka 2005
426 shaas garments Ward-03 (part) Pallabi Dhaka 2001
427 Cresent Star Ltd Ward-05 (part) Pallabi Dhaka 1999
428 Ruma garments Wear Ltd Ward-05 (part) Pallabi Dhaka 2000
429 seha Design Bangladesh Ltd Ward-05 Pallabi Dhaka 1998
430 Rime Apparels Ltd Ward-05 Pallabi Dhaka 2000
431 Amity Design Ltd. Ward-05 Pallabi Dhaka 1998
432 Kazipur Fashion Ward-05 (part) Pallabi Dhaka 1999
433 wear MAG Ward-05 (part) Pallabi Dhaka 1999
434 Tiptop Fashion Ward-05 (part) Pallabi Dhaka 1999
435 Amex Ltd Ward-05 (part) Pallabi Dhaka 1999
436 Adhunik Poshak Shilpa Ltd Ward-05 (part) Pallabi Dhaka 2002
437 Cotton Print Ward-03 Pallabi Dhaka 2003
438 Tropical Sweater Ltd Ward-02 (part) Pallabi Dhaka 2002
439 Cotton Fashion Wears Ltd Ward-02 Pallabi Dhaka 2002
440 Sathi Fashions Apparels Ward-02 Pallabi Dhaka 2000
441 Royal Bangla Design Ltd Sec-11, Block-D Pallabi Dhaka 2003
442 Sana Sweater ward-06 (part) Pallabi Dhaka 2004
443 Casender Sweater ward-06 (part) Pallabi Dhaka 2003
444 Elias Mallik (mallik Shoe) Ward-05 (part) Pallabi Dhaka 2000
445 Innova Pharmaceuticals Ltd Ward-02 Pallabi Dhaka 2003
446 Apical Printing And Design Ward-03 Pallabi Dhaka 2005
447 Zyta Apparels Ward-06, Pallabi Dhaka 2003
448 Zyta Washing Ward-06 Pallabi Dhaka 2001
449 Knit Concern Printing Ward-06, (part) Pallabi Dhaka 2005
450 Appolo Design & Print Ward-06, (part) Pallabi Dhaka 2002
15

Annexure-4.1: Industrial Development Violating DMDP Structure Plan Policy
Sl. No. Name Of Establishment Locality Thana District Inception Period
451 Diamond Packaging Ward-06 (part) Pallabi Dhaka 2003
452 Epyllion Ltd Ward-06 (part) Pallabi Dhaka 2003
453 Arizona Sweater Ltd Ward-06 Pallabi Dhaka 2001
454 Dynamic Garment Printers Ward-06 Pallabi Dhaka 2004
455 GQ Marketing Ltd. Ward-54 Ramna Dhaka 1998
456 Raju Garments Fulbaria Madrasa Market Ramna Dhaka 1998
457 fashion Zone Ltd Ward-56 Ramna Dhaka 1998
458 Aarong Ward-54 Ramna Dhaka 2002
459 G,Q Marketing Ltd ward-54 (part) Ramna Dhaka 1998
460 Raneta Ltd ward-56 Ramna Dhaka 2002
461 Orchid Printers Bangla Motor Ramna Dhaka 2001
462 Adrian Printing And Design Ward-55 Ramna Dhaka 2005
463 CCC Garments Ward-27 (part) Sabujbagh Dhaka 2005
464 Success Fashion, Ward-27 (part) Sabujbagh Dhaka 2000
465 Miami garments Ward-28 Sabujbagh Dhaka 1999
466 Hayat Garments Ward-28 Sabujbagh Dhaka 1999
467 Suraya Sweater Maniknagar Sabujbagh Dhaka 2002
468 Bakhtiar Alam Furniture Ward-27 (part0 Sabujbagh Dhaka 1998
469 mendelar Apparels Ltd Aminbazar Savar Dhaka 2005
470 Zon Ron Sweater Ltd Aminbazar Savar Dhaka 2002
471 Rojbag Thread Bangladesh Ltd Ashulia Savar Dhaka 2005
472 Laundry Industies Ltd Ashulia Savar Dhaka 2003
473 M.S.D Fashion Ltd Ashulia Savar Dhaka 1999
474 Tex Eleeta Pvt Ltd Ashulia Savar Dhaka 2004
475 Lamp Knit wear Ltd Ashulia Savar Dhaka 2005
476 Ametex Ashulia Savar Dhaka 1998
477 Danasty sweaters (bd) Ltd Asulia Savar Dhaka 2004
478 Radiran Fashion (Garments) Ltd Asulia Savar Dhaka 2000
479 3A Fashion Asulia Savar Dhaka 2004
480 Ese Knitwear Ltd Asulia Savar Dhaka 2004
16

Annexure-4.1: Industrial Development Violating DMDP Structure Plan Policy
Sl. No. Name Of Establishment Locality Thana District Inception Period
481 Lam Mim Associate Asulia Savar Dhaka 2004
482 Land mark Garments Asulia Savar Dhaka 2004
483 Pacific Sweater wear Ltd Asulia Savar Dhaka 2004
484 B.Bangla Garments Asulia Savar Dhaka 1999
485 Fuji Fashion Asulia Savar Dhaka 2001
486 Siron Brics Bangram Savar Dhaka 2001
487 Mark Tery Ltd Bara Ashulia Savar Dhaka 2003
488 Markab Accessories Ltd Bara Ashulia Savar Dhaka 1999
489 Hajrat Ali Brick Fild Bhakutra Savar Dhaka 2000
490 Pearaj Knit Wear Pvt ltd Biralia Savar Dhaka 1998
491 Cotton Factory East Rajshan Savar Dhaka 1998
492 Bangladesh Dyeing Genda Savar Dhaka 1998
493 A.H Steel Karnapara (east) Savar Dhaka 1998
494 Monnu Jutex Panchas Savar Dhaka 2001
495 Hyder Ltd Pathalia (part) Savar Dhaka 2001
496 Kohinor Spinning Mill Pathalia (part) Savar Dhaka 2000
497 Tua-ha Textile Shimulia Savar Dhaka 2005
498 Jamani Printers Shimulia Savar Dhaka 2005
499 Badhon Food Industries. Tetuljhora Savar Dhaka 2002
500 Menal Kanti Tetuljhora Savar Dhaka 2001
501 Proma Green Syndicate Pvt. Ltd. Tetuljhora Savar Dhaka 2000
502 Padma Cane Ciose Up Ltd. Tetuljhora Savar Dhaka 1998
503 Navana, Furniture & automobile Tetuljhora Savar Dhaka 2001
504 The Cloth Fashion Ltd Tetuljhora Savar Dhaka 2004
505 Max Com Fashion Ltd Tetuljhora Savar Dhaka 2003
506 Star Associates Ltd. Tetuljhora Savar Dhaka 2003
507 Dipta Garments Ltd Tetuljhora Savar Dhaka 2004
508 Mohammadi Fashion ltd Tetuljhora Savar Dhaka 2000
509 S.M.A. Fashion Tetuljhora Savar Dhaka 2003
510 Vision Wear Ltd Tetuljhora Savar Dhaka 2003
17
Annexure-4.1: Industrial Development Violating DMDP Structure Plan Policy
Sl. No. Name Of Establishment Locality Thana District Inception Period
511 Mohammad Fashion Tetuljhora Savar Dhaka 2000
512 Aji group Tetuljhora Savar Dhaka 2002
513 Thi Bangla Tetuljhora Savar Dhaka 1998
514 Anu Fashion Tetuljhora Savar Dhaka 2002
515 Aboni Fashion Tetuljhora Savar Dhaka 2002
516 Fa apparels Ltd Tetuljhora Savar Dhaka 2004
517 Virgo Attirtes Ltd Tetuljhora Savar Dhaka 2004
518 C.P Bangladesh Co. Ltd Tetuljhora Savar Dhaka 2005
519 Jalalabad steel ltd Tetuljhora Savar Dhaka 2003
520 M.A Zipper Tetuljhora Savar Dhaka 2001
521 Green Earo Sweater Tetuljhora Savar Dhaka 2003
522 Dekko Foods Ltd Tetuljhora Savar Dhaka 2004
523 Zia engineering Workshop Tetuljhora Savar Dhaka 2004
524 Delko Engineering Workshop Tetuljhora Savar Dhaka 2000
525 Amber Textile Ltd Tetuljhora Savar Dhaka 2000
526 Shamim Enterprise Workshop Tetuljhora Savar Dhaka 2001
527 Shatu Pesty Sides Tetuljhora Savar Dhaka 2000
528 Angel Fabrics Tetuljhora Savar Dhaka 2001
529 Axcila Textile Tetuljhora Savar Dhaka 1998
530 Apex Pharma Tetuljhora Savar Dhaka 2003
531 Swiss Tex Mercury Tetuljhora Savar Dhaka 2000
532 A.K.H Pack Ltd Tetuljhora Savar Dhaka 2002
533 Usha feed ltd. Yearpur Savar Dhaka 2002
534 Jalal, Furniture Co. Ltd. Yearpur Savar Dhaka 2002
535 Scandex (BD) Ltd Yearpur Savar Dhaka 2002
536 N. Boy Complex Yearpur Savar Dhaka 2004
537 Star Ling Apparels Ltd Yearpur Savar Dhaka 2000
538 Unioun Exports Dire Ltd Yearpur Savar Dhaka 2003
539 A.M. Design Ltd. Shade Fashion Yearpur Savar Dhaka 2002
540 Riom Complex Yearpur Savar Dhaka 2001
18
Annexure-4.1: Industrial Development Violating DMDP Structure Plan Policy
Sl. No. Name Of Establishment Locality Thana District Inception Period
541 Shade Fashion Ltd Yearpur Savar Dhaka 2002
542 P. And Attires Yearpur Savar Dhaka 2004
543 G.B.S. Wears Ltd Yearpur Savar Dhaka 2003
544 Setara group Yearpur Savar Dhaka 2004
545 Harun Fashion Ltd. Yearpur Savar Dhaka 2001
546 Radians Knitwear Ltd Yearpur Savar Dhaka 2002
547 A.R.D. Knitwear Ltd Yearpur Savar Dhaka 2001
548 Mogjpee Knitwear Ltd Yearpur Savar Dhaka 2004
549 Annesha Style Ltd Yearpur Savar Dhaka 2003
550 S. Nahar Ltd Yearpur Savar Dhaka 2005
551 That’s It Knit Ltd Yearpur Savar Dhaka 2002
552 that’s It Sports Wear Ltd Yearpur Savar Dhaka 2001
553 S. Sahi Industrial Park Ltd Yearpur Savar Dhaka 2001
554 Active Composite Mills Ltd Yearpur Savar Dhaka 2000
555 Bengal Plastic Pvt Ltd Yearpur Savar Dhaka 1998
556 Alambagh Re-Rolling Mill Ward-90 Shyampur Dhaka 2000
557 Atobi Ltd. Shyampur-27 Shyampur Dhaka 2003
558 Meghna Wheels Road-13, Plot-09 Shyampur Dhaka 2001
559 Mita Textile Shyampur Uc Shyampur Dhaka 2000
560 A.B.C. Knitting & Dyeing Finishing Kadamtali Shyampur Dhaka 1998
561 Young Star Sweater Ali Bahar Shyampur Dhaka 1999
562 Exotic Sweater Ltd Ward-87 Shyampur Dhaka 2004
563 Prime Rubber Ward-90 Shyampur Dhaka 2003
564 Sonaly Rubber Industry Ward-90 Shyampur Dhaka 2001
565 Modina Rubber High School Road Shyampur Dhaka 2001
566 Vorosha Match Factory Ward-90 Shyampur Dhaka 2001
567 shadesh Metal Natun Shyampur Shyampur Dhaka 2000
568 Chamok Textile Kadamtali Uc Shyampur Dhaka 1999
569 Golri Rextile Shyampur Uc Shyampur Dhaka 2005
570 Daily naya Diganta Ward-90 Shyampur Dhaka 2005
19

Annexure-4.1: Industrial Development Violating DMDP Structure Plan Policy
Sl. No. Name Of Establishment Locality Thana District Inception Period
571 Azad steel Uc Part, Postogola Shyampur Dhaka 2002
572 H. Ali Steel Mills Ltd Kadamtali Shyampur Dhaka 1999
573 Kanika Rolling Mill Natun Shyampur Shyampur Dhaka 2000
574 Amir Ceiling Fan factory Ward-87 Shyampur Dhaka 2001
575 I.V Textile Snyanpur Uc Part Shyampur Dhaka 1998
576 Jedda Dyeing Snyanpur Uc Part Shyampur Dhaka 1999
577 Omar Dyeing (Sonali Dyeing) Snyanpur Uc Part Shyampur Dhaka 2002
578 Estern *** Ltd Shyampur Shyampur Dhaka 2003
579 K. Ali Dyieng Shyampur Shyampur Dhaka 2000
580 Jenies Shoe Road-12 Shyampur Dhaka 1998
581 NKK Sweater ltd Ward-90 Shyampur Dhaka 1998
582 Amc sweater Ltd Ward-90 Shyampur Dhaka 1999
583 Seven star sweater Ward-90 Shyampur Dhaka 2005
584 D.K. Sweater Factory Kadamyali Shyampur Dhaka 1999
585 Palash Dyeing ward-90 Shyampur Dhaka 2001
586 Al Islam Dyeing Ward-90 Shyampur Dhaka 2005
587 Popular Dyeing Ward-90 Shyampur Dhaka 2001
588 National Dyeing Snyanpur Uc Part Shyampur Dhaka 2002
589 Alpha Group Office. Hatkhola Road Sutrapur Dhaka 2005
590 Millennium Garments Ltd Ward-75 Sutrapur Dhaka 2000
591 Alliance Garments Hatkhola Road Sutrapur Dhaka 2002
592 Kazi Fashion Ltd Hatkhola Road Sutrapur Dhaka 2003
593 A.S Garmants & Textile Ltd Ward-77 Sutrapur Dhaka 2000
594 MW Khan Book Binding Ward-78 Sutrapur Dhaka 2003
595 Lovely Printers Rupchand Das lane Sutrapur Dhaka 2002
596 Quality Iron Factory Ward-37 Tejgaon Dhaka 2003
597 Modern Erection Ltd. Ward-37 (part) Tejgaon Dhaka 2000
598 Limo Electronics Production. Ward-37 (part), Tejgaon Dhaka 2001
599 Pro Sports Ward-37 Tejgaon Dhaka 2005
600 Floret Fashions Ward-37 Tejgaon Dhaka 1999
20

Annexure-4.1: Industrial Development Violating DMDP Structure Plan Policy
Sl. No. Name Of Establishment Locality Thana District Inception Period
601 Momtaj Apparels Ltd. Ward-39 Tejgaon Dhaka 2003
602 Debnair Fashion Ltd Ward-39 Tejgaon Dhaka 2000
603 Sham Fashion Ltd. Ward-39 Tejgaon Dhaka 2000
604 Designand Source Ltd Ward-39 Tejgaon Dhaka 2000
605 Brothers Fashions ltd Ward-39 Tejgaon Dhaka 2001
606 Nobel Garments Ward-37 (part) Tejgaon Dhaka 1999
607 Benson garments Ward-37 Tejgaon Dhaka 2000
608 D.C Wear Ltd Ward-37 (part) Tejgaon Dhaka 2000
609 Shore To Shore (BD) Ltd Ward-37 Tejgaon Dhaka 2001
610 Sun Shine Knit Wear Ltd Ward-37 Tejgaon Dhaka 2003
611 Hankong Garments Ward-37 Tejgaon Dhaka 2004
612 SQ Knitting Unit Rangs Bhaban 5th floor Tejgaon Dhaka 2002
613 Arnub Sweater Ward-37 (part) Tejgaon Dhaka 2001
614 Sindhu Knit Composit Pvt Ltd Ward-37 Tejgaon Dhaka 2004
615 Modern Emage Sweater Pvty Ward-40 Tejgaon Dhaka 2005
616 Master sanitary Engineering Ward-37 (part) Tejgaon Dhaka 1999
617 Ata Hassain Khan Industries Ward-37 (part) Tejgaon Dhaka 1999
618 Lebel For Garments Ward-37 (part) Tejgaon Dhaka 2000
619 Pacific Label Ward-37 Tejgaon Dhaka 2003
620 Kamini Enterprise Ward-37 Tejgaon Dhaka 2003
621 KMP Resource Ltd Ward-37 Tejgaon Dhaka 2001
622 Atlantic House (gtc) Ward-37 Tejgaon Dhaka 2005
623 Auto Equipment Ltd Ward-37 Tejgaon Dhaka 2002
624 MH Industries Kunipara Tejgaon Dhaka 2000
625 Khan Accessories Ltd Paschim Tej Ind Area Tejgaon Dhaka 1999
626 Dainik samakal Publication Ward-37 Tejgaon Dhaka 1999
627 Daily Mukto Kantha Ward-39 Tejgaon Dhaka 2005
628 Young Labels Ltd Ward-37 (part) Tejgaon Dhaka 2000
629 Star Iron And Steel Industries Ward-37 Tejgaon Dhaka 1999
630 Rangs Pharmaceuticals Kunipara Tejgaon Dhaka 2000
21

Annexure-4.1: Industrial Development Violating DMDP Structure Plan Policy
Sl. No. Name Of Establishment Locality Thana District Inception Period
631 Nasa Wash Ltd (Unit-2) Ward-37 Tejgaon Dhaka 1999
632 Top Clean Bd. Ltd Ward-37 Tejgaon Dhaka 2000
633 Wega washing Centre Ward-37 (part) Tejgaon Dhaka 2000
634 Modern Textile Mills Ward-37 (part) Tejgaon Dhaka 1998
635 Stitch Well Designs Ltd Ward-37 Tejgaon Dhaka 2003
636 Pacman Bangladesh Ltd Ward-37 (part) Tejgaon Dhaka 1998
637 Square Fharmaceuticals Ward-37 (part) Tejgaon Dhaka 1998
638 Union Lebel And Accessories Ltd, Carton Making Ward-37 (part) Tejgaon Dhaka 1998
639 Stalling Washing Ward-37, (part) Tejgaon Dhaka 1998
640 A To Z Garments Washing Ward-37, (part) Tejgaon Dhaka 2000
641 Colorline Ward-37, (part) Tejgaon Dhaka 2005
642 Basic Trade Ind, Ltd Ward-37 Tejgaon Dhaka 2002
643 Nasa Embroydary Ward-37 Tejgaon Dhaka 1999
644 Kashida Embroydary Ward-37 Tejgaon Dhaka 2004
645 Royal Bengal Food Products & Etc. Turag Uttara Dhaka 2004
646 M/S, Uttaran Woven & Knit Ltd. Mather Bari Uttara Dhaka 2005
647 Nafa Apparels. Ltd. Ward-01 Uttara Dhaka 2000
648 Goodguys Ltd. Turag Uttara Dhaka 2003
649 Akif Fashion Ltd. Dakshin Khan Uttara Dhaka 2000
650 Shoks Apparels Dakshin Khan Uttara Dhaka 1999
651 Hae Song Corporation Ltd. Sweaters Dakshin Khan Uttara Dhaka 1998
652 Naziat Sweaters Ltd. Dakshin Khan Uttara Dhaka 1999
653 Amena Pvt. Ltd. Turag Uttara Dhaka 1999
654 M & H Shirt Making Turag Uttara Dhaka 2000
655 Shimulia International Ltd. Turag Uttara Dhaka 1999
656 L & C Fashion Ltd. Turag Uttara Dhaka 2005
657 Saud & Sweaters Ltd. Turag Uttara Dhaka 2003
658 Brio Bangladesh Ltd (Sweater Factory) Turag Uttara Dhaka 2005
659 Nawsin Garments Industries Ltd Ward-01 Uttara Dhaka 2005
660 Multistyee Consume Ltd Ward-01 Uttara Dhaka 2003
22

Annexure-4.1: Industrial Development Violating DMDP Structure Plan Policy
Sl. No. Name Of Establishment Locality Thana District Inception Period
661 Enigma Fashion Ward-01 Uttara Dhaka 1998
662 Enigma Fashion Ward-01 Uttara Dhaka 2000
663 Nippon Sweaters Ltd. Chairman Market Uttara Dhaka 2003
664 Turag Garments Chairman Market Uttara Dhaka 1999
665 Sark Fashion Ltd Turag Uttara Dhaka 2005
666 Peradise Sweaters Ltd Uttar Khan Uttara Dhaka 2005
667 Laksham Fashion Ltd Bally Complex Uttara Dhaka 2001
668 Syntex Knitwear Ward-o1 Uttara Dhaka 2000
669 Naj Sweater Ltd Ward-01 Uttara Dhaka 2002
670 Multi Line Sweater Ltd Dakshin Khan Uttara Dhaka 2002
671 Dong Chang (Dhaka), Ltd & M.J. Sweater Ltd Turag Uttara Dhaka 1998
672 raf Raf Knit Wear Ltd Turag Uttara Dhaka 2005
673 Impress Printing Turag Uttara Dhaka 2005
674 Liano Bangladesh Ltd Turag Uttara Dhaka 2002
675 Victory Fashion (emb) Ltd Turag Uttara Dhaka 2000
676 Meghna Cartoon Making Uttara Uttara Dhaka 1999
677 Kitway Pack Pvt Ltd Uttara Uttara Dhaka 2003
678 Hyes And Hair Basan Union Gazipur Sadar Gazipur 2000
679 dune garments Ltd. Basan Union Gazipur Sadar Gazipur 2004
680 Dana Garment Basan Union Gazipur Sadar Gazipur 2004
681 MK. Sweater Ltd Basan Union Gazipur Sadar Gazipur 2004
682 Salma Textile Gachha Gazipur Sadar Gazipur 1999
683 Sathi Metal Industries Gachha Gazipur Sadar Gazipur 2004
684 Steel Tap Ind. Ltd Gachha Gazipur Sadar Gazipur 2003
685 Hanaro fashion Ltd. Gachha Gazipur Sadar Gazipur 2000
686 Ponter Sweater Ltd. Gachha Gazipur Sadar Gazipur 2003
687 Fashion Apperence Gachha Gazipur Sadar Gazipur 2001
688 Star Light Group Gachha Gazipur Sadar Gazipur 2000
689 A.I.M. Sweater Ltd Gachha Gazipur Sadar Gazipur 2002
690 B.K.C. Sweater Ltd Gachha Gazipur Sadar Gazipur 2000
23

Annexure-4.1: Industrial Development Violating DMDP Structure Plan Policy
Sl. No. Name Of Establishment Locality Thana District Inception Period
691 Karim Sweater Industries Ltd Gachha Gazipur Sadar Gazipur 2001
692 Confidance sweater Ltd Gachha Gazipur Sadar Gazipur 2003
693 The Sweater Gachha Gazipur Sadar Gazipur 2001
694 Cosmic Sweater Gachha Gazipur Sadar Gazipur 2002
695 A.R. And Sweater Ltd Gachha Gazipur Sadar Gazipur 2002
696 Shamim Winter Sed Gachha Gazipur Sadar Gazipur 2002
697 Jamuna Paper Box Ltd Gachha Gazipur Sadar Gazipur 2000
698 Jahin Textile Mill Ltd Gachha Gazipur Sadar Gazipur 2003
699 Unimax Textile Industries Gachha Gazipur Sadar Gazipur 2002
700 Hira Glass Coating Ltd Gachha Gazipur Sadar Gazipur 2001
701 Trade Fair Glass Ind. Ltd Gachha Gazipur Sadar Gazipur 2002
702 M.M Foot Wear Ltd Gachha Gazipur Sadar Gazipur 2003
703 International Footwear Ltd Gachha Gazipur Sadar Gazipur 2001
704 Bright Packaging Ind Gachha Gazipur Sadar Gazipur 2001
705 M.A.M Packaging Ltd Gachha Gazipur Sadar Gazipur 2004
706 Masud Packaging Ltd Gachha Gazipur Sadar Gazipur 2002
707 Molia Bricks. Kashimpur Gazipur Sadar Gazipur 2001
708 Megatex Kashimpur Gazipur Sadar Gazipur 1999
709 Masihata Sweater Kashimpur Gazipur Sadar Gazipur 1998
710 Sumis Sweater Kashimpur Gazipur Sadar Gazipur 2004
711 Maimun Textile Kashimpur Gazipur Sadar Gazipur 2003
712 Myzas Spinning Kashimpur Gazipur Sadar Gazipur 1998
713 Pan Pacific Sweater Kayaltia Gazipur Sadar Gazipur 2000
714 Recent Sweater Ltd Kayaltia Gazipur Sadar Gazipur 2002
715 Madina Shoe Indus. Ltd Kayaltia Gazipur Sadar Gazipur 2001
716 Slusem Bangladesh Ltd Kayaltia Gazipur Sadar Gazipur 2000
717 Abuplastic Ind Kayaltia Gazipur Sadar Gazipur 1998
718 Kajal woolen Mills Ltd Kayaltia Gazipur Sadar Gazipur 2002
719 Aristo Pharma Ltd Kayaltia Gazipur Sadar Gazipur 2000
720 Rose Bangladesh Chamical Ltd Kayaltia Gazipur Sadar Gazipur 1998
24

Annexure-4.1: Industrial Development Violating DMDP Structure Plan Policy
Sl. No. Name Of Establishment Locality Thana District Inception Period
721 M.S. Banks Medicine Ltd Kayaltia Gazipur Sadar Gazipur 2000
722 Bangladesh Paper Manufacturing Kayaltia Gazipur Sadar Gazipur 2002
723 Tawol Textile Konabari Gazipur Sadar Gazipur 2005
724 Himaloy Bricks. Konabari Gazipur Sadar Gazipur 2003
725 Fuad Spinning Mill Konabari Gazipur Sadar Gazipur 2001
726 M.S. Nightingale Fashion Ltd Konabari Gazipur Sadar Gazipur 2002
727 Stalles Industries Ltd Konabari Gazipur Sadar Gazipur 1998
728 Bangladesh Plastic Product P. Ltd Konabari Gazipur Sadar Gazipur 1999
729 MS Napson Pharmacitycals Ltd Konabari Gazipur Sadar Gazipur 1999
730 Keya Cosmetics Ltd Konabari Gazipur Sadar Gazipur 1998
731 Green Land Mirpur Gazipur Sadar Gazipur 1998
732 Mim Knitting Dye Garmeny Mirpur Gazipur Sadar Gazipur 2002
733 National Feed Ltd. Mirzapur Gazipur Sadar Gazipur 2004
734 Meghna Bicycle Ind. Mirzapur Gazipur Sadar Gazipur 2000
735 Twoenbrother Garments Mirzapur Gazipur Sadar Gazipur 2001
736 S.M. Nedting Indus. Ltd. Mirzapur Gazipur Sadar Gazipur 2000
737 Korian Garments Ltd. Mirzapur Gazipur Sadar Gazipur 2000
738 Fakira Garments Ltd Mirzapur Gazipur Sadar Gazipur 2003
739 Dignity Tex Mills Ltd. Mirzapur Gazipur Sadar Gazipur 2002
740 Golden Refit Sweater Mirzapur Gazipur Sadar Gazipur 2003
741 Sun Power Ceramic Ind Ltd Mirzapur Gazipur Sadar Gazipur 2003
742 Bangladesh Tyer Ltd Mirzapur Gazipur Sadar Gazipur 2002
743 MAP Pvt Ltd Prahaladpur Gazipur Sadar Gazipur 2004
744 M.S Cresent Camical Ltd Pubail Gazipur Sadar Gazipur 2005
745 Antick Furniture Pubali Gazipur Sadar Gazipur 2004
746 Star Spinning Mills Ward-04 Bandor Narayanganj 2004
747 Cemex Cement Bangladesh Ltd. Ward-01 Bandor Narayanganj 2000
748 Haidary Composit Knitwear Pvt Ltd Madanpur Bandor Narayanganj 2003
749 Sqwire & Cable Co. Ltd Madanpur Bandor Narayanganj 2004
750 Mir Cement Murapara Rupganj Narayanganj 2003
25

Annexure-4.1: Industrial Development Violating DMDP Structure Plan Policy
Sl. No. Name Of Establishment Locality Thana District Inception Period
751 A.C.S. Textiles Tarabo Rupganj Narayanganj 2005
752 Harvest Rice Bulta Rupganj Narayanganj 2003
753 Global Spinning Dyeing Ltd Mura Para Rupganj Narayanganj 2005
754 City Sugar Mills Ltd Rupganj Rupganj Narayanganj 2005
755 City Fulty Feed Tarabo Rupganj Narayanganj 2004
756 N.K.T Ssve Paper Co. Ltd Mura para Rupganj Narayanganj 2004
757 Unique Cement Industries Ltd. Noagaon Sonargaon Narayanganj 2005
26

Annexure-4.2: Industries Located inside DMDP Structure Plan Indicated Main Flood Flow Zone, Sub-Flood Flow Zone and Agriculture Zones after 1997 to 2005
SI no. Name Of Establishment Location Locality Thana District Type
1 Usha feed ltd. Bennon, Jamgora, Daiakahali, Yearpur, Savar, Dhaka. Yearpur Savar Dhaka 50
2 Badhon Food Industries. Hemayatpur, Dakshin Shyampur, Tetuljhora, Savar Dhaka. Tetuljhora Savar Dhaka 68
3 Daina Inter National Vill-Natun Sona Kanda, Mauza-Sona Kanda, Rohitpur, Keraniganj, Dhaka. Rohitpur Keraniganj Dhaka 60
4 Menal Kanti Hemayatpur, Dakshin Shyampur, Tetuljhora, Savar Dhaka. Tetuljhora Savar Dhaka 50
5 B.M. Dyeing Potkazore, brahman Kitta, Kalindi, Keraniganj, Dhaka. Kalindi Keraniganj Dhaka 85
6 Nishan Brick Making N.B.M Janjira, Konda, Keraniganj, Dhaka. Konda Keraniganj Dhaka 150
7 Mrs. Bhandhu Bricks Corporation. Janjira, Konda, Keraniganj, Dhaka. Konda Keraniganj Dhaka 125
8 J.B.C. And Company Janjira, Konda, Keraniganj, Dhaka. Konda Keraniganj Dhaka 150
9 Nizam Brick Field N.B.M Janjira, Konda, Keraniganj, Dhaka. Konda Keraniganj Dhaka 120
10 Gora Chan Bepari Janjira, Konda, Keraniganj, Dhaka. Konda Keraniganj Dhaka 100
11 RuhulAmin Brick Field J.B.S. Janjira, Konda, Keraniganj, Dhaka. Konda Keraniganj Dhaka 160
12 Abdul Hamid Brick Field m.B.C Janjira, Konda, Keraniganj, Dhaka. Konda Keraniganj Dhaka 150
13 Kanda Para Brick Century K.B.C Janjira, Konda, Keraniganj, Dhaka. Konda Keraniganj Dhaka 100
14 Navana Brick (N.B.M.) Janjira, Konda, Keraniganj, Dhaka. Konda Keraniganj Dhaka 250
15 Asian Trade Nature A.T.N. Janjira, Konda, Keraniganj, Dhaka. Konda Keraniganj Dhaka 150
16 Mrs. Adarsha Bricks Janjira, Konda, Keraniganj, Dhaka. Konda Keraniganj Dhaka 130
17 Nasib Bricks N.B.M. Janjira, Konda, Keraniganj, Dhaka. Konda Keraniganj Dhaka 350
18 M.S.H. Company Janjira, Konda, Keraniganj, Dhaka. Konda Keraniganj Dhaka 170
19 Sohrab Nazrul Brick Field Madhyer Char, Janjira, Konda, Keraniganj, Dhaka. Konda Keraniganj Dhaka 100
20 Mrs. National Brick Madhyer Char, Janjira, Konda, Keraniganj, Dhaka. Konda Keraniganj Dhaka 155
21 National Bricks Madhyer Char, Janjira, Konda, Keraniganj, Dhaka. Konda Keraniganj Dhaka 100
22 Mrs. Tanveer Enterprise Madhyer Char, Janjira, Konda, Keraniganj, Dhaka. Konda Keraniganj Dhaka 190
23 National Bricks Marcent (N.b.M.) Madhyer Char, Janjira, Konda, Keraniganj, Dhaka. Konda Keraniganj Dhaka 120
24 Qader Brick Field Madhyer Char, Janjira, Konda, Keraniganj, Dhaka. Konda Keraniganj Dhaka 135
25 Belayet Bricks Madhyer Char, Janjira, Konda, Keraniganj, Dhaka. Konda Keraniganj Dhaka 135
26 Nayem Bricks N.B.M. Sarail, Janjira, Konda, Keraniganj, Dhaka Konda Keraniganj Dhaka 175
27 National Bricks Sarail, Janjira, Konda, Keraniganj, Dhaka Konda Keraniganj Dhaka 160
28 National Bricks N.B.M. Sarail, Janjira, Konda, Keraniganj, Dhaka Konda Keraniganj Dhaka 190
29 Sahazal Brick Field N.B.M. Kandar Para, Katuil, Konda, Keraniganj, Dhaka Konda Keraniganj Dhaka 105
30 Mrs. New E.B.M.Co. N.B.M Kandar Para, Katuil, Konda, Keraniganj, Dhaka Konda Keraniganj Dhaka 105
31 N.B.M. Brick Kandar Para, Katuil, Konda, Keraniganj, Dhaka Konda Keraniganj Dhaka 130
32 U.N.B.M. Brick Kandar Para, Katuil, Konda, Keraniganj, Dhaka Konda Keraniganj Dhaka 110
33 Sohel Mia Brick Field (N.B.M.) Kandar Para, Katuil, Konda, Keraniganj, Dhaka Konda Keraniganj Dhaka 130
34 Mrs. Deldara Bricks Manufacture (N.B.M.) Kandar Para, Katuil, Konda, Keraniganj, Dhaka Konda Keraniganj Dhaka 110
35 Zuthi Enterprise Katuil, Konda, Keraniganj, Dhaka Konda Keraniganj Dhaka 106
36 Shaparan Bricks Katuil, Konda, Keraniganj, Dhaka Konda Keraniganj Dhaka 110
37 Momin Company Brick Field Uttar Pangaon, Konda, Keraniganj, Dhaka Konda Keraniganj Dhaka 105
38 Md. Zakir Hossain Brick Field Dakshin, Pangaon, Konda, Keraniganj, Dhaka Konda Keraniganj Dhaka 100
39 M.H. Brick Field Dakshin, Pangaon, Konda, Keraniganj, Dhaka Konda Keraniganj Dhaka 140
40 Md. Abul Kashem M.K.B. Dakshin, Pangaon, Konda, Keraniganj, Dhaka Konda Keraniganj Dhaka 110
41 Mizanur Rahman Babul Brick Field Dakshin, Pangaon, Konda, Keraniganj, Dhaka Konda Keraniganj Dhaka 250
42 Rafiq Brick Field N.B.M. Kazirgaon, Pangaon, Konda, Keraniganj, Dhaka Konda Keraniganj Dhaka 140
43 Hazi Samsar Brick Field P.B.M. Kazirgaon, Pangaon, Konda, Keraniganj, Dhaka Konda Keraniganj Dhaka 105
1
Annexure-4.2: Industries Located inside DMDP Structure Plan Indicated Main Flood Flow Zone, Sub-Flood Flow Zone and Agriculture Zones after 1997 to 2005
SI no. Name Of Establishment Location Locality Thana District Type
44 Kutubiddin Brick (N.B.M.) Kazirgaon, Pangaon, Konda, Keraniganj, Dhaka Konda Keraniganj Dhaka 180
45 A.M.M. Bricks Utrail, Konda, Keraniganj, Dhaka Konda Keraniganj Dhaka 105
46 Diamond Bricks (R.B.M.) Razhalot, Baghair, Tegharia, Keraniganj, Dhaka Tegharia Keraniganj Dhaka 250
47 Adhunik Bricks (A.B.M) Razhalot, Baghair, Tegharia, Keraniganj, Dhaka Tegharia Keraniganj Dhaka 130
48 Parzohar Manufacturing Bricks Baghair, Tegharia, Keraniganj, Dhaka Tegharia Keraniganj Dhaka 105
49 Nazrul Bricks Manufacture Baghair, Tegharia, Keraniganj, Dhaka Tegharia Keraniganj Dhaka 300
50 Alim Uddin And Rafia Bricks Baghair, Tegharia, Keraniganj, Dhaka Tegharia Keraniganj Dhaka 350
51 Alim Uddin And Rafia Bricks Baghair, Tegharia, Keraniganj, Dhaka Tegharia Keraniganj Dhaka 150
52 Nisha Bricks Baghair, Tegharia, Keraniganj, Dhaka Tegharia Keraniganj Dhaka 155
53 Baghair Brick Century Baghair, Tegharia, Keraniganj, Dhaka Tegharia Keraniganj Dhaka 212
54 Three Brothers Brick Field Razandapur, Baghair, Tegharia, Keraniganj, Dhaka Tegharia Keraniganj Dhaka 200
55 Proma Green Syndicate Pvt. Ltd. Reshi Para, Jamur Muchipara, tetuljhora, Savar, Dhaka. Tetuljhora Savar Dhaka 180
56 Padma Cane Ciose Up Ltd. Reshi Para, Jamur Muchipara, tetuljhora, Savar, Dhaka. Tetuljhora Savar Dhaka 400
57 Navana, Furniture & automobile Rajfulbari, Rajfulbari, Tetuljhora, Savar, Dhaka. Tetuljhora Savar Dhaka 300
58 Jalal, Furniture Co. Ltd. Jiraba, Yearpur, Savar, Dhaka, Yearpur Savar Dhaka 100
59 Sarang Dock Yard Doleshwar, Konda, Keraniganj, Dhaka. Konda Keraniganj Dhaka 108
60 Al-Faruk Cap Products Pvt. Ltd Razandapur, Baghair, Tegharia, Keraniganj, Dhaka Tegharia Keraniganj Dhaka 250
61 Konda Brick Century N.B.M. Bir Baghair, Konda, Keraniganj, Dhaka Konda Keraniganj Dhaka 130
62 Mrs. New N.B.m. Bricks Bir Baghair, Konda, Keraniganj, Dhaka Konda Keraniganj Dhaka 200
63 Hazi Jalil & Jahangir Alam Brick N.B.M. Bir Baghair, Konda, Keraniganj, Dhaka Konda Keraniganj Dhaka 100
64 Khandakar Brick Field Brahmagaon, Konda, Keraniganj, Dhaka Konda Keraniganj Dhaka 150
65 Mrs. Nirman Brick Chandra Madhab, Konda, Keraniganj, Dhaka Konda Keraniganj Dhaka 150
66 J.B.M. Brick And Company Chandra Madhab, Konda, Keraniganj, Dhaka Konda Keraniganj Dhaka 155
67 National Brick Making Chandra Madhab, Konda, Keraniganj, Dhaka Konda Keraniganj Dhaka 170
68 new Brick N.B.M. Natun Baktar Char, Char Bakta, Konda, Keraniganj, Dhaka Konda Keraniganj Dhaka 130
69 Nabab Brick Musium N.B.M. Natun Baktar Char, Char Bakta, Konda, Keraniganj, Dhaka Konda Keraniganj Dhaka 150
70 Tanveer & Sohel Bricks N.B.M. Char Shreedhardi, Konda, Keraniganj, Dhaka Konda Keraniganj Dhaka 220
71 Mrs. Sabbir Enterprise S.B.M Char Shreedhardi, Konda, Keraniganj, Dhaka Konda Keraniganj Dhaka 135
72 P.B.M Bricks Char Shreedhardi, Konda, Keraniganj, Dhaka Konda Keraniganj Dhaka 150
73 East Bengal Brick Field Dananagar, Shreedhardi, Konda, Keraniganj, Dhaka Konda Keraniganj Dhaka 155
74 Munshi Enterprise Dananagar, Shreedhardi, Konda, Keraniganj, Dhaka Konda Keraniganj Dhaka 100
75 Shahidullah Brick Field Dananagar, Shreedhardi, Konda, Keraniganj, Dhaka Konda Keraniganj Dhaka 110
76 National Bricks Dananagar, Shreedhardi, Konda, Keraniganj, Dhaka Konda Keraniganj Dhaka 170
77 Abdul Kadir Bricks Field Dhalpur, Konda, Keraniganj, Dhaka Konda Keraniganj Dhaka 110
78 M.M.E. Enterprise Doleshwar, Konda, Keraniganj, Dhaka. Konda Keraniganj Dhaka 170
79 Hazi Sirazul Islam Bricks Doleshwar, Konda, Keraniganj, Dhaka. Konda Keraniganj Dhaka 115
80 N.B.M. Bricks Doleshwar, Konda, Keraniganj, Dhaka. Konda Keraniganj Dhaka 110
81 Hossain brick Field Hazaribagh, Konda, Keraniganj, Dhaka Konda Keraniganj Dhaka 115
82 Hazi Jalal Uddin Brick Field Hazaribagh, Konda, Keraniganj, Dhaka Konda Keraniganj Dhaka 115
83 Kashem 6th Floor, Mosiur Alam Market, Zinjira (part), Aganagar, Keraniganj, Dhaka Zinjira (part) Keraniganj Dhaka 175
84 River Side Sweaters Ltd. Hasnabad, Shubhadaya, Keraniganj, Dhaka Shubhadaya Keraniganj Dhaka 800
85 Scandex (BD) Ltd 87, Veron, Jamgora, Diakhali, Yearpur, Savar, Dhaka Yearpur Savar Dhaka 1200
86 N. Boy Complex Jamgora, Diakhali, Yearpur, Savar, Dhaka Yearpur Savar Dhaka 5500
2
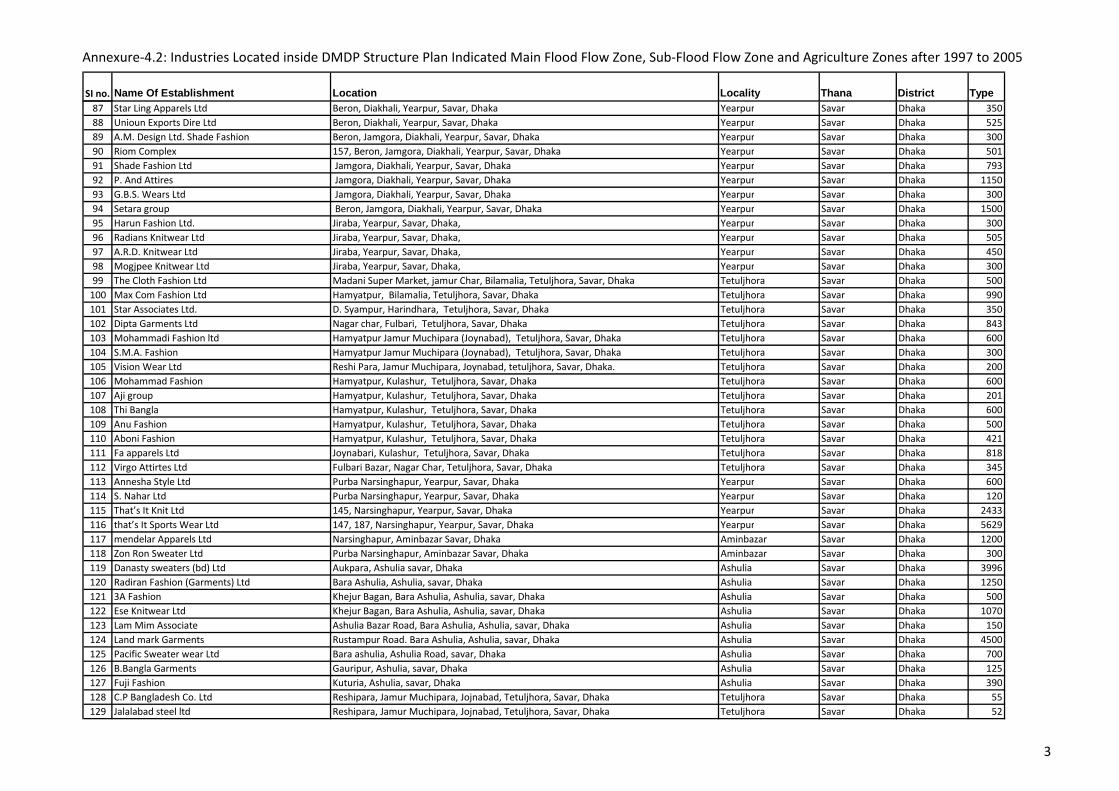
Annexure-4.2: Industries Located inside DMDP Structure Plan Indicated Main Flood Flow Zone, Sub-Flood Flow Zone and Agriculture Zones after 1997 to 2005
SI no. Name Of Establishment Location Locality Thana District Type
87 Star Ling Apparels Ltd Beron, Diakhali, Yearpur, Savar, Dhaka Yearpur Savar Dhaka 350
88 Unioun Exports Dire Ltd Beron, Diakhali, Yearpur, Savar, Dhaka Yearpur Savar Dhaka 525
89 A.M. Design Ltd. Shade Fashion Beron, Jamgora, Diakhali, Yearpur, Savar, Dhaka Yearpur Savar Dhaka 300
90 Riom Complex 157, Beron, Jamgora, Diakhali, Yearpur, Savar, Dhaka Yearpur Savar Dhaka 501
91 Shade Fashion Ltd Jamgora, Diakhali, Yearpur, Savar, Dhaka Yearpur Savar Dhaka 793
92 P. And Attires Jamgora, Diakhali, Yearpur, Savar, Dhaka Yearpur Savar Dhaka 1150
93 G.B.S. Wears Ltd Jamgora, Diakhali, Yearpur, Savar, Dhaka Yearpur Savar Dhaka 300
94 Setara group Beron, Jamgora, Diakhali, Yearpur, Savar, Dhaka Yearpur Savar Dhaka 1500
95 Harun Fashion Ltd. Jiraba, Yearpur, Savar, Dhaka, Yearpur Savar Dhaka 300
96 Radians Knitwear Ltd Jiraba, Yearpur, Savar, Dhaka, Yearpur Savar Dhaka 505
97 A.R.D. Knitwear Ltd Jiraba, Yearpur, Savar, Dhaka, Yearpur Savar Dhaka 450
98 Mogjpee Knitwear Ltd Jiraba, Yearpur, Savar, Dhaka, Yearpur Savar Dhaka 300
99 The Cloth Fashion Ltd Madani Super Market, jamur Char, Bilamalia, Tetuljhora, Savar, Dhaka Tetuljhora Savar Dhaka 500
100 Max Com Fashion Ltd Hamyatpur, Bilamalia, Tetuljhora, Savar, Dhaka Tetuljhora Savar Dhaka 990
101 Star Associates Ltd. D. Syampur, Harindhara, Tetuljhora, Savar, Dhaka Tetuljhora Savar Dhaka 350
102 Dipta Garments Ltd Nagar char, Fulbari, Tetuljhora, Savar, Dhaka Tetuljhora Savar Dhaka 843
103 Mohammadi Fashion ltd Hamyatpur Jamur Muchipara (Joynabad), Tetuljhora, Savar, Dhaka Tetuljhora Savar Dhaka 600
104 S.M.A. Fashion Hamyatpur Jamur Muchipara (Joynabad), Tetuljhora, Savar, Dhaka Tetuljhora Savar Dhaka 300
105 Vision Wear Ltd Reshi Para, Jamur Muchipara, Joynabad, tetuljhora, Savar, Dhaka. Tetuljhora Savar Dhaka 200
106 Mohammad Fashion Hamyatpur, Kulashur, Tetuljhora, Savar, Dhaka Tetuljhora Savar Dhaka 600
107 Aji group Hamyatpur, Kulashur, Tetuljhora, Savar, Dhaka Tetuljhora Savar Dhaka 201
108 Thi Bangla Hamyatpur, Kulashur, Tetuljhora, Savar, Dhaka Tetuljhora Savar Dhaka 600
109 Anu Fashion Hamyatpur, Kulashur, Tetuljhora, Savar, Dhaka Tetuljhora Savar Dhaka 500
110 Aboni Fashion Hamyatpur, Kulashur, Tetuljhora, Savar, Dhaka Tetuljhora Savar Dhaka 421
111 Fa apparels Ltd Joynabari, Kulashur, Tetuljhora, Savar, Dhaka Tetuljhora Savar Dhaka 818
112 Virgo Attirtes Ltd Fulbari Bazar, Nagar Char, Tetuljhora, Savar, Dhaka Tetuljhora Savar Dhaka 345
113 Annesha Style Ltd Purba Narsinghapur, Yearpur, Savar, Dhaka Yearpur Savar Dhaka 600
114 S. Nahar Ltd Purba Narsinghapur, Yearpur, Savar, Dhaka Yearpur Savar Dhaka 120
115 That’s It Knit Ltd 145, Narsinghapur, Yearpur, Savar, Dhaka Yearpur Savar Dhaka 2433
116 that’s It Sports Wear Ltd 147, 187, Narsinghapur, Yearpur, Savar, Dhaka Yearpur Savar Dhaka 5629
117 mendelar Apparels Ltd Narsinghapur, Aminbazar Savar, Dhaka Aminbazar Savar Dhaka 1200
118 Zon Ron Sweater Ltd Purba Narsinghapur, Aminbazar Savar, Dhaka Aminbazar Savar Dhaka 300
119 Danasty sweaters (bd) Ltd Aukpara, Ashulia savar, Dhaka Ashulia Savar Dhaka 3996
120 Radiran Fashion (Garments) Ltd Bara Ashulia, Ashulia, savar, Dhaka Ashulia Savar Dhaka 1250
121 3A Fashion Khejur Bagan, Bara Ashulia, Ashulia, savar, Dhaka Ashulia Savar Dhaka 500
122 Ese Knitwear Ltd Khejur Bagan, Bara Ashulia, Ashulia, savar, Dhaka Ashulia Savar Dhaka 1070
123 Lam Mim Associate Ashulia Bazar Road, Bara Ashulia, Ashulia, savar, Dhaka Ashulia Savar Dhaka 150
124 Land mark Garments Rustampur Road. Bara Ashulia, Ashulia, savar, Dhaka Ashulia Savar Dhaka 4500
125 Pacific Sweater wear Ltd Bara ashulia, Ashulia Road, savar, Dhaka Ashulia Savar Dhaka 700
126 B.Bangla Garments Gauripur, Ashulia, savar, Dhaka Ashulia Savar Dhaka 125
127 Fuji Fashion Kuturia, Ashulia, savar, Dhaka Ashulia Savar Dhaka 390
128 C.P Bangladesh Co. Ltd Reshipara, Jamur Muchipara, Jojnabad, Tetuljhora, Savar, Dhaka Tetuljhora Savar Dhaka 55
129 Jalalabad steel ltd Reshipara, Jamur Muchipara, Jojnabad, Tetuljhora, Savar, Dhaka Tetuljhora Savar Dhaka 52
3
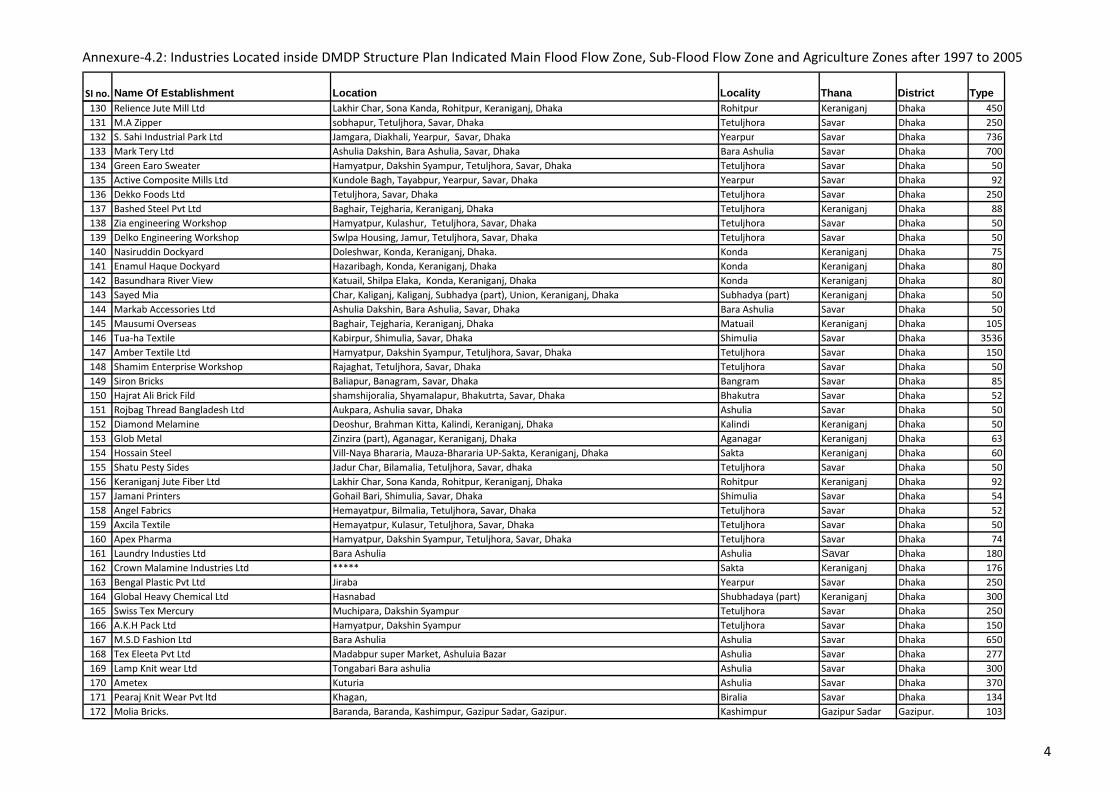
Annexure-4.2: Industries Located inside DMDP Structure Plan Indicated Main Flood Flow Zone, Sub-Flood Flow Zone and Agriculture Zones after 1997 to 2005
SI no. Name Of Establishment Location Locality Thana District Type
130 Relience Jute Mill Ltd Lakhir Char, Sona Kanda, Rohitpur, Keraniganj, Dhaka Rohitpur Keraniganj Dhaka 450
131 M.A Zipper sobhapur, Tetuljhora, Savar, Dhaka Tetuljhora Savar Dhaka 250
132 S. Sahi Industrial Park Ltd Jamgara, Diakhali, Yearpur, Savar, Dhaka Yearpur Savar Dhaka 736
133 Mark Tery Ltd Ashulia Dakshin, Bara Ashulia, Savar, Dhaka Bara Ashulia Savar Dhaka 700
134 Green Earo Sweater Hamyatpur, Dakshin Syampur, Tetuljhora, Savar, Dhaka Tetuljhora Savar Dhaka 50
135 Active Composite Mills Ltd Kundole Bagh, Tayabpur, Yearpur, Savar, Dhaka Yearpur Savar Dhaka 92
136 Dekko Foods Ltd Tetuljhora, Savar, Dhaka Tetuljhora Savar Dhaka 250
137 Bashed Steel Pvt Ltd Baghair, Tejgharia, Keraniganj, Dhaka Tetuljhora Keraniganj Dhaka 88
138 Zia engineering Workshop Hamyatpur, Kulashur, Tetuljhora, Savar, Dhaka Tetuljhora Savar Dhaka 50
139 Delko Engineering Workshop Swlpa Housing, Jamur, Tetuljhora, Savar, Dhaka Tetuljhora Savar Dhaka 50
140 Nasiruddin Dockyard Doleshwar, Konda, Keraniganj, Dhaka. Konda Keraniganj Dhaka 75
141 Enamul Haque Dockyard Hazaribagh, Konda, Keraniganj, Dhaka Konda Keraniganj Dhaka 80
142 Basundhara River View Katuail, Shilpa Elaka, Konda, Keraniganj, Dhaka Konda Keraniganj Dhaka 80
143 Sayed Mia Char, Kaliganj, Kaliganj, Subhadya (part), Union, Keraniganj, Dhaka Subhadya (part) Keraniganj Dhaka 50
144 Markab Accessories Ltd Ashulia Dakshin, Bara Ashulia, Savar, Dhaka Bara Ashulia Savar Dhaka 50
145 Mausumi Overseas Baghair, Tejgharia, Keraniganj, Dhaka Matuail Keraniganj Dhaka 105
146 Tua-ha Textile Kabirpur, Shimulia, Savar, Dhaka Shimulia Savar Dhaka 3536
147 Amber Textile Ltd Hamyatpur, Dakshin Syampur, Tetuljhora, Savar, Dhaka Tetuljhora Savar Dhaka 150
148 Shamim Enterprise Workshop Rajaghat, Tetuljhora, Savar, Dhaka Tetuljhora Savar Dhaka 50
149 Siron Bricks Baliapur, Banagram, Savar, Dhaka Bangram Savar Dhaka 85
150 Hajrat Ali Brick Fild shamshijoralia, Shyamalapur, Bhakutrta, Savar, Dhaka Bhakutra Savar Dhaka 52
151 Rojbag Thread Bangladesh Ltd Aukpara, Ashulia savar, Dhaka Ashulia Savar Dhaka 50
152 Diamond Melamine Deoshur, Brahman Kitta, Kalindi, Keraniganj, Dhaka Kalindi Keraniganj Dhaka 50
153 Glob Metal Zinzira (part), Aganagar, Keraniganj, Dhaka Aganagar Keraniganj Dhaka 63
154 Hossain Steel Vill-Naya Bhararia, Mauza-Bhararia UP-Sakta, Keraniganj, Dhaka Sakta Keraniganj Dhaka 60
155 Shatu Pesty Sides Jadur Char, Bilamalia, Tetuljhora, Savar, dhaka Tetuljhora Savar Dhaka 50
156 Keraniganj Jute Fiber Ltd Lakhir Char, Sona Kanda, Rohitpur, Keraniganj, Dhaka Rohitpur Keraniganj Dhaka 92
157 Jamani Printers Gohail Bari, Shimulia, Savar, Dhaka Shimulia Savar Dhaka 54
158 Angel Fabrics Hemayatpur, Bilmalia, Tetuljhora, Savar, Dhaka Tetuljhora Savar Dhaka 52
159 Axcila Textile Hemayatpur, Kulasur, Tetuljhora, Savar, Dhaka Tetuljhora Savar Dhaka 50
160 Apex Pharma Hamyatpur, Dakshin Syampur, Tetuljhora, Savar, Dhaka Tetuljhora Savar Dhaka 74
161 Laundry Industies Ltd Bara Ashulia Ashulia Savar Dhaka 180
162 Crown Malamine Industries Ltd ***** Sakta Keraniganj Dhaka 176
163 Bengal Plastic Pvt Ltd Jiraba Yearpur Savar Dhaka 250
164 Global Heavy Chemical Ltd Hasnabad Shubhadaya (part) Keraniganj Dhaka 300
165 Swiss Tex Mercury Muchipara, Dakshin Syampur Tetuljhora Savar Dhaka 250
166 A.K.H Pack Ltd Hamyatpur, Dakshin Syampur Tetuljhora Savar Dhaka 150
167 M.S.D Fashion Ltd Bara Ashulia Ashulia Savar Dhaka 650
168 Tex Eleeta Pvt Ltd Madabpur super Market, Ashuluia Bazar Ashulia Savar Dhaka 277
169 Lamp Knit wear Ltd Tongabari Bara ashulia Ashulia Savar Dhaka 300
170 Ametex Kuturia Ashulia Savar Dhaka 370
171 Pearaj Knit Wear Pvt ltd Khagan, Biralia Savar Dhaka 134
172 Molia Bricks. Baranda, Baranda, Kashimpur, Gazipur Sadar, Gazipur. Kashimpur Gazipur Sadar Gazipur. 103
4

Annexure-4.2: Industries Located inside DMDP Structure Plan Indicated Main Flood Flow Zone, Sub-Flood Flow Zone and Agriculture Zones after 1997 to 2005
SI no. Name Of Establishment Location Locality Thana District Type
173 Hyes And Hair Tak Nagrapara, Tak Nagrapara, Basan Union, Gazipur Sadar, Gazipur Basan Union Gazipur Sadar Gazipur. 107
174 Antick Furniture Harbaid, Pubali, Gazipur Sadar, Gazipur Pubali Gazipur Sadar Gazipur. 101
175 Megatex Tetobari, Chhota Gonindapur, Kashimpur, Gazipur Sadar, Gazipur. Kashimpur Gazipur Sadar Gazipur. 101
176 dune garments Ltd. Nowzor, Naojuri,Basan Union, Gazipur Sadar, Gazipur. Basan Union Gazipur Sadar Gazipur. 350
177 Dana Garment Nowzor, Naojuri,Basan Union, Gazipur Sadar, Gazipur. Basan Union Gazipur Sadar Gazipur. 420
178 MK. Sweater Ltd Chandana, chandana (part), Basan Union, Gazipur Sadar, Gazipur Basan Union Gazipur Sadar Gazipur. 390
179 Masihata Sweater Dakshin, Panshail, Dakshin, Panshail, Kashimpur, Gazipur Sadar, Gazipur. Kashimpur Gazipur Sadar Gazipur. 800
180 Sumis Sweater Saraba, Kashimpur, Gazipur Sadar, Gazipur Kashimpur Gazipur Sadar Gazipur. 450
181 Pan Pacific Sweater Bawpara, Dakshin, Salna, Kayaltia, Gazipur Sadar, Gazipur Kayaltia Gazipur Sadar Gazipur. 270
182 Recent Sweater Ltd Bawpara, Dakshin, Salna, Kayaltia, Gazipur Sadar, Gazipur Kayaltia Gazipur Sadar Gazipur. 1575
183 Maimun Textile kashimpur Nayapara, Kashimpur, Gazipur Sadar, Gazipur. Kashimpur Gazipur Sadar Gazipur. 85
184 Madina Shoe Indus. Ltd Bahadurpur, Kayaltia, Gazipur Sadar, Gazipur Kayaltia Gazipur Sadar Gazipur. 92
185 Myzas Spinning Sarda Ganj, Gonindapur, Kashimpur, Gazipur Sadar, Gazipur. Kashimpur Gazipur Sadar Gazipur. 300
186 Slusem Bangladesh Ltd Bahadurpur, Kayaltia, Gazipur Sadar, Gazipur Kayaltia Gazipur Sadar Gazipur. 80
187 Abuplastic Ind Bawpara, Dakshin, Salna, Kayaltia, Gazipur Sadar, Gazipur Kayaltia Gazipur Sadar Gazipur. 80
188 Kajal woolen Mills Ltd Bahadurpur, Kayaltia, Gazipur Sadar, Gazipur Kayaltia Gazipur Sadar Gazipur. 70
189 Aristo Pharma Ltd Gazaria, Para, Ara-Isa Prasad, Kayaltia, Gazipur Sadar, Gazipur Kayaltia Gazipur Sadar Gazipur. 70
190 Rose Bangladesh Chamical Ltd Ara-Isa Prasad, Ara-Isa Prasad, Kayaltia, Gazipur Sadar, Gazipur Kayaltia Gazipur Sadar Gazipur. 65
191 M.S. Banks Medicine Ltd Gazaria, Para, Ara-Isa Prasad, Kayaltia, Gazipur Sadar, Gazipur Kayaltia Gazipur Sadar Gazipur. 62
192 Bangladesh Paper Manufacturing Bahadurpur, , Kayaltia Gazipur Sadar Gazipur 60
193 M.S Cresent Camical Ltd Karamtila Pubail Gazipur Sadar Gazipur 120
194 Unique Cement Industries Ltd. Meghna Industries, Meghna Ghat, Noagaon, Sonargaon, Narayanganj Noagaon Sonargaon Narayanganj 450
195 Mir Cement Ganaganagar, Rupganj, Brahmanagar, Murapara, Rupganj, Narayanganj. Murapara Rupganj Narayanganj 112
196 Harvest Rice Bulta, Bulta, Rupganj, Narayanganj. Bulta Rupganj Narayanganj 117
197 Global Spinning Dyeing Ltd Baniadi, Murapara, Rupganj, Narayanganj. Mura Para Rupganj Narayanganj 122
198 City Sugar Mills Ltd Rupganj, Narayanganj Rupganj Rupganj Narayanganj 650
199 N.K.T Ssve Paper Co. Ltd Darikandi, Brahmangaon Mura para Rupganj Narayanganj 74
5
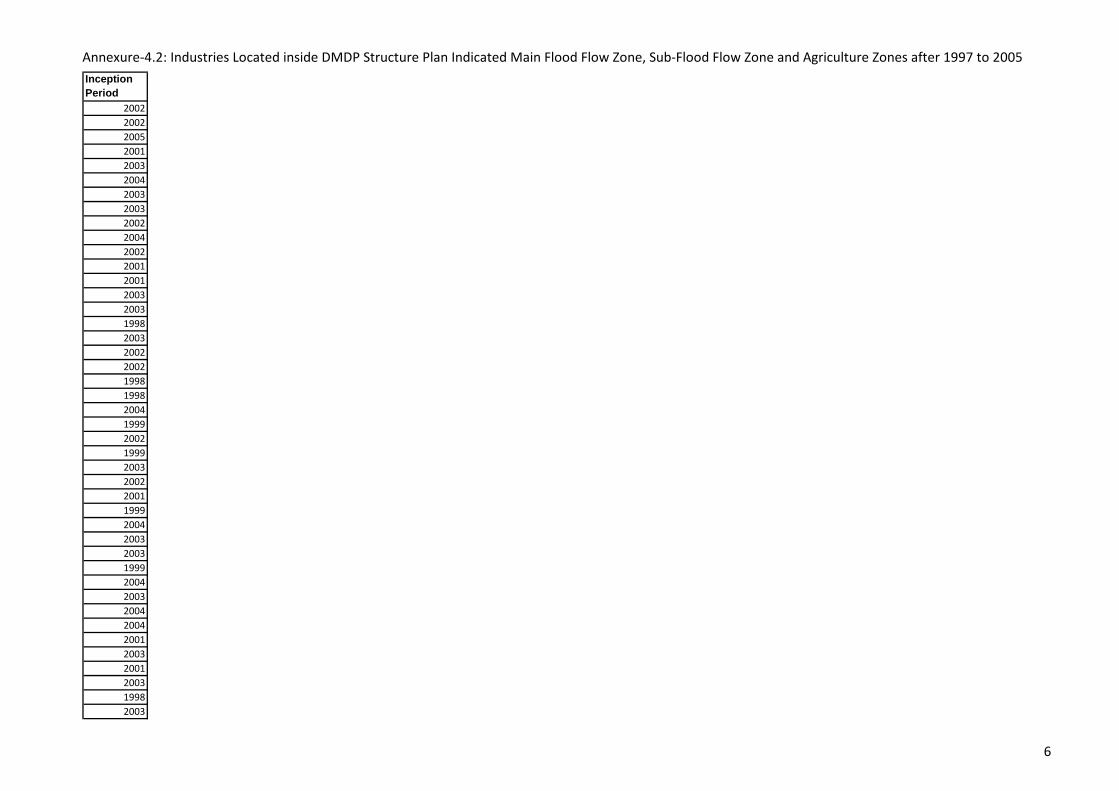
Annexure-4.2: Industries Located inside DMDP Structure Plan Indicated Main Flood Flow Zone, Sub-Flood Flow Zone and Agriculture Zones after 1997 to 2005
Inception
Period
2002
2002
2005
2001
2003
2004
2003
2003
2002
2004
2002
2001
2001
2003
2003
1998
2003
2002
2002
1998
1998
2004
1999
2002
1999
2003
2002
2001
1999
2004
2003
2003
1999
2004
2003
2004
2004
2001
2003
2001
2003
1998
2003
6

Annexure-4.2: Industries Located inside DMDP Structure Plan Indicated Main Flood Flow Zone, Sub-Flood Flow Zone and Agriculture Zones after 1997 to 2005
Inception
Period
2003
2001
2004
2004
2005
2003
2003
2000
2004
2003
2002
2000
1998
2001
2002
2005
2002
2003
2005
2004
2000
2003
2003
2003
2004
2005
2002
2001
2003
1999
1999
1999
2003
2005
2003
2004
2004
1998
2002
2002
2002
2002
2004
7

Annexure-4.2: Industries Located inside DMDP Structure Plan Indicated Main Flood Flow Zone, Sub-Flood Flow Zone and Agriculture Zones after 1997 to 2005
Inception
Period
2000
2003
2002
2001
2002
2004
2003
2004
2001
2002
2001
2004
2004
2003
2003
2004
2000
2003
2003
2000
2002
1998
2002
2002
2004
2004
2003
2005
2002
2001
2005
2002
2004
2000
2004
2004
2004
2004
2004
1999
2001
2005
2003
8
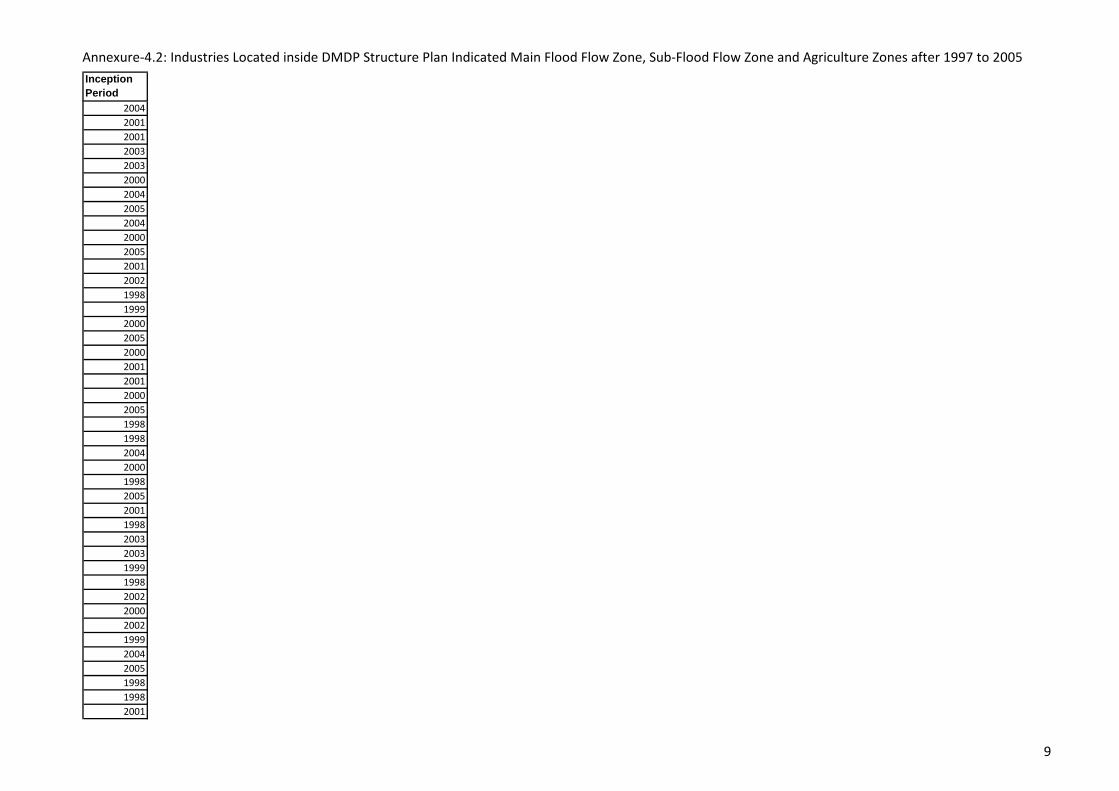
Annexure-4.2: Industries Located inside DMDP Structure Plan Indicated Main Flood Flow Zone, Sub-Flood Flow Zone and Agriculture Zones after 1997 to 2005
Inception
Period
2004
2001
2001
2003
2003
2000
2004
2005
2004
2000
2005
2001
2002
1998
1999
2000
2005
2000
2001
2001
2000
2005
1998
1998
2004
2000
1998
2005
2001
1998
2003
2003
1999
1998
2002
2000
2002
1999
2004
2005
1998
1998
2001
9

Annexure-4.2: Industries Located inside DMDP Structure Plan Indicated Main Flood Flow Zone, Sub-Flood Flow Zone and Agriculture Zones after 1997 to 2005
Inception
Period
2000
2004
1999
2004
2004
2004
1998
2004
2000
2002
2003
2001
1998
2000
1998
2002
2000
1998
2000
2002
2005
2005
2003
2003
2005
2005
2004
10
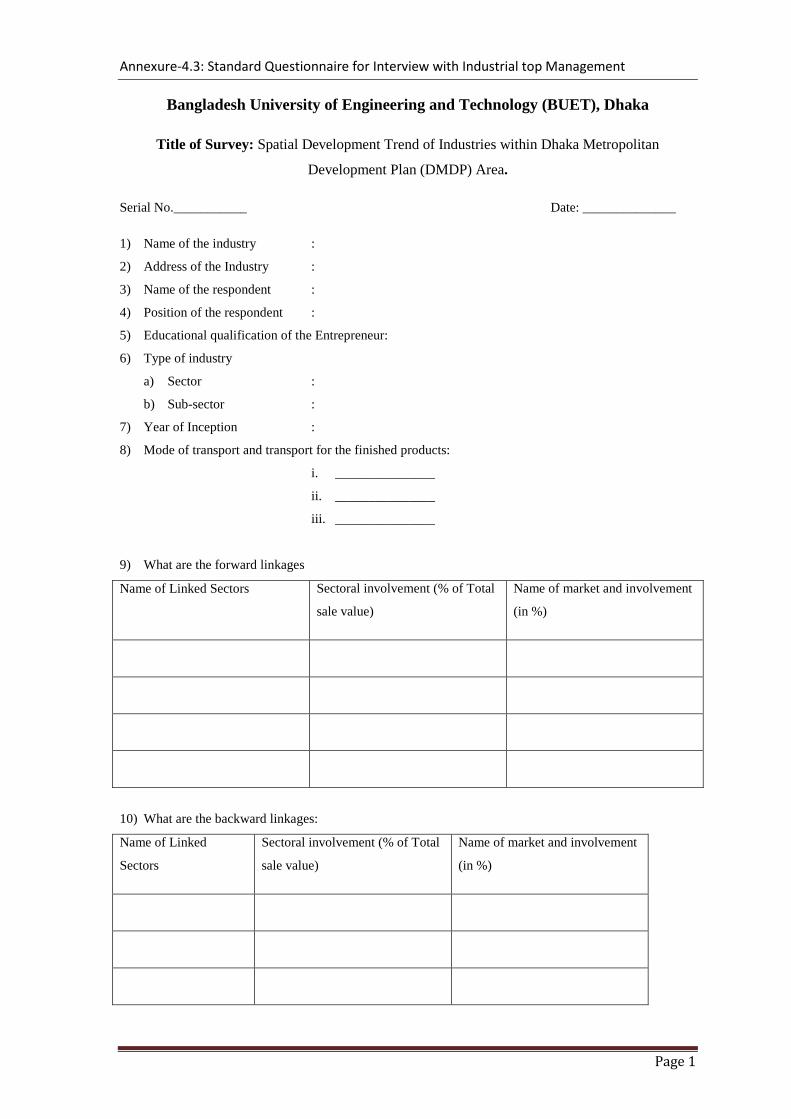
Annexure-4.3: Standard Questionnaire for Interview with Industrial top Management
Page 1
Bangladesh University of Engineering and Technology (BUET), Dhaka
Title of Survey: Spatial Development Trend of Industries within Dhaka Metropolitan
Development Plan (DMDP) Area.
Serial No.___________ Date: ______________
1) Name of the industry :
2) Address of the Industry :
3) Name of the respondent :
4) Position of the respondent :
5) Educational qualification of the Entrepreneur:
6) Type of industry
a) Sector :
b) Sub-sector :
7) Year of Inception :
8) Mode of transport and transport for the finished products:
i. _______________
ii. _______________
iii. _______________
9) What are the forward linkages
Name of Linked Sectors Sectoral involvement (% of Total
sale value)
Name of market and involvement
(in %)
10) What are the backward linkages:
Name of Linked
Sectors
Sectoral involvement (% of Total
sale value)
Name of market and involvement
(in %)

Annexure-4.3: Standard Questionnaire for Interview with Industrial top Management
Page 2
11) Other items of information:
a) Who Played key role in selecting the location:______________________________
b) Are you aware of Dhaka Metropolitan Development Plan (DMDP)?
i) Yes ii) No
c) Do you know there were areas for Industrial Development in the DMDP?
i) Yes ii) No
d) Why did you choose another location rather than the indicative locations by DMDP?
____________________________________________________________________
e) Please compare your present location with that of the DMDP location according to the following
criteria.
Criteria DMDP (Score from 0-10) Present Location (Score from 0-10)
Land Value
Transport
Utility
Security
Waste disposal
Grand Total
f) Are you aware of Environmental Laws? ___________________________________
g) Which year this land was bought? ________________________________________
h) Where do the labors reside in? ___________________________________________
i) Where does the Top Management of the Company reside in? ___________________
j) What type of waste generates from this industry? _____________________________
k) Whether waste water is generated or not? {If Yes Please go to (l)}
(a) Yes (b) No
l) Is there any Effluent Treatment Plan (ETP) for the Industry? ____________________________
m) Where do you dispose the waste water? _____________________________________________
n) Please tell about the Certificate renewal process of DoE?________________________________

Annexure-4.3: Standard Questionnaire for Interview with Industrial top Management
Page 3
12) Please Number (1-20) the factors according to their priority which were taken into account while
selecting the location of this industry:
priority a) Skilled labor priority b) Unskilled labor
priority c) Nearness to highway priority d) Nearness to railway
priority e) Nearness to airway priority f) Nearness to river transport
priority g) Access to market priority h) Local agency cooperation
priority i) Electricity supply priority j) Law and order situation
priority k) Gas supply priority l) Water supply
priority m) Availability of drainage
outfall
priority n) Availability of Drainage Outlet
priority o) Industrial agglomeration priority p) Land value/rent
priority q) Raw material carrying
cost
priority r) Finished product carrying cost.
priority s) Nearness to linked
industries
priority t) Social facilities
priority u) Nearness to the city
center
priority v) Fiscal incentives (Tax holidays, loan
incentives etc.)
priority w) Any other factors
influencing the choice of
this location
priority x)
13) What are the incentives you shall be looking for to shift you industries outside Dhaka Metropolitan
Area?
________________________________________________________________________________
________________________________________________________________________________
________________________________________________________________________________
________________________________________________________________________________

Annexure-4.4: Comparison between DMDP Proposed Location and Present Industrial location
SI No.
Land Value at
DMDP Proposed
Location
Present
Land Value
Transportation at
DMDP Proposded
Location
Present
Transportation
Utility at DMDP
Proposded
Location
Present
Utility
DMDP
Proposded
Location
Present
Security
Waste Disposal facility
at DMDP Proposded
Location
Present
Waste
Disposal
DMDP
Total
Existing
Total
1 8 6 7 5 6 4 5 5 6 3 32 23
2 9 6 10 5 9 5 9 8 8 6 45 30
3 10 8 9 7 9 8 8 7 9 6 45 36
4 5 7 4 8 7 8 7 9 8 8 33 40
5 8 6 10 10 9 8 9 6 8 6 46 36
6 7 8 9 5 7 5 9 6 10 6 42 30
7 10 8 9 9 8 6 9 7 8 5 44 35
8 10 7 8 7 9 6 9 7 8 5 44 32
9 10 8 8 8 9 7 8 7 8 5 43 35
10 8 6 9 7 8 6 9 7 8 5 42 31
11 9 7 8 8 10 7 9 8 8 6 44 36
12 9 6 8 7 9 6 10 8 8 5 44 32
13 9 6 10 5 8 7 9 8 9 9 45 35
14 9 7 8 7 9 8 8 7 7 3 41 32
15 9 7 10 8 9 7 8 6 7 6 43 34
16 10 8 8 7 8 8 9 7 10 8 45 38
17 10 8 8 6 9 7 8 5 9 8 44 32
18 4 6 6 8 6 8 4 6 4 4 24 32
19 5 8 6 6 4 6 6 8 6 4 27 32
20 8 4 8 7 8 5 8 8 8 6 40 30
21 8 6 8 8 9 5 8 5 8 6 41 30
22 9 5 6 10 7 6 7 5 8 5 37 36
23 10 6 7 8 6 5 7 5 8 5 38 29
24 8 7 9 7 6 5 5 5 8 5 36 29
25 8 7 7 7 8 5 9 6 8 5 40 30
26 8 6 7 7 8 6 9 6 8 5 40 30
27 9 6 8 6 8 6 9 8 8 6 42 32
28 10 7 8 7 8 8 9 8 7 6 42 36
29 10 7 8 6 9 6 8 7 8 6 43 32
30 9 7 10 6 8 7 9 8 7 7 43 35
31 5 8 4 8 6 7 6 8 4 4 25 35
32 4 7 6 7 5 5 6 6 5 4 26 29
Page 1 Annexure-4.4
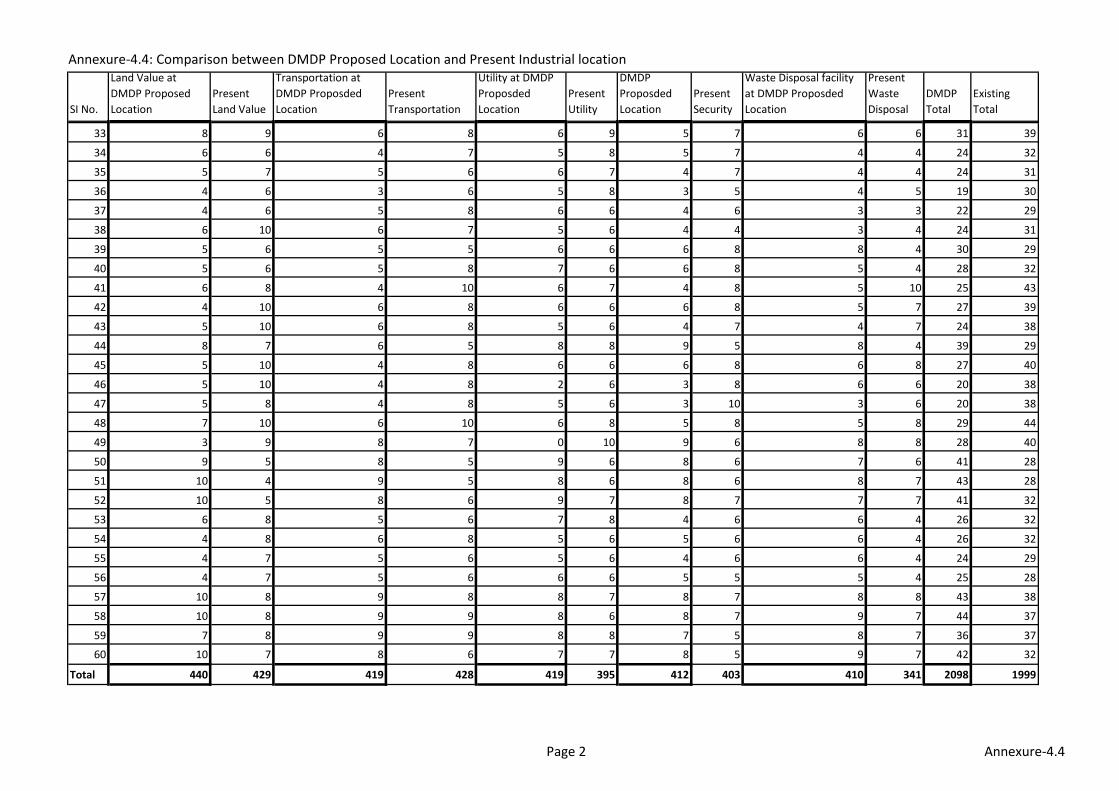
Annexure-4.4: Comparison between DMDP Proposed Location and Present Industrial location
SI No.
Land Value at
DMDP Proposed
Location
Present
Land Value
Transportation at
DMDP Proposded
Location
Present
Transportation
Utility at DMDP
Proposded
Location
Present
Utility
DMDP
Proposded
Location
Present
Security
Waste Disposal facility
at DMDP Proposded
Location
Present
Waste
Disposal
DMDP
Total
Existing
Total
33 8 9 6 8 6 9 5 7 6 6 31 39
34 6 6 4 7 5 8 5 7 4 4 24 32
35 5 7 5 6 6 7 4 7 4 4 24 31
36 4 6 3 6 5 8 3 5 4 5 19 30
37 4 6 5 8 6 6 4 6 3 3 22 29
38 6 10 6 7 5 6 4 4 3 4 24 31
39 5 6 5 5 6 6 6 8 8 4 30 29
40 5 6 5 8 7 6 6 8 5 4 28 32
41 6 8 4 10 6 7 4 8 5 10 25 43
42 4 10 6 8 6 6 6 8 5 7 27 39
43 5 10 6 8 5 6 4 7 4 7 24 38
44 8 7 6 5 8 8 9 5 8 4 39 29
45 5 10 4 8 6 6 6 8 6 8 27 40
46 5 10 4 8 2 6 3 8 6 6 20 38
47 5 8 4 8 5 6 3 10 3 6 20 38
48 7 10 6 10 6 8 5 8 5 8 29 44
49 3 9 8 7 0 10 9 6 8 8 28 40
50 9 5 8 5 9 6 8 6 7 6 41 28
51 10 4 9 5 8 6 8 6 8 7 43 28
52 10 5 8 6 9 7 8 7 7 7 41 32
53 6 8 5 6 7 8 4 6 6 4 26 32
54 4 8 6 8 5 6 5 6 6 4 26 32
55 4 7 5 6 5 6 4 6 6 4 24 29
56 4 7 5 6 6 6 5 5 5 4 25 28
57 10 8 9 8 8 7 8 7 8 8 43 38
58 10 8 9 9 8 6 8 7 9 7 44 37
59 7 8 9 9 8 8 7 5 8 7 36 37
60 10 7 8 6 7 7 8 5 9 7 42 32
Total 440 429 419 428 419 395 412 403 410 341 2098 1999
Page 2 Annexure-4.4

Annexure- 4.5: Frequency distribution of priorities ascertained by the intervieweeFactors Priority Weightage Factors Priority WeightageSkilled Labor 1.00 10.00 Unskilled Labor 10.00 5.50
Skilled Labor 1.00 10.00 Unskilled Labor 12.00 4.50
Skilled Labor 1.00 10.00 Unskilled Labor 13.00 4.00
Skilled Labor 1.00 10.00 Unskilled Labor 13.00 4.00
Skilled Labor 1.00 10.00 Unskilled Labor 14.00 3.50
Skilled Labor 1.00 10.00 Unskilled Labor 15.00 3.00
Skilled Labor 1.00 10.00 Unskilled Labor 16.00 2.50
Skilled Labor 1.00 10.00 Unskilled Labor 17.00 2.00
Skilled Labor 1.00 10.00 Unskilled Labor 17.00 2.00
Skilled Labor 1.00 10.00 Unskilled Labor 18.00 1.50
Skilled Labor 1.00 10.00 Unskilled Labor 18.00 1.50
Skilled Labor 2.00 9.50 Unskilled Labor 18.00 1.50
Skilled Labor 2.00 9.50 Unskilled Labor 19.00 1.00
Skilled Labor 2.00 9.50 Unskilled Labor 19.00 1.00
Skilled Labor 2.00 9.50 Unskilled Labor 19.00 1.00
Skilled Labor 2.00 9.50 Unskilled Labor 2.00 9.50
Skilled Labor 2.00 9.50 Unskilled Labor 2.00 9.50
Skilled Labor 2.00 9.50 Unskilled Labor 2.00 9.50
Skilled Labor 2.00 9.50 Unskilled Labor 6.00 7.50
Skilled Labor 2.00 9.50 Unskilled Labor 1.00 10.00
Skilled Labor 2.00 9.50 Unskilled Labor
Skilled Labor 2.00 9.50 Unskilled Labor
Skilled Labor 2.00 9.50 Unskilled Labor
Skilled Labor 2.00 9.50 Unskilled Labor
Skilled Labor 2.00 9.50 Unskilled Labor
Skilled Labor 2.00 9.50 Unskilled Labor
Skilled Labor 3.00 9.00 Unskilled Labor
Skilled Labor 3.00 9.00 Unskilled Labor
Skilled Labor 3.00 9.00 Unskilled Labor
Skilled Labor 3.00 9.00 Unskilled Labor
Skilled Labor 3.00 9.00 Unskilled Labor
Skilled Labor 3.00 9.00 Unskilled Labor
Skilled Labor 3.00 9.00 Unskilled Labor
Skilled Labor 3.00 9.00 Unskilled Labor
Skilled Labor 4.00 8.50 Unskilled Labor
Skilled Labor 4.00 8.50 Unskilled Labor
Skilled Labor 4.00 8.50 Unskilled Labor
1

Annexure- 4.5: Frequency distribution of priorities ascertained by the intervieweeFactors Priority Weightage Factors Priority WeightageSkilled Labor 4.00 8.50 Unskilled Labor
Skilled Labor 4.00 8.50 Unskilled Labor
Skilled Labor 5.00 8.00 Unskilled Labor
Skilled Labor 5.00 8.00 Unskilled Labor
Skilled Labor 5.00 8.00 Unskilled Labor
Skilled Labor 6.00 7.50 Unskilled Labor
Skilled Labor 6.00 7.50 Unskilled Labor
Skilled Labor 6.00 7.50 Unskilled Labor
Skilled Labor 6.00 7.50 Unskilled Labor
Skilled Labor 7.00 7.00 Unskilled Labor
Skilled Labor 7.00 7.00 Unskilled Labor
Skilled Labor 8.00 6.50 Unskilled Labor
Skilled Labor 8.00 6.50 Unskilled Labor
Skilled Labor 8.00 6.50 Unskilled Labor
Skilled Labor 8.00 6.50 Unskilled Labor
Skilled Labor 9.00 6.00 Unskilled Labor
Skilled Labor Unskilled Labor
Skilled Labor Unskilled Labor
Skilled Labor Unskilled Labor
Skilled Labor Unskilled Labor
Skilled Labor Unskilled Labor
Skilled Labor Unskilled Labor
Skilled Labor Unskilled Labor
Total Weightage 467.00 Total Weightage 84.50
Number of Respondents 53.00 Number of Respondents 20.00
Average Weightage 8.81 Average Weightage 4.23
Factors Priority Weightage Factors Priority Weightage
Nearness to airway 12.00 4.50 Nearness to river 1.00 10.00
Nearness to airway 14.00 3.50 Nearness to river 1.00 10.00
Nearness to airway 15.00 3.00 Nearness to river 12.00 4.50
Nearness to airway 16.00 2.50 Nearness to river 13.00 4.00
Nearness to airway 16.00 2.50 Nearness to river 13.00 4.00
Nearness to airway 17.00 2.00 Nearness to river 14.00 3.50
Nearness to airway 17.00 2.00 Nearness to river 14.00 3.50
Nearness to airway 19.00 1.00 Nearness to river 15.00 3.00
Nearness to airway 19.00 1.00 Nearness to river 15.00 3.00
2
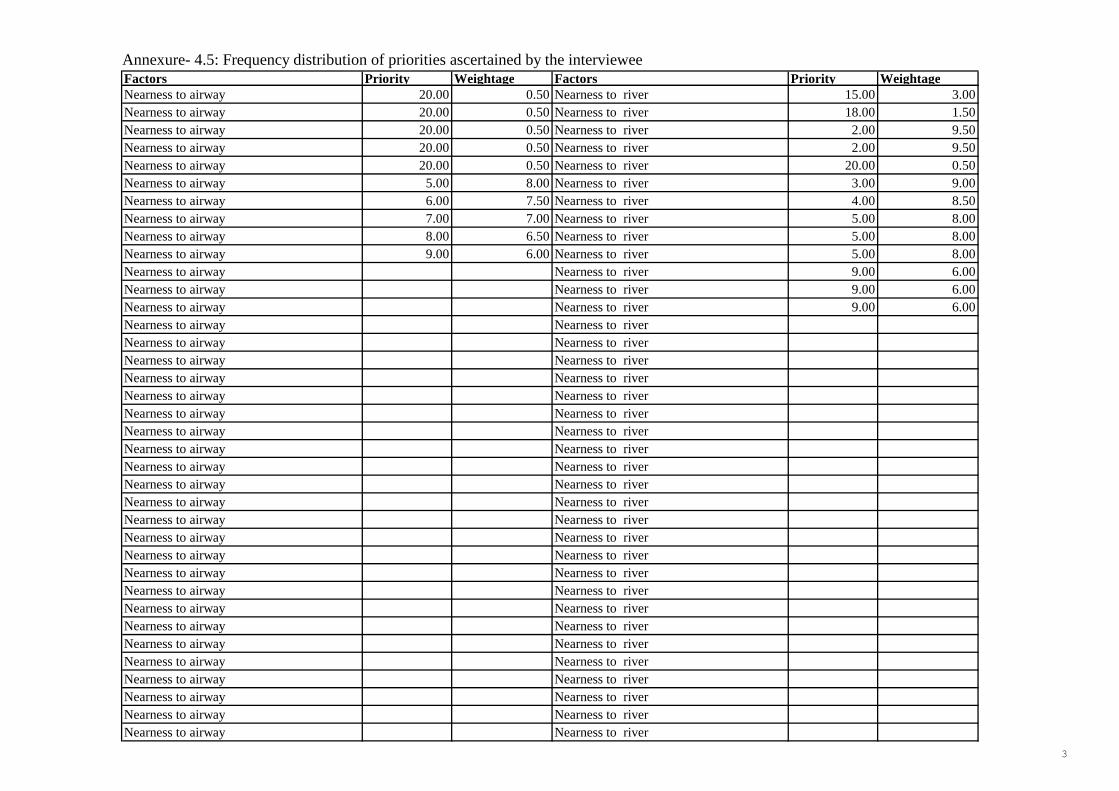
Annexure- 4.5: Frequency distribution of priorities ascertained by the intervieweeFactors Priority Weightage Factors Priority WeightageNearness to airway 20.00 0.50 Nearness to river 15.00 3.00
Nearness to airway 20.00 0.50 Nearness to river 18.00 1.50
Nearness to airway 20.00 0.50 Nearness to river 2.00 9.50
Nearness to airway 20.00 0.50 Nearness to river 2.00 9.50
Nearness to airway 20.00 0.50 Nearness to river 20.00 0.50
Nearness to airway 5.00 8.00 Nearness to river 3.00 9.00
Nearness to airway 6.00 7.50 Nearness to river 4.00 8.50
Nearness to airway 7.00 7.00 Nearness to river 5.00 8.00
Nearness to airway 8.00 6.50 Nearness to river 5.00 8.00
Nearness to airway 9.00 6.00 Nearness to river 5.00 8.00
Nearness to airway Nearness to river 9.00 6.00
Nearness to airway Nearness to river 9.00 6.00
Nearness to airway Nearness to river 9.00 6.00
Nearness to airway Nearness to river
Nearness to airway Nearness to river
Nearness to airway Nearness to river
Nearness to airway Nearness to river
Nearness to airway Nearness to river
Nearness to airway Nearness to river
Nearness to airway Nearness to river
Nearness to airway Nearness to river
Nearness to airway Nearness to river
Nearness to airway Nearness to river
Nearness to airway Nearness to river
Nearness to airway Nearness to river
Nearness to airway Nearness to river
Nearness to airway Nearness to river
Nearness to airway Nearness to river
Nearness to airway Nearness to river
Nearness to airway Nearness to river
Nearness to airway Nearness to river
Nearness to airway Nearness to river
Nearness to airway Nearness to river
Nearness to airway Nearness to river
Nearness to airway Nearness to river
Nearness to airway Nearness to river
Nearness to airway Nearness to river
3

Annexure- 4.5: Frequency distribution of priorities ascertained by the intervieweeFactors Priority Weightage Factors Priority WeightageNearness to airway Nearness to river
Nearness to airway Nearness to river
Nearness to airway Nearness to river
Nearness to airway Nearness to river
Nearness to airway Nearness to river
Nearness to airway Nearness to river
Nearness to airway Nearness to river
Nearness to airway Nearness to river
Nearness to airway Nearness to river
Nearness to airway Nearness to river
Nearness to airway Nearness to river
Nearness to airway Nearness to river
Nearness to airway Nearness to river
Nearness to airway Nearness to river
Total Weightage 51.50 Total Weightage 109.00
Number of Respondents 19.00 Number of Respondents 22.00
Average Weightage 2.71 Average Weightage 4.95
Factors Priority Weightage Factors Priority Weightage
Electricity supply 1.00 10.00 Law and order situation 1.00 10.00
Electricity supply 1.00 10.00 Law and order situation 1.00 10.00
Electricity supply 1.00 10.00 Law and order situation 1.00 10.00
Electricity supply 1.00 10.00 Law and order situation 1.00 10.00
Electricity supply 1.00 10.00 Law and order situation 1.00 10.00
Electricity supply 1.00 10.00 Law and order situation 10.00 5.50
Electricity supply 11.00 5.00 Law and order situation 11.00 5.00
Electricity supply 2.00 9.50 Law and order situation 11.00 5.00
Electricity supply 2.00 9.50 Law and order situation 11.00 5.00
Electricity supply 2.00 9.50 Law and order situation 12.00 4.50
Electricity supply 2.00 9.50 Law and order situation 12.00 4.50
Electricity supply 2.00 9.50 Law and order situation 12.00 4.50
Electricity supply 2.00 9.50 Law and order situation 14.00 3.50
Electricity supply 2.00 9.50 Law and order situation 15.00 3.00
Electricity supply 2.00 9.50 Law and order situation 15.00 3.00
Electricity supply 2.00 9.50 Law and order situation 19.00 1.00
Electricity supply 2.00 9.50 Law and order situation 2.00 9.50
Electricity supply 2.00 9.50 Law and order situation 2.00 9.50
4
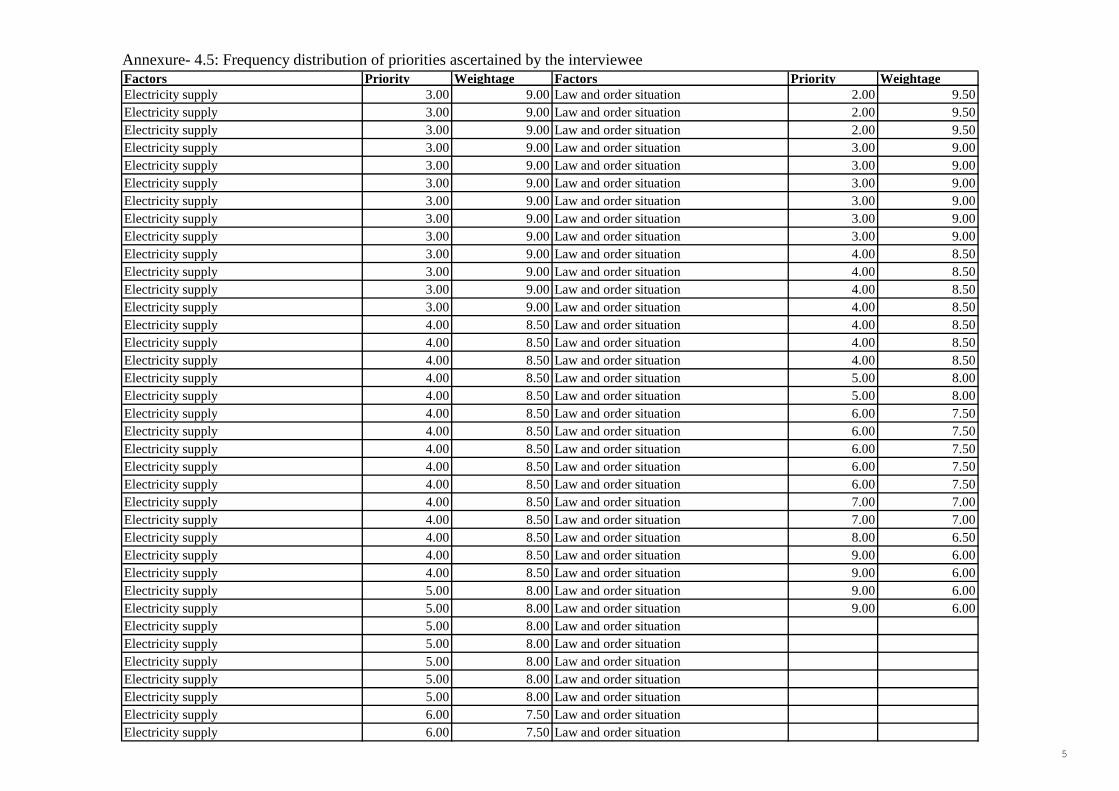
Annexure- 4.5: Frequency distribution of priorities ascertained by the intervieweeFactors Priority Weightage Factors Priority WeightageElectricity supply 3.00 9.00 Law and order situation 2.00 9.50
Electricity supply 3.00 9.00 Law and order situation 2.00 9.50
Electricity supply 3.00 9.00 Law and order situation 2.00 9.50
Electricity supply 3.00 9.00 Law and order situation 3.00 9.00
Electricity supply 3.00 9.00 Law and order situation 3.00 9.00
Electricity supply 3.00 9.00 Law and order situation 3.00 9.00
Electricity supply 3.00 9.00 Law and order situation 3.00 9.00
Electricity supply 3.00 9.00 Law and order situation 3.00 9.00
Electricity supply 3.00 9.00 Law and order situation 3.00 9.00
Electricity supply 3.00 9.00 Law and order situation 4.00 8.50
Electricity supply 3.00 9.00 Law and order situation 4.00 8.50
Electricity supply 3.00 9.00 Law and order situation 4.00 8.50
Electricity supply 3.00 9.00 Law and order situation 4.00 8.50
Electricity supply 4.00 8.50 Law and order situation 4.00 8.50
Electricity supply 4.00 8.50 Law and order situation 4.00 8.50
Electricity supply 4.00 8.50 Law and order situation 4.00 8.50
Electricity supply 4.00 8.50 Law and order situation 5.00 8.00
Electricity supply 4.00 8.50 Law and order situation 5.00 8.00
Electricity supply 4.00 8.50 Law and order situation 6.00 7.50
Electricity supply 4.00 8.50 Law and order situation 6.00 7.50
Electricity supply 4.00 8.50 Law and order situation 6.00 7.50
Electricity supply 4.00 8.50 Law and order situation 6.00 7.50
Electricity supply 4.00 8.50 Law and order situation 6.00 7.50
Electricity supply 4.00 8.50 Law and order situation 7.00 7.00
Electricity supply 4.00 8.50 Law and order situation 7.00 7.00
Electricity supply 4.00 8.50 Law and order situation 8.00 6.50
Electricity supply 4.00 8.50 Law and order situation 9.00 6.00
Electricity supply 4.00 8.50 Law and order situation 9.00 6.00
Electricity supply 5.00 8.00 Law and order situation 9.00 6.00
Electricity supply 5.00 8.00 Law and order situation 9.00 6.00
Electricity supply 5.00 8.00 Law and order situation
Electricity supply 5.00 8.00 Law and order situation
Electricity supply 5.00 8.00 Law and order situation
Electricity supply 5.00 8.00 Law and order situation
Electricity supply 5.00 8.00 Law and order situation
Electricity supply 6.00 7.50 Law and order situation
Electricity supply 6.00 7.50 Law and order situation
5

Annexure- 4.5: Frequency distribution of priorities ascertained by the intervieweeFactors Priority Weightage Factors Priority WeightageElectricity supply 6.00 7.50 Law and order situation
Electricity supply 7.00 7.00 Law and order situation
Electricity supply 8.00 6.50 Law and order situation
Electricity supply 8.00 6.50 Law and order situation
Electricity supply Law and order situation
Total Weightage 465.00 Total Weightage 333.50
Number of Respondents 59.00 Number of Respondents 48.00
Average Weightage 7.88 Average Weightage 6.95
Factors Priority Weightage Factors Priority Weightage
Availability of drainage outfall 10.00 5.50 Availability of drainage outlet 12.00 4.50
Availability of drainage outfall 11.00 5.00 Availability of drainage outlet 14.00 3.50
Availability of drainage outfall 14.00 3.50 Availability of drainage outlet 15.00 3.00
Availability of drainage outfall 14.00 3.50 Availability of drainage outlet 16.00 2.50
Availability of drainage outfall 15.00 3.00 Availability of drainage outlet 17.00 2.00
Availability of drainage outfall 17.00 2.00 Availability of drainage outlet 17.00 2.00
Availability of drainage outfall 19.00 1.00 Availability of drainage outlet 18.00 1.50
Availability of drainage outfall 20.00 0.50 Availability of drainage outlet 18.00 1.50
Availability of drainage outfall 20.00 0.50 Availability of drainage outlet 18.00 1.50
Availability of drainage outfall 20.00 0.50 Availability of drainage outlet 18.00 1.50
Availability of drainage outfall 20.00 0.50 Availability of drainage outlet 18.00 1.50
Availability of drainage outfall 5.00 8.00 Availability of drainage outlet 18.00 1.50
Availability of drainage outfall 5.00 8.00 Availability of drainage outlet 18.00 1.50
Availability of drainage outfall 5.00 8.00 Availability of drainage outlet 19.00 1.00
Availability of drainage outfall 5.00 8.00 Availability of drainage outlet 19.00 1.00
Availability of drainage outfall 6.00 7.50 Availability of drainage outlet 19.00 1.00
Availability of drainage outfall 8.00 6.50 Availability of drainage outlet 7.00 7.00
Availability of drainage outfall 8.00 6.50 Availability of drainage outlet
Availability of drainage outfall 8.00 6.50 Availability of drainage outlet
Availability of drainage outfall 9.00 6.00 Availability of drainage outlet
Availability of drainage outfall Availability of drainage outlet
Availability of drainage outfall Availability of drainage outlet
Availability of drainage outfall Availability of drainage outlet
Availability of drainage outfall Availability of drainage outlet
Availability of drainage outfall Availability of drainage outlet
Availability of drainage outfall Availability of drainage outlet
Availability of drainage outfall Availability of drainage outlet
6
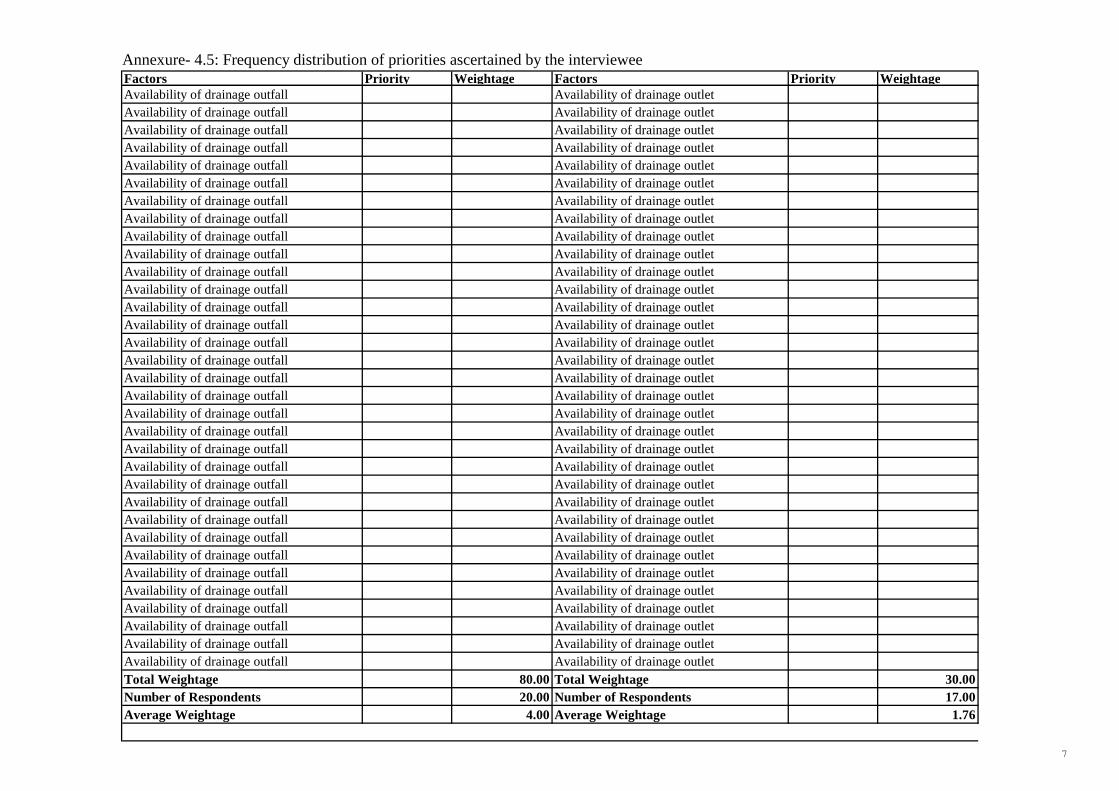
Annexure- 4.5: Frequency distribution of priorities ascertained by the intervieweeFactors Priority Weightage Factors Priority WeightageAvailability of drainage outfall Availability of drainage outlet
Availability of drainage outfall Availability of drainage outlet
Availability of drainage outfall Availability of drainage outlet
Availability of drainage outfall Availability of drainage outlet
Availability of drainage outfall Availability of drainage outlet
Availability of drainage outfall Availability of drainage outlet
Availability of drainage outfall Availability of drainage outlet
Availability of drainage outfall Availability of drainage outlet
Availability of drainage outfall Availability of drainage outlet
Availability of drainage outfall Availability of drainage outlet
Availability of drainage outfall Availability of drainage outlet
Availability of drainage outfall Availability of drainage outlet
Availability of drainage outfall Availability of drainage outlet
Availability of drainage outfall Availability of drainage outlet
Availability of drainage outfall Availability of drainage outlet
Availability of drainage outfall Availability of drainage outlet
Availability of drainage outfall Availability of drainage outlet
Availability of drainage outfall Availability of drainage outlet
Availability of drainage outfall Availability of drainage outlet
Availability of drainage outfall Availability of drainage outlet
Availability of drainage outfall Availability of drainage outlet
Availability of drainage outfall Availability of drainage outlet
Availability of drainage outfall Availability of drainage outlet
Availability of drainage outfall Availability of drainage outlet
Availability of drainage outfall Availability of drainage outlet
Availability of drainage outfall Availability of drainage outlet
Availability of drainage outfall Availability of drainage outlet
Availability of drainage outfall Availability of drainage outlet
Availability of drainage outfall Availability of drainage outlet
Availability of drainage outfall Availability of drainage outlet
Availability of drainage outfall Availability of drainage outlet
Availability of drainage outfall Availability of drainage outlet
Availability of drainage outfall Availability of drainage outlet
Total Weightage 80.00 Total Weightage 30.00
Number of Respondents 20.00 Number of Respondents 17.00
Average Weightage 4.00 Average Weightage 1.76
7

Annexure- 4.5: Frequency distribution of priorities ascertained by the intervieweeFactors Priority Weightage Factors Priority WeightageFactors Priority Weightage Factors Priority Weightage
Raw material Carrying cost 10.00 5.50 Finish product carrying cost 10.00 5.50
Raw material Carrying cost 10.00 5.50 Finish product carrying cost 10.00 5.50
Raw material Carrying cost 10.00 5.50 Finish product carrying cost 10.00 5.50
Raw material Carrying cost 10.00 5.50 Finish product carrying cost 10.00 5.50
Raw material Carrying cost 10.00 5.50 Finish product carrying cost 11.00 5.00
Raw material Carrying cost 10.00 5.50 Finish product carrying cost 11.00 5.00
Raw material Carrying cost 11.00 5.00 Finish product carrying cost 12.00 4.50
Raw material Carrying cost 11.00 5.00 Finish product carrying cost 12.00 4.50
Raw material Carrying cost 11.00 5.00 Finish product carrying cost 12.00 4.50
Raw material Carrying cost 11.00 5.00 Finish product carrying cost 12.00 4.50
Raw material Carrying cost 12.00 4.50 Finish product carrying cost 13.00 4.00
Raw material Carrying cost 3.00 9.00 Finish product carrying cost 2.00 9.50
Raw material Carrying cost 3.00 9.00 Finish product carrying cost 2.00 9.50
Raw material Carrying cost 3.00 9.00 Finish product carrying cost 4.00 8.50
Raw material Carrying cost 3.00 9.00 Finish product carrying cost 5.00 8.00
Raw material Carrying cost 3.00 9.00 Finish product carrying cost 5.00 8.00
Raw material Carrying cost 4.00 8.50 Finish product carrying cost 5.00 8.00
Raw material Carrying cost 4.00 8.50 Finish product carrying cost 6.00 7.50
Raw material Carrying cost 4.00 8.50 Finish product carrying cost 6.00 7.50
Raw material Carrying cost 4.00 8.50 Finish product carrying cost 6.00 7.50
Raw material Carrying cost 4.00 8.50 Finish product carrying cost 7.00 7.00
Raw material Carrying cost 4.00 8.50 Finish product carrying cost 7.00 7.00
Raw material Carrying cost 5.00 8.00 Finish product carrying cost 7.00 7.00
Raw material Carrying cost 5.00 8.00 Finish product carrying cost 8.00 6.50
Raw material Carrying cost 5.00 8.00 Finish product carrying cost 8.00 6.50
Raw material Carrying cost 5.00 8.00 Finish product carrying cost 8.00 6.50
Raw material Carrying cost 5.00 8.00 Finish product carrying cost 8.00 6.50
Raw material Carrying cost 5.00 8.00 Finish product carrying cost 8.00 6.50
Raw material Carrying cost 6.00 7.50 Finish product carrying cost 9.00 6.00
Raw material Carrying cost 6.00 7.50 Finish product carrying cost 9.00 6.00
Raw material Carrying cost 6.00 7.50 Finish product carrying cost 9.00 6.00
Raw material Carrying cost 6.00 7.50 Finish product carrying cost
Raw material Carrying cost 6.00 7.50 Finish product carrying cost
Raw material Carrying cost 6.00 7.50 Finish product carrying cost
Raw material Carrying cost 6.00 7.50 Finish product carrying cost
Raw material Carrying cost 6.00 7.50 Finish product carrying cost
8

Annexure- 4.5: Frequency distribution of priorities ascertained by the intervieweeFactors Priority Weightage Factors Priority WeightageRaw material Carrying cost 6.00 7.50 Finish product carrying cost
Raw material Carrying cost 6.00 7.50 Finish product carrying cost
Raw material Carrying cost 7.00 7.00 Finish product carrying cost
Raw material Carrying cost 7.00 7.00 Finish product carrying cost
Raw material Carrying cost 7.00 7.00 Finish product carrying cost
Raw material Carrying cost 8.00 6.50 Finish product carrying cost
Raw material Carrying cost 8.00 6.50 Finish product carrying cost
Raw material Carrying cost 8.00 6.50 Finish product carrying cost
Raw material Carrying cost 9.00 6.00 Finish product carrying cost
Raw material Carrying cost 9.00 6.00 Finish product carrying cost
Raw material Carrying cost 9.00 6.00 Finish product carrying cost
Raw material Carrying cost 9.00 6.00 Finish product carrying cost
Raw material Carrying cost 9.00 6.00 Finish product carrying cost
Raw material Carrying cost 9.00 6.00 Finish product carrying cost
Raw material Carrying cost Finish product carrying cost
Raw material Carrying cost Finish product carrying cost
Raw material Carrying cost Finish product carrying cost
Raw material Carrying cost Finish product carrying cost
Raw material Carrying cost Finish product carrying cost
Raw material Carrying cost Finish product carrying cost
Raw material Carrying cost Finish product carrying cost
Raw material Carrying cost Finish product carrying cost
Raw material Carrying cost Finish product carrying cost
Raw material Carrying cost Finish product carrying cost
Total Weightage 342.00 Total Weightage 188.50
Number of Respondents 50.00 Number of Respondents 31.00
Average Weightage 6.84 Average Weightage 6.08
Factors Priority Weightage Factors Priority Weightage
Nearness to the city centre 10.00 5.50 Fiscal incentives 1.00 10.00
Nearness to the city centre 10.00 5.50 Fiscal incentives 10.00 5.50
Nearness to the city centre 10.00 5.50 Fiscal incentives 10.00 5.50
Nearness to the city centre 10.00 5.50 Fiscal incentives 11.00 5.00
Nearness to the city centre 10.00 5.50 Fiscal incentives 12.00 4.50
Nearness to the city centre 11.00 5.00 Fiscal incentives 14.00 3.50
Nearness to the city centre 11.00 5.00 Fiscal incentives 18.00 1.50
Nearness to the city centre 12.00 4.50 Fiscal incentives 19.00 1.00
9

Annexure- 4.5: Frequency distribution of priorities ascertained by the intervieweeFactors Priority Weightage Factors Priority WeightageNearness to the city centre 12.00 4.50 Fiscal incentives 2.00 9.50
Nearness to the city centre 13.00 4.00 Fiscal incentives 2.00 9.50
Nearness to the city centre 13.00 4.00 Fiscal incentives 20.00 0.50
Nearness to the city centre 13.00 4.00 Fiscal incentives 4.00 8.50
Nearness to the city centre 13.00 4.00 Fiscal incentives 6.00 7.50
Nearness to the city centre 14.00 3.50 Fiscal incentives 6.00 7.50
Nearness to the city centre 14.00 3.50 Fiscal incentives 6.00 7.50
Nearness to the city centre 14.00 3.50 Fiscal incentives 6.00 7.50
Nearness to the city centre 17.00 2.00 Fiscal incentives 7.00 7.00
Nearness to the city centre 17.00 2.00 Fiscal incentives 7.00 7.00
Nearness to the city centre 2.00 9.50 Fiscal incentives 8.00 6.50
Nearness to the city centre 20.00 0.50 Fiscal incentives 9.00 6.00
Nearness to the city centre 4.00 8.50 Fiscal incentives 9.00 6.00
Nearness to the city centre 5.00 8.00 Fiscal incentives
Nearness to the city centre 5.00 8.00 Fiscal incentives
Nearness to the city centre 5.00 8.00 Fiscal incentives
Nearness to the city centre 5.00 8.00 Fiscal incentives
Nearness to the city centre 6.00 7.50 Fiscal incentives
Nearness to the city centre 6.00 7.50 Fiscal incentives
Nearness to the city centre 7.00 7.00 Fiscal incentives
Nearness to the city centre 7.00 7.00 Fiscal incentives
Nearness to the city centre 8.00 6.50 Fiscal incentives
Nearness to the city centre 8.00 6.50 Fiscal incentives
Nearness to the city centre 8.00 6.50 Fiscal incentives
Nearness to the city centre 8.00 6.50 Fiscal incentives
Nearness to the city centre 8.00 6.50 Fiscal incentives
Nearness to the city centre 9.00 6.00 Fiscal incentives
Nearness to the city centre 9.00 6.00 Fiscal incentives
Nearness to the city centre Fiscal incentives
Nearness to the city centre Fiscal incentives
Nearness to the city centre Fiscal incentives
Nearness to the city centre Fiscal incentives
Nearness to the city centre Fiscal incentives
Nearness to the city centre Fiscal incentives
Nearness to the city centre Fiscal incentives
Nearness to the city centre Fiscal incentives
Nearness to the city centre Fiscal incentives
10
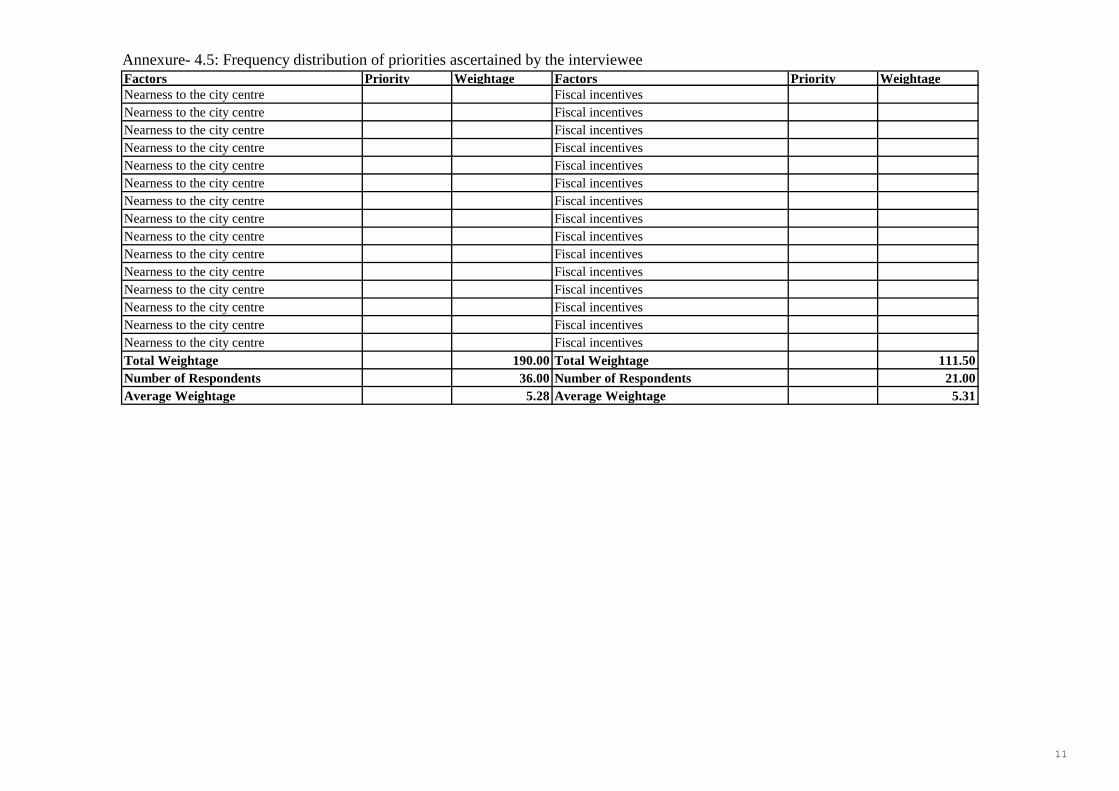
Annexure- 4.5: Frequency distribution of priorities ascertained by the intervieweeFactors Priority Weightage Factors Priority WeightageNearness to the city centre Fiscal incentives
Nearness to the city centre Fiscal incentives
Nearness to the city centre Fiscal incentives
Nearness to the city centre Fiscal incentives
Nearness to the city centre Fiscal incentives
Nearness to the city centre Fiscal incentives
Nearness to the city centre Fiscal incentives
Nearness to the city centre Fiscal incentives
Nearness to the city centre Fiscal incentives
Nearness to the city centre Fiscal incentives
Nearness to the city centre Fiscal incentives
Nearness to the city centre Fiscal incentives
Nearness to the city centre Fiscal incentives
Nearness to the city centre Fiscal incentives
Nearness to the city centre Fiscal incentives
Total Weightage 190.00 Total Weightage 111.50
Number of Respondents 36.00 Number of Respondents 21.00
Average Weightage 5.28 Average Weightage 5.31
11

Annexure- 4.5: Frequency distribution of priorities ascertained by the intervieweeFactors Priority Weightage Factors Priority WeightageNearness to highway 1.00 10.00 Nearness to railway 10.00 5.50
Nearness to highway 1.00 10.00 Nearness to railway 12.00 4.50
Nearness to highway 10.00 5.50 Nearness to railway 13.00 4.00
Nearness to highway 10.00 5.50 Nearness to railway 15.00 3.00
Nearness to highway 10.00 5.50 Nearness to railway 16.00 2.50
Nearness to highway 10.00 5.50 Nearness to railway 18.00 1.50
Nearness to highway 11.00 5.00 Nearness to railway 20.00 0.50
Nearness to highway 11.00 5.00 Nearness to railway 3.00 9.00
Nearness to highway 11.00 5.00 Nearness to railway 5.00 8.00
Nearness to highway 11.00 5.00 Nearness to railway 7.00 7.00
Nearness to highway 12.00 4.50 Nearness to railway
Nearness to highway 13.00 4.00 Nearness to railway
Nearness to highway 16.00 2.50 Nearness to railway
Nearness to highway 2.00 9.50 Nearness to railway
Nearness to highway 2.00 9.50 Nearness to railway
Nearness to highway 3.00 9.00 Nearness to railway
Nearness to highway 3.00 9.00 Nearness to railway
Nearness to highway 3.00 9.00 Nearness to railway
Nearness to highway 4.00 8.50 Nearness to railway
Nearness to highway 4.00 8.50 Nearness to railway
Nearness to highway 4.00 8.50 Nearness to railway
Nearness to highway 5.00 8.00 Nearness to railway
Nearness to highway 5.00 8.00 Nearness to railway
Nearness to highway 5.00 8.00 Nearness to railway
Nearness to highway 5.00 8.00 Nearness to railway
Nearness to highway 6.00 7.50 Nearness to railway
Nearness to highway 6.00 7.50 Nearness to railway
Nearness to highway 6.00 7.50 Nearness to railway
Nearness to highway 6.00 7.50 Nearness to railway
Nearness to highway 6.00 7.50 Nearness to railway
Nearness to highway 7.00 7.00 Nearness to railway
Nearness to highway 7.00 7.00 Nearness to railway
Nearness to highway 8.00 6.50 Nearness to railway
Nearness to highway 8.00 6.50 Nearness to railway
Nearness to highway 8.00 6.50 Nearness to railway
Nearness to highway 8.00 6.50 Nearness to railway
Nearness to highway 8.00 6.50 Nearness to railway
12

Annexure- 4.5: Frequency distribution of priorities ascertained by the intervieweeFactors Priority Weightage Factors Priority WeightageNearness to highway 9.00 6.00 Nearness to railway
Nearness to highway Nearness to railway
Nearness to highway Nearness to railway
Nearness to highway Nearness to railway
Nearness to highway Nearness to railway
Nearness to highway Nearness to railway
Nearness to highway Nearness to railway
Nearness to highway Nearness to railway
Nearness to highway Nearness to railway
Nearness to highway Nearness to railway
Nearness to highway Nearness to railway
Nearness to highway Nearness to railway
Nearness to highway Nearness to railway
Nearness to highway Nearness to railway
Nearness to highway Nearness to railway
Nearness to highway Nearness to railway
Nearness to highway Nearness to railway
Nearness to highway Nearness to railway
Nearness to highway Nearness to railway
Nearness to highway Nearness to railway
Nearness to highway Nearness to railway
Nearness to highway Nearness to railway
Nearness to highway Nearness to railway
Total Weightage 266.50 Total Weightage 45.50
Number of Respondents 38.00 Number of Respondents 10.00
Average Weightage 7.01 Average Weightage 4.55
Factors Priority Weightage Factors Priority Weightage
Access to market 1.00 10.00 Local agency Co-operation 10.00 5.50
Access to market 1.00 10.00 Local agency Co-operation 10.00 5.00
Access to market 1.00 10.00 Local agency Co-operation 11.00 5.00
Access to market 10.00 5.50 Local agency Co-operation 11.00 5.00
Access to market 10.00 5.50 Local agency Co-operation 11.00 5.00
Access to market 11.00 5.00 Local agency Co-operation 12.00 4.50
Access to market 12.00 4.50 Local agency Co-operation 12.00 4.50
Access to market 12.00 4.50 Local agency Co-operation 14.00 3.50
Access to market 13.00 4.00 Local agency Co-operation 14.00 3.50
13

Annexure- 4.5: Frequency distribution of priorities ascertained by the intervieweeFactors Priority Weightage Factors Priority WeightageAccess to market 15.00 3.00 Local agency Co-operation 15.00 3.00
Access to market 16.00 2.50 Local agency Co-operation 15.00 3.00
Access to market 17.00 2.00 Local agency Co-operation 16.00 2.50
Access to market 2.00 9.50 Local agency Co-operation 16.00 2.50
Access to market 2.00 9.50 Local agency Co-operation 16.00 2.50
Access to market 2.00 9.50 Local agency Co-operation 16.00 2.50
Access to market 3.00 9.00 Local agency Co-operation 17.00 2.00
Access to market 3.00 9.00 Local agency Co-operation 17.00 2.00
Access to market 3.00 9.00 Local agency Co-operation 18.00 1.50
Access to market 3.00 9.00 Local agency Co-operation 18.00 1.50
Access to market 3.00 9.00 Local agency Co-operation 19.00 1.00
Access to market 3.00 9.00 Local agency Co-operation 20.00 0.50
Access to market 3.00 9.00 Local agency Co-operation 5.00 8.00
Access to market 3.00 9.00 Local agency Co-operation 5.00 8.00
Access to market 4.00 8.50 Local agency Co-operation 7.00 7.00
Access to market 4.00 8.50 Local agency Co-operation 7.00 7.00
Access to market 4.00 8.50 Local agency Co-operation 8.00 6.50
Access to market 5.00 8.00 Local agency Co-operation 9.00 6.00
Access to market 5.00 8.00 Local agency Co-operation 9.00 6.00
Access to market 5.00 8.00 Local agency Co-operation 9.00 6.00
Access to market 5.00 8.00 Local agency Co-operation 9.00 6.00
Access to market 5.00 8.00 Local agency Co-operation
Access to market 5.00 8.00 Local agency Co-operation
Access to market 6.00 7.50 Local agency Co-operation
Access to market 6.00 7.50 Local agency Co-operation
Access to market 6.00 7.50 Local agency Co-operation
Access to market 6.00 7.50 Local agency Co-operation
Access to market 7.00 7.00 Local agency Co-operation
Access to market 7.00 7.00 Local agency Co-operation
Access to market 7.00 7.00 Local agency Co-operation
Access to market 7.00 7.00 Local agency Co-operation
Access to market 7.00 7.00 Local agency Co-operation
Access to market 7.00 7.00 Local agency Co-operation
Access to market 8.00 6.50 Local agency Co-operation
Access to market 8.00 6.50 Local agency Co-operation
Access to market 8.00 6.50 Local agency Co-operation
Access to market 8.00 6.50 Local agency Co-operation
14

Annexure- 4.5: Frequency distribution of priorities ascertained by the intervieweeFactors Priority Weightage Factors Priority WeightageAccess to market 9.00 6.00 Local agency Co-operation
Access to market 9.00 6.00 Local agency Co-operation
Access to market 9.00 6.00 Local agency Co-operation
Access to market 9.00 6.00 Local agency Co-operation
Access to market Local agency Co-operation
Access to market Local agency Co-operation
Access to market Local agency Co-operation
Access to market Local agency Co-operation
Access to market Local agency Co-operation
Access to market Local agency Co-operation
Access to market Local agency Co-operation
Access to market Local agency Co-operation
Access to market Local agency Co-operation
Access to market Local agency Co-operation
Total Weightage 342.50 Total Weightage 116.00
Number of Respondents 51.00 Number of Respondents 30.00
Average Weightage 6.72 Average Weightage 3.87
Factors Priority Weightage Factors Priority Weightage
Gas supply 1.00 10.00 Water supply 10.00 5.50
Gas supply 10.00 5.50 Water supply 11.00 5.00
Gas supply 11.00 5.00 Water supply 11.00 5.00
Gas supply 11.00 5.00 Water supply 11.00 5.00
Gas supply 12.00 4.50 Water supply 12.00 4.50
Gas supply 13.00 4.00 Water supply 12.00 4.50
Gas supply 13.00 4.00 Water supply 13.00 4.00
Gas supply 13.00 4.00 Water supply 13.00 4.00
Gas supply 14.00 3.50 Water supply 13.00 4.00
Gas supply 14.00 3.50 Water supply 13.00 4.00
Gas supply 16.00 2.50 Water supply 14.00 3.50
Gas supply 16.00 2.50 Water supply 14.00 3.50
Gas supply 19.00 1.00 Water supply 15.00 3.00
Gas supply 2.00 9.50 Water supply 15.00 3.00
Gas supply 2.00 9.50 Water supply 15.00 3.00
Gas supply 2.00 9.50 Water supply 17.00 2.00
Gas supply 2.00 9.50 Water supply 19.00 1.00
Gas supply 3.00 9.00 Water supply 19.00 1.00
15

Annexure- 4.5: Frequency distribution of priorities ascertained by the intervieweeFactors Priority Weightage Factors Priority WeightageGas supply 3.00 9.00 Water supply 2.00 9.50
Gas supply 3.00 9.00 Water supply 4.00 8.50
Gas supply 3.00 9.00 Water supply 5.00 8.00
Gas supply 3.00 9.00 Water supply 6.00 7.50
Gas supply 3.00 9.00 Water supply 7.00 7.00
Gas supply 3.00 9.00 Water supply 7.00 7.00
Gas supply 3.00 9.00 Water supply 8.00 6.50
Gas supply 3.00 9.00 Water supply 8.00 6.50
Gas supply 3.00 9.00 Water supply 8.00 6.50
Gas supply 4.00 8.50 Water supply 8.00 6.50
Gas supply 4.00 8.50 Water supply 8.00 6.50
Gas supply 4.00 8.50 Water supply 8.00 6.50
Gas supply 4.00 8.50 Water supply 9.00 6.00
Gas supply 4.00 8.50 Water supply 9.00 6.00
Gas supply 4.00 8.50 Water supply 9.00 6.00
Gas supply 4.00 8.50 Water supply 9.00 6.00
Gas supply 4.00 8.50 Water supply 9.00 6.00
Gas supply 4.00 8.50 Water supply 9.00 6.00
Gas supply 4.00 8.50 Water supply
Gas supply 5.00 8.00 Water supply
Gas supply 5.00 8.00 Water supply
Gas supply 5.00 8.00 Water supply
Gas supply 5.00 8.00 Water supply
Gas supply 5.00 8.00 Water supply
Gas supply 5.00 8.00 Water supply
Gas supply 6.00 7.50 Water supply
Gas supply 6.00 7.50 Water supply
Gas supply 6.00 7.50 Water supply
Gas supply 7.00 7.00 Water supply
Gas supply 7.00 7.00 Water supply
Gas supply 7.00 7.00 Water supply
Gas supply 7.00 7.00 Water supply
Gas supply 8.00 6.50 Water supply
Gas supply 8.00 6.50 Water supply
Gas supply 9.00 6.00 Water supply
Gas supply 9.00 6.00 Water supply
Gas supply Water supply
16

Annexure- 4.5: Frequency distribution of priorities ascertained by the intervieweeFactors Priority Weightage Factors Priority WeightageGas supply Water supply
Gas supply Water supply
Gas supply Water supply
Gas supply Water supply
Gas supply Water supply
Total Weightage 376.00 Total Weightage 177.50
Number of Respondents 54.00 Number of Respondents 36.00
Average Weightage 6.96 Average Weightage 4.93
Factors Priority Weightage Factors Priority Weightage
Industrial Agglomeration 10.00 5.50 Land value/rent 1.00 10.00
Industrial Agglomeration 10.00 5.50 Land value/rent 1.00 10.00
Industrial Agglomeration 10.00 5.50 Land value/rent 1.00 10.00
Industrial Agglomeration 10.00 5.50 Land value/rent 1.00 10.00
Industrial Agglomeration 11.00 5.00 Land value/rent 1.00 10.00
Industrial Agglomeration 12.00 4.50 Land value/rent 1.00 10.00
Industrial Agglomeration 12.00 4.50 Land value/rent 1.00 10.00
Industrial Agglomeration 13.00 4.00 Land value/rent 1.00 10.00
Industrial Agglomeration 13.00 4.00 Land value/rent 1.00 10.00
Industrial Agglomeration 14.00 3.50 Land value/rent 1.00 10.00
Industrial Agglomeration 14.00 3.50 Land value/rent 1.00 10.00
Industrial Agglomeration 15.00 3.00 Land value/rent 1.00 10.00
Industrial Agglomeration 15.00 3.00 Land value/rent 1.00 10.00
Industrial Agglomeration 16.00 2.50 Land value/rent 1.00 10.00
Industrial Agglomeration 16.00 2.50 Land value/rent 1.00 10.00
Industrial Agglomeration 17.00 2.00 Land value/rent 1.00 10.00
Industrial Agglomeration 18.00 1.50 Land value/rent 1.00 10.00
Industrial Agglomeration 2.00 9.50 Land value/rent 1.00 10.00
Industrial Agglomeration 2.00 9.50 Land value/rent 1.00 10.00
Industrial Agglomeration 3.00 9.00 Land value/rent 1.00 10.00
Industrial Agglomeration 3.00 9.00 Land value/rent 1.00 10.00
Industrial Agglomeration 5.00 8.00 Land value/rent 1.00 10.00
Industrial Agglomeration 7.00 7.00 Land value/rent 1.00 10.00
Industrial Agglomeration 7.00 7.00 Land value/rent 1.00 10.00
Industrial Agglomeration 7.00 7.00 Land value/rent 1.00 10.00
Industrial Agglomeration 7.00 7.00 Land value/rent 1.00 10.00
Industrial Agglomeration 7.00 7.00 Land value/rent 1.00 10.00
17

Annexure- 4.5: Frequency distribution of priorities ascertained by the intervieweeFactors Priority Weightage Factors Priority WeightageIndustrial Agglomeration 7.00 7.00 Land value/rent 1.00 10.00
Industrial Agglomeration 8.00 6.50 Land value/rent 12.00 4.50
Industrial Agglomeration 9.00 6.00 Land value/rent 2.00 9.50
Industrial Agglomeration Land value/rent 2.00 9.50
Industrial Agglomeration Land value/rent 2.00 9.50
Industrial Agglomeration Land value/rent 2.00 9.50
Industrial Agglomeration Land value/rent 2.00 9.50
Industrial Agglomeration Land value/rent 2.00 9.50
Industrial Agglomeration Land value/rent 2.00 9.50
Industrial Agglomeration Land value/rent 3.00 9.00
Industrial Agglomeration Land value/rent 3.00 9.00
Industrial Agglomeration Land value/rent 4.00 8.50
Industrial Agglomeration Land value/rent 4.00 8.50
Industrial Agglomeration Land value/rent 4.00 8.50
Industrial Agglomeration Land value/rent 5.00 8.00
Industrial Agglomeration Land value/rent 5.00 8.00
Industrial Agglomeration Land value/rent 6.00 7.50
Industrial Agglomeration Land value/rent 6.00 7.50
Industrial Agglomeration Land value/rent 6.00 7.50
Industrial Agglomeration Land value/rent 6.00 7.50
Industrial Agglomeration Land value/rent 6.00 7.50
Industrial Agglomeration Land value/rent 7.00 7.00
Industrial Agglomeration Land value/rent 7.00 7.00
Industrial Agglomeration Land value/rent 7.00 7.00
Industrial Agglomeration Land value/rent 7.00 7.00
Industrial Agglomeration Land value/rent 8.00 6.50
Industrial Agglomeration Land value/rent 8.00 6.50
Industrial Agglomeration Land value/rent 8.00 6.50
Industrial Agglomeration Land value/rent 8.00 6.50
Industrial Agglomeration Land value/rent
Industrial Agglomeration Land value/rent
Industrial Agglomeration Land value/rent
Industrial Agglomeration Land value/rent
Total Weightage 154.00 Total Weightage 475.50
Number of Respondents 30.00 Number of Respondents 56.00
Average Weightage 5.13 Average Weightage 8.49
18

Annexure- 4.5: Frequency distribution of priorities ascertained by the intervieweeFactors Priority Weightage Factors Priority WeightageFactors Priority Weightage Factors Priority Weightage
Nearness to link indutries 10.00 5.50 Social facilities 10.00 5.50
Nearness to link indutries 11.00 5.00 Social facilities 10.00 5.50
Nearness to link indutries 12.00 4.50 Social facilities 10.00 5.50
Nearness to link indutries 12.00 4.50 Social facilities 10.00 5.50
Nearness to link indutries 12.00 4.50 Social facilities 10.00 5.50
Nearness to link indutries 13.00 4.00 Social facilities 10.00 5.50
Nearness to link indutries 13.00 4.00 Social facilities 10.00 5.50
Nearness to link indutries 13.00 4.00 Social facilities 11.00 5.00
Nearness to link indutries 14.00 3.50 Social facilities 11.00 5.00
Nearness to link indutries 17.00 2.00 Social facilities 11.00 5.00
Nearness to link indutries 18.00 1.50 Social facilities 12.00 4.50
Nearness to link indutries 3.00 9.00 Social facilities 12.00 4.50
Nearness to link indutries 4.00 8.50 Social facilities 13.00 4.00
Nearness to link indutries 4.00 8.50 Social facilities 14.00 3.50
Nearness to link indutries 5.00 8.00 Social facilities 15.00 3.00
Nearness to link indutries 5.00 8.00 Social facilities 15.00 3.00
Nearness to link indutries 6.00 7.50 Social facilities 15.00 3.00
Nearness to link indutries 7.00 7.00 Social facilities 15.00 3.00
Nearness to link indutries 7.00 7.00 Social facilities 16.00 2.50
Nearness to link indutries 7.00 7.00 Social facilities 16.00 2.50
Nearness to link indutries 7.00 7.00 Social facilities 16.00 2.50
Nearness to link indutries 8.00 6.50 Social facilities 17.00 2.00
Nearness to link indutries 8.00 6.50 Social facilities 4.00 8.50
Nearness to link indutries 8.00 6.50 Social facilities 5.00 8.00
Nearness to link indutries 8.00 6.50 Social facilities 5.00 8.00
Nearness to link indutries 8.00 6.50 Social facilities 6.00 7.50
Nearness to link indutries 8.00 6.50 Social facilities 6.00 7.50
Nearness to link indutries 9.00 6.00 Social facilities 6.00 7.50
Nearness to link indutries 9.00 6.00 Social facilities 6.00 7.50
Nearness to link indutries 9.00 6.00 Social facilities 6.00 7.50
Nearness to link indutries 9.00 6.00 Social facilities 6.00 7.50
Nearness to link indutries Social facilities 7.00 7.00
Nearness to link indutries Social facilities 7.00 7.00
Nearness to link indutries Social facilities 7.00 7.00
Nearness to link indutries Social facilities 7.00 7.00
Nearness to link indutries Social facilities 7.00 7.00
19
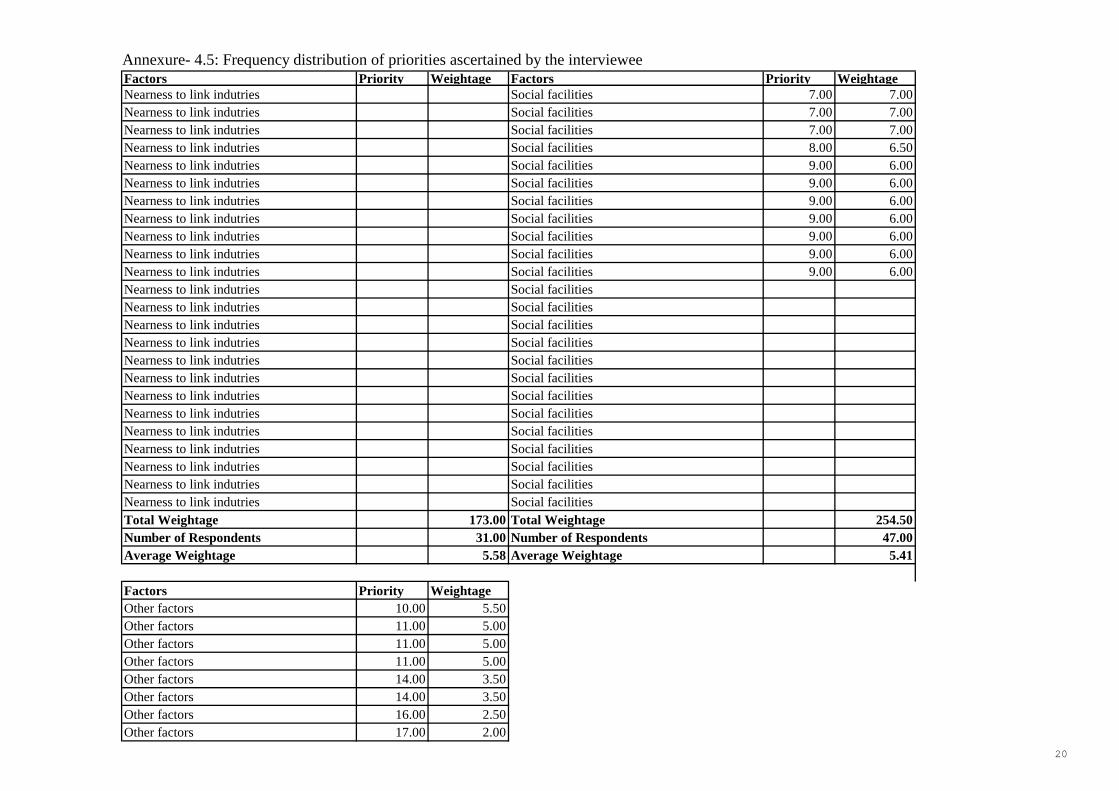
Annexure- 4.5: Frequency distribution of priorities ascertained by the intervieweeFactors Priority Weightage Factors Priority WeightageNearness to link indutries Social facilities 7.00 7.00
Nearness to link indutries Social facilities 7.00 7.00
Nearness to link indutries Social facilities 7.00 7.00
Nearness to link indutries Social facilities 8.00 6.50
Nearness to link indutries Social facilities 9.00 6.00
Nearness to link indutries Social facilities 9.00 6.00
Nearness to link indutries Social facilities 9.00 6.00
Nearness to link indutries Social facilities 9.00 6.00
Nearness to link indutries Social facilities 9.00 6.00
Nearness to link indutries Social facilities 9.00 6.00
Nearness to link indutries Social facilities 9.00 6.00
Nearness to link indutries Social facilities
Nearness to link indutries Social facilities
Nearness to link indutries Social facilities
Nearness to link indutries Social facilities
Nearness to link indutries Social facilities
Nearness to link indutries Social facilities
Nearness to link indutries Social facilities
Nearness to link indutries Social facilities
Nearness to link indutries Social facilities
Nearness to link indutries Social facilities
Nearness to link indutries Social facilities
Nearness to link indutries Social facilities
Nearness to link indutries Social facilities
Total Weightage 173.00 Total Weightage 254.50
Number of Respondents 31.00 Number of Respondents 47.00
Average Weightage 5.58 Average Weightage 5.41
Factors Priority Weightage
Other factors 10.00 5.50
Other factors 11.00 5.00
Other factors 11.00 5.00
Other factors 11.00 5.00
Other factors 14.00 3.50
Other factors 14.00 3.50
Other factors 16.00 2.50
Other factors 17.00 2.00
20

Annexure- 4.5: Frequency distribution of priorities ascertained by the intervieweeFactors Priority Weightage Factors Priority WeightageOther factors 17.00 2.00
Other factors 18.00 1.50
Other factors 19.00 1.00
Other factors 19.00 1.00
Other factors 20.00 0.50
Other factors 20.00 0.50
Other factors 20.00 0.50
Other factors
Other factors
Other factors
Other factors
Other factors
Other factors
Other factors
Other factors
Other factors
Other factors
Other factors
Other factors
Other factors
Other factors
Other factors
Other factors
Other factors
Other factors
Other factors
Other factors
Other factors
Other factors
Other factors
Other factors
Other factors
Other factors
Other factors
Other factors
Other factors
Other factors
21

Annexure- 4.5: Frequency distribution of priorities ascertained by the intervieweeFactors Priority Weightage Factors Priority WeightageOther factors
Other factors
Other factors
Other factors
Other factors
Other factors
Other factors
Other factors
Other factors
Other factors
Other factors
Other factors
Other factors
Other factors
Other factors
Total Weightage 28.50
Number of Respondents 15.00
Average Weightage 1.90
22

1 | P a g e
CHAPTER-1
INTRODUCTION
1.1 BACKGROUND OF THE STUDY
Bangladesh is predominantly an agriculture based country. Presently the major share of
GDP comes from the non agricultural sectors. Among all non-agricultural sectors,
industry is the most prominent. The industrial sector is likely to grow over the next
decade raising its contribution to the country’s GDP to 30 to 35 percent. Share of
employment in this sector is expected to increase to 35 percent of national employment
over this period (K.A. Saleque, 2008).
Being the capital of Bangladesh, Dhaka witnessed a steady industrial development over
the last few decades. Being the capital of Bangladesh Dhaka posses a glorious history of
almost 400 years. The city had its first master plan in 1959. Master plan of 1959 had
rightly addressed the crucial issues and requirements for better living of the people as
well as of economic development of the area. Proposed industrial zones in Tongi,
Tejgaon, Postagola and Narayanganj were separated from potential areas of residential
development (Minoprio, 1959).
After the independence in1971, all activities were concentrated in Dhaka. There has been
a drive by Bangladesh Small and Cottage Industries Corporation (BSCIC) to decentralize
the industrial development trend to least developed areas of the country. But that drive
was proved to be a failure as quoted by Mondal, (1985) “The fiscal incentives provided
by the government for the dispersal of industries over the less developed area seem to be
both inadequate and ineffective due to lack of supporting facilities. It appears that the
gain due to fiscal and other concessions is overly out weighted by the loss due to the
absence of infrastructural facilities except where raw materials have become crucial
factor” (Hossain, 1992). The other cities of the country Chittagong, Khulna, and Rajshahi
were not given proper attention. As a result, gas supply network has developed mainly in
Dhaka and Chittagong.
Dhaka city is closely accessible by both railway and water communication. Such facilities
enhance the rapid and easy supply of raw materials and other equipments to the industrial
sites. Industries located on the bank of Buriganga utilized the waterway to get supply of
raw materials and to deliver the finished goods. Rail route also help in the movement of
finished goods. At present, transportation of the industrial products is also carried through
2 | P a g e
the developed road network linking Dhaka with other parts of the country (Hossain, 1992)
considering infrastructure facilities; Dhaka has become more and more attractive to the
industrialist.
A change in the location preference is evident with the emergence of garment industries
in Dhaka. Some of the residential areas of Dhaka have turned into mixed industrial and
residential areas. Hundreds of Ready Made Garments and other small industries started to
grow in Malibagh, Moghbazar, Mohammedpur and Mohakahlai even in planned
residential areas like Banani and Mirpur areas over the last three decades (K.A. Saleque,
2008).
In the meantime Dhaka Metropolitan Development Plan (DMDP) was undertaken by
government (1995). Jurisdiction of DMDP area covers almost 590 sq miles and policies
were stated for different land uses. DMDP structure plan policies for manufacturing
industries derived largely from the locational tendencies which have prevailed over the
last thirty years (1965-1995) in Metro Dhaka. The trend of industrial development has
reflected market force and the choice of individual private sector. One of the distinct
locational tendencies of the past twenty years, from 1975 to 1995, has been a gradual
northerly shift of industrial activities, particularly to peripheral areas away from city
center, most notably into Savar upazila in the north-west. Whereas, in the south, the
industries of Narayanganj faced severe decline of number of industries particularly the
jute industries. With upgrading of the Dhaka-Chittagong National Highway and gradual
decline of port facilities, Narayanganj lost its importance as an industrial area (Mott
MacDonald Ltd. 1997).
The DMDP consultants have forecasted the northerly shift of industries and proposed four
Special Incentive Zones. The Special Incentive Zones are Savar Municipality area,
Dhamsona and Kashimpur Area, Gazipur Municipality and Tongi Municipality as
indicated by Structure Plan (Figure-4.1, page-52). Apart from these, another special area
was indicated in Tetuljhora and Hazratpur union parishad of Savar and Keraniganj
Upazila for the shifting of Tanneries from Hazaribagh. Other than this, DMDP
discouraged the development of new industrial estates considering its past experience
with other Industrial Estates. As a result, many industries have developed in an unplanned
manner, haphazardly spreading within the city area and sub-urban areas like Hemayetpur,
Tetuljhora, Savar Municipality, Nabinagar, Joydebpur Chourasta, Gazipur Municipality
and Tongi Municipality following better and faster transportation linkages and
availability of cheap labor (BETS et al, 2006).

3 | P a g e
The major work on industrial location has been carried out by economists attempting to
integrate location into main body of economic theory. However industrial location is
concerned with spatial relationships. The resulting contributions have aimed at providing
an all-embracing system of pure rules of location, attempting to derive the optimum
location for industries. The analysis is structured around three approaches to industrial
location theory:
a) The least cost approach, which attempts to explain location in terms of the
minimization of factor cost;
b) Market area analysis, where there is more emphasis on the demand, or
market factors;
c) The profit maximization approach-the logical outcome of the other two.
These three umbrella approach provide a useful framework for the analysis of the
theoretical approach to industrial location (Glasson, 1982)
There are some pull factors like transport network, availability of cheap and suitable land
and labor, also influence the location of industries.
A push factor has to be involved as well as a set of pull factors related to the new
location. These push factors may involve cost elements (wages, access costs, the value of
land and property in alternative use and property tax) or direct constraints (Land use
planning controls, pollution controls etc) (Townroe, 1991). So these factors will have to
be considered while analyzing the factors.
Industrial location is very important for transportation, environment, and economic
aspect; so proper attention should be given to it. Very few research works was found
focusing on the location of industrial development. Among these, two dissertations were
conducted for specialized industries of Bangladesh in 1992 and 1993 (Huda, 1993). So
this study has an aim to have comprehensive idea about industrial development trend
within Dhaka Metropolitan Area. According to Census on Manufacturing Industries
(CMI) classification there are three categories of industries categorized on the basis of
labor intensiveness. The first category industries are the Handloom Establishment with
10+ persons, the second category Medium Scale Manufacturing Establishments with 10
to 49 persons and the third category is Large Scale Manufacturing Establishments
(without handloom) with 50+ persons (Bangladesh Bureau of Statistics (BBS) 2007).
The last category is the most labor intensive one and these are the Large Scale
Manufacturing Industries. This industries create significant impact on employment
generation, production of goods, waste generation and transportation system i.e.

4 | P a g e
infrastructure. This can be said that industries in the last category create more spatial
impact than the previous ones. So this study creates the opportunity for the author to
examine the spatial distribution pattern and development trend of industries, analyze the
factors that influence the past and present trend and thereby recommend how to direct this
haphazard industrial development into a sustainable development.
1.2 OBJECTIVES OF THE STUDY
The aim of this study is to study the spatial distribution pattern of industries of Dhaka
Metropolitan Area as well as to analyze the factors influencing the location choice for
these establishments. It will also investigate compatibility of the present trend of
industries with Dhaka Metropolitan Development Plan (DMDP). The objectives of study
are
I. To study the spatial distribution pattern and development trend of industries
within DMDP area.
II. To analyze compatibility with DMDP structure plan and urban area plan and
the factors influencing industrial location choice.
This study will reveal the location tendency of industries considering the spatial
distribution and development trend of industries within DMDP area. It will also indicate
the tentative future location of Industries considering the Strategic Transport Plan (STP)
proposal and Detailed Area Plan (DAP) infrastructure proposals.
1.3 METHODOLOGY
1.3.1 Selection of the Study Area
The main focus of industrial development in Bangladesh is Dhaka and it is happening in a
very haphazard and unplanned manner (South, 2009). So this study is focusing on Dhaka
and the Dhaka Metropolitan Development Plan (DMDP) area will be considered as the
study area. This area is extended up to Keraniganj, Narayanganj Sadar, Bandar and
Sonargaon in the south, Rupganj and Kaliganj in the east, Gazipur Sadar in the north and
Savar thana in the west.
1.3.2 Literature Review
Books, journals, research papers, seminar papers were collected and reviewed to have a
preliminary knowledge about the factors and locational theories related with industrial
development. Reports and writings on various industrial policies were also collected and

5 | P a g e
studied. Locational works so far completed on industries including Textile Dyeing and
Printing Industries, Drugs and Pharmaceuticals’ industries and light engineering
industries were also collected and studied.
1.3.3 Data Collection from Primary Sources
After making the total number of industries available from secondary sources, a checklist
was prepared to find out the number of industries which were established after 1997. It
was found that around 841 industries were established after the year 1997. Among these
industries, 60 were picked up with 95% confidence level and 12% confidence interval.
These industries were chosen randomly from those geographical locations, where
structure plan prohibits industrial development specially areas for Agriculture and in
some cases areas of sub-flood flow zone and main flood flow zone. Special consideration
was given to interview the red category industries.
1.3.4 Data Collection from Secondary Sources
Data on the location of industries, type of industries, and their year of establishment was
collected from Rajdhani Unnayan Kartipakkha (RAJUK’s) Survey data used for the
preparation of Detailed Area Plan (DAP). This Data was used to identify the
geographical location of the industries. Apart from this, this study is focused on the Large
Scale Manufacturing Establishments (Establishment with TPE [Total Person Employed]
50-99 & 100+). The Report of Establishment of 2005 was used to collect the total number
of industries engaging more than 50 persons with in DMDP area.
1.3.5 Data Analysis
Data collected from the questionnaire survey was entered into Statistical Package for
Social Survey (SPSS) for further analysis. This analysis was further related with the GIS
data to prepare map of surveyed industrial clusters. Apart from these, the geospatial
industrial data was used to identify the distribution pattern of those industries. This was
done using “Hawths Analysis Tools” in the ArcGIS 9.2 platform.
1.4 SCOPE OF THE STUDY
The study analyzes distribution of Industries and their development trend within Dhaka
Metropolitan Development Plan Area. This study includes the identification of
6 | P a g e
incompatible land-uses with the DMDP in terms of industrial development and also the
identification of the factors influencing location and growth of industries.
1.5 LIMITATION OF THE STUDY
The study is based on secondary and primary sources data. It was assumed that the survey
data would contain the specific information like type of industries and their names along
with their geographical location. But after going through in details of the survey data
required information were found missing as the Terms of Reference for that project did
not make it mandatory to collect all these information. Though, it has been tried to fill the
gap using data from the Report of Establishment Size TPE 50-99 & 100+ of 2005.
Another limitation of the study is the shortage of data regarding year of inception of
industries in the Report of Establishment Size TPE 50-99 & 100+ of 2005. Around
11.92% industries were found missing in the year of inception field which ultimately
effect the trend analysis a bit.
1.6 ORGANIZATION OF THE THESIS
In writing the research on the spatial development trend of industries within Dhaka
Metropolitan Development Plan (DMDP) area a total of 5 chapters required to include
and present all the research result and writings.
Chapter-one discuss background of the study, objectives, methodology and possible
outcome of the study.
Chapter-two describes the industrial location theories, various location factors prominent
in industrial sector and various location studies.
Chapter-three is about attaining the objective one. In this chapter it was tried to show the
trend of industrial development as well as the spatial and temporal distribution pattern of
industries within DMDP.
Chapter-four is about attaining the objective two. It was tried to find out the compatibility
of industrial development with the DMDP and identify the factors that influenced the
location choice.
Chapter-five presents recommendations and conclusion for formulating policies to guide
and control the development of industries.

7 | P a g e
CHAPTER 2
INDUSTRIAL LOCATION THEORIES AND MAJOR FACTORS
INFLUENCING INDUSTRIAL GROWTH
2.1 INTRODUCTION
Theoretical base is very important for any research work. To conducting a research on
spatial development trend of industries within DMDP area, it need to follow certain steps
like reviewing different industrial location theories, location studies conducted in the
context of Bangladesh and Dhaka and the review policies related to industries location
decision. Moreover it is very important to study the factors which influence the location
choice decision by entrepreneurs.
2.2 INDUSTRIAL LOCATION THEORIES
Industrial location study is an important branch of economic geography. To enrich the
subject researchers are being done for long by planners, economists, geographers and
social scientists. Three types of theories on location of industry have been categorized so
far. These are as follows:
1. Classical theories
2. Neo Classical theories
3. Behavioural theories
Ricardo, Von Thunen and J.S. Hill are the fore-runners in this line of researches. These
research works have been categorized as classical theories. Others who are prominent
among the classical theoreticians are Weber 1909, Christaller (1933), Hoover (1946) and
Losch (1954). All of them added in the development of location theories by modifying
the previous research works.
After the era of Neo-classical theoreticians those who have contributed in the
development of industrial location theories are Tornquest (1962), Wood and Taylor
(1969). They have been categorized as Neo classical theoreticians.
The third category of industrial location theories prominently called as Behavioural
Location theories. Those who worked in the development of these theories are Pred
(1967), Smith (1977), Dicken (1971) and Keeble (1976). They emphasized and related
industrial location with human motivation and actions.
Von Thunen is the pioneer who tried first to establish theoretically a base for location of
economic activity. Von Thunen developed his theory from his long experience of

8 | P a g e
agricultural farm management at Mecklenburg near the city of Rostock. Von Thunen who
was basically an agriculturist put a theory that relates concentric zones of different uses
forward of land to form about an urban centre.
Alfred Weber (1990) was the first researcher who presented a comprehensive work on
industrial location and formulated a theory of industrial location. Although, some of his
ideas were formulated 20 years earlier by another German Launhardt by name (Pinto
1977). Launhardt applied Geometric principles basically developed by Halford
Mackinder to the study of location of certain industries. Weber worked for the location of
firm, the key unit of modern industrial unit. Weber's basic principle was that a
businessman would choose a location where his cost would be least. Three factors were
considered as determinants for industrial location. These are (i) transport cost (ii) labour
cost and (iii) agglomerative or degglomerative factors. Weber's model has been criticised
for his assumption such as constant transport and production cost, perfect competition
with all firms having access to unlimited demand and for its disregards of institutional
factors. Hoover (1948) tried to eliminate the weakness of Weber’s model dividing cost
into transport and production. He also emphasized on institutional factors and confined to
least cost approach. Losch realized that optimum location is the place of maximum profit
(Glasson 1974) and considered (a) no spatial variation in the distribution of factor inputs
(b) uniform population densities and constant tastes and (c) no locational interdependency
of firms. Briton Harries (1960) showed that market demand varies between different
locations in USA using a simple index of gravitational potential. Recent theoretician like
Isard and Greenhut in particular remoulded the Loschian theories into a profit maximising
approach stating that location point will be there where profit is maximized. John Glasson
(1974) stated that mobile firms seeking to identify the major location factors are as
follows:
a) Labour-quality and quantity
b) Transport and Communication
c) Sites and Premises
d) Government aid
e) Environment factors in the wider sense.
John Glasson did not consider other important factors of industrial location decisions like
(i) Services (ii) Utilities Taxes (iv) Chance (v) Management (vi) Training and (Hi)
consultancy and (vii) Political instability.
9 | P a g e
Smith Nullified the classical theory by saying it as desk bound (Smith 1971) and
emphasized on the real life situation and approached to another important direction of the
industrial location research.
2.3 INDUSTRIAL LOCATION STUDIES IN THE CONTEXT BANGLADESH
A few number of research works has so far been conducted on industrial location. Among
the researchers in Bangladesh those who have added a little in this line of inquiry are Aziz
(1980) Chowdhury and Iqbal (1981), Mondal (1985), Khan and Chowdhury (1987),
Hossain and Qasim (1993).
Location of brick fields in Dhaka city was presented by Aziz (1980). In his research he
identified some of the location factors influencing brick fields. On completion of the
survey and subsequent analysis he obtained some result indicating related factors of
influence and their weightage. This report reveals road access as the most important
factor identified by maximum number of person and proximity to market has been
identified by none as the most important factor. In this regard, it has been pointed that
bricks are sold from the Brick fields with some exception of markets like that of Pagla
brick market and brick market at Demra Ghat. This is the reason why proximity to market
were identified as important factor by none. Transport cost of raw material for brick field
is less as clay is an easy available material within a short distance. But transport cost of
fuel and delivery of bricks require transport to reach at the sites. This is the reason why
nearness to road and waterway occupies a good position as principal factor.
Chowdhury's (1981) research objectives were to identify the factors responsible for
location of the existing textile industries and the efficiency of these locations in the
context of development of the country.
The report shows that Dhaka has got the maximum number of textile spinning and
weaving mill. As Dhaka is the capital of Bangladesh, therefore it has some extra facilities
like infrastructure, nearness to wholesale market, more or less regular supply of
electricity, access to waterway and administrative facilities, access to highway, railway
and waterway etc. Other areas didn’t have such facilities and that was the reason for
backwardness with respect to existing number of textile industries (Iqbql 1981).
Another significant approach by behavioural scientists in the study of industrial location
analysis is deductive and inductive model to arrive at a general theory of industrial
decision making. These attempts have added a little to the overall knowledge of industrial
location phenomenon (Khan 1987).

10 | P a g e
Main points to be noted are the personal contacts and information linkages in deciding the
location of an industry. Continuous researches are being done by the researchers for
industrial location decisions. Locations of large manufacturing industries are found to be
a major factor for establishment of ancillary industries over the surrounding areas due to
development of the agglomeration economy mentioned earlier. This theory has been
formulated by Par roux.
Research work by BIDS (May, 1987) on industrial estate program of BSCIC presented an
assessment of the work of the industrial estates for generating industrial growth. BSCIC
industrial estates are restricted locations for development of the SCI sectors. Industrial
estate program by BSCIC has been taken from the national and international records as to
its beneficial effects of location for SCI, which are planed developed and are with
continuous administrative support. Development includes provision of infrastructure
facilities with continuous administrative facilities for providing services, technical
cooperation and allocation of plots at subsidized rate for the establishment and
enhancement of small and cottage industries. Research paper published by UNDP and
UDD reported the ineffective and inadequate incentive policy provided by the
government of Bangladesh. Government target for uniform development throughout the
country by developing industrially the less developed areas are being hampered due to
lack of inadequate supporting facilities. Transportation problems are acute in many less
developed areas. Although fiscal incentives have been declared and provided by the
existing industrial policies but the net gain of these facilities are being grasped by the
poorly developed or lack of infrastructure facilities and other supporting conditions. Only
the places prominent in availability of raw materials are showing different pictures.
Another research report on the pattern of industrial location and its determinants in
Bangladesh has been submitted by BIDS (October, 1989). Here industrial locations have
been analyzed by two approaches e.g. (i) geographic and (ii) economic.
The paper analyzed the location of industries for old districts on the basis of industrial
employment in each district. Attempt has been made to calculate the degree of
concentration with urban rural breakdown. The research report limited its
conceptualization to Coefficient of divergence and advantage ratio. Coefficient of
localization is a better tool than coefficient of divergence as it indicates the locational
pattern of industries more directly and precisely. The report indicated the highest
concentration recorded by Dhaka districts followed by Chittagong (12981) and Khulna
(1974) districts. Report revealed that concentration of industry helps reap the benefits of

11 | P a g e
agglomeration but also give rise to various costs. It reduces private costs but heightens
social costs.
Research work on location of Drugs and Pharmaceutical industries in Bangladesh has
been presented by Shamima Huda in her Unpublished M.U.R.P thesis. In her study intra
and inter regional analysis have been done for the regions of Dhaka, Barisal and Pabna on
aspects like periodical growth in different areas of Drug industries, land, labour cost,
source of raw materials, profitability and transport of communication, public services etc.
The study evaluated the development of industrial policies and weakness of the policies
on aspects of location of industries. The study reviews the location of drugs and
pharmaceutical industries under the frame work of the industrial policies in different
times. The study also recommends a desirable policy package for attracting investors to
establish drug units in less or least developed areas.
Another unpublished MURP, BUET thesis paper by Hossain (1993) has been worked out
in determining the factors influencing location of textile dying and printing industries in
Bangladesh. Division wise distribution of textile dying and printing industries and
concentration ratio of the same in three development areas were determined. Ranking of
the factors influencing the same industry for the three areas for example developed, less
developed and least developed areas had been done. Relevance of location theories to the
textile dying and printing industries in Bangladesh had also been discussed. Suggestion
recommendation and guide lines had also been presented for setting up of new textile
dying and printing industries in future.
2.4 INDUSTRIAL LOCATION STUDIES IN THE CONTEXT OF DHAKA
METROPOLITAN DEVELOPMENT PLAN (DMDP) AREA
Only two research works have so far been conducted on industrial location of Dhaka
Metropolitan Development Plan (DMDP) Area. Research conducted by Khan (1996) on
factors influencing location and growth of light engineering industries in Dhaka and
another one is the DMDP (1995) where there was separate working paper on Economic
Base Studies (DMDP working Paper-14).
The study of Khan (1996) determined the factors influencing location of light engineering
industries in Dhaka city. It was tried to identify the light engineering industrial clusters in
and around Dhaka and then focused mainly on Dholaikhal and Zinzira. The work was
mainly focused on the findings of the questionnaire survey which was carried out to
identify the factors which influenced the location decision for establishing light

12 | P a g e
engineering industries. The factors were given weighted score based on their priority and
a detailed matrix was prepared to identify the most important factors of location choice
for both the area. Moreover it tried to compare the common and uncommon factors of
these two areas based on their total weighted score.
The DMDP structure plan policies for manufacturing industry derived largely from
location tendencies which had prevailed for the past twenty to thirty years in metro
Dhaka. In general terms, these tendencies had reflected market forces and the choice of
individual private sector interests and companies. One of the most marked locational
tendencies was gradual northern shift of industries during 1975 to 1995. Considering
these tendencies it identified four areas that were covered by Least Development Status
for which changes are proposed and these specific locations were given the Special
Incentive Zone Status (Map-4.1). Being historically an important industrial area
Narayanganj was losing its importance for industrial development in the emergence of
better road transport facilities to the other part of the metro. So Narayanganj was given
the status of Special Rehabilitation Incentive Zone. DMDP has also reviewed the
industrial estates of Tejgaon and Tongi. Regarding these two industrial estate DMDP
consultants have pointed out that these two estates were not yet properly utilized so the
allotment for industrial plots may be redistributed. They recommended not proposing any
new industrial estate within the Structure Plan Period. It was there prescription that
industries should be located in such places which require minimum public sector
investment in land acquisition and provision of infrastructure and other public service
provision (Mott MacDonald Ltd. 1997). Among numerous reason for establishing
industries else where, they identified the labour unrest in these industrial estates. It
encourages the establishment of foot-loose industries in the Special Incentive Zones as
designated in DMDP. But Special recommendations were there about the polluting
industries not to locate anywhere in the zones. DMDP also give impetus importance on
environmental protection and preservation of ground water. It aims at incremental up
gradation of system to reduce environmental pollution. But there is some inconsistency in
the policy. It is suggesting four special incentive zones but discourages development of
industrial estates. It encourages foot-lose industries to be established in the four incentive
zones through relaxing the requirements for manufacturing industries to locate in large,
pre-designed industrial zones. In this case DMDP is encouraging sprawl industries
development.

13 | P a g e
2.5 POLICIES AND NEED FOR RESEARCH ON INDUSTRIAL LOCATION.
Concentration of industries in particular areas in developing countries has generated
enormous pressure on policy makers to control or direct industrial growth. In the past
there has been generally no public control exercised to determine in what part of a
country a new industry should be established. In some cases this has led to economic and
social conditions which have tendered to react unfavorably on the community as a whole.
Now many industrial location policies exist to influence the location patterns of
industries. This is not surprising since, “The true determinants, forces of urbanization and
spatial concentration in developing countries are found in the forces that determine the
location of employment opportunities, the nature and pattern of industrialization, the pace
of agricultural development and the growth of transportation and communication
network” (World Bank, 1979, p.76), within a area, work place locations tend to influence
residential locations and travel patterns. Therefore, policies that influence employment
location will affect the overall spatial development patterns of the area. Particular
attention has been given to location patterns of manufacturing activities on the
assumption that manufacturing is the driving force behind regional development. This
assumption is in line with the theory that the development of certain manufacturing
activities determines the development of other industries in a region and is followed by
population growth and then by the emergence of service sector activities (Lowry 1964).
Industrial location policy is an important devise to reduce the regional disparity in the
level of employment and income. In order to control the industrial development in
particular centers and to induce industries to backward regions or areas, some short of
deliberate industrial location policies are usually adopted, such as zoning regulations,
outright prohibition of certain economic activities in particular areas and various fiscal
incentives to induce industrial and population to depressed areas.
2.6 FACTORS INFLUENCING INDUSTRIAL LOCATION AND GROWTH
There are many factors influencing industrial location and growth. These factors are of
various types and factors prominent in one area differ from that of other places with
varying degrees due to surrounding environment and other situation. Some factors are
physical in nature and some are socio economic in nature. General factors responsible for
growth of the light engineering industries are (1) market for raw and finished product (2)
labour availability and cost (3) capital (4) communication (5) mode of transport (6)
infrastructure development (7) geographic condition (8) environmental factors and others.
14 | P a g e
Analysis of industrial development shows that nature of industrial development has a
close relation with the prominent factors than the less prominent factors for an area.
Again some factors are more or less common to all areas and some are uncommon. A
brief description of the factors influencing industrial location has been given below
2.6.1 Accessibility to Market:
Accessibility to market is very important for industrial establishment. Market may be
local, regional, or international. Some areas lack accessibility to market due to geographic
position and infrastructure facilities or it may be due to other factors of transportation
facilities like non-availability of bus, truck, rickshaw, push cart etc. Transportation cost is
also a factor for accessibility to market from costing point of view. Again besides
availability of transport and communication facilities longer distance may hamper
accessibility due to longer travel time. Besides the above points discussed so far, one may
not get access to markets due to other reason like undisclosed contract among the buyers
or businessman to take goods at a very cheap cost hampering the profit margin.
2.6.2 Accessibility to Raw Materials:
Accessibility to raw material is also a very important precondition for industrial
establishment, although, service industry do not require major raw material for
production. Nearness to source of raw material has a great significance in choosing the
location of an industry. Cost of raw materials, supply of raw material and quality of the
raw material influence the location and growth of an industry. Generally industries are to
be established near the source of raw materials for less seen durable or putrescible goods
e.g. food industry.
2.6.3 Availability of Labour
Labour is one of the major factors influencing location and growth of all types of
industries. Availability of skilled labour, technically trained labour, unskilled labour and
labour cost are considered in locating industries. Some industries like weaving mills are
found to occur abundantly in some specialized areas like Pabna, Tangail and Dhaka due
to availability of labour in large number with cheap wage rate. Planners, economists and
engineers dealing with industrial planning are interested much about this factor

15 | P a g e
2.6.4 Capital
Among the important factors influencing location and growth capital bears a great
significance. Without Capital no one can think of establishing an industry. Bank loan is
not easily available and if it is available then also remains problem of in sufficient loan
and this is the general scenario of the whole country. Amount of capital greatly influences
the location of an industry. Large capital enables more in establishing industry at
expected places than that of small capital. Capital may be of two Types e.g. (i) Fixed
capital and (2) working capital. Fixed capital includes value of land; building, machinery
etc. concentration and dispersal of industries are influenced by cost of raw material and
capital. Working capital includes overheads for 3 month generally.
2.6.5. Transport and Communication
Transport factors are taken as important locational determinants. Industries not well
connected to market suffer a lot both with respect to availability and transportation of raw
materials and finished product resulting in stagnation of production. Location of industry
is chosen generally at a point where cost is less and profit is more. There are three system
of transportation e.g. (i) land transportation (ii) water transportation (iii) air
transportation.
i. Land Transportation:
There are two ways of land transportation. These are (a) railway and (b) highway. Among
this roadway transportation is more important and used more by the industrialist due to
flexibility. Transportation of goods by railway is cumbersome due to various reasons like
official process for booking and releasing goods. It is also a lengthy and time consuming
system. Transport modes which are used in high way are bus, truck, car, scooter, tempo,
rickshaw van etc in carrying goods.
ii. Water Transportation
Water transportation is the cheapest of all the transportation system and have low risk of
accident. Cost of maintenance of waterway and transports are minimum compared to
other modes of Transport and this is the reason why industrialist prefer to set up
industries by the side of water way. Among the water transport are boat, launch, steamer,
cargo etc.
iii. Air Transportation:
Air transportation is the quickest way of all the transportation system if the official
process and time for booking and releasing is not considered. Industrial transportation is

16 | P a g e
not generally accomplished by this process due to high cost of transportation. Besides all
these it has an importance in the context of industrial location decision.
2.6.6 Infrastructure Facilities
Provisions of infrastructure facilities are considered deeply in location decision for
industrial establishment. Without adequate infrastructure facilities one cannot even think
of setting industries. Infrastructure facilities may be categorized under the following
heads:
i. Site development
ii. Communication facilities
iii. Supply of utility facilities
i. Site Development
Development of industrial plots influences highly in location decision of industry. A
developed site is always attracted by industrialists. Land development cost is considered
in location decision.
ii. Electricity
Electricity is a prime requirement for most of the industries. Places with regular supply of
electricity are always attracted by industrialists. High rate of electricity is a problem for
industrialization. Generated electricity is getting importance day by day to large
industries, although its initial costing is high but total cost benefit ratio is lesser.
iii. Supply of Gas:
Supply of gas for many industries is essential and without it production cannot go on if it
is used as raw material. Proximity or accessibility to gas is therefore an important and
essential requirement in location decision of industry. Inadequate and high rate of gas is a
problem. Liquid gas is also used where supply of gas is not available.
iv. Water Supply
Accessibility to water supply is an important factor in establishing industries. Water is a
prime requirement for some industries like tannery, textile dyeing and printing industry
and these industries in most cases use water from river, canal etc. and disposes water to
the same and therefore accessibility of these industries to water flow is essential. Some
time iron content of water hamper industrial production. All these things are duly
considered in location decision.
v. Accessibility to Telephone
17 | P a g e
Accessibility to telephone is essential for quick communication with concerned persons
or places, clients or customer, raw material market, finished products markets for quick
dealings. Therefore telephone line is considered in industrial location decision.
2.6.7. Agglomeration and External Economy
Sometimes large industries situated at distant places motivate other industries alike or
different, to be set up at close proximity thus creating an industrial environment.
Afterwards this industrial environment creates several facilities which influence industrial
location decision.
The facilities are
i. Transfer of economy arising from saving in transport cost
ii. Internal economies of scale large enough to create an industrial town
iii. Localization economies to firms of like character.
iv. The external economies of scale available to many unlike industries which reduce
cost as different industries have developed in one place.
The whole process may be termed as urbanization economy. Advantages include a pool
of labour with particular skill and special educational facilities, allied and ancillary
industries etc. All these benefits together present considerable cost advantages over
alternative locations.
2.6.8 Government Policy
Government policies for industrialization have strong impact upon location decision. Less
and least developed areas are attractive if sufficient incentives are provided by
government. Restriction may also be applied for certain areas for particular industries etc.
2.6.9 Historical Accident or Personal Preference:
There are certain examples of industrial location choice. Basis of these choices may not
be attributable to economic reason. Personal preference may sometimes affect industrial
location decision. Historical accident may also effect location decision. A case of
historical accident is the place of birth of the founder of the first pharmaceutical
enterprises namely M/S Edruc Ltd by some Mr. Abdul Hamid at Pabna.

18 | P a g e
2.6.10. Environmental Factor
Environmental factors like climate and landscape or perhaps the wider concept of the
total environment are growing attraction for some new lighter industries such as
computers, electronics and research establishment, which are less constrained by raw
materials and transport factors. Other major determinants that are included in the leading
environmental factors are school, housing, roads and town centre.
2.7 CONCLUSION
A number of locational theories have so far been developed by theoreticians. These are
1. Classical theories
2. Neo classical theories and
3. Behavioral theories etc.
All these theories identify some general factors responsible for industrial location and
growth. Major factors which are very general for location and growth of industries which
have been discussed in this chapter are access to market, access to raw material, and
availability of labor, capital, communication, infrastructure facilities, agglomeration and
external economy etc. Importance of these factors varies from one place to another but
influences of these factors are unquestionable.

19 | P a g e
CHAPTER-3
ANALYSIS OF DEVELOPMENT TREND AND SPATIAL DISTRIBUTION
PATTERN OF INDUSTRIES
3.1 INTRODUCTION
This chapter discusses the industrial development trend and spatial distribution pattern of
industrial development with in Dhaka Metropolitan Development Plan (DMDP) Area.
The industrial trend analysis started from 1903 to 2005 and it was divided into four
periods i.e. the British period (1903-1947), the Pakistan period (1948-1971), the Pre
DMDP Bangladesh Period (1972-1997) and the Post DMDP period (1998-2005). The
spatial distribution pattern of industries was analyzed with the survey data of Detailed
Area Plan (DAP) project of RAJUK and the data extracted from the Report of
Establishment, 2005 under two broad geographical areas. The total DMDP area was
divided into Dhaka Metropolitan Police (DMP) and area outside DMP.
3.2 DEVELOPMENT TREND OF INDUSTRIES SINCE 1903
Dhaka’s first ever large scale manufacturing industry was established in 1903. Till the
British period only 4 industries were there in this category. But in the year 2005, there are
around 2465 number of large scale manufacturing industries.
Figure 3.1: Trend of industries within DMDP area
Until Bangladesh period Dhaka and its surroundings have experienced very low level of
industrialization but started to grow rapidly after the independence (Figure 3.1).

20 | P a g e
Within the DMP area, the number of industries in a year first time crossed 10 in the year
1972 and with a decrease in the years 1973-74 it again started to rise sharply with another
fall in 1976. It started rising again from 1978-80. In the year 1976 the number of
industries outside DMP area first time crossed the number of industries in DMP and it
continued until 1996 with one exception in 1984 (Figure 3.1). The year 1997 was the
approval year of DMDP and after that there should not be any new industries within DMP
area. But from that year the number of industries within the DMP area started to dominate
over the area outside DMP which was a complete violation of the DMDP structure plan
policy.
.
3.2.1 Trend in British Period
The first industry was established in 1903 at Shyampur, Dhaka in the British period and
till 1947, only four industries of this category were established (Bangladesh Bureau of
Statistics (BBS) 2007). Shyampur, Tejgaon, Lalbagh and Hazaribagh were the four
localities having one large scale manufacturing industry each in the British period.
There were no industries outside the DMP area in the British Period.
3.2.2 Trend in Pakistan Period
The Thana wise industrial development trend is discussed according to two broad and
identical geographic areas i.e. the Dhaka Metropolitan Police (DMP) area and outside
DMP area that are within DMDP. The DMP area experienced a little boost in the
industrial sector during the Pakistan period. The highest number of industries established
in a year was only four which took place in the year 1965, 1968 and 1969 (Figure 3.2).
Amid this period (1948 to 1971) there have been no industries in the year of 1949, 1951,
1954 and 1955. Dhaka district had experienced a continuous development trend after the
year 1955 with minimum of one industry each year.

21 | P a g e
Figure 3.2: Trend of industries within DMP area in Pakistan Period
Figure 3.2 is showing irregular development trend during Pakistan period. There were no
industries in Kamrangir Char, Mirpur Cantonment, Sabujbagh, Gulshan, Dhamrai, Dhaka
Cantonment, Khilgaon, Mohammadpur, Kotwali, Kafrul, Uttara, Mirpur, Ramna, Badda,
Savar, Motijheel and Dhanmondi thana during the Pakistan period. Other thanas like
Demra, Pallabi, Tejgaon, Sutrapur, Hazaribgh, Lalbagh and Shyampur experienced the
touch of industrialization. Two Industries were established in Hazaribagh (1953 and
1969), Sutrapur (1968) and Tejgaon (1960).
Industrialization process just started in outside DMP area during this period. The first
industry was established in Gazipur Sadar Thana in 1952 (Figure 3.3). From 1953 to 1959

22 | P a g e
there have been no new industries in the Outside DMP area. Gazipur experienced its
second and Kaliganj its first industry in 1960.
Figure 3.3: Trend of industries Outside DMP area in Pakistan Period
Throughout this period there have been no industries in Savar Thana. In the year 1962,
Bandar had two new industrial establishments where as other thanas like Keraniganj,
Narayanganj Sadar, Rupganj, Sonargaon had one industry each. After a pause of two
years (1963-64), the Outside DMP area showed rapid growth till 1965 and afterwards
steady growth till 1968. The growth started to decline rapidly in the year 1969 till 1971.
Analyzing Figure 3.2 and 3.3 it become clear that the industrial development of DMDP
area started to decline after the year 1969 and the cause was nothing new; it was the
political instability of the country during that period.
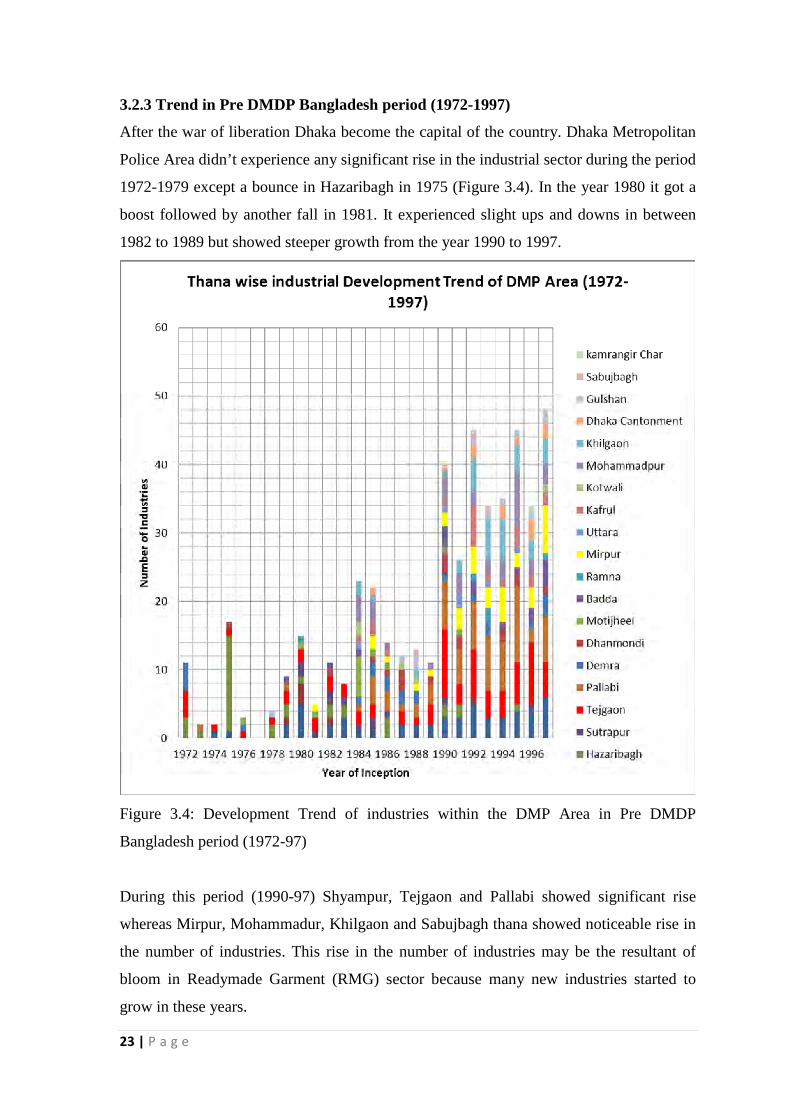
23 | P a g e
3.2.3 Trend in Pre DMDP Bangladesh period (1972-1997)
After the war of liberation Dhaka become the capital of the country. Dhaka Metropolitan
Police Area didn’t experience any significant rise in the industrial sector during the period
1972-1979 except a bounce in Hazaribagh in 1975 (Figure 3.4). In the year 1980 it got a
boost followed by another fall in 1981. It experienced slight ups and downs in between
1982 to 1989 but showed steeper growth from the year 1990 to 1997.
Figure 3.4: Development Trend of industries within the DMP Area in Pre DMDP
Bangladesh period (1972-97)
During this period (1990-97) Shyampur, Tejgaon and Pallabi showed significant rise
whereas Mirpur, Mohammadur, Khilgaon and Sabujbagh thana showed noticeable rise in
the number of industries. This rise in the number of industries may be the resultant of
bloom in Readymade Garment (RMG) sector because many new industries started to
grow in these years.

24 | P a g e
The Area outside DMP is showing more industrial development compared to the DMP
area development. It experienced the steady growth of industrialization from the year
1977. It experienced steep curve from 1977 to 1980 and continued its growth till 1990
with two major depressions in 1984 and 1987. After the year 1990 the industrial growth
of Area outside DMP started to decline very slowly.
Gazipur Sadar is showing very slow and steady rise in the number of industries during the
period of 1972 to 1989 with some noticeable bounce in the years of 1980, 1982, 1985 and
1988. The noticeable matter in this trend graph (Figure 3.5) is that Kaliganj thana had its
last industry in the year 1978 and completely lost its glory as an industrial location. After
the year 1989 Gazipur Sadar experience sharp rise till 1992 and it remained steady till
1995. After the year 1995 the trend experienced a sharp fall till 1997.
Figure 3.5: Development Trend of industries within the area outside DMP in Pre DMDP
Bangladesh period (1972-97)

25 | P a g e
Narayanganj Sadar showed very slow start after the liberation and the trend was negative
during the period 1973 to 1975(Figure 3.5). There were no industries in the year 1976 and
it went high up to 18 industries in the year 1980. After the year 1980 the number of
industries started to rise steadily till the year 1991 with some ups and downs. After wards
it experienced drastic fall up to the year 1992 and it had another drastic rise in 1993
followed by same drastic fall in 1994. After 1994 the number of industries started to rise
steadily till 1997. Savar thana had its first ever Large Scale Manufacturing industry in the
year 1976. From 1977 to 1991 there was irregular trend of new industrial establishments.
It showed steady growth from the 1992 and continued till 1997. Keraniganj thana showed
its irregular trend all over this period with steady trend from 1990.
The most noticeable trend was the domination of Narayanganj Sadar over other thanas of
Savar, Sonargaon, Rupganj, Keraniganj, Kaliganj and Bandar though Sorargaon thana
showed drastic jump in the year 1985.
3.2.4 Trend in Post DMDP period (1998-2005)
Dhaka Metropolitan Development Plan (DMDP) was accepted and approved with its two
part The Structure Plan (Volume-I) for the whole area and The Urban Area Plan
(Volume-II) for the then urban areas by the Government of Bangladesh (GoB) in the year
1997. There has been a sixty days public hearing on both the volumes of DMDP. After
addressing all feedback from different level of society; the DMDP team finalized all the
reports and maps. So the DMDP was the first ever document which was vetted by the
stakeholders (Public Sector, private sector and individual owners).
The Dhaka Metropolitan Police (DMP) Area maintained the steady industrialization that
she gained in the pre DMDP period (Figure 3.4). It showed slight downward slope from
1998 to 1999 and again sharp upward slope till the year 2000 (Figure 3.6). The number of
industries drooped again in the year 2001 and 2002 with another sharp rise again in 2003.
It had the most drastic fall in 2004 with another rise in 2005.
This trend shows that Shyampur, Tejgaon, Pallabi, Badda, Mirpur, Uttara, Kafrul and
Khilgaon thana are occupying the highest number of the industries from 1998 to 2005
whereas other thanas like Hazaribagh, Demra, Dhanmondi, Motijheel, Ramna,
Mohammadpur, Dhaka Cantonment and Gulshan are showing diminishing industrial
development trend.
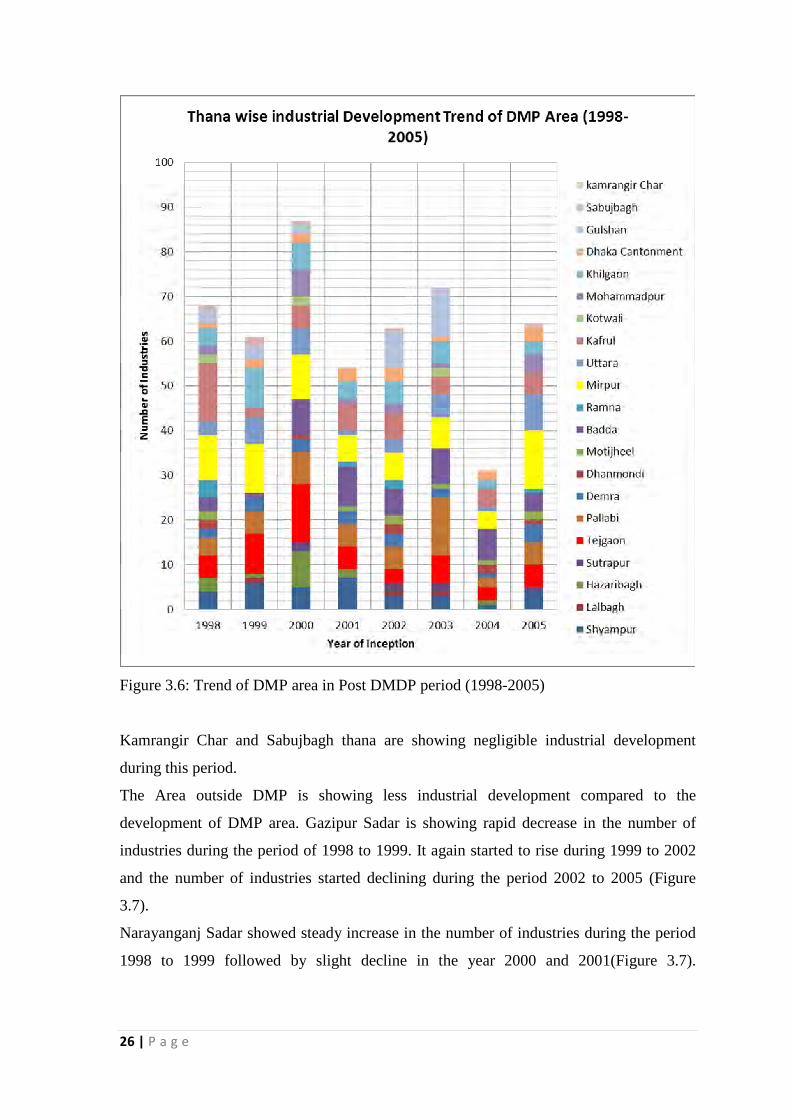
26 | P a g e
Figure 3.6: Trend of DMP area in Post DMDP period (1998-2005)
Kamrangir Char and Sabujbagh thana are showing negligible industrial development
during this period.
The Area outside DMP is showing less industrial development compared to the
development of DMP area. Gazipur Sadar is showing rapid decrease in the number of
industries during the period of 1998 to 1999. It again started to rise during 1999 to 2002
and the number of industries started declining during the period 2002 to 2005 (Figure
3.7).
Narayanganj Sadar showed steady increase in the number of industries during the period
1998 to 1999 followed by slight decline in the year 2000 and 2001(Figure 3.7).

27 | P a g e
Afterwards it continues to decrease in the number of industries and it turned into 0
industries in 2003.
Figure 3.7: Trend of Area outside DMP in Post DMDP period (1998-2005)
In the Pre DMDP period Narayanganj Sadar dominated over the other thanas which is
absent in this period. In the last two years Bandar and Rupganj thana showed some new
establishment whereas Sonargaon Thana had only one new industries in the last year.
Savar thana is occupying the highest number of the industries from 1998 to 2005 whereas
Keraniganj is in the second highest in terms of industries. Savar had a slight fall in 1999
followed by gradual rise in the number of industries till the year 2004. After 2004, the
number of new industries became one third of its 2004 number. Keraniganj had its steady
decline in the number of industries till 2000 followed by steady rise in the number up to
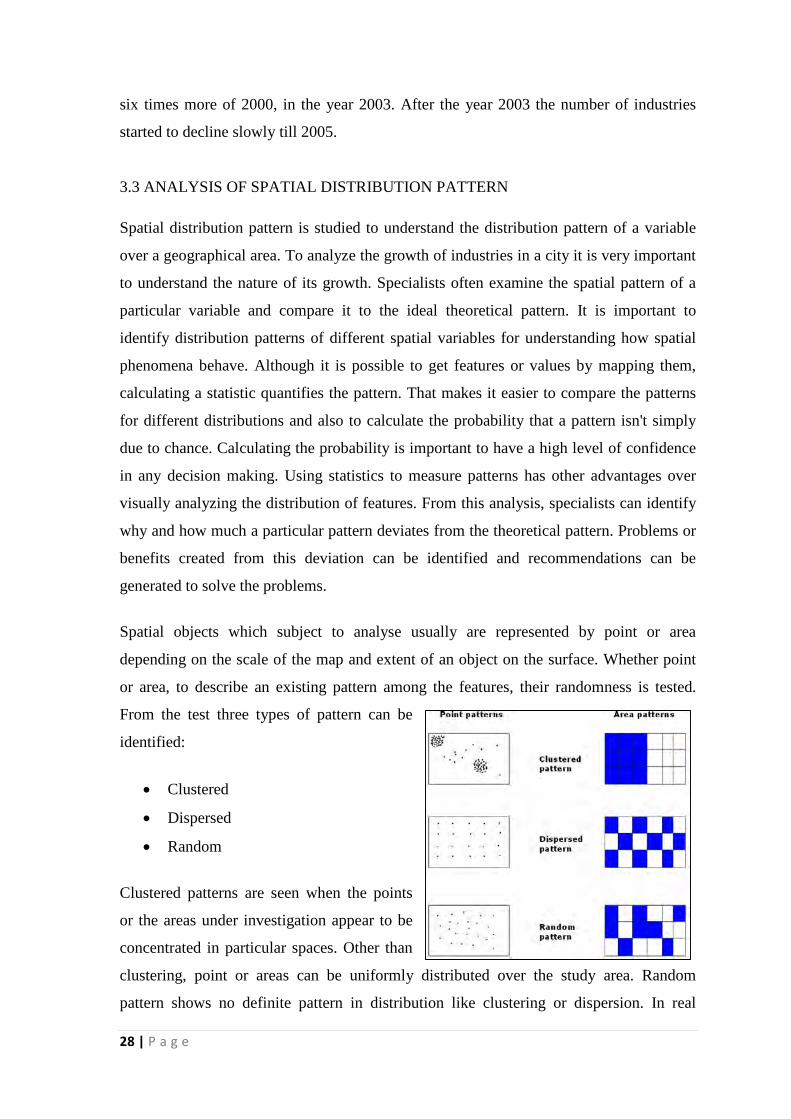
28 | P a g e
six times more of 2000, in the year 2003. After the year 2003 the number of industries
started to decline slowly till 2005.
3.3 ANALYSIS OF SPATIAL DISTRIBUTION PATTERN
Spatial distribution pattern is studied to understand the distribution pattern of a variable
over a geographical area. To analyze the growth of industries in a city it is very important
to understand the nature of its growth. Specialists often examine the spatial pattern of a
particular variable and compare it to the ideal theoretical pattern. It is important to
identify distribution patterns of different spatial variables for understanding how spatial
phenomena behave. Although it is possible to get features or values by mapping them,
calculating a statistic quantifies the pattern. That makes it easier to compare the patterns
for different distributions and also to calculate the probability that a pattern isn't simply
due to chance. Calculating the probability is important to have a high level of confidence
in any decision making. Using statistics to measure patterns has other advantages over
visually analyzing the distribution of features. From this analysis, specialists can identify
why and how much a particular pattern deviates from the theoretical pattern. Problems or
benefits created from this deviation can be identified and recommendations can be
generated to solve the problems.
Spatial objects which subject to analyse usually are represented by point or area
depending on the scale of the map and extent of an object on the surface. Whether point
or area, to describe an existing pattern among the features, their randomness is tested.
From the test three types of pattern can be
identified:
Clustered
Dispersed
Random
Clustered patterns are seen when the points
or the areas under investigation appear to be
concentrated in particular spaces. Other than
clustering, point or areas can be uniformly distributed over the study area. Random
pattern shows no definite pattern in distribution like clustering or dispersion. In real

29 | P a g e
world, geographic objects, point or area, do not usually show any particular pattern rather
shows a combination of patterns. These patterns show tendencies to be purely random
towards clustering or dispersion. But for human establishment, patterns can be identified
as clustered, dispersed or random resulted either form conscious planning or spontaneous
growth of cities. These three patterns can be shown in diagram 2.1.
3.3.1 Point pattern analysis
In maps a lot of elements are depicted by points depending on the scale of the map. Point
pattern analysis is done primarily to determine the form of the pattern of these points.
Through point pattern analysis a researcher uses a quantitative tool to examine the spatial
arrangement of points over a space by a dot map.
There are various tools for analysis point pattern. This are-
Nearest neighbor analysis
Quadrat analysis
Kernel distance analysis
To analyze how the industries are located or distributed Quadrat analysis and Kernel
distance analysis are used mostly where the geographical data of features are available as
point GIS shape files. But Kernel distance analysis has certain limitation; it cannot
handle data of more than six thousands which made it impossible to analyze all the point
data of the study area at one run (There are over twelve thousands point feature within the
study area). So Quadrat analysis is the only tool that can be used to analyze the spatial
development pattern. The method of Quadrat Analysis is described below:
Quadrat analysis
Quadrat analysis is an alternative method for analyzing patterns of points. In nearest
neighborhood process the focus is on the spacing of the pints. But Quadrat analysis
divides the whole study area into smaller areas and examines the frequency in various
parts. The Quadrats or cells can be square cells or circular cells. For determining the
pattern frequency of points in each cell is determined. If each Quadrat contains same
frequency of points then it can be said that points in that study area are perfectly
dispersed. On the other hand if there is large variability in the frequencies then the points
can be arranged in a clustered pattern. Moderate frequency variability shows random
distribution. The following diagram shows the patterns:

30 | P a g e
Figure 3.8: Pattern of points in Quadrat analysis
But instead of this descriptive method an index is used for better representation of pattern.
The index is known as the Variance- mean ratio of cell frequencies denoted by VMR. For
calculating mean the simple formula of mean is used.
Mean cell frequency = n/m where n= number of points
m= number of cells
For calculating variance the following formula is used.
Variance= (∑fiXi2- [(∑fiXi2)/m])/ (m-1) where fi= frequency of cell with i points
Xi= number of points per cell
Now, VMR = Variance/ Mean.
In a Poisson distribution it is assumed that the distribution is random. So in case of a
Poisson distribution the variance- mean ratio is 1 as the mean frequency equals the
variance of the frequencies. So when VMR value is closer to one it can be said that the
points are distributed randomly. Again in case of dispersion the frequencies of the cells
will be similar and variance will be low. In extreme cases of absolute dispersion variance
will be 0. Thus for dispersed distribution VMR value will be 0< VMR <1. On the other
hand for clustered distribution, variance of cell frequencies will be large relative to mean
and will give a VMR value greater than 1.
Along with this descriptive index, a goodness of fit or χ2 test is also applied to determine
whether the observed frequency differs significantly from the expected frequency of cells.
The test statistics is defined as follows:
χ2 = VMR (m-1), where m= number of cells
The null hypothesis for this test is generally considered as no difference between
Perfectlydispersed
Highlyclusterd Random

31 | P a g e
observed and expected frequency or in another word the distribution of points shows a
total randomness. Null hypothesis can be rejected if the point pattern is more clustered
than random giving a VMR value greater than 1 or when the point pattern is more
dispersed than random giving a VMR value less than 1. The corresponding p- value from
VMR - value is calculated through a p-value calculating program found in the web- link
“http://www.graphpad.com/quickcalcs/pvalue1.cfm”. The Chi- square test and the
corresponding p- value determine whether this difference is significant or not. A large
VMR value will produce a larger Chi- square value and a small p- value. This suggests
that the observed frequencies vary largely and the distribution is clustered. On the other
hand a small VMR value will yield a smaller Chi-square value and larger p value
indicating more dispersed distribution. Intermediary values of Chi- square from VMR
values closer to 1 suggests that the distribution is actually random, thus the null
hypothesis cannot be rejected.
From this goodness of fit test any researcher can confidently interpret the result of the
descriptive index VMR along with the support of the Chi- square value (McGrew and
Monroe, 2000).
Another aspect influencing the result of Quadrat analysis is the size of the grids
superimposed on the map. The ideal practice suggests examining with different size. But
in practice an optimum size is widely used. The size of the cells in grid should be 2A/n,
where A is the area of the space under study and n is the number of points. It is twice the
area surrounding any point on the space. Thus there is greater chance of having grids with
at least one point than grids with no points at all. Therefore if a distribution appears
random using this size it will be random using any other cell size. Thus it enhances the
strength of the goodness of fit test.
Quadrat analysis in ArcGIS Platform
Quadrat analysis is another very well-known process for identifying patterns in points.
For the purpose of superimposing grids on maps and then calculating the points within
polygons, ArcGIS Desktop 9.3 software has been used. The process is described below:
Quadrat analysis process using ArcGIS Desktop 9.3
The process is done in following steps:

32 | P a g e
1. Opening a new ArcMap window
Start menu All Programs ArcGIS ArcMap.
Figure 3.9: Blank Window in ArcMap, ArcGIS Desktop 9.2
2. Add DPZ map and location of industries to ArcMap window
Add Data Specify DMDP_boundary.shp/Industries_all.shp location
Select Shape file
Add.
Figure 3.9: ‘Add Data’ button (left) and Add Data window (right) in ArcMap, ArcGIS
Desktop 9.2
3. Calculate and position the centroid points of industries_all layers using Hawth’s Tools
(an extension software of ArcGIS Desktop 9.3)

33 | P a g e
‘Hawth’s Tools’ is an extension of ArcGIS that performs basic statistical and spatial
analysis operations. After installing the extension, it should be enabled first by following
the under-mentioned procedure:
Tools Extensions Hawth’s Analysis Tools (check it).
Figure 3.10: Enabling extension (Hawth’s Analysis Tools).
After enabling the extension Hawths Tools is ready for performing further operations.
Calculation and positioning of the centroid point are done by following:
Hawth’s Tools Vector Editing Tools Generate Polygon Centroid
Points.
This command will show ‘Generate Polygon Centroid Points’. In this window the ‘Input’
parameter will take any shape file which contains polygon/polygons and the ‘Output’
parameter need to be filled up with output file name and location. From between two
alternatives, ‘Label Point’ is selected rather than ‘Centroids’ because it generates centroid
points inside the polygons.

34 | P a g e
Figure 3.11: Generate Polygon Centroid Points using Hawth’s Analysis Tools.
4. Map area calculation:
Map area is calculated by following the under mentioned procedure:
DMDP_boundary.shp right click Open Attribute Table Select Area
field right click Statistics Sum
If the field value ‘Area’ is absent from the attribute table it should be formed first.
Area field creation and area field calculation is given as follows:
DMDP_boundary.shp right click Open Attribute Table Options
Add field Name of the field Type Double Precision
Scale Ok
Figure 3.12: Graphical Output of Adding a field value to attribute table

35 | P a g e
To calculate the area of the shape file:
Right click newly added field Calculate Values Field Calculator
Check (Advanced) Pre Logic VBA Script Code type the visual basic
code at first text box.
Dim dblArea as double
Dim pArea as IArea
Set pArea = [shape]
dblArea = pArea.area
Area dblArea
5. Quadrat Size and Dimension Calculation:
Quadrat Size = (2*Area)/n
Square Quadrat Dimension = sqrt (quadrat size)
6. Grid Overlapping:
Hawth’s Tools Sampling Tools Create Vector Grid Extent
(DMDP_boundary .shp)
Spacing between lines (Grid Dimension) output file name and location
Ok
7. Count points in polygon:
Hawth’s Tools Analysis Tool Count Points in Polygon Input
polygon layer Input Point Layer Output file name Ok.
Figure 3.13: Graphical Output of counting point in polygon

36 | P a g e
8. Frequency Calculation:
DMDP_boundary.shp Attribute table Options Select by attribute
Query buildup Select.
Findings:
Table-3.1: Table showing the summarized findings below
Total DMDP
Area(A) sqm
No of industrial
structure points (n)
Quadrant
size (2A/n)
Square Quadrant
Dimension ((√
(Quadrat Size))
Quadrant no
(Q)
1429319457 12205 234218.6738 483.96 9071
From the quadrat calculation it is found that VMR value is greater than 1 (Annexure-
3.1), so the distribution patterns of industrial points are clustered than random over the
DMDP areas.
Inferential Analysis (P-value calculation):
VMRChi Square =
VMR(m-1)
Degree of
freedom =
(Total
observation - 1)
P-Value Remarks
44.87202 406989.2184 12204 0.0001 Clustered
Interpretation:
From the test statistics it is found that a large VMR value produces comparatively large
Chi Square value and smaller p-value that suggests greater variability of the cell
frequencies and clustered arrangements of points. Here calculated p-value is 0.0001
which is almost close to 0 and makes the distribution pattern clustered.

37 | P a g e
3.4 SPATIAL DISTRIBUTION OF INDUSTRIES
According to the Bangladesh Census of Manufacturing Industries 2001-2002, three are
three stratums of industries. This study is focused on the Large Scale Manufacturing
Establishments (Establishment with 50+ persons). According to the Census Report 2007,
there were 7,944 large scale manufacturing industries in the year 2001-2002 (Bangladesh
Bureau of Statistics (BBS) 2007). In the Report of Establishment TPE 50-99 & 100+
updated up to 2005, there are 2,465 industries within Dhaka Metropolitan Development
Plan (DMDP) Area which were geographically categorized in terms of thana. According
to these data more than 30% of large scale manufacturing industries of the country are
located within DMDP Area. It reflects that Industrial agglomeration is identical within
DMDP area. In most of the cases same type of industries are located in close vicinity. For
example, tannery industries are all located in Hazaribagh area. Within DMP Area, the
Ready Made Garments industries are concentrated in Mirpur, Badda and other areas
though their concentration was significant in and around Maghbazar and Malibagh areas
in the early nineties. Some agglomeration of dying industries is seen in Savar, Tetuljhora
and Kashimpur area polluting the water of nearby khals like the Beximco Khal,
Karnapara Khal etc. Outside DMP area the major agglomeration of RMG is in the
western and northern part of the DMDP area. In the western part areas like Tetuljhora,
Savar, Biralia, Ashulia, yearpur of Savar thana and Kashimpur, Basan and Kayaltia of
Gazipur Sadar thana are the major concentration of RMG. Some composite industries are
there in these areas. There are a number of agro based, food manufacturing, metal
products, Hosiery, chemical, plastic, pharmaceuticals and textile industries are there in
Shiddhirganj, Fatullah, Enayetnagar , Demra, Kutubpur, Gognagar of Shiddhirganj,
Fatullah, Demra and Narayanganj Sadar Thana. The eastern part Tarabo union of
Rupganj Thana shows significant concentration of RMG industries.
3.4.1 Distribution of Industries within DMP Area.
Being the capital and located in the center of the country, Dhaka has always been the
most attractive location for industrial development. In addition to that Dhaka
Metropolitan Police attracted all sort of industries through providing transportation
facilities, skilled and cheap labor, agency cooperation, availability of unskilled and very
cheap labor, Gas, Electricity, Water Supply and a huge concentration of consumers.

38 | P a g e
Figure 3.14: Thana wise distribution of industries within DMP area.
Dhaka Metropolitan Police Area comprised of 21 thanas (Banglapedia, 2009). Among all
thanas of Dhaka Metropolitan Police (DMP) some thanas are historically important
industrial areas specially the areas like Hazaribagh, Kotwali, Shyampur, Sutrapur.
Table-3.2: Thana wise distribution of industries in DMP Area (Since 1903 to 2005)
SI No. Name of Thana Number of Industries1 Badda 642 Cantonment 303 Demra 444 Dhanmondi 275 Gulshan 586 Hazaribagh 627 Kafrul 668 Kamrangir Char 19 Khilgaon 7610 Kotwali 1111 Lalbagh 1312 Mirpur 10513 Mohammadpur 5114 Motijheel 2515 Pallabi 12116 Ramna 1817 Sabujbagh 10

39 | P a g e
SI No. Name of Thana Number of Industries18 Shyampur 101
19 Sutrapur 2620 Tejgaon 13421 Uttara 51
Grand Total 1094Source: Report of Establishment TPE 50-99 & 100+, BBS-2007
But their share seems to be very insignificant when it shows the distribution since 1903 to
2005 for these particular labor intensive large scale manufacturing industries (Figure
3.14). It is showing more and more concentration of industries in the newer part of the
city (Table-3.2). The main cause of this distribution is the emergence of Ready-made
garments (RMG) since the early eighties. The RMG sector requires special infrastructure
provision to carry its goods in a faster manner. So, the industrial owners have followed
the new and widened transport infrastructures to establish their industries to avail
mobility in transporting their raw and finished materials. The old part of Dhaka seriously
lacked behind providing mobility to freight transport whereas new areas of the city
provided new inner city circulation network like Progati Soroni, Rokeya Soroni, Mirpur
road, Satmasjid road, Asad Avenue, New Airport road, New Circular road (Map 3.1).
These roads offered greater mobility for freight transport. As a result the new industries
were mostly concentrated on Badda, Demra, Gulashan, Kafrul, Khilgaon, Mirpur,
Mohammadpur, Pallabi and Uttara has flourished as industrial areas. Table-3.2 is showing
that Tejgaon is accommodating the maximum whereas Kamrangir Char is
accommodating the minimum number of industries during 1903 to 2005.

40 | P a g e

41 | P a g e
3.4.2 Distribution of Industries within Area outside DMP
The area outside the Dhaka Metropolitan Police (DMP) was always second to DMP area
in terms of industrial development until the year 1976. From the year 1976 to 1996 the
industrial development of areas outside DMP took the lead kicking back the DMP area.
3
Figure 3.15: Thana wise Industrial Distribution of areas outside DMP.
The DMP area again took the lead after the 1997 till 2005 except the year 2004 where the
number of industries outside DMP area was much higher than DMP area.
Figure 3.15 is showing thana wise total number of industries from 1903 to 2006. The 3rd
highest number is seen in Savar thana and Keraniganj in the 5th highest among all the
nine thanas that are outside DMP area.
Gazipur is well connected with Dhaka, Mymensingh, Tangail, Narshingdi district. It is
crisscrossed by three major arteries; the Dhaka-Mymensingh road and Gazipur Tangail
Road and Nabinagar-Tangail road. So infrastructure was always a positive factor for
Gazipur. Gazipur sadar thana had attracted a lot of new industries whereas Kaliganj has
lost its glory as an industrial area. The Famous Muslim Cotton Mills is clinically dead and
there are no other new industries in this area.

42 | P a g e

43 | P a g e
Table-3.3: Thana wise industrial distribution of areas outside DMP
SI No. Name of Thana Number of Industries
1 Gazipur Sadar 377
2 Kaliganj 3
3 Bandor 23
4 Narayanganj Sadar 438
5 Rupganj 147
6 Sonargaon 43
7 Savar 218
8 Keraniganj 122
Grand Total 1371Source: Report of Establishment TPE 50-99 & 100+, BBS-2007
Table-3.3 is showing a huge difference between Gazipur Sadar and Kaliganj thana in
terms of number of large scale manufacturing industries established up to 2005.
There are five thanas in Narayanganj. Among these five, two thanas are experiencing low
level of industrialization due to their geographical location. Bandar and Sonargaon thanas
are just opposite to the river Shitalakshay. These two thanas are linked with Dhaka only
with the Dhaka-Chittagong highway. Rupganj thana is accommodating the 4th highest
number of industries. Among all the nine thanas outside the DMP area Narayanganj Sadar
is accommodating maximum number of large scale manufacturing industries.
Introduction of new national highways like Dhaka-Chittagong highway, Dhaka-Sylhet
highway, Dhaka-Aricha highway, Dhaka-Mymensing highway, Dhaka-Maoa road and
Gazipur- Tangail roads created the opportunity to have better access and mobility in the
areas outside DMP (Map 3.2). Map 3.2 is showing the spatial development pattern of
industries within DMDP and shows that the industrial agglomeration is found in cluster
along these roads.
3.4.3 Location of Red Category Industries
The Department of Environment (DoE) has certain industrial classification. There are
three major classification; the green categories, orange categories and red. It furthermore
divided the orange category into two categories; Orange-A and Orange-B (Clemett,
Unknown). Among all these categories red category industries are the most hazardous
industries which are mostly responsible for water and air pollution in their surrounding
areas. These industries supposed to treat waste water before discharging them into nearby
drainage outlet. According to DoE Law all these polluting industries must have their own
effluent treatment plant (ETP) and it supposed to monitor this issue regarding waste water

44 | P a g e
disposal. But it is a matter of regret that DoE could not perform its job properly which
results regular discharge of huge quantity of waste water into the nearby channels. The
River inside DMDP area is the ultimate outfall of these canals or khals. A World Bank
study said four major rivers near Dhaka – the Buriganga, Shitalakhya, Turag and Balu —
receive 1.5 million cubic metres of waste water every day from 7,000 industrial units in
surrounding areas and another 0.5 million cubic metres from other sources (South, 2009).
This reference showed a very alarming situation for Dhaka Metro Area. Keeping this in
mind this research did the additional work to identify the red category industries and to
relate them in the real world context to find out the factors behind the location decision
tendencies.
It has been tried to categories the red, orange-A and B and green industries from survey
data of Detailed Area Plan Project of RAJUK. Here some problems were faced to identify
their category because the database was prepared considering the industrial classification
used in Census on Manufacturing Industries. The industrial census classified sector does
not match directly with DoE category. To minimize this problem each and every
industries were judged using industrial category of DoE. Sometimes it was very easy to
identify the red, orange or green industries considering their given category and sometime
the identification was done by names of respective industries.
Table-3.4: Number of Industrial Structures Categorized by DoE Classification
Categories Number of Industrial Structures % of Total
Green 6,905 56.57
Orange-A 856 7.01
Orange-B 1,501 12.30
Red 2,934 24.04
Undefined 10 0.08
Total 12206
Source: Survey Data for the Preparation of Detailed Area Plan for RAJUK
Table 3.4 shows that around 24% of the total structures used for manufacturing purpose
are used as red category industries. The overall industrial classification is shown in Map
3.3. Another map (Map 3.4) was prepared showing the location of red category industries
within DMDP area. In many cases, these industries are located in places nearer to a
drainage outfall like khals, rivers and sometimes near to drainage outlet like ditch or low
laying areas.

45 | P a g e
The overall industrial classification is shown in Map 3.3

46 | P a g e
(Map 3.4) was prepared showing the location of red category industries within DMDP
area

47 | P a g e
It is seen from the map 3.4 that many of the red category industries are located near the
river and khals and some near low laying areas that are connected to khals or river.
Figure 3.16: Share of Red Category Industries located in DMDP indicated Residential
Areas and Flood Flow & Agriculture Zones.
Figure 3.16 showed the fact that around 76% of polluting industrial structures are located
within the DMDP structure plan area indicated as Existing Urban Area, New Urban Area,
New Urban Land Development and Peripheral Urban Development areas which is
prohibited according to DMDP Structure Plan. According to DMDP Structure Plan the
hazardous industries must be established outside the locality and they should not dispose
any waste without treatment. According to this guideline the industries has be located
away from locality which eventually indicates the red category industries to be located in
the Flood Flow, Sub-Flood Flow Zone, High Value Agriculture Zone and Agriculture
Zone. But the permitted land uses in these zones doesn’t allow hazardous industries at all.
So there is ambiguity in the Structure Plan Policy related to industrial development within
DMDP area.

48 | P a g e
3.4.3.1 Red Category Industries and Location of Water bodies
According to the table 3.4 there are 2934 structures used as red category industry out of
12,206 structures related to manufacturing activities. This study wanted to focus further
more on the location of Red category industries with respect to proximity to rivers, khals
etc. There are 1150 red category structures within 250 meter proximity from the River
and Khals where as some 560 structures are within 100 meter proximity (Figure 3.17 and
3.18 and Map 3.5).
Figure 3.17: Share of Red Category Industries within 100 meters Proximity of Rivers &
Khals.
Figure 3.18: Share of Red Category Industries within 250 meter Proximity of Rivers &
Khals.

49 | P a g e
50 | P a g e
3.5 CONCLUSION
This chapter analyzed the development trend of industrial development and also analyzed
the spatial distribution pattern within DMDP area.
The Major Findings related to trend analysis and spatial developments are:
The trend analysis showed that Dhaka Metropolitan Police area was pioneer in industrial
development since 1903. The “Area outside the DMP” took lead over DMP area from
1976 to 1996 with a declining tendency from the year 1990. The industrial development
of the DMP area was rising with some insignificant but sharp fall from the year 1990. So
it can be concluded from the trend analysis of pre-DMDP Bangladesh period; the decline
in number of industries in “Area outside DMP” is supplemented by new industries in the
DMP area.
The trend analysis of post-DMDP Bangladesh period showed sharp decline in the number
of industries in the “Area outside DMP” in the year 2005 whereas the DMP area is
showing sharp rise at the same time with cumulative decline in the total number of
industries.
Though the development trend in DMP area is rising up from the year 1990 to 2005, the
total share of industries is higher in the “Area outside DMP”. There are some factors like
improvement of transportation system and provision of utilities like gas and electricity for
this development.
Quadrat Analysis method was used to identify how the development of these industries
occurs. In this analysis the calculated p-value was 0.0001 which is almost close to 0 and
makes the distribution pattern clustered. So the industries within DMDP area highly
clustered.
The red category industries are the hazardous polluting industries. There is a policy that
they has to be located outside locality which means their establishment can take place in
areas like the Flood Flow Zones and the Agriculture Zones. But these zones don’t permit
the development of hazardous industries at all. So there is a conflict between the Structure
Plan Policy and development control mechanism. These conflict need to be resolved by
the development authority soon.

51 | P a g e
CHAPTER-4
LOCATION COMPATIBILITY WITH DMDP AND INFLUENCIAL FACTORS
4.1 INTRODUCTION
To find out the incompatible industrial development, the Structure Plan policy of DMDP
was studied and it has been tried to locate the incompatible industrial development.
Factors that influenced this incompatible industrial development were revealed from the
questionnaire survey which was conducted among top officials of those industries which
have violated DMDP regulations. About 60 officials were interviewed.
4.2 LOCATION WISE COMPATIBILITY OF INDUSTRIAL DEVELOPMENT
WITHIN DMDP
Dhaka Metropolitan Development Plan (DMDP) Structure Plan is a policy level plan and
it had addressed the issue of industrial development in its policy. Structure Plan analyzed
the industrial trend of past 30 years and tried to apprehend the trend of development. It
observed a gradual northern shifting of industries from southern part i.e. Narayanganj.
Considering this apprehension, it proposed Special Incentive Zones Status for four areas
i.e. Savar, Dhamsona and Kashimpur, Gazipur municipality and Tongi municipalities
which are all in the northern part of DMDP (Map-4.1) and a Special Rehabilitation
Incentive Zone in the Narayanganj part of DMDP to help Narayanganj regain its past
glory. Following the proposal of DMDP Structure Plan; these four areas were given the
status of Special Incentive Zones for industrial development by Ministry of Industries.
But these proposed Special Incentive Zones and Special Rehabilitation Incentive Zone are
Structure Plan Indicated Existing Urban and Peripheral Urban areas. It discouraged the
development of new industrial estates because it found that the existing industrial estate
Tejgaon and Tongi totally underutilized (28% of plots were fully operational during the
DMDP study). This policy plan discouraged development of new industrial estates; it sets
some criteria for new development. It allows the non-polluting and non-toxic industries to
be built within the four incentive zones and Narayanganj rehabilitation zone. But there
were no guidelines how the new industries will be spatially distributed. As the DMDP
structure plan was approved by the Government of Bangladesh in 1997, this study only
concentrated on those industries to find the incompatibility that started after the year
1997. So, industries established after 1997 in those areas outside the DMDP proposed
Map-4.1

52 | P a g e

53 | P a g e

54 | P a g e
zones are identified as incompatible with DMDP (Annexure 4.1). According to this
criterion, 677 industries of Dhaka district, 68 industries of Gazipur District and 12
industries of Narayanganj District are not compatible with DMDP. As there was no
specific location identified for industrial development in the Urban Area Plan following
Structure Plan; it is further assumed that industries which are located in the designated
Flood Flow and Sub-Flood Flow Zone, High Value Agricultural Zone and Agricultural
Zone of Structure Plan are also not compatible with DMDP (Annexure-4.2 and Map 4.2).
A total of 841 new industries were established since 1998 to 2005 within the DMDP area.
341 new industries were established within the Area outside DMP which is mostly
covered by Main Flood Flow Zone, Sub-flood Flow Zone and Agriculture Zones except
some zones like Industrial Special Inceptive Zones and Special Rehabilitation Incentive
zone. Among these 341 new industries, 199 industries were located in the DMDP
structure plan designated Main Flood Flow Zone (MFFZ), Sub-flood Flow Zone (SFFZ)
and Agriculture Zones (AZ). The Distribution of new industries within these zones is
shown in table 4.1 and Figure 4.1
Table 4.1: Distribution of new industries in MFFZ, SFFZ and AZ (1998-2005).
Structure Plan Policy Number of Industries
Sub Flood Flow Zone 65
Main Flood Flow Zone 67
Agriculture Zone 67
Total 199
Source: Report of Establishment TPE 50-99 & 100+, BBS-2007
Figure 4.1: Distribution of new industries in MFFZ, SFFZ and AZ (1998-2005)

55 | P a g e
4.3 LOCATION CHOICE AND VIEWS OF INDUSTRIAL MANAGEMENT.
The main objective of the interview with the top officials of industries is to know why
they chose a different location rather than the indicated locations for industrial
development. To know the factors; first it was tried to identify which industries were
established after 1997 (DMDP was approved by GoB in 197) from the Annual Report of
Establishment Size TPE 50-99 & 100+ Updated up to December, 2005. Sector-
Manufacturing. Seven hundred fifty seven new industries were established after 1997.
From these industries, 60 industries were selected randomly for questionnaire survey with
a standard questionnaire (Annexure-4.3) 95% confidence level and 12% confidence
interval. These selected industries were chosen from geographical areas that were
prohibited for any sort of development by DMDP Structure plan. This was done using
GIS overlay of DMDP Structure Plan with survey data of Detailed Area Plan for DMDP.
The Survey Data was very helpful for identifying incompatible spatial development with
DMDP Structure Plan. The findings of the questionnaire survey are described below
following the steps of questionnaire.
4.3.1 Comparison by the Interviewee between DMDP Proposed Location and Their
Present Industrial Location
There was a section in the questionnaire asking for the comments of interviewee about
DMDP proposed location and the present location of their industries. In this section they
were asked to give comparative weight ranging from 0 to 10 to their nearby DMDP
proposed location and their present location. Here they were asked to evaluate DMDP
location and their location in terms of five factors land value, transport facility, utility
provision, security and waste water disposal (Annexure-4.3). Given weight to these five
factors for both the locations by all sixty interviewee, all the weights were summed up
(Annexure-4.4) and were presented below (Figure 4.2).4.2

56 | P a g e
Figure 4.2: Factor wise comparative weightage between nearby DMDP location and
Present location of industries surveyed
It is very interesting to see that the industrialist themselves given their opinion in favour
of DMDP proposed locations regarding these five factors. Land value, utility services,
security and waste disposal facilities have more cumulative weightage than that of their
present location. They only gave higher weightage to transportation facilities for their
present location.
The collective total weightage of five factors for DMDP proposed location and present
locations of the interviewee is showing 51% (2098) weightage was given in favor of
DMDP proposed location whereas 49% (1999) weightage was given to the present
location of their industries.
4.3.2 Industrial Sector and Mode of Transport
The industrial management personals were asked about the mode of transport they use to
transport their finished product. In this regard different sector gave emphasis on different

57 | P a g e
mode of transport. Most of them gave their response on two mode of transport and a few
on three mode of transport. The table below is showing the result of multiple responses:
Table 4.2: Multiple responses regarding use of different mode of transport
Mode of Transport Code Count % of Responses % of Cases
Covered Van 1 44 40 74.6
Truck 2 33 30 55.9
Pickup 3 13 11.8 22
Microbus 4 1 0.9 1.7
Water Vassel 5 6 5.5 10.2
Air transport 6 1 0.9 1.7
Container Mover 7 12 10.9 20.3
Total responses 110 100 186.4
Source: Interview with industrial owners or top management, June-2009.
Figure 4.3: Results of multiple responses regarding use of different mode of transport
This multiple responses figure shows that covered van is the most used mode of transport
whereas truck occupies second highest. Use of pickup (12%) is also identical followed by
the use container movers (11%). Use of water vessel is 2nd lowest (5%) and air transport
& microbus used for transport of finished product are in the lowest percentage. Another
important observation from table 4.2 is that 74.6% among 60 respondents mentioned the
use of covered van, 55.9% truck, 22% pickup and 20.3% container mover.

58 | P a g e
Table 4.3: Relation between industrial sector and different mode of transport
Type of Industrial Sector
Covered
Van Truck Pickup
Water
Vessel
Container
mover Total
Readymade garments 7 6 2 1 3 19
Pharmaceuticals 2 2 4
Food & beverage 1 1
Cotton textile 11 4 1 1 1 18
Non-metallic mineral product 1 1 2
Leather & leather product 1 1
Wooden furniture 2 2
Paper, printing & publishing 1 1
Metallic product 3 1 3
Non-metallic product 2 1 3
Agro-based industries 3 3
Grand Total 21 21 4 5 7 57
Source: Interview with industrial owners or top management, June-2009.
Table 4.3 is showing sector wise tendency of using different mode of transport for their
finished product.
The readymade garment sector uses all the mode of transport. It uses the covered van and
truck most of the time and during large shipment it uses container movers. But it appears
strange that being the cheapest of all transport modes, use of water transport is rare. The
pharmaceutical industries use both covered van and container mover equally. Food and
beverage industries use only trucks whereas cotton textile sector use mostly covered van.
Leather and leather products industries have to carry huge weight; so they depend only on
container mover. Other sectors like wooden furniture, metallic product, non-metallic
product and agro based industries use truck as their primary mode whereas very few use
pickup and water vessels. Non metallic mineral product industries like the cement
industries largely depends on large covered van and large water vessels.
So mode of transport chosen by different sector of industries depends on the type of their
finished product and their destination. And these different modes of transportation
requires different category of transport infrastructure. So the need for different mode of
transport sometimes dictate industries where to choose the location for new
establishment. The Industrial development in the Ashulia area is one example of this
phenomenon. Before the development of Tongi-Ashulia road there had been no industries

59 | P a g e
in that area but after its development the Readymade Garments and Textile industries
started to grow along that road.
4.3.3 Knowledge about DMDP
This questionnaire survey reveals that about 68% of the respondents are not
knowledgeable about DMDP. Only 32% of respondents have heard about DMDP.
Figure 4.4: Respondent’s awareness of about DMDP
Among these 32% respondents who are aware about DMDP, only 42% respondents are
aware of the indicted areas for industrial development. Finally it can be concluded that
only 13.3% of the respondent are literate about DMDP.
Figure 4.5: Knowledge about industrial areas proposed by DMDP

60 | P a g e
The cross tabulation (Table 4.4) shows that 10 out of 19 respondents who are aware of
DMDP chose another location for no reason. The remaining 9 respondents have shown
some aspects like availability of utilities, worker, land, better accessibility, nearness to
Dhaka and EPZ, nearness to linked industries, nearness to water transport and better
security as the determining factor. 30 respondents who are not aware of DMDP out of
total 41, gave no reason for choosing another location where as they gave more emphasis
on availability of low land value and skilled labour. When the respondents were briefed
about the DMDP proposed location they simply didn’t agree with that location (5% of not
aware of DMDP).
Table 4.4: Cross tabulation between factors for choosing another location and awareness
about DMDP
Source: Interview with industrial owners or top management, June-2009.
Reason for choosing location other than designated
areas
Awareness about DMDP
Yes No Total
No Reason 10 30 40
Availability of Power Supply facilities 1 1
Availability of raw materials 1 1
Availability of Utilities 1 1
Availability of Worker 1 1 2
Available Land 1 1
Don't agree 2 2
Good Accessibility 1 1
Land value & skilled labor availability 3 3
Land value is low 3 3
Near Dhaka & EPZ 1 1
Nearness to Link industry 1 1
Nearness to Water Transport 1 1
Transport & Security 1 1
Unknown 1 1
Total 19 41 60
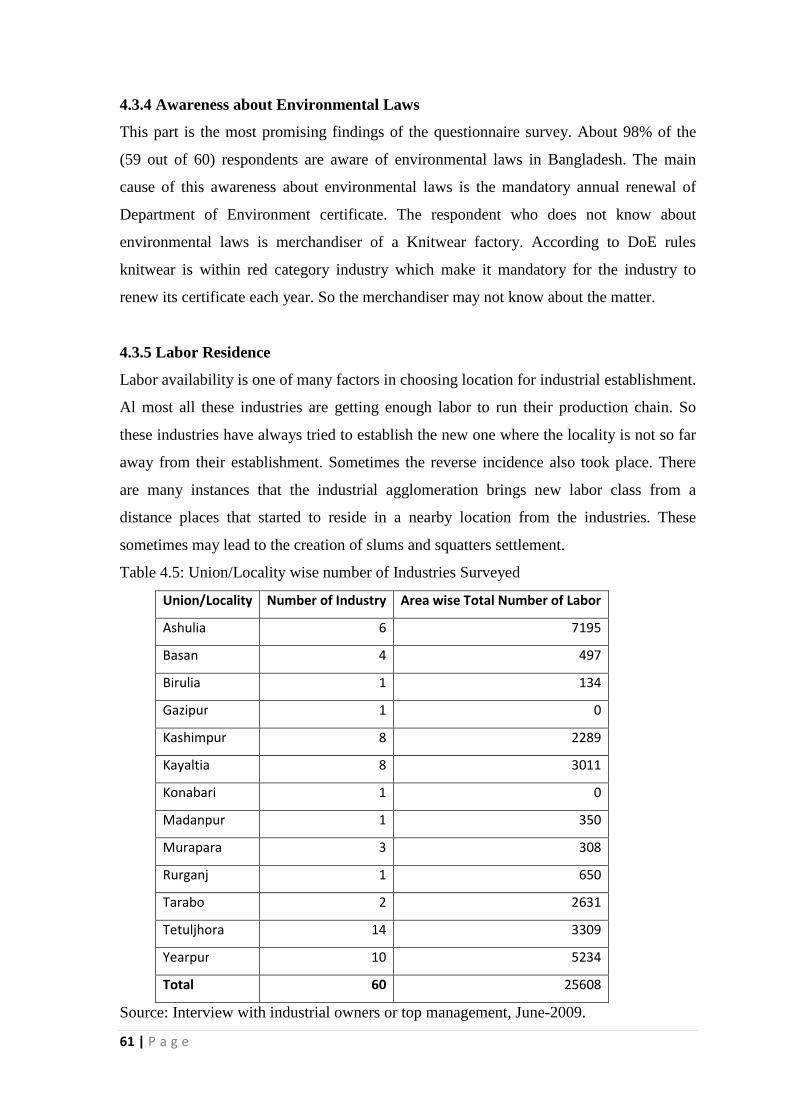
61 | P a g e
4.3.4 Awareness about Environmental Laws
This part is the most promising findings of the questionnaire survey. About 98% of the
(59 out of 60) respondents are aware of environmental laws in Bangladesh. The main
cause of this awareness about environmental laws is the mandatory annual renewal of
Department of Environment certificate. The respondent who does not know about
environmental laws is merchandiser of a Knitwear factory. According to DoE rules
knitwear is within red category industry which make it mandatory for the industry to
renew its certificate each year. So the merchandiser may not know about the matter.
4.3.5 Labor Residence
Labor availability is one of many factors in choosing location for industrial establishment.
Al most all these industries are getting enough labor to run their production chain. So
these industries have always tried to establish the new one where the locality is not so far
away from their establishment. Sometimes the reverse incidence also took place. There
are many instances that the industrial agglomeration brings new labor class from a
distance places that started to reside in a nearby location from the industries. These
sometimes may lead to the creation of slums and squatters settlement.
Table 4.5: Union/Locality wise number of Industries Surveyed
Union/Locality Number of Industry Area wise Total Number of Labor
Ashulia 6 7195
Basan 4 497
Birulia 1 134
Gazipur 1 0
Kashimpur 8 2289
Kayaltia 8 3011
Konabari 1 0
Madanpur 1 350
Murapara 3 308
Rurganj 1 650
Tarabo 2 2631
Tetuljhora 14 3309
Yearpur 10 5234
Total 60 25608
Source: Interview with industrial owners or top management, June-2009.

62 | P a g e
Table 4.5 shows that out of 60 industries 14 industries were surveyed from Tetuljhora
union, 10 from Yearpur , 6 from Ashulia and 1 from Biralia union of Savar Upazila,
Kashimpur, Kayaltia of Gazipur Sadar thana are got 8 industries each and Basan union is
locating 4 industries. Tarabo, Murapara, Rupganj Union of Rupganj Upazila have fewer.
Figure 4.6: Locality wise residence of labors of the surveyed industries
Figure 4.6 is showing the number of labors residing in each locality of all the surveyed
industries. This figure shows maximum number of labor is residing in Ashulia whereas
Yearpur is accommodation second highest number of industrial labors. Compared to
number of industries Tarabo union of Rupganj is accommodating highest average
industrial labor. Two industries from Gazipur Sadar and Konabari were not found in the
Census data the cause may be that their inception year is beyond 2005. So their number of
labor is not available.
4.3.6 Relation between Location of industries and Residence of top Management
This cross tabulation tried to relate the location of industries and the residence of the top
management of those industries. It is seen that the industrialist is much interested to
reside in Dhaka. The Top Management of Industries located in Ashulia, Savar, Tetuljhora
or even in Basan, Kashimpur, Kayaltia, Gazipur and Jamgora reside in Dhaka. Among 60

63 | P a g e
respondents top management of 43 respondents reside in Dhaka (72%). In case of other
industries located at Bandar, Murapara, Rupgonj and Tarabo the top management reside
within close vicinity to the industries.
Table 4.6: Location of Industries and Residence of Top Management
Source: Interview with industrial owners or top management, June-2009.
An important noticeable point was that, the top management of these industries didn’t
want to reside in Dhaka crossing the all time traffic congested Jatrabari point. Some
exceptions were seen in the industries of Konabari, Birulia and Tetuljhora where the top
management also resides close to the industries.
Industry
Locality
Location of Residence of Top ManagementC
ha
nd
ra
Ro
ad
Dh
ak
a
Ga
zip
ur
Hem
ay
atp
ur
Ja
tra
bar
i
Ka
nch
pu
r
Mir
pu
r
Na
ray
an
go
nj
Sa
va
r
Utt
ara
To
tal
Ashulia 5 1 6
Bandar 1 1
Basan 3 3
Birulia 1 1
Gazipur 1 1
Jamgora 1 2 1 4
Jirabo 5 1 6
Kashimpur 9 1 10
Kayaltia 8 8
Konabari 1 1
Murapara 1 1 2
Rupgonj 1 1 2
Savar 2 2
Tarabo 1 1 2
Tetuljhora 9 2 11
Total 1 3 43 1 2 1 1 1 2 3 2 60

64 | P a g e
4.3.7 Availability of Effluent Treatment Plant (ETP)
A total of 22 industries are there that generate waste water. Figure 4.7 shows that 4 out of
22 industries have effluent treatment plant but maximum number don’t have any effluent
treatment plan. This means majority of industries (82%) don’t treat the water before
discharging it to the nearby khals or waterbodies.
Figure 4.7: Percentage of Respondents to Availability of ETP
This scenario is very alarming for any environment concern personal and this cannot be a
sustainable form of industrial development. The industrialist producing not only at the
cost of raw material, capital and labor cost but also at the cost of our vulnerable
environment.
Table 4.7: Cross tabulation between industrial sectors with availability of ETP
Type of Industry Yes No Total
Readymade garments 1 6 7
Pharmaceuticals 2 2 4
Cotton textile 6 6
Paper, printing &
publishing 1 1
Metallic product 1 1
Non-metallic product 1 1

65 | P a g e
Type of Industry Yes No Total
Agro-based industries 2 2
Total 4 18 22
Source: Interview with industrial owners or top management, June-2009.
The above table shows that only one readymade garment (RMG) industry among 7 has
ETP for treating their waste water. So, about 90% of RMG sector industries are producing
their product at the cost of our environment. Another associated industry, cotton textile
industries don’t have any ETP but generating and discharging untreated waste water
thereby polluting our very scarce surface water. Among these sectors the pharmaceutical
industries showing some respect to the environment, 50% of the pharmaceutical
industries are treating their waste water.
4.3.8 Different industrial sector and renewal of Department of Environment (DoE)
Certificate
All industrial sectors do not require clearance certificate from department of environment.
Table 4.8: Cross tabulation between industrial sectors and renewal of DoE.
Type of Industrial Sector Renew in
time
Didn't
Renew
Don't
Know
No Requirement for
Renewal
Total
Readymade garments 19 1 20
Pharmaceuticals 3 1 4
Food & beverage 1 1
Cotton textile 16 2 1 19
Non-metallic mineral product 2 2
Leather & leather product 1 1
Wooden furniture 2 2
Paper, printing & publishing 1 1
Metallic product 2 1 3
Non-metallic product 4 4
Agro-based industries 1 2 3
Total 49 5 2 4 60
Source: Interview with industrial owners or top management, June-2009.

66 | P a g e
But for some industry it is mandatory to get annual clearance from the department of
environment. Industries like pharmaceuticals, textile, leather, metallic products or even
wooden furniture require annual clearance certificate from DoE.
It appears very interesting if someone try to relate the table 4.8 and table 4.7. This table
shows that among 20 RMG industries 19 have renewed their DoE certificate whereas the
previous table showed that only 1 out of 7 has ETP. The same is for the cotton textile
industries. None of the waste water producing 6 cotton textile industries has ETP but 16
out of 19 industries get renewal. These lead to some question about how these industries
are being able to renew the DoE certificate.
4.3.9 Priority of Factors influencing Location Decision
The respondents were given 23 options for choosing the most important to the least
important factor which were taken into account during selecting the location for their
present industries. The most important factor was marked as the first priority for choosing
the location whereas the least important factor was marked the lowest priority. Before
going for looking at which are the 1st or 2nd or 3rd or the 20th priority, the Summary of
response by the interviewee may be reviewed to identify which factors get the maximum
response. This can be measured by the percentage of case for each factor (Table 4.9).
Among these 60 respondents; 59 persons on responded on electric supply issue (98.3%),
56 persons responded on land value issue (93.3%), 54 on gas supply issue (90%), 53 on
skilled labour issue (88.3%), 50 persons on access to market (83.3%) and raw material
carrying cost related issue (83.3%), 48 persons on law and order situation (80%) related
issue and 47 persons on social facilities (78.3%) issue. These aforementioned factors have
more than 75% of case response which means, 75% interviewee responded on these
issues.
Table 4.9: Summary of response on different factors influencing location decision by
respondents
Sl No.Factors
Number of
Response
% of Response or
Case %
1 Land value/rent 56 93.33
2 Electricity Supply 59 98.33
3 Skilled Labor 53 88.33

67 | P a g e
Sl No.Factors
Number of
Response
% of Response or
Case %
4 Law and order situation 48 80.00
5 Gas supply 54 90.00
6 Access to market 51 85.00
7 Raw material Carrying cost 50 83.33
8 Nearness to highway 38 63.33
9 Finish product carrying cost 31 51.67
10 Fiscal incentives 21 35.00
11 Nearness to link indutries 31 51.67
12 Nearness to river 22 36.67
13 Social facilities 47 78.33
14 Nearness to the city centre 36 60.00
15 Industrial Agglomeration 30 50.00
16 Water supply 36 60.00
17 Availability of drainage outfall 20 33.33
18 Local agency Co-operation 30 50.00
19 Nearness to railway 10 16.67
20 Unskilled Labor 20 33.33
21 Nearness to airway 19 31.67
22 Other factors 15 25.00
23 Availability of drainage outlet 17 28.33
Source: Interview with industrial owners or top management, June-2009.
Factors with case percentage of 40% to 75% are local agency cooperation (50%), finished
product carrying cost (51.7%), nearness to linked industries (51.7%), water supply (60%),
nearness to the city center (60%) and nearness to highway (65%). There are some factors
which have attained responses less than 40% of cases. These factors are nearness to
railway (16.7%), availability of drainage outlet (28.3%), nearness to airways (31.7%),
unskilled labour (31.7%), availability of drainage outfall (33.3%), fiscal incentives (35%)
and nearness to river transport (36.7%).

68 | P a g e
To find out the successive priorities of different factors average weightage method was
used. The First priority was given the highest value 10 whereas the 20th priority was given
the weightage of 0.5. The Priority and its respective weightage are shown in Table 4.10.
From the SPSS data it was first derived the priority of each and every factor of all the 60
respondents and then it was arranged in 23 factor wise tables where each table contains
sixty rows for prioritizing sixty respondent’s view. After arranging all the 23 factors,
weightage for each priority was put in the weightage field.
Table 4.10: Showing Priority wise weightage for deriving the priority of factors
Priority Weightage Priority Weightage
1 10 11 5
2 9.5 12 4.5
3 9 13 4
4 8.5 14 3.5
5 8 15 3
6 7.5 16 2.5
7 7 17 2
8 6.5 18 1.5
9 6 19 1
10 5.5 20 0.5
For example factor land value/rent received 1st priority; so land value/rent factor will
score 10 whereas 4th priority from 2nd respondent was given score 8.5. After completion
of these step total weight of each factor was derived. The weighted average was derived
dividing the total weightage by the number of respondent (Annexure-4.5). This is the
weighted average for each factor. The highest priority is derived from the highest average
weightage (Table 4.11).
Table 4.11: Showing priority of each factor based on Average Weightage
Priority FactorsAverage
WeightageNo. of
Respondents
1 Skilled Labor 8.81 53
2 Land value/rent 8.49 56
3 Electricity supply 7.88 59
4 Nearness to highway 7.01 38
5 Gas supply 6.96 54
6 Law and order situation 6.95 48
7 Raw material Carrying cost 6.84 50

69 | P a g e
Priority FactorsAverage
WeightageNo. of
Respondents
8 Access to market 6.72 51
9 Finish product carrying cost 6.08 31
10 Nearness to link indutries 5.58 31
11 Social facilities 5.41 47
12 Fiscal incentives 5.31 21
13 Nearness to the city centre 5.28 36
14 Industrial Agglomeration 5.13 30
15 Nearness to river 4.95 22
16 Water supply 4.93 36
17 Nearness to railway 4.55 10
18 Unskilled Labor 4.23 20
19Availability of drainageoutfall 4.00 20
20 Local agency Co-operation 3.87 30
21 Nearness to airway 2.71 19
22 Other factors 1.90 15
23 Availability of drainage outlet 1.76 17
Table 4.11 is showing the availability of skilled labors as 1st priority and the 2nd priority is
Land Value/Rent. But Land Value should be the most prominent factor which drives them
to violet the law. The exception happens as the land was bought years back that was
revealed during the interview with the management. And very strangely Electricity
Supply is the third priority. Because it is known to all that electricity is a common factor
though that is mandatory for any industrial establishments and it is available throughout
the DMDP. So the respondents may have identified this factor keeping in mind the
quality of Electricity Supply. Nearness to highway is in the 4th priority position with Gas
supply in the 5th priority. In this way the Availability of drainage outlet was the 23rd
priority.
As Land Value/Rent is in the 2nd priority for establishing industries in the DMDP
prohibited zones; it was further studied by the author to find out the reality on the present
context. It was earlier stated that, the already established industries had their purchased
land long before their establishment. The findings of the field survey for land value are
shown in the table 4.12 and 4.13.
Assuming the

70 | P a g e
Table 4.12: Land values of areas that are incompatible for Industrial Development
according to DMDP Structure Plan.
Union/Locality
Land Price/Decimal
Beside Major Road
Land Price/Decimal
Beside Minor Road
Land Price/Decimal
In Low Lands/without Road
Ashulia 3.0 – 4.0 lakh 2.0 – 3.0 lakh
Basan 5.0 – 6.0 lakh 4.0 – 5.0 lakh
Birulia 2.5 – 3.0 lakh 2.0 – 2.5 lakh
Gazipur 1 0
Kashimpur 2.5 – 3.0 lakh 2.0 – 2.5 lakh 70 – 80 thousand
Kayaltia 3.6 – 4.25 lakh 2.4 – 3.6 lakh 1.8 – 2.4 lakh
Konabari 1 0
Madanpur 1.4 – 1.6 lakh 1.2 – 1.33 lakh
Murapara 1.4 – 1.6 lakh 1.2 – 1.33 lakh
Rurganj 1.4 – 1.6 lakh 1.2 – 1.33 lakh
Tarabo 1.5 – 1.8 lakh 1.2 – 1.5 lakh
Tetuljhora 4.0 – 4.5 lakh 3.0 – 4.0 lakh 2.5 – 3.0 lakh
Yearpur 3.0 – 4.0 lakh 2.0 – 3.0 lakh
Source: Field Survey, June-2009.
Table 4.13: Land values of areas of four Special Incentive Zones and Special
Rehabilitation Incentive Zones according to DMDP Structure Plan.
Municipality/Union
/Locality
Land Price/Decimal
Beside Major Road
Land Price/Decimal
Beside Minor Road Remarks
Dhamsona-
Kashimpur 3.0 – 4.0 lakh 2.0 – 3.0 lakh Special Incentive Zone
Gazipur Municipality 6 – 7 lakh 1.2 – 1.33 lakh Special Incentive Zone
Narayanganj
Municipality 5 – 6 lakh 3 – 4 lakh
Special Rehabilitation
Incentive Zone
Savar Municipality 5 – 6 lakh 2 – 3 lakh Special Incentive Zone
Tongi Municipatilty 6 – 7.5 lakh 4 – 5 lakh Special Incentive Zone
Source: Field Survey, June-2009.
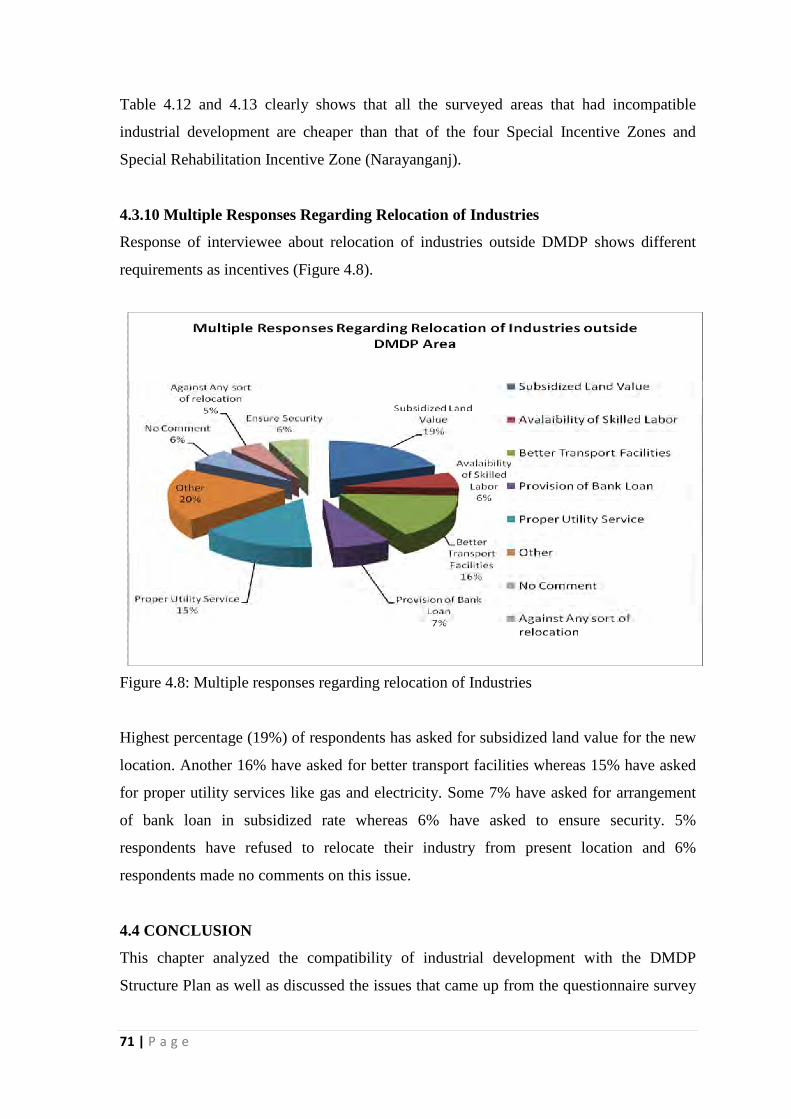
71 | P a g e
Table 4.12 and 4.13 clearly shows that all the surveyed areas that had incompatible
industrial development are cheaper than that of the four Special Incentive Zones and
Special Rehabilitation Incentive Zone (Narayanganj).
4.3.10 Multiple Responses Regarding Relocation of Industries
Response of interviewee about relocation of industries outside DMDP shows different
requirements as incentives (Figure 4.8).
Figure 4.8: Multiple responses regarding relocation of Industries
Highest percentage (19%) of respondents has asked for subsidized land value for the new
location. Another 16% have asked for better transport facilities whereas 15% have asked
for proper utility services like gas and electricity. Some 7% have asked for arrangement
of bank loan in subsidized rate whereas 6% have asked to ensure security. 5%
respondents have refused to relocate their industry from present location and 6%
respondents made no comments on this issue.
4.4 CONCLUSION
This chapter analyzed the compatibility of industrial development with the DMDP
Structure Plan as well as discussed the issues that came up from the questionnaire survey
72 | P a g e
conducted among industrial top management of DMDP Structure Plan incompatible
industrial establishments. The Major Findings are
After the approval of DMDP in 1997 there are 841 new industries (Bangladesh Bureau of
Statistics (BBS) 2007). Among these industries, 757 industries (Annexure 4.1) are
located in the DMDP incompatible area. Around 199 industries (Annexure 4.2) are
located in the DMDP Structure Plan Indicated Main Flood Flow Zone, Sub-Flood Flow
Zone, High Value Agriculture Zone and Agriculture Zone.
The comparison of DMDP proposed location and their present location shows that the
respondents have given more preference to the DMDP proposed locations. The only
factor for locating their respective industries to the DMDP incompatible area is Land
Value/Rent.
Skilled Labor was chosen as 1st priority by the industrial management though during
relocation they gave highest priority on subsidized land value. They have chosen Land
Value as the 2nd priority because there is significant difference between the land values in
their location and the DMDP location. Electricity and Gas Supply was chosen as the 3rd
and 5th priority. This means they will choose those locations which can feed them with
better electricity and gas supply.
There are different industrial sectors with specific transportation needs. The 4th and 8th
priorities which are nearness to national highway and access to market reflect their sector
wise need for transportation system. This was also revealed from the question mode of
transport use for carrying finished products. The residence of top industrial management
also showing the factor that better mobility through the National High was one of the
important determinants for location choice by owners.
Almost all the industries are aware of environmental laws whereas only 18% of the
polluting industries are running their own effluent treatment plant (ETP) and they are
getting the DoE annual renewal. Here lays a big question. How these industries are
getting the renewal from DoE without running the ETP. This process of illegal renewal is
encouraging the development of hazardous industries without proper measures to reduce
environmental hazard and there by polluting the surface water and air of DMDP area.
The last findings was what are the incentives that they will be looking for to relocate
their industries outside DMDP and it shows similar result as the 2nd priority. Maximum
respondents have asked for land in subsidized value with better transport facilities,
proper utility service, provision of bank loan and security etc.

73 | P a g e
CHAPTER-5
RECOMMENDATION AND CONCLUSION
5.1 INTRODUCTION
Findings of this study would be very helpful for planners, economist and policy makers of
Dhaka Metro. It is also important for the environmentally concerned people who have
always asked for protection of environment and river system of Dhaka. This study
focuses on trend analysis and corresponding spatial distribution of industries. This
analysis shows change in trend, affects distribution pattern in different locations where
some factors are prominent to influence the development. The Dhaka Metropolitan
Development Plan (DMDP) indicated some locations for industrial development as
incentive zones and rehabilitation zones and it restricts haphazard development of
polluting industries within these areas. The only mechanism it suggested for the location
of polluting industries was that the location should be in a place where they can operate
their own effluent treatment plant and is away from locality. But the spatial distribution
pattern and trend analysis along with the factor analysis showed that there had been no
control over the development of industrial establishments. Industrial development is
continuing in its own pace with approval from utility providing agencies like TITAS,
DESCO, REB and even the department of environment.
5.2 MAJOR FINDINGS OF THE RESEARCH:
The major findings of the research can be showed in terms of spatial distribution trend of
industries and incompatibility with DMDP.
Spatial Distribution Trend:
Dhaka starts the journey towards industrialization with its fast ever large scale
manufacturing in the year 1903. Till the year 1965, there has been no continuity in the
industrial development trend of DMDP area. After the year 1965 the study area started
experiencing steady industrialization. Since the year 1977, it showed a consistent and
faster upward movement till 1999. The area outside the DMP showed a declining
tendency after the year 1990 whereas the industrial development of the DMP area was
rising. The annual number of industries of DMP area was more than the area outside
DMP in the year 1997 and the trend continued till the year 2005 with a sudden fall in the
year 2004.

74 | P a g e
Analysis of Spatial Distribution Pattern:
The spatial distribution pattern is very important to study how spatial phenomenon
behaves. Quadrat analysis is the most perfect method to identify how the development of
these industries occurs. In this analysis the calculated p-value was 0.0001 which is almost
close to 0 and makes the distribution pattern clustered. So the industries within DMDP
area highly clustered.
Incompatibility with DMDP:
According to the Dhaka Metropolitan Development Plan (DMDP) Structure Plan There
should not be any industries within the Dhaka Metropolitan Police (DMP) Area after the
approval of DMDP in the year 1997. But this research showed that around 500 new
industries were established after the year 1997 which accounts for 60% of new industries
within DMDP area. This is a gross violation of DMDP Structure Plan Policy.
DMDP Structure Plan has specific policy regarding polluting industries. It does not allow
red category/polluting industries to be located near or within any locality. But the
distribution map is showing around 76% polluting industries are located within the
Structure Plan designated Existing Urban Areas, Peripheral Urban Areas and New Urban
Areas. It allowed industries to be located away from locality and on condition of not
discharging untreated effluent to the nearby drainage outlet. So the allowable areas are the
Flood Flow Zones, Agriculture Zones or High Value Agriculture Zones. But Structure
Plan does not allow any sort of industrial development within these zones. There are 19%
polluting industries located in these zones. Most of the polluting industries are located
near water bodies like river and khals (around 39% are in 250 meters proximity with
River and Khals).
Summary of Spatial Development Trend of post DMDP period is shown below in a
tabular form:
Area Present Trend Structure Plan Policy Remarks
DMP Area 500 new industries from
1998 onwards
There should not be any new
industrial development within
DMP area after 1998.
These new industries are
total violation of DMDP
Structure Plan policy.
Outside DMP 341 new industries from
1998 onwards among
which 199 industries are
outside the five incentive
and special rehabilitation
zones and are located in
There should be industries in
the four incentive zones and
one special rehabilitation
incentive zone in
Narayanganj.
Areas like Main Flood Flow
The outside DMP trend
showed better scenario as
some 142 industries are
located in the incentive
and special rehabilitation
incentive zones.

75 | P a g e
the Main Flood Flow Zone,
Sub-Flood Flow Zone and
Agriculture Zones.
Zone, Sub-Flood Flow Zone
and Agriculture Zones are
restricted for industrial
Development.
There are a total of 2465 large scale manufacturing industries within the DMDP area
since 1903. Among these industries only 1624 industries were there before the approval
of DMDP. After the approval of DMDP another 841 new industries were added to the
total which is 34.11%. This reflects that the post DMDP industrial development trend is
more prominent than it was since 1903.
5.3 Policy Recommendations
The Development Control Authority had so far prepared the plan to control and guide the
development of the area. But this study is showing that there are some conflicts between
the policy laid down by the authority and their development control mechanism. These
conflict need to be resolved very soon.
Another important issue is revealed through this study about coordination among the
Development Control Authority and the utility providing line agencies. The Development
Control Authority must coordinate all other line agencies regarding the approval of
industries through which they get connection from respective agencies. It should be made
mandatory for all the line agencies to follow the DMDP Structure Plan policy as well as
Detailed Area Plan (DAP). In reality, other line agencies doesn’t feel it necessary to
consult with the Development Authority while giving permission to an individual
industry and these consequences are the vital factors for unplanned and haphazard
industrial establishment. As the DMDP is prepared for the whole RAJUK jurisdiction, all
development activities within this area must be compatible with the Structure Plan and
Detailed Area Plan.
There may be a one window cell with all the concern agencies related to industrial
development as it is proposed in the Building Construction Act 2008. Moreover, different
industries require different infrastructure provision, different type of labor intensity,
different type of waste discharge facilities and different quantity & quality utility
connections. These issues should be taken into consideration while allowing the new
industries to be established in a location. This policy can reduce the chances of industrial
sprawl development and thereby reducing the scope for polluting our environment.

SPATIAL DEVELOPMENT TREND OF INDUSTRIES
WITHIN DHAKA METROPOLITAN DEVELOPMENT
PLAN (DMDP) AREA
A.K.M. ALAMGIR KABIR DEWAN
MASTER OF URBAN AND REGIONAL PLANNING
DEPARTMENT OF URBAN AND REGIONAL PLANNING
BANGLADESH UNIVERSITY OF ENGINEERING AND TECHNOLOGY
DHAKA, BANGLADESH

SPATIAL DEVELOPMENT TREND OF INDUSTRIES
WITHIN DHAKA METROPOLITAN DEVELOPMENT
PLAN (DMDP) AREA
By
A.K.M. ALAMGIR KABIR DEWAN
MASTER OF URBAN AND REGIONAL PLANNING
DEPARTMENT OF URBAN AND REGIONAL PLANNING
BANGLADESH UNIVERSITY OF ENGINEERING AND TECHNOLOGY
DHAKA, BANGLADESH
August 2009

SPATIAL DEVELOPMENT TREND OF INDUSTRIES
WITHIN DHAKA METROPOLITAN DEVELOPMENT
PLAN (DMDP) AREA
By
A.K.M. ALAMGIR KABIR DEWAN
A Thesis
Submitted to the Department of Urban and Regional
Planning in partial fulfillment for the degree of Master of
Urban and Regional Planning
DEPARTMENT OF URBAN AND REGIONAL PLANNING
BANGLADESH UNIVERSITY OF ENGINEERING AND TECHNOLOGY
DHAKA, BANGLADESH
August 2009

THESIS ACCEPTANCE FORM
Spatial Development Trend of Industries within Dhaka Metropolitan
Development Plan (DMDP) Area
By
A.K.M. ALAMGIR KABIR DEWAN
Thesis Approved as to Style and Content by
Dr. Ishrat Islam (Supervisor)
Assistant Professor, Department of Urban and
Regional Planning, Bangladesh University of
Engineering and Technology (BUET), Dhaka
Chairperson
Dr. Sarwar Jahan
Professor and Head, Department of Urban and
Regional Planning, Bangladesh University of
Engineering and Technology (BUET), Dhaka
Member
Dr. Mohammad Sakil Akther
Assistant Professor, Department of Urban and
Regional Planning, Bangladesh University of
Engineering and Technology (BUET), Dhaka
Member
Dr. Nurul Islam Nazem
Professor, Department of Geography &
Environment, University of Dhaka, Dhaka
Member

CANDIDATE’S DECLARATION
It is hereby declared that this thesis has been prepared in partial
fulfillment of the requirements for the Degree of Master of Urban
and Regional Planning at the Bangladesh University of
Engineering and Technology, Dhaka and has not been submitted
anywhere else for any other degree.
A.K.M. Alamgir Kabir Dewan
Student No. 040415037
URP, BUET, Dhaka

Dedicated
To
My
Parents
And
Only Daughter

viii
List of Figure
Page no.
Figure 3.1: Trend of industries within DMDP area 19
Figure 3.2: Trend of industries within DMP area in Pakistan Period 21
Figure 3.3: Trend of industries Outside DMP area in Pakistan Period 22
Figure 3.4: Development Trend of DMP Area in Pre DMDP Bangladesh
period 23
Figure 3.5: Development Trend of Area outside DMP in Pre DMDP
Bangladesh period 24
Figure 3.6: Trend of DMP area in Post DMDP period (1998-2005) 26
Figure 3.7: Trend of Area outside DMP in Post DMDP period (1998-2005) 27
Figure 3.8: Pattern of points in Quadrat analysis 30
Figure 3.9: Blank Window in ArcMap, ArcGIS Desktop 9.2 32
Figure 3.10: Enabling extension (Hawth’s Analysis Tools) 33
Figure 3.11: Generate Polygon Centroid Points using Hawth’s Analysis Tools 34
Figure 3.12: Graphical Output of Adding a field value to attribute table 34
Figure 3.13: Graphical Output of counting point in polygon 35
Figure 3.14: Thana wise distribution of industries within DMP area 38
Figure 3.15: Thana wise Industrial Distribution of areas outside DMP 41
Figure 3.16: Share of Red Category Industries located in DMDP indicated
Residential Areas and Flood Flow & Agriculture Zones 47
Figure 3.17: Share of Red Category Industries within 100 meters Proximity of
Rivers & Khals
48
Figure 3.18: Share of Red Category Industries within 250 meter Proximity of
Rivers & Khals 48
Figure 4.1: Distribution of new industries in MFFZ, SFFZ and AZ (1998-
2005) 54
Figure 4.2: showing factor wise comparative weightage between nearby
DMDP location and Present location of industries surveyed 56
Figure 4.3: Showing results of multiple responses regarding use of different
mode of transport 57

ix
Figure 4.4: Showing respondent’s awareness of about DMDP 59
Figure 4.5: Showing knowledge about industrial areas proposed by DMDP 59
Figure 4.6: Showing union/locality wise residence of labors of the surveyed
industries 62
Figure 4.7: Showing of Availability of ETP 64
Figure 4.8: Showing multiple responses regarding relocation of Industries 71
x
List of Maps
Page no.
Map 3.1: Distribution of industries in DMP Area (1903-2005) 40
Map 3.2: Distribution of industries in Areas outside DMP (1903-2005) 42
Map 3.3: DoE Categorical Map of Industries within DMDP 45
Map 3.4: Locations of Red Category Industries within DMDP 46
Map 3.5: Red Category Industry in Proximity with Rivers and Khals of
DMDP 49
Map 4.1: Structure Plan Policy Map for Industrial Development 52
Map 4.2: Location Map of Incompatible Industries within DMDP Area 53

vii
List of Table
Page no.
Table-3.1: Table showing the summarized findings 36
Table 3.2: Thana wise distribution of industries in DMP Area (Since 1903 to
2005) 38
Table 3.3: Thana wise industrial distribution of areas outside DMP 43
Table 3.4: Number of Industrial Structure Categorized by DoE Classification 44
Table 4.1: Distribution of new industries in MFFZ, SFFZ and AZ (1998-2005) 54
Table 4.2: Multiple responses regarding use of different mode of transport 57
Table 4.3: Showing Relation between Industrial Sector and different mode of
transport 58
Table 4.4: Cross tabulation between factors for choosing another location and
awareness about DMDP 60
Table 4.5: Showing Union/Locality wise number of Industries Surveyed 61
Table 4.6: Location of Industries and Residence of Top Management 63
Table 4.7: Cross tabulation between industrial sectors with availability of ETP 64
Table 4.8: Cross tabulation between industrial sectors and renewal of DoE. 65
Table 4.9: Summary of response on different factors influencing location
decision 66
Table 4.10: Summery of priorities of factors influencing location decision 68
Table 4.11: Showing priority of each factor based on Average Weightage 68
Table 4.12: land values of areas that are incompatible for Industrial
Development according to DMDP Structure Plan. 70
Table 4.13: land values of areas of four Special Incentive Zones and Special
Rehabilitation Incentive Zones according to DMDP Structure Plan. 70
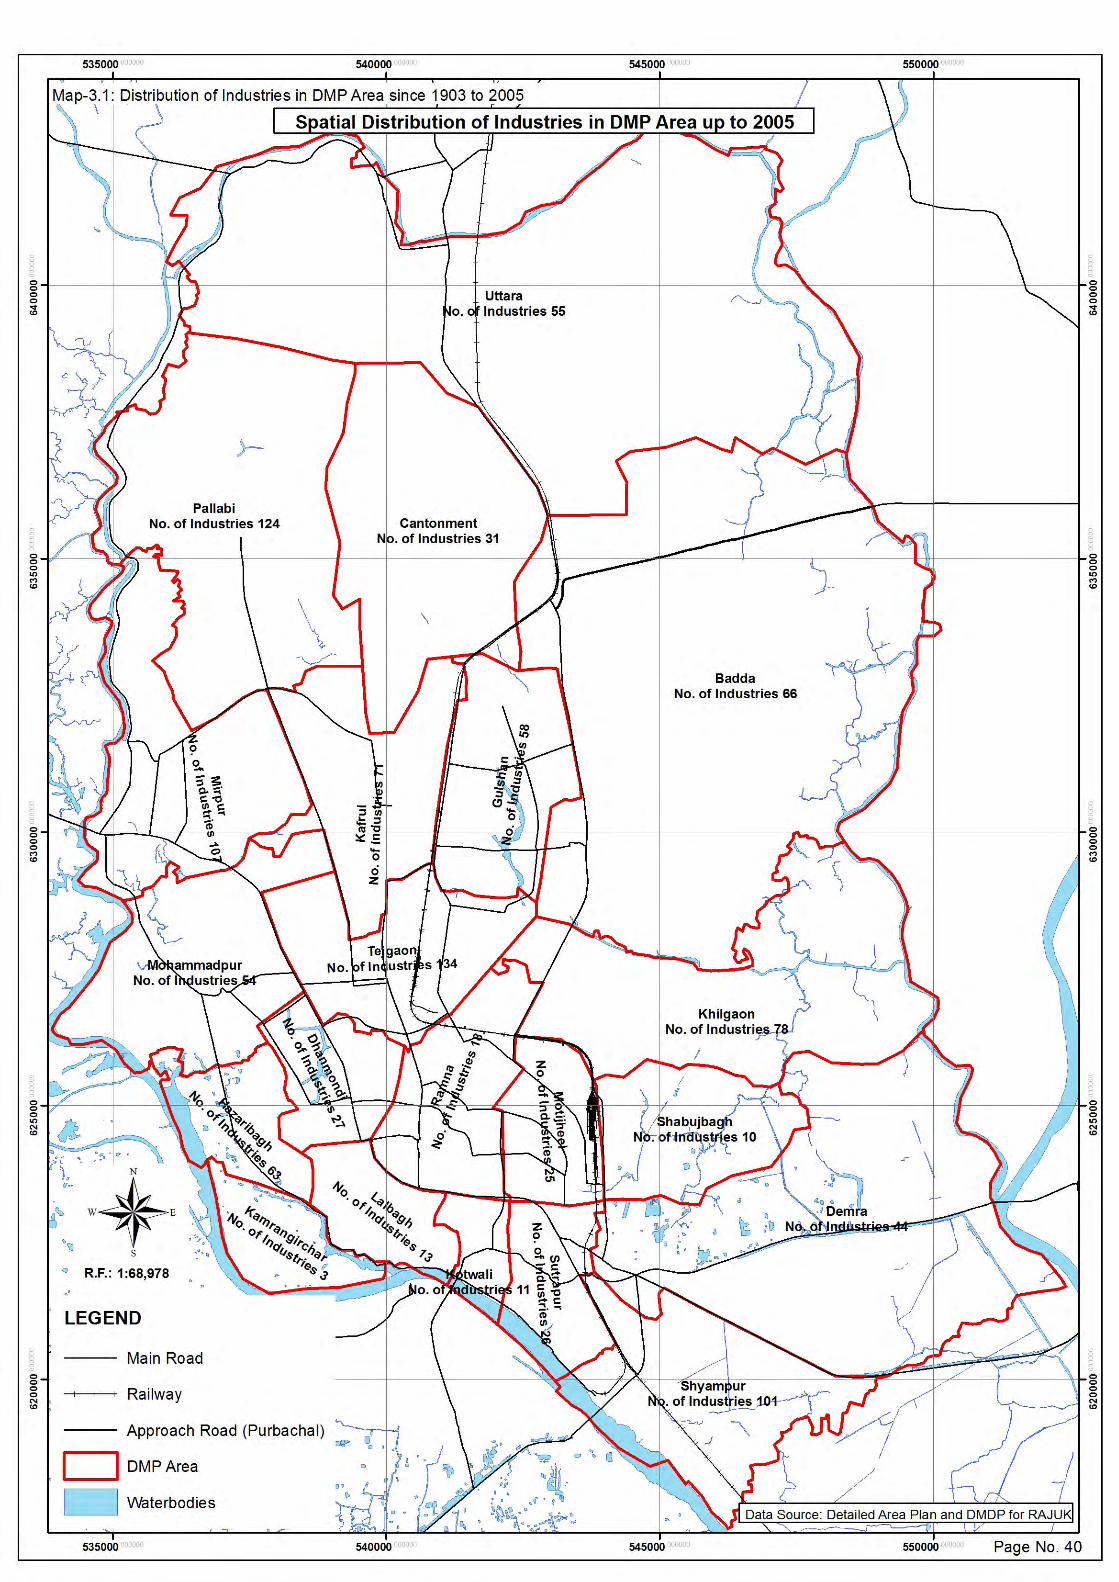


76 | P a g e
References:
Agencied. http://www.chinadaily.com.cn. May 19, 2009.
http://www.chinadaily.com.cn/world/2009-05/19/content_7792698.htm (accessed August
03, 2009).
Aziz, F.M. Location of brick fields in Dhaka. Unpublished Master Thesis, Dhaka:
Department of Urban and Regional Planning, Bangladesh University Engineering and
Technology (BUET), 1980.
Bangladesh Bureau of Statistics (BBS). Report of Establishment Size TPE 50-99 & 100+
Upadted upto December, 2005. Sector- Manufacturing. Annual Report, Dhaka:
Bangladesh Bureau of Statistics (BBS), 2007.
Bangladesh Bureau of Statistics (BBS). Report on Bangladesh Census of Manufacturing
Industries (CMI) 2001-2002. Census Report, Dhaka: Bangladesh Bureau of Statistics
(BBS), 2007.
BETS Limited, DDC Limited, EPC Limited, Gani Bangla Limited, Sheltech (Pvt.) Ltd.
Survey Report of Detailed Area Plan. Master Plan, Dhaka: Rajdhani Unnayan
Kartipakkha (RAJUK), 2006.
Chowdhury, J.M. An Evaluation of the Industrial Development of Bangladesh with
Reference to Location Planning of Textile Industry. Unpublished Master Thesis, Dhaka:
Department of Urban and Regional Planning, Bangladesh University Engineering and
Technology (BUET), 1981.
Christaller, Walter. Central Places in Southern Germany. Translated by Charlisle W.
Baskin. Prentice Hal, 1966.
Clemett, Alexandra. "A Review of Environmental Policy and Legislation in Bangladesh."
http://www.mkenvirotechnology.com. Unknown Unknown, Unknown.
http://www.mkenvirotechnology.com/file_download/enviromental_legislative.pdf
(accessed July 13, 2009).

77 | P a g e
Glasson, John. An Introduction to Regional Planning. London: Hutchinson Publishers,
1982.
Hoover, E.M. The Location Of Economic Activity. New York, Toronto, London.: Mcgraw
Hill Book Company Inc., 1963.
Hossain, S.M.M. Factors influencing the Location of Textile Dyeing and Printing
Industries in Bangladesh. Unpublished Master Thesis, Dhaka: Department of Urban and
Regional Planning, Bangladesh University Engineering and Technology (BUET), 1992.
Huda, Shamima. Location of Drugs and Pharmaceutical Industries in Bangladesh.
Unpublished Master Thesis, Dhaka: Department of Urban and Regional Planning,
Bangladesh University and Engineering and Technology (BUET), 1993.
Iqbql, M. "Location of Industries in Dhaka City: A Geographical Analysis." The Oriental
Geographer, 1981: Unknown.
K.A. Saleque, S. Ishteak. "Dhaka Sitting on a Sleeping Volcano?" www.globalaging.org.
April 08, 2008. http://www.globalaging.org/elderrights/world/2008/volcano.htm
(accessed July 15, 2008).
Keeble, Lewis. Principles and Practice of Town and Country Planning. London: The
Estate Gazette Limited, 1969.
Khan, A.U. Industrial Location Decision-Making in Dhaka City. Unpublished Master
Thesis, Dhaka: Department of Urban and Regional Planning, Bangladesh University and
Engineering and Technology (BUET), 1987.
Losch, A. The Economics of Location. New Haven: Yale University press, 1954.
Minoprio, Spencely, P.W. Macfarlane. Master Plan for Dhaka. Master Plan, Dhaka:
Dhaka Improvement Trust (DIT), 1959.
Mondal, A.H. The Location of Industries In Bangladesh. Unpublished Project Report,
Dhaka: Urban Development Directorate (UDD), 1985.
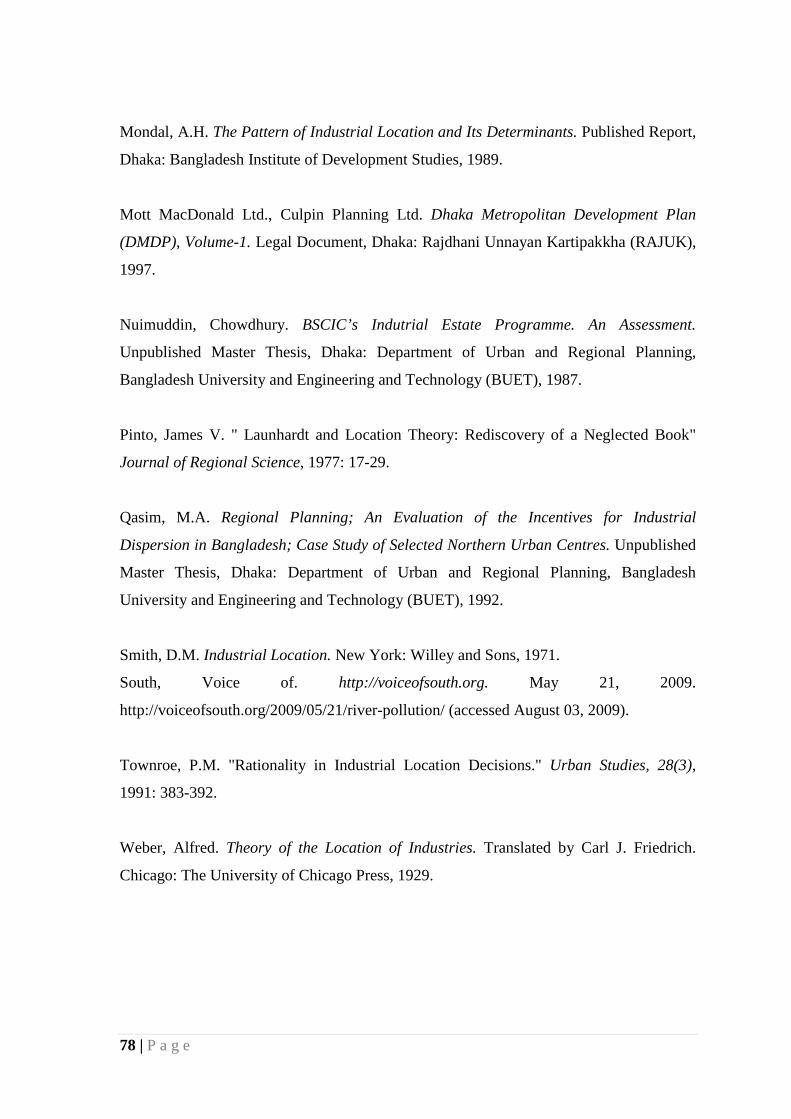
78 | P a g e
Mondal, A.H. The Pattern of Industrial Location and Its Determinants. Published Report,
Dhaka: Bangladesh Institute of Development Studies, 1989.
Mott MacDonald Ltd., Culpin Planning Ltd. Dhaka Metropolitan Development Plan
(DMDP), Volume-1. Legal Document, Dhaka: Rajdhani Unnayan Kartipakkha (RAJUK),
1997.
Nuimuddin, Chowdhury. BSCIC’s Indutrial Estate Programme. An Assessment.
Unpublished Master Thesis, Dhaka: Department of Urban and Regional Planning,
Bangladesh University and Engineering and Technology (BUET), 1987.
Pinto, James V. " Launhardt and Location Theory: Rediscovery of a Neglected Book"
Journal of Regional Science, 1977: 17-29.
Qasim, M.A. Regional Planning; An Evaluation of the Incentives for Industrial
Dispersion in Bangladesh; Case Study of Selected Northern Urban Centres. Unpublished
Master Thesis, Dhaka: Department of Urban and Regional Planning, Bangladesh
University and Engineering and Technology (BUET), 1992.
Smith, D.M. Industrial Location. New York: Willey and Sons, 1971.
South, Voice of. http://voiceofsouth.org. May 21, 2009.
http://voiceofsouth.org/2009/05/21/river-pollution/ (accessed August 03, 2009).
Townroe, P.M. "Rationality in Industrial Location Decisions." Urban Studies, 28(3),
1991: 383-392.
Weber, Alfred. Theory of the Location of Industries. Translated by Carl J. Friedrich.
Chicago: The University of Chicago Press, 1929.