Spatial and temporal patterns of precipitation intensity ...€¦ · The North American Monsoon...
49
Spatial and temporal patterns of precipitation intensity as observed by the NAME Event Rain Gauge Network from 2002 to 2004 David J. Gochis 1 National Center for Atmospheric Research * , Boulder, Colorado, USA Christopher J. Watts Departamento de Física, Universidad de Sonora,Hermosillo, Sonora, México Jaime Garatuza-Payan Instituto Tecnológico de Sonora, Ciudad Obregon, Sonora, México Julio Cesar-Rodriguez Instituto del Medio Ambiente y Desarrollo Sustentable, Hermosillo, Sonora, México Submitted to, J. Climate. Nov. 17, 2005 1 Corresponding author address: David J. Gochis, National Center for Atmospheric Research, Research Applications Program, P.O. Box 3000, Boulder, CO 80307-3000. E-mail: [email protected] * The National Center for Atmospheric Research is sponsored by the National Science Foundation
Transcript of Spatial and temporal patterns of precipitation intensity ...€¦ · The North American Monsoon...
Spatial and temporal patterns of precipitation intensity as observed by the NAME
Event Rain Gauge Network from 2002 to 2004
David J. Gochis1
National Center for Atmospheric Research*, Boulder, Colorado, USA
Christopher J. Watts
Departamento de Física, Universidad de Sonora,Hermosillo, Sonora, México
Jaime Garatuza-Payan
Instituto Tecnológico de Sonora, Ciudad Obregon, Sonora, México
Julio Cesar-Rodriguez
Instituto del Medio Ambiente y Desarrollo Sustentable, Hermosillo, Sonora, México
Submitted to, J. Climate.
Nov. 17, 2005
1 Corresponding author address: David J. Gochis, National Center for Atmospheric Research, Research Applications Program, P.O. Box 3000, Boulder, CO 80307-3000.E-mail: [email protected]
* The National Center for Atmospheric Research is sponsored by the National Science Foundation

2
ABSTRACT
Detailed information on the spatial and temporal characteristics of precipitation intensity
from the mountainous region of northwest Mexico has, until recently, been lacking. As
part of the 2004 North American Monsoon Experiment (NAME) Enhanced Observing
Period (EOP) surface rain gauge networks along with weather radar and orbiting satellites
were employed to observe precipitation in a manner heretofore unprecedented for this
semi-arid region. The NAME Event Rain gauge Network (NERN), which has been in
operation since 2002, contributed to this effort. Building on previous work, this paper
presents analyses on the spatial and temporal characteristics of precipitation intensity as
observed by NERN gauges. Analyses from the 2004 EOP are compared with the 2002-
2004 period and with long-term gauge observations. It was found that total precipitation
from Jul-Aug of 2004 was similar in spatial extent and magnitude to the long-term
average though substantially wetter than 2003. Statistical analyses of precipitation
intensity data from the NERN reveal that large precipitation events at hourly and daily
timescales are restricted to coastal and low-elevation areas west of the Sierra Madre
Occidental Mountains. At 10-minute timescales, maximum intensity values equal to
those at low elevations could be observed at higher elevations though they were
comparatively infrequent. It is also shown that inclusion of NERN observations in
existing operational analyses helps to correct significant biases, which, on the seasonal
timescale, are of similar magnitude as the interannual variability in precipitation in key
headwater regions of northwest Mexico.
3
1. Introduction
The North American Monsoon (NAM) system is increasingly recognized as a dominant,
modulating feature of the warm season climate over North America. The establishment
of the NAM in mid- to late-June represents a marked transition in the continental-scale
hydroclimatology whose influence is most pronounced in the southwestern U.S. and
Mexico (c.f. Douglas et al., 1993; Higgins et al., 2003; Hu and Feng, 2002; Gutzler,
2004; and Gochis et al., 2006). Features of this transition include the onset of strong,
diurnally-modulated convection over the semi-arid regions of the southwestern U.S. and
western Mexico (e.g. Douglas et al., 1993; Gochis et al., 2004, Anderson and Kanamura,
2005), a decrease in precipitation over the Great Plains region of the U.S. (Higgins et al.,
1997), and the dramatic invigoration of the regional terrestrial hydroecology (e.g. Brito-
Castillo et al., 2003; Viramontes and Descriox, 2003; Biondi et al., 2005; Matsui et al.,
2005). The onset of seasonal rains in these regions is critical to the function and
sustenance of ecosystems as well as supplying water resources for domestic and
agricultural purposes. This fact is particularly true for the region encompassing the Sierra
Madre Occidental (SMO) Mountains in western Mexico which receive, on average,
between 50-80% of their annual water resource from monsoon precipitation (Gochis et
al., 2006).
The general climatology of daily and sub-daily precipitation in the region is becoming
increasingly well documented through research using surface-based rain gauge
observations, satellite-derived and radar-derived precipitation estimates, and numerical
models coordinated under the North American Monsoon Experiment (NAME, 2005).

4
Features of the daily and sub-daily precipitation regime documented in Gochis et al.
(2004-hereafter referred to as G1) include; 1) a core region of frequent, but moderate
intensity precipitation centered over the high terrain of the SMO and 2) an elevation-
dependent diurnal cycle of precipitation where rainfall occurs earliest and most
frequently over high elevations and later in the evening and at night but less frequently
and with higher intensity across lower elevations. Anderson and Kanamura (2005),
studying Arizona and New Mexico, found that the daily balance of the hydrological cycle
components (precipitation, evapotransipration, moisture flux and vertical eddy diffusion)
is strongly linked to the diurnal cycle and that the elevated terrain of the continental
divide provides a hydrologic divide in the atmospheric moisture budget. On seasonal
timescales Gutzler (2004) found that there is considerable early-to-late-season persistence
in a “core” region of monsoon precipitation along the northern SMO. Interannual
variability of precipitation in this core region appeared to be linked to teleconnection
forcing from the tropical and North Pacific Oceans. Principal components analyses of
seasonal precipitation have also delineated various sub-regions of the NAM precipitation
regime (c.f. Comrie and Glenn, 1998; Hu and Feng, 2002; Gutzler, 2004). More recently,
Brito Castillo et al. (2003) and Gochis et al. (2006), linked these spatial modes with
regional, intra-seasonal and seasonal patterns of streamflow emanating from the SMO.
While basic information such as seasonal precipitation totals, the diurnal cycle of
precipitation occurrence and the spatial correlation of precipitation occurrence with
regional physiography is important for characterizing the overall monsoon climate,
additional information on rainfall intensity is essential for improved understanding of the

5
coupled land-atmosphere hydrological cycle. Detailed information on the frequency and
intensity structures of rainfall are critical to developing reliable hydrologic predictions,
diagnosing realistic precipitation structures that can be the basis of closing regional water
budgets, developing precipitation downscaling procedures, improving characterization of
extreme events in a changing climate (e.g. Allen and Ingram, 2002; Meehl et al., 2005),
and validating quantitative precipitation estimates from remote sensing platforms (e.g.
Wood et. al, 2000; Gebremichael et. al, 2003). In this paper, we extend the findings of
G1 to document the seasonal, daily and sub-daily character of precipitation intensity from
the NAME Event Rain gauge Network (NERN) in western Mexico. Section 2, describes
the data set and rain gauge calibration procedures used in this work, while section 3
presents a suite of analyses examining precipitation intensity structures from the 2002
through 2004 warm seasons. Section 4 provides a summary of the principal findings and
discusses their relevance to other research efforts in the NAME region. While it is quite
clear that the short period of record for the NERN limits the generalization of the rain rate
analyses presented herein, the following diagnostics are useful in the context of
characterizing rain rates during the 2004 NAME Enhanced Observing Period whose
activities are the subject of this special issue.
2. Data
The NERN consists of 87 automatic-recording, tipping bucket rain gauges distributed
primarily along 6 topographic transects which traverse the SMO (Figure 1; see also, G1
and Gochis et al. (2003) for further NERN implementation details). The rain gauge used
in the NERN is the Texas Electronics TE525USW tipping bucket (TB) rain gauge
6
outfitted with a 203.2 mm (8.0 in) screened orifice. Details on the operational
maintenance and field calibration of the NERN TB gauges are provided in documentation
by Gochis et al. (2005). Rain rate errors associated with the use of TB gauges have been
documented in many works (c.f. Humphrey et al, 1997; Habib et al., 2001; and Duchon
and Essenberg, 2001) and were reviewed in the context of the NERN in G1. Given the
significant sources of error and uncertainty associated with TB rain rate estimates, bias
correction of rain rates derived from raw ‘event’ data is generally required if not
essential. Here we define ‘event’ data as the information on tips of the tipping bucket,
which, for the NERN, is the time series of the time of bucket tips (often called ‘tip-
times’). As described in G1, there is no a priori time scale associated with the sampling
of the raw events in the NERN gauges independent of the size of the tipping buckets and
the time it takes for a full bucket to tip. Error associated with different tipping bucket
sizes and sampling intervals are discussed by Habib et al. (2002) who recommend bucket
sizes up to 0.254 mm (0.01 in) for high temporally-resolved rain rate estimation. The
buckets used in the NERN rain gauges have a nominal design capacity of 0.254 mm (0.01
in) though this volume can be decreased by the deposition of sediment in the buckets
during long-term field installations.
One type of error that afflicts TB rain gauges is systematic undercatch of precipitation at
high rain rates. In addition to random errors, such as splash-out of raindrops or wind
eddy effects, this systematic error is caused by the proportionally greater fraction of
rainfall passing through the collection funnel that is ‘spilled’ while the tipping bucket
mechanism is in motion. Assume that rainwater is passing through a funnel nozzle in a
7
continuous stream and at a continuous rate. Once one of the buckets on the tipping
bucket mechanism is full the bucket will tip. However, water that is draining from the
funnel nozzle will continue to fall into the full side of the bucket until the tip passes
through the level position at which point the incoming rainwater will begin to fill the
empty bucket on the opposite side. This error has been called the ‘time-to-tip’ error and,
assuming that the bucket always tips at nearly the same rate, this undercatch increases
with the rate of rainwater passing through the funnel nozzle. At low rain rates this error
is typically not significant since the time-to-tip is fast compared to the rate at which
rainwater fills the bucket. In their study, Humphrey et al. note that this error is generally
not significant at rain rates below 50 mm/hr.
For this study a simplified rain rate bias correction procedure was synthesized from
Humphrey et al. (1997), Habib et al. (2001) and Duchon and Essenberg (2001). The
approach taken here employs a constant flow-constant head measuring device designed
by Hydrological Services, Inc., which dispenses pre-specified flow rates to the TB rain
gauge. The dispenser delivers water at 5 nominal flow rates (50, 100, 200, 300 and 500
mm/hr) using 5 calibrated nozzles. Following Humphrey et al., the flow rates of the
dispenser were first calibrated in timed tests using a graduated, accumulation rain gauge.
The actual flow rates measured during this procedure differed from the design flow rates,
sometimes substantially (47, 103, 205, 254, 435 mm/hr), but the standard deviations
between multiple tests at each of the nominal flow rates was low (between 0.26 and 3.5
mm/hr). Hence, while the nominal design rates were not found to be highly accurate, the
low variability between tests indicates a reasonable degree of precision. The measured
8
flow rates from the flow device calibration tests were then used for subsequent
calibration of the TB rain gauges.
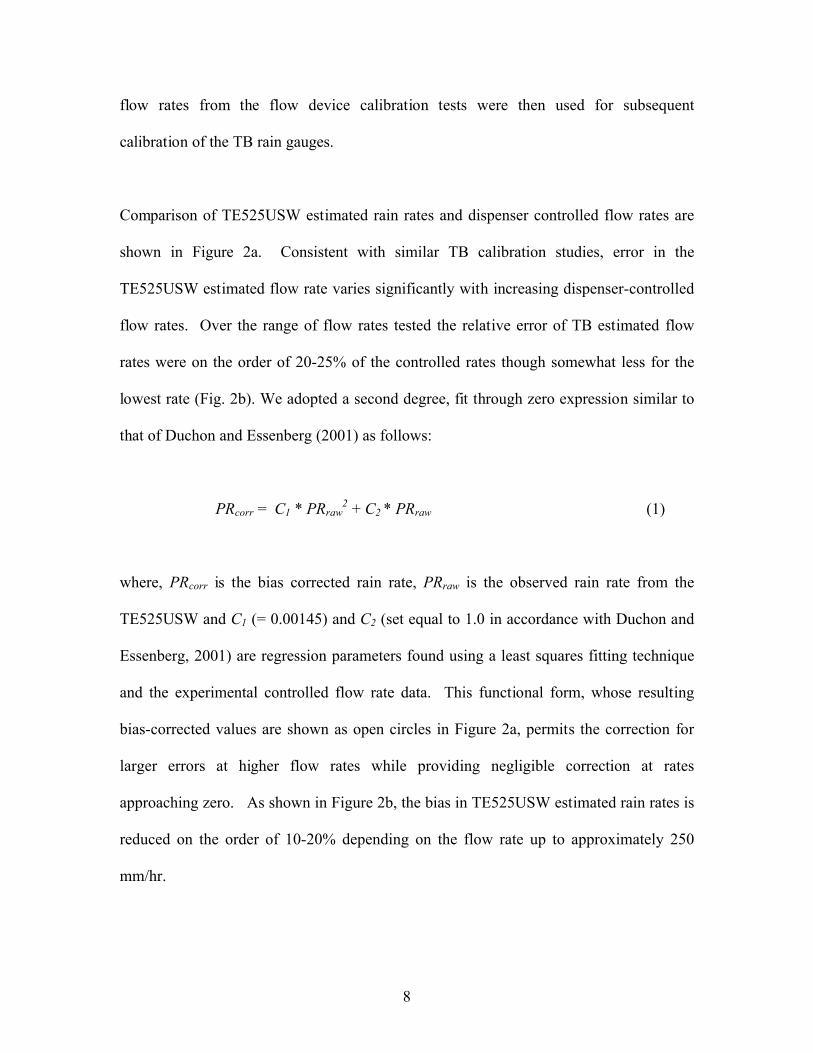
Comparison of TE525USW estimated rain rates and dispenser controlled flow rates are
shown in Figure 2a. Consistent with similar TB calibration studies, error in the
TE525USW estimated flow rate varies significantly with increasing dispenser-controlled
flow rates. Over the range of flow rates tested the relative error of TB estimated flow
rates were on the order of 20-25% of the controlled rates though somewhat less for the
lowest rate (Fig. 2b). We adopted a second degree, fit through zero expression similar to
that of Duchon and Essenberg (2001) as follows:
PRcorr = C1 * PRraw2 + C2 * PRraw (1)
where, PRcorr is the bias corrected rain rate, PRraw is the observed rain rate from the
TE525USW and C1 (= 0.00145) and C2 (set equal to 1.0 in accordance with Duchon and
Essenberg, 2001) are regression parameters found using a least squares fitting technique
and the experimental controlled flow rate data. This functional form, whose resulting
bias-corrected values are shown as open circles in Figure 2a, permits the correction for
larger errors at higher flow rates while providing negligible correction at rates
approaching zero. As shown in Figure 2b, the bias in TE525USW estimated rain rates is
reduced on the order of 10-20% depending on the flow rate up to approximately 250
mm/hr.
9
Errors in TB-estimated rain rates for smaller rain rates associated with drizzle and very
light precipitation suffer from additional problems such as wetting losses, wind blockage
and eddy effects and insufficient sampling of the rain gauge (c.f. Duchon and Essenberg,
2001) and are not accounted for in the present calibration methodology. Because errors
in heavy precipitation events in the monsoon region likely constitute a comparatively
greater uncertainty in hydrological inputs in the region and since this study is more
focused on characterizing the spatio-temporal distribution of heavy rainfall events
compared to light precipitation events, we limit our rain gauge correction methodology to
that provided above. Following the guidance of Habib et al., the raw event data were
aggregated into 10-minute rain rates prior to bias correction. The bias correction
equation was then applied to the uncorrected 10-minute rain rate. The corrected 10-
minute rain rates were then used to derive rain rates at other time scales (e.g. 30 min, and
1, 3, 24 hrs), which were used for the analyses described next. It requires note that the
above calibration equation is only valid over the range of values used in the calibration
tests and should not be extrapolated to larger rainfall intensities. Work on refining the
calibration procedure is ongoing.
3. Analyses
a. The 2004 NAME EOP
The NAME research program is principally a climate research program aimed at
improving predictions of warm season precipitation at intra-seasonal to interannual
timescales (NAME-SWG, 2004). The fact that the 2004 NAME EOP was conducted

10
during a single summer implies that the observations collected during the EOP need to be
taken in context of the long-term regional hydroclimatology, which has been shown to
exhibit marked variability on interannual timescales (e.g. Higgins and Shi, 2001; Gutzler
et al., 2004; Gochis et al., 2006). Here, we compare the Jul-Aug precipitation total,
observed by the NERN during 2004, against a long term Jul-Aug average estimated using
data from the ERIC-II database (ERIC, 1996). The cooperative stations archived in the
ERIC-II database possess records of varying length but are generally longer than 20
years. Figures 3a and b show that 2004 precipitation was quite similar to the long-term
average both in the spatial distribution of rainfall and the magnitudes of the total
amounts. While there is an absence of long-term observing sites located along the
southeastern portion of the NERN domain in the ERIC-II data, the rest of the regions
compare reasonably well. During 2004, precipitation values along the northwestern and
eastern periphery of the NERN domain were only slightly lower than the long-term
average while precipitation along the SMO foothill region of northern Sinaloa and
southern Sonora was at or slightly above normal. The Jul-Aug total precipitation from
the NERN during 2003 is provided in Figure 3c. By contrast, 2003 was significantly
drier (~ 50-100 mm) than 2004 and the climatological average. Given the significant
spatial variability of monsoon precipitation, the fact that Jul-Aug precipitation in the
NERN domain was near normal does not a priori imply that 2004 monsoon precipitation
in other regions, such as Arizona or New Mexico, was close to normal.
The most active precipitation days across the NERN domain during 2004 are
characterized as those days where the largest number of stations received measurable

11
precipitation (i.e. ‘maximum widespread days’ shown in Table 1), and days where the
largest number of stations received their 2004 seasonal maximum daily precipitation
(Table 2). The period 21-24 July was a very active period when a very large fraction of
the NERN stations (80 of 86) received measurable precipitation (23 and 24 July) and
many stations recorded their seasonal maximum daily total (22, 23 and 21 July). This
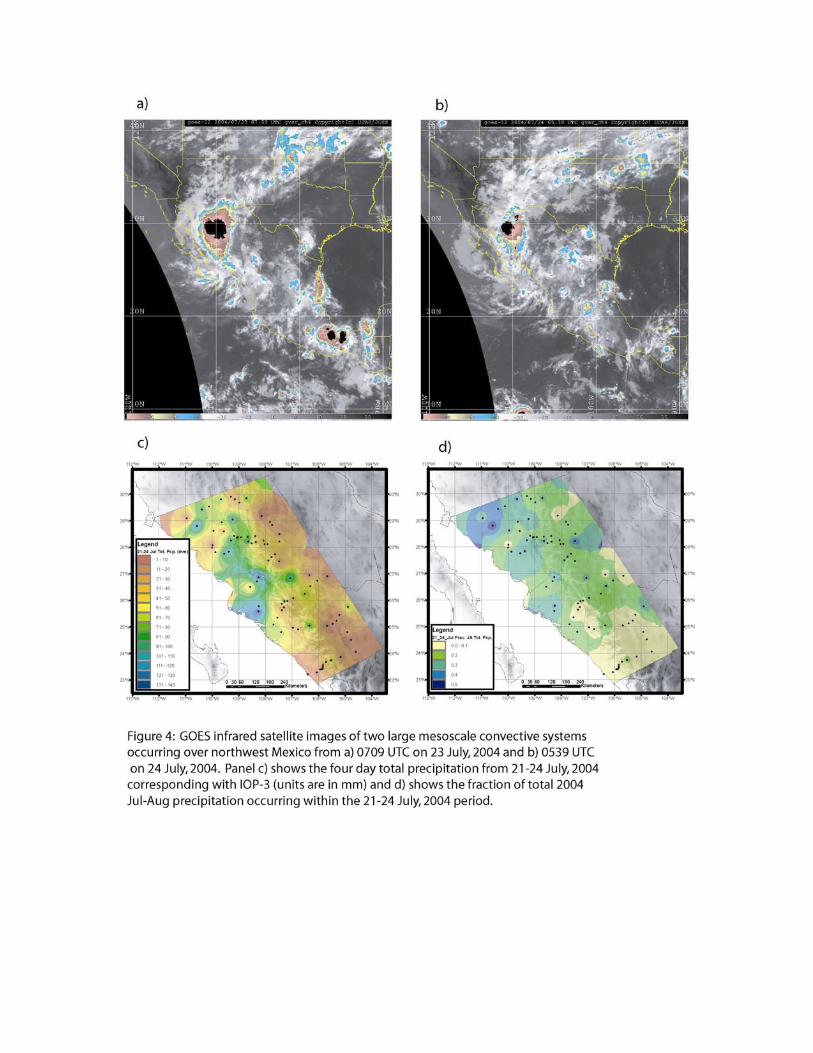
active period corresponds with the NAME Intensive Observing Period-3 (IOP-3).
Synoptic features of these days included a breakdown and westward retrogression of the
monsoon ridge towards the west coast, and a westward migrating inverted trough over the
Mexican plateau. These synoptic features aided the development of two large Mesoscale
Convective Systems (MCSs) over the northern Gulf of California and Sonora on July 23
and 24 (Figs. 4a and 4b) whose outflows produced surges of low level moisture that
propagated northward into the desert regions of the southwest U.S. The four day total
from 21-24 July is shown in Figure 4c along with fraction of the Jul-Aug total
precipitation received from 21-24 July (Figure 4d). In the northern part of the NERN
domain, where seasonal precipitation is lowest, these four days comprised well over 30%
of the Jul-Aug. total rainfall. Given this large contribution, improved predictability of
these kinds of events in northwest Mexico would have a clear benefit on managing local
and regional water resources.
b. Statistics of NERN Observed Precipitation Intensity
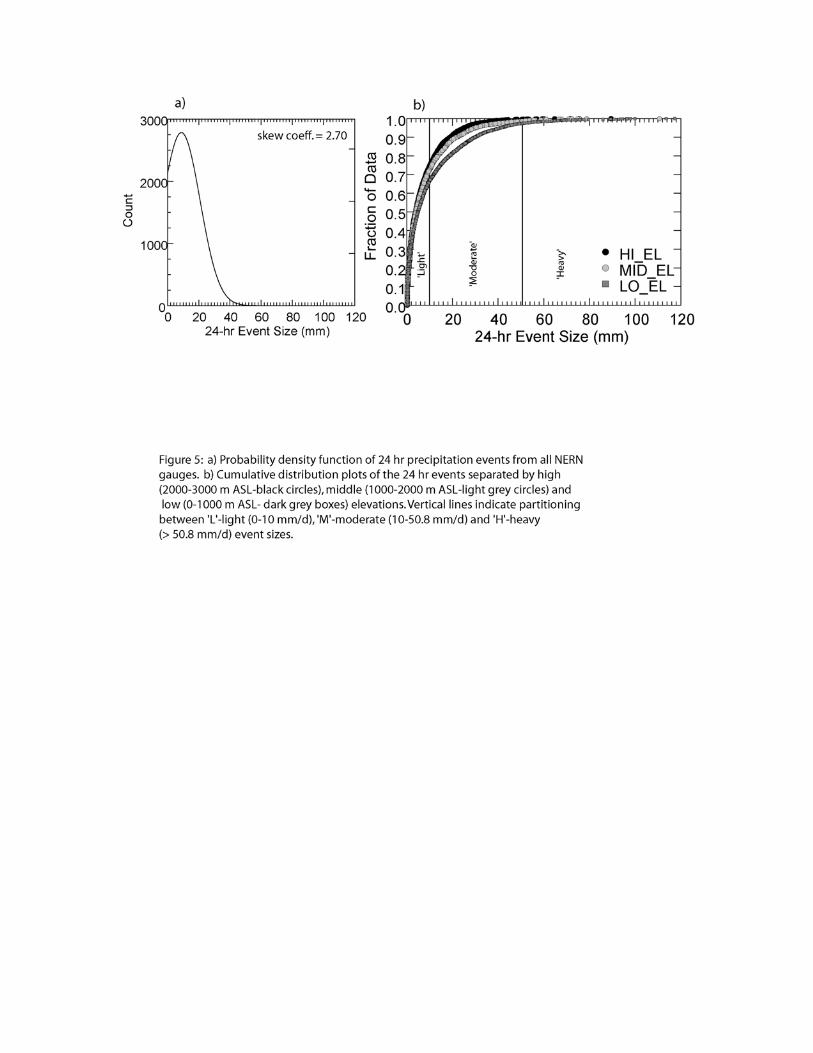
The distribution of 24 hr NERN-observed rainfall events (i.e. days with measurable
rainfall) from all sites combined, shown in the probability density function (pdf) in Figure
5a, is heavily skewed as is typical of rainfall event data. The pdfs of the 60-minute and

12
10-minute event data (not shown) are similar in shape to that shown in Fig. 5a though
they tend to be even more positively skewed. For instance, the estimated skew
coefficient for the 24 hr event data is 2.70 while those values for the 60-minute and 10-
minute event data, from all sites combined, are 5.19 and 4.98, respectively. Distributions
at the shorter time intervals also tend to be narrower as defined by the estimated kurtosis
coefficient (=10.44 for the 24-hr estimates versus 40.12 and 33.21 for the 60-minute and
10-minute estimates, respectively). Plots of the cumulative distributions as separated by
low (0-1000 m above mean sea level, ASL), medium (1000-2000 m ASL) and high
(2000-3000 m ASL) elevations show appreciable separation of event structure as a
function of elevation (Figure 5b). A greater fraction of events at high elevations (black
circles in Fig. 5b) are smaller in size (i.e. of lighter intensity) than those at middle (light
grey circles) and low elevations (dark grey boxes). There is a reasonably clear and
consistent progression towards a greater number of heavier precipitation events with
decreasing elevation. The shape and relative order of these distributions was largely
insensitive to various data withholding experiments (not shown), indicating that the
existing sample collected from the NERN is likely to be representative of the true
distribution. This stratification of precipitation distributions as a function of elevation is
similar at the 60-minute and 10-minute time intervals as well (not shown), though the
differences between elevation bands are not as great. Probability distributions of rainfall
events separated by location on the eastern versus western side of the SMO topographic
divide (not shown) show that precipitation events, at all three time intervals, tend to be
heavier and exhibit greater variability on the western side compare to the eastern side.
13
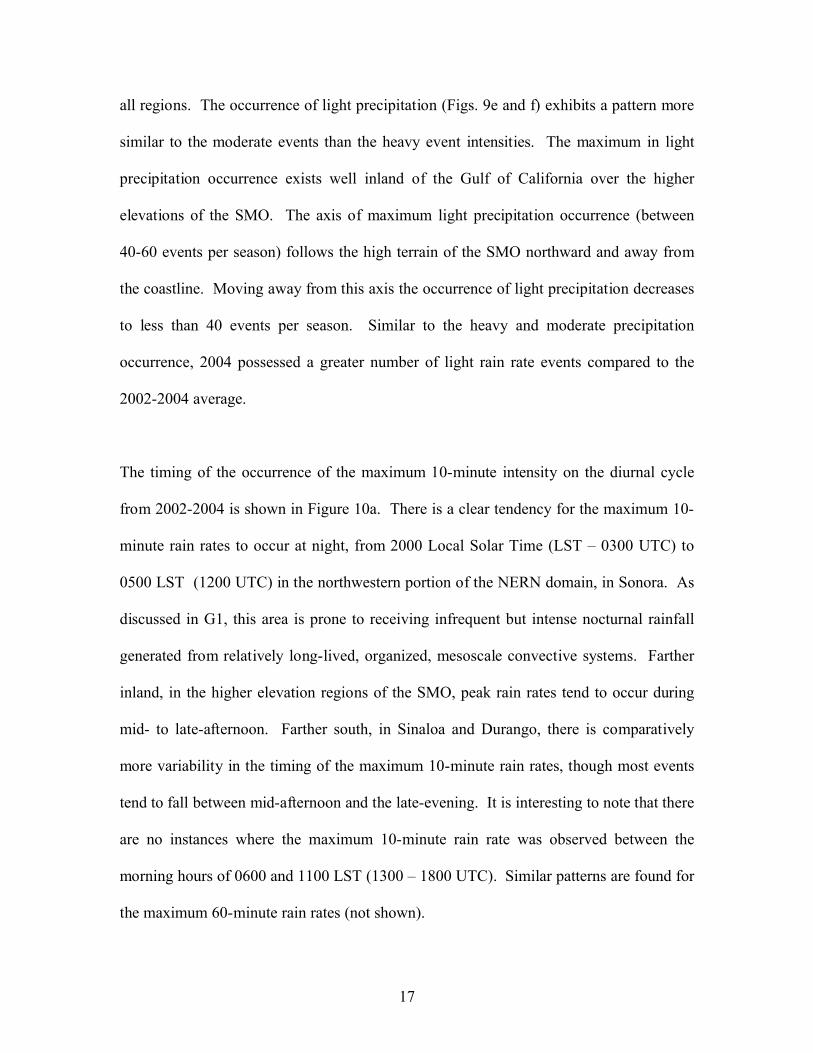
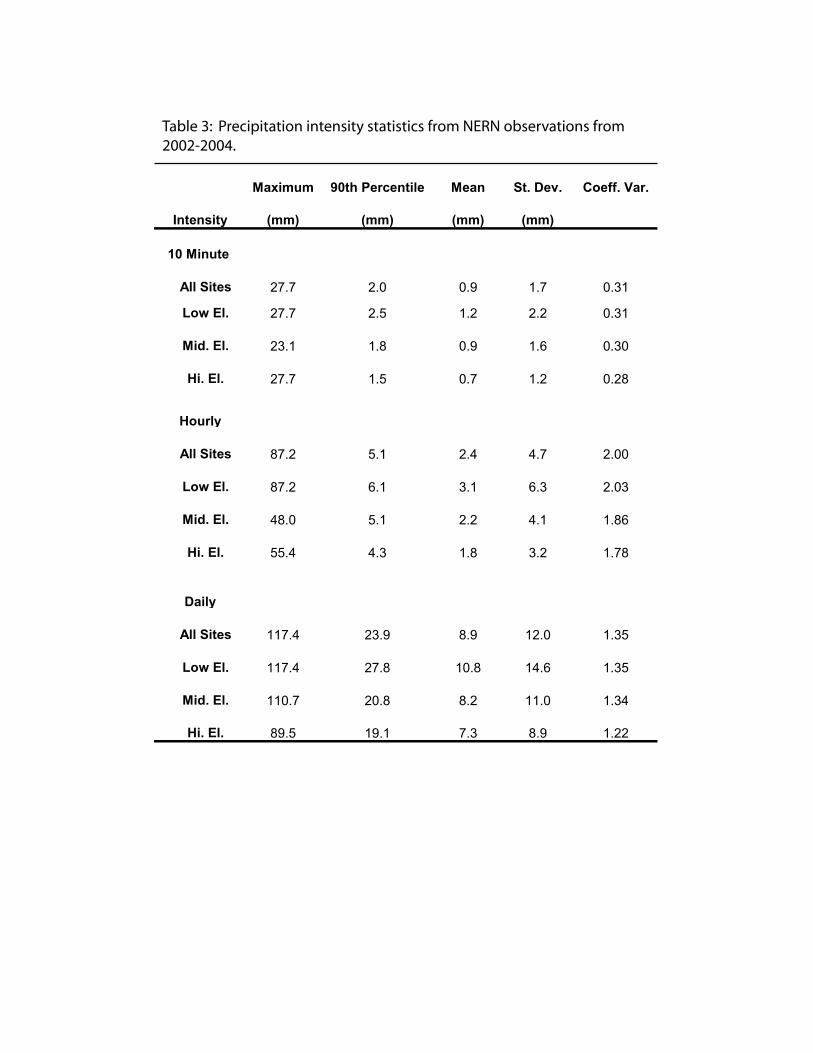
Table 3 provides summary statistics from the NERN for the 2002-2004 warm seasons
(Jul-Aug-Sep). The data are partitioned temporally into 10-minute, hourly and daily
intensities and by low, medium and high elevations as defined above. Full network
values are also provided for comparison. The values for the 90th percentile, mean and
standard deviations of precipitation intensities for each of the time periods all decrease
with increasing elevation. Also shown in Table 3 are the maximum observed rain rates
for each elevation class and each time interval. The relationship between maximum
observed precipitation rates and elevation appears to be somewhat time dependent. The
largest events at the hourly and daily time intervals are observed to occur at the lowest
elevations, while the maximum 10-minute intensity, 27.7 mm/10 min (equivalent to
166.2 mm/hr), is found to occur at high elevations as well as low elevations. While the
period of record for sampling heavy precipitation events is admittedly small, the
similarity between low and high elevation maximum 10-minute intensities suggests that it
is possible for high elevation locations to receive brief periods of intense rainfall.
However, these intense rates are not as likely to be sustained over long time intervals, as
is found at lower elevations. Variability in precipitation rates is clearly enhanced at
lower elevations as evidenced by the comparatively high estimated coefficients of
variation of rain rates shown in Table 3.
c. Maximum Precipitation Characteristics of the NAM
Maximum 10-minute, hourly and daily intensities are mapped in Figure 6 using the
inverse distance weighting procedure described in G1. Maximum 10-minute values
observed by the NERN from 2002-2004 are not atypical of intensities found in other

14
semi-tropical environments (> 100 mm/hr). There is comparatively less spatial coherence
in maximum rainfall events at the 10-minute time interval compared to the hourly and
daily intervals. While there is a general decreasing west to east gradient in the maximum
10-minute rain rate, there are several stations throughout the NERN where the 10-minute
rates exceed 100 mm/hr, on both the west and east sides of the SMO divide. These
stations are located at a variety of elevations (Note: There are no stations below 1500 m
ASL on the east side of the SMO divide.) The largest maximum-precipitation values at
the 60-minute and daily time intervals are comparatively more confined to the coastal
plain region of the NERN and decrease uniformly moving inland across the SMO. The
highest maximum daily rates are clearly confined to the low elevation coastal plains near
the base of the SMO.
Figure 7 shows the maximum daily values observed by the NERN from 2002-2004
compared to the maximum values observed from the ERIC-II climatology. Peak daily
events from the 2002-2004 NERN data are substantially less than the long-term values.
In both figures, there is a strong decrease in maximum rates across SMO. Maximum
rates also decrease northward along the coast of the Gulf of California in the ERIC-II
climatology. The heaviest events (~300 mm/d) in the long-term records are often due to
tropical storms making landfall in western Mexico, which have not been observed by
NERN as of this writing. Despite having a very limited period of record for sampling
maximum events the NERN does appear to be capturing the basic west to east gradient,
though the magnitudes of events are substantially lower than those from ERIC-II.

15
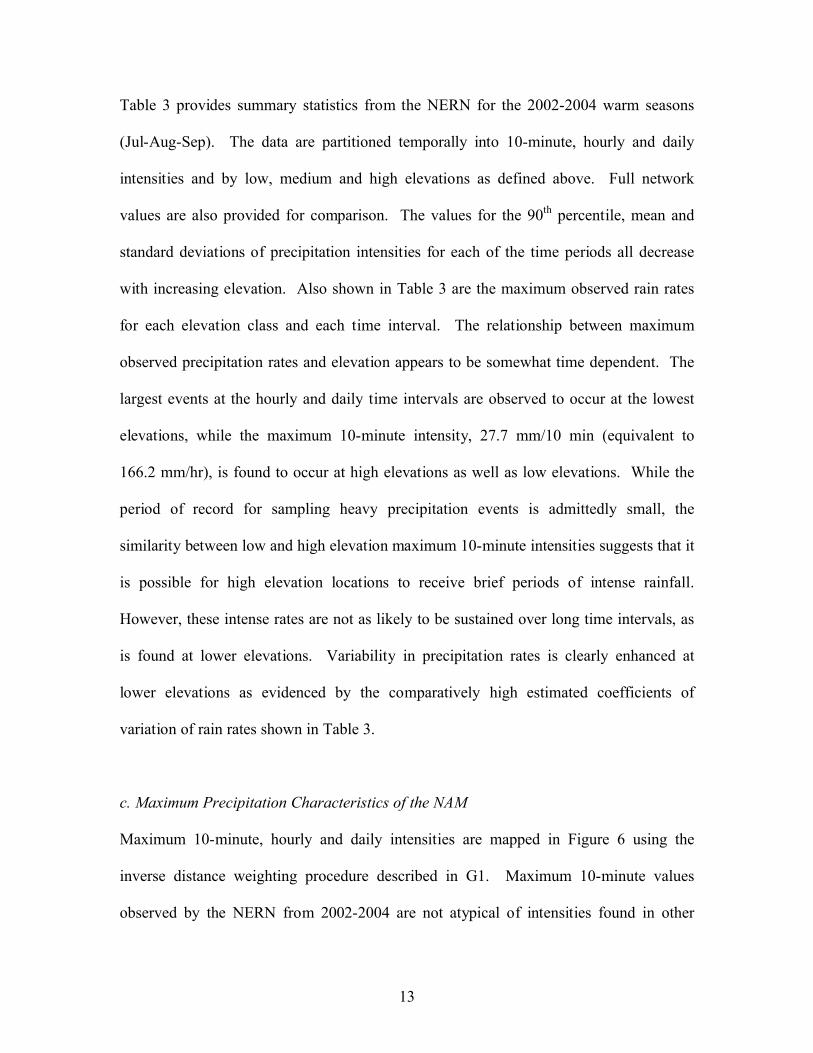
The concept of heavier precipitation being confined to the low elevations of the SMO
foothills and coastal plains is further illustrated in Figure 8, which shows a scatterplot of
the maximum observed precipitation values for the 10-minute, 60-minute and 24 hour
time intervals. The values plotted are each scaled by the respective time-interval mean
maximum intensity using all stations. While there is comparatively more variability in
maximum precipitation values near the coastline, there is a clear tendency for a tighter,
decreasing, relationship between maximum precipitation values and distance from the
coast. Pearson correlation values between distance from the coastline and the 10-minute,
60-minute and 24-hr time intervals of -0.41, -0.52 and -0.69, respectively, are all easily
statistically significant at the 95% level using a student’s t-test. The fact that sustained
heavy precipitation is limited to the low elevation foothills and the Gulf of California
coastal plain at the longer time intervals, suggests that certain environmental conditions
may be required in order to organize and sustain heavy precipitation. These conditions
may include deep moist instability and/or favorable dynamical conditions, such as
vertical wind shear, which are more likely found nearer the Gulf of California.
Monsoon precipitation intensity is partitioned into classes of light, moderate and heavy
precipitation in order to look at the occurrence of certain events at or above specified
threshold values. The pdf shown in Figure 5a is heavily skewed, as is typical with
precipitation intensity data. This skewness is generally due to the fact that light
precipitation amounts are observed much more frequently than moderate or heavy
precipitation events. This feature is true of the NERN where the 50th percentile of the
distribution, or the median, typically has precipitation intensity substantially lower than

16
the arithmetic mean and is of a magnitude generally not considered appreciable driving
significant runoff events. In this work, all ‘light’ precipitation events are defined as those
greater than zero but less than 10.0 mm/d. ‘Moderate’ precipitation events are those
greater than 10.0 mm/d but less 50.8 mm/d (2 in/d) while ‘heavy’ precipitation events are
characterized as those in excess 50.8 mm/d. From Fig. 5b it is noted that the thresholds
for moderate precipitation events are above the 60th percentile values at all elevations and
heavy precipitation events are in excess of the 90th percentile values.
Figures 9a and b show that heavy precipitation events at the daily timescale are more
commonly found in the foothill and coastal regions of the NERN domain. Over the past
three summers (2002-2004, Figure 9b) heavy events have tended to occur farther south
along the low elevation regions of Sinaloa and into the foothill and canyon regions of
western Durango. The 2004 summer exhibited a comparative extension of this heavy
precipitation regime farther northward along the coast where one or two heavy
precipitation events were observed. There appears to be a core region in central Sinaloa
that is susceptible to receiving a few large events every summer (> 3 events per season).
Moderate rainfall events are observed over a much wider portion of the NERN domain
(Figs. 9c and d). Maximum occurrence of moderate events tends to occur westward of the
SMO and in the south, but farther inland than the heavy events. Moderate intensity
events are less common on the eastern slope of the SMO, typically, less than 15 events
per season, although certain locations during 2004 did observe between 15-20 moderate
events. While the pattern of moderate events occurring during the 2004 EOP was similar
to that of the 2002-2004 summer average, more moderate events were observed in nearly
17
all regions. The occurrence of light precipitation (Figs. 9e and f) exhibits a pattern more
similar to the moderate events than the heavy event intensities. The maximum in light
precipitation occurrence exists well inland of the Gulf of California over the higher
elevations of the SMO. The axis of maximum light precipitation occurrence (between
40-60 events per season) follows the high terrain of the SMO northward and away from
the coastline. Moving away from this axis the occurrence of light precipitation decreases
to less than 40 events per season. Similar to the heavy and moderate precipitation
occurrence, 2004 possessed a greater number of light rain rate events compared to the
2002-2004 average.
The timing of the occurrence of the maximum 10-minute intensity on the diurnal cycle
from 2002-2004 is shown in Figure 10a. There is a clear tendency for the maximum 10-
minute rain rates to occur at night, from 2000 Local Solar Time (LST – 0300 UTC) to
0500 LST (1200 UTC) in the northwestern portion of the NERN domain, in Sonora. As
discussed in G1, this area is prone to receiving infrequent but intense nocturnal rainfall
generated from relatively long-lived, organized, mesoscale convective systems. Farther
inland, in the higher elevation regions of the SMO, peak rain rates tend to occur during
mid- to late-afternoon. Farther south, in Sinaloa and Durango, there is comparatively
more variability in the timing of the maximum 10-minute rain rates, though most events
tend to fall between mid-afternoon and the late-evening. It is interesting to note that there
are no instances where the maximum 10-minute rain rate was observed between the
morning hours of 0600 and 1100 LST (1300 – 1800 UTC). Similar patterns are found for
the maximum 60-minute rain rates (not shown).
18
Months of maximum observed daily precipitation from 2002-2004 are mapped in Figure
10b. While there is significant spatial variability in the month of maximum daily
precipitation, there is a general north to south pattern, where the heaviest events tend to
occur during July or August in the north, compared to August or September in the south.
This is interesting from the fact that September is often regarded as a month where the
monsoon tends to be waning in intensity and influence. It is also interesting from the
standpoint of generating runoff and streamflow. Regional streamflow analyses from
Gochis et al. (2006) showed that September and October exhibit significant increases in
the fraction of monthly precipitation ending up as streamflow in SMO headwater
catchments. This behavior is particularly evident along the southern SMO in Sinaloa and
western Durango. One explanation for this behavior was that these watersheds were well
‘conditioned’ to produce runoff after just having passed through the bulk of the rainy
season. However, a tendency for heavy precipitation events to occur during September,
as suggested by these preliminary analyses, might also be contributing to this runoff
response. The reason why the southern SMO are prone to receive their heaviest events in
September remains unclear. Over the long-term, it is likely that land-falling tropical
storms may contribute to this behavior but, as mentioned earlier, no significant tropical
storms impacted the NERN domain during 2002-2004. Because the NERN period of
record is short, the robustness of this pattern will be monitored as subsequent seasons of
data become available.
d. Validating the CPC gridded product
19
Key objectives of the NERN include improving the sampling of precipitation at the sub-
daily time scale, and in remote locations where precipitation has historically been poorly
observed. The paucity of observations at remote, often high elevation, locations can yield
significant biases in analyses of precipitation from spatially sparse observing networks.
One of the most widely used precipitation analyses in North American Monsoon research
has been the NOAA Climate Prediction Center (CPC) unified daily precipitation analyses
(Higgins et. al, 2000). This product is generated both operationally and retrospectively,
at a horizontal grid spacing of 0.25 deg. and was used as the operational forecast
verification product during EOP forecasting activities. Since the NERN is not an
operational product available in real-time, we want to assess the impact of including the
NERN data on the CPC daily analyses and determine if there were particular locations or
regions that suffered from systematic bias due to insufficient sampling and/or the
interpolation process. Figure 11 shows the differences in seasonal and monthly
precipitation from the 2004 NAME EOP between the CPC product with the daily NERN
observations included and the CPC-only product. June, July, August, September (JJAS)
differences range -250 to +250 mm for the NERN region. These differences are
equivalent to a substantial fraction of the interannual variability of precipitation in this
region. The CPC product, without the NERN, largely overestimates precipitation in the
mountainous region in eastern Sonora and western Chihuahua in the north, and tends to
underestimate precipitation in the higher elevation regions in western Durango and
eastern Sinaloa farther south. These biases are relatively stationary for the individual
months of July, August and September. Differences at the monthly time scale range from
approximately -100 to +100 mm and are relatively consistent from month to month

20
except in the north where differences are largest during July. The value of including the
event data is clearly evident at the daily timescale as shown for the 3-day period during
Intensive Observing Period-3 (IOP-3) during the NAME EOP (Figure 12). Differences
in the CPC-product with and without the NERN can range up to +/-30 mm for intense,
localized events. The signs of these differences, while generally similar to those
difference patterns at longer time scales, can be different at the daily timescale. Figures
11 and 12 each show that operational analyses at the daily, monthly and seasonal
timescales all possess significant biases in critical headwater regions in the SMO and that
inclusion of the NERN in the retrospective CPC gridded analyses should improve spatial
estimates of monsoon precipitation.
4. Summary
This study has examined precipitation intensity structures and relationships from the
NERN in northwest Mexico. Emphasis was placed on characterizing rainfall intensity
behavior at various time intervals and in relation to regional physiography such as terrain
elevation and the distance to the Gulf of California. Results from the 2004 NAME EOP
were presented as were those from the entire NERN observation period of 2002-2004.
Where relevant, comparisons were made between NERN observations and available
long-term station data. The principal findings of this study are summarized as follows:
q July-August, NERN-observed precipitation totals during the 2004 NAME EOP
were generally similar in spatial distribution and magnitude to long-term averages
from cooperative observation sites. Jul-Aug totals from 2003 were found to be

21
significantly less than 2004 and the long-term average for most all regions in the
NERN domain. Maximum NERN-observed 24-hr precipitation intensities from
2002-2004 are significantly lower than those observed by long term gauge records
in western Mexico.
q The most active precipitation period during the 2004 EOP as defined by the days
where precipitation was most widely observed and days which received their
2004 maximum daily precipitation was centered on IOP-3 (21-24 July). The
synoptic setting during this period helped generate widespread precipitation and at
least two large MCS events, which produced heavy rainfall at many sites.
q Precipitation intensity statistics from the 2002-2004 NERN record indicate a
tendency for higher intensity values and increased variability at low elevations
compared to higher elevations. This behavior is generally evident at a range of
time scales from 10-minute to daily although large precipitation intensities at the
10-minute timescale can be observed at high elevations.
q Maximum observed precipitation intensity values at the hourly and daily
timescale as well as ‘heavy’ precipitation events are generally restricted to the low
elevation foothill and coastal plain regions adjacent to the Gulf of California. The
number of stations receiving ‘heavy’ precipitation events was greater during 2004
compared to 2002 and 2003.
q There is a statistically significant inverse correlation between the maximum
observed precipitation intensity and the distance to the Gulf of California, which
is strongest at the daily timescale and weakest at the 10-minute timescale.

22
q There is preliminary evidence of a north-south gradient in the month of maximum
observed daily precipitation. Maximum daily events are found more often during
September in southern portions of the NERN domain versus during July in the
northern part of the NERN domain. Given the shortness of the NERN record the
robustness of this pattern is highly uncertain.
q NERN observations serve to correct large and spatially-stationary biases in
operational, gauge-based precipitation analyses used during the 2004 EOP. The
magnitudes of the biases in the operational product constitute significant fractions
of the interannual variability of precipitation in key headwater regions of the
SMO.
The NERN record clearly is not of sufficient length to properly characterize the statistical
distribution of the magnitudes of extreme events in the NAME region. This is
particularly true for characterizing the magnitudes of extreme events as evidenced by the
difference between the NERN-observed 24 hr maximums and those observed by the
ERIC-II climatologies. However, this preliminary analysis shows that the NERN, despite
its short record, is beginning to reveal the spatial patterns of precipitation intensity at a
range of timescales. Similar to G1, the data also reveal patterns of precipitation behavior,
such as the inverse relationship of precipitation intensity with the distance to the Gulf of
California, that are not likely to change over time. Information on the spatial patterns of
precipitation frequency and intensity is key to advancing our knowledge of the processes
that generate monsoon precipitation as well as understanding the influence of monsoon
precipitation on regional hydrology. In reference to the latter point, characterization of

23
rainfall intensities at sub-daily intervals, which are critical for hydrological prediction,
should improve as the NERN period of record lengthens. Similarly, NERN data and the
analyses presented should be useful to those attempting to validate remote sensed
estimates of precipitation or verify model predictions of precipitation at timescales
ranging from minutes to seasonal. Many of these types of studies are found as
companion articles in this special issue.
The spatial patterns of precipitation intensity revealed in this work, and those of
precipitation frequency discussed in G1, support the regional hydroclimatology described
in Gochis et al. (2006). In that work, three coherent regions of seasonal precipitation and
streamflow variability were found; a northern region, a southern region and an eastern
region. The present findings support the hypothesis posed in Gochis et al. (2006) that
there are a few distinct differences in the character of precipitation in these regions that
contribute to rainfall-runoff behavior in each of these regions. In the northern regions,
precipitation is comparatively infrequent and significant fractions of seasonal total
precipitation, which is also low compared to farther south, may be deposited over a few
active periods. This means that soils have ample opportunity to dry down between
rainfall events and that many in-basin abstractions and storages may never be filled. The
magnitude of sustained large events is also less in the north than in the south according to
the NERN and long-term records. Combined with greater evaporative demand, the drier
regime and lower intensity of sustained rainfall events in the north favors lower runoff
yields, which is defined by the fraction of precipitation being converted to streamflow.
The tendency for heavy precipitation events to occur later in the summer farther south
24
(Fig. 10b) when soil moisture is high may also contribute to higher runoff yields there.
The differences between northern and southern regions are similar to those found
comparing the eastern slope basins of the SMO with those in the southern portion of the
NERN domain. In particular, the lack of very heavy precipitation events occurring on the
eastern slope likely contributes to its substantially lower runoff yields. Further
exploration of the relationship between precipitation character and runoff and its
modulation on inter-annual timescales is the subject of ongoing work.
The value of regional climate observing networks, such as the NERN, grows in
proportion to their periods of record. While much as been learned since the initial
implementation of the NERN in 2002, the interpretation of these findings and the
attribution of physical processes that generate monsoon precipitation will improve as the
NERN continues to sample both high frequency (e.g. diurnal cycle) and low frequency
(e.g. atmospheric transients such as surges and landfalling tropical storms) events.
Robust analyses of the influence of low frequency transients await the collection of
additional years of data in order to obtain event populations of significant size. The same
is true for studies on the interannual variability of precipitation in the NERN domain.
Because the statistics of precipitation features, such as intensity, possess a high degree of
temporal and spatial variability it is essential to maintain regional climate observing
networks, such as the NERN, in order to reduce uncertainty in our understanding of
precipitation events and their causative mechanisms. Continued coordination of the
NERN with ongoing NAME research should continue to lead to improved understanding
and predictions of the North American Monsoon system.

25
ACKNOWLEDGEMENTS
The authors wish to acknowledge the assistance of the Comision Nacional del Agua
(CNA) for their continued support of the NERN data collection effort. The authors also
wish to thank the Instituto Mexicano de Tecnología del Agua (IMTA) and Dr. Luis Brito
for making available data from the ERIC-II database and to Dr. Wei Shi of the NOAA
Climate Prediction Center for producing the merged NERN-CPC gridded precipitation
product. Constructive reviews of this manuscript were courteously provided by David
Ahijevych and Tom Warner of the National Center for Atmospheric Research. Support
for this work was provided by the NOAA Office of Global Programs Contract
NA04OAR4310166.
26
REFERENCES
Allen, M.R. and W.J. Ingram, 2002: Constraints on future changes in climate and the
hydrologic cycle. Nature, 419, 224-232.
Anderson, B.T. and H. Kanamura, 2005: The diurnal cycle of the summertime
atmospheric hydrologic cycle over the southwestern United States. J. Hydrometeor., 6,
219-228.
Biondi, F., P.C. Hartsough and I.G. Estrada, 2005: Daily weather and tree growth at the
tropical treeline of North America. Arctic and Alpine Res., 37, 16-24.
Brito-Castillo, L., A.V. Douglas, A. Leyva-Contreras, D. Lluch-Belda, 2003: The effect
of large-scale cicurlation on precipitation and streamflow in the gulf of California
continental watershed. Int. J. Climatol., 23, 751-768.
Comrie, A.C. and E.C. Glenn, 1998: Principal components-based regionalization of
precipitation regimes across the southwest United States and northern México, with an
application to monsoon precipitation variability. Clim. Res., 10, 201-215.
Douglas, M.W., R.A. Maddox, K. Howard and S. Reyes, 1993: The Mexican monsoon. J.
Climate, 6, 1665-1677.

27
Duchon, C.E. and G.R. Essenberg, 2001: Comparative rainfall observations from pit and
aboveground rain gauges with and without wind shields. Water Res. Research, 37(12),
3253-3263.
ERIC, 1996: Extractor Rápido de Información Climatológica. Instituto Mexicano de
Tecnología del Agua CD y manual de usuario. Colección proyectos IMTA. Serie
programas. Primera Edición, México, ISBN 968-7417-11-0.
Fawcett, P.J., J.R. Stalker, and D.S. Gutzler, 2002: Multistage moisture transport into the
interior of northern Mexico during the North American summer monsoon. Geophys. Res.
Lett., 29, 2094, doi:10.1029/2002GL015693.
Gebremichael, M., W.F. Krajewski, M. Morrissey, D. Langerud, G.J. Huffman and R.
Adler, 2003: Error uncertainty analysis of GPCP monthly rainfall products: A data-based
simulation study. J. Appl. Meteor., 42, 1837-1848.
Gochis, D.J., J.-C. Leal, W.J. Shuttleworth, C.J. Watts, J. Garatuza-Payan, 2003:
Preliminary diagnostics from a new event-based precipitation monitoring system in
support of the North American Monsoon Experiment. J. Hydrometeor., 4, 974-981.
Gochis, D.J., A. Jimenez, C.J. Watts, J. Garatuza-Payan, W.J. Shuttleworth, 2004:
Analysis of 2002 and 2003 warm-season precipitation from the North American
Monsoon Experiment Event Rain gauge Network. Mon. Wea. Review, 132, 2938-2953.
28
Gochis, D.J., J.C. Leal, A. Jimenez, C.J. Watts, J. Garatuza-Payan, J. Cesar-Rodriguez,
W.J. Shuttleworth, 2005: NAME surface rainguage network station files. Tech. Doc.,
100 pp. [Available from D.J. Gochis upon request.]
Gochis, D.J., L. Brito-Castillo, W.J. Shuttleworth, 2006: Hydroclimatology of the North
American Monsoon region in northwest Mexico. J. Hydrol., 316, 53-70.
Guztler, D.S., 2004: An index of interannual precipitation variability in the core of the
North American Monsoon region. J. Climate, 17, 4473-4480.
Habib, E. W.F. Krajewski and A. Kruger, 2001: Sampling errors of tipping-bucket rain
gauge measurements. J. Hyd. Engineer., 6(2), 159-166.
Higgins, R.W. Y. Yao, and X. Wang, 1997: Influence of the North American monsoon
sytem on the U.S. summer precipitation regime. J. Climate, 10, 2600-2622.
Higgins, R.W., W. Shi, E. Yarosh and R. Joyce, 2000: Improved United States
Precipitation Quality Control System and Analysis. Atlas No. 7, NCEP/Climate
Prediction Center, 40 pp.

29
Higgins, R.W. and W. Shi, 2001: Intercomparison of the principal modes of interannual
and intraseasonal variability of the North American monsoon system. J. Climate, 14,
403-417.
Higgins, R.W., Douglas, A., Hahmann, A., Berbery, E.H., Gutzler, D., Shuttleworth, J.,
Stensrud, D., Amador, J., Carbone, R., Cortez, M., Douglas, M., Lobato, R., Meitin, J.,
Ropelewski, C., Schemm, J., Schubert, S., Zhang, C.D., 2003. Progress in pan American
CLIVAR research: the North American monsoon system. Atmosfera, 16 (1), 29–65.
Hu, Q., and S. Feng, 2002: Interannual rainfall variations in the North American summer
monsoon region: 1900-1998. J. Climate, 15, 1189-1202.
Humphrey, M.D., J.D. Istok, J.Y. Lee, J.A. Hevesi and A.L. Flint, 1997: A new method
for automated dynamic calibration of tipping-bucket rain gauges. J. Atmo. and Ocean.
Tech., 14, 1513-1519.
Matsui, T., V. Lakshmi, and E.E. Small, 2005: The effects of satellite-derived vegetation
cover variability on simulated land-atmosphere interactions in the NAMS. J. Climate,
18, 21-40.
Meehl, G., J.M. Arblaster, and C. Tebaldi, 2005: Understanding future patterns of
increased precipitation intensity in climate model simulations. Geophys. Res. Lett., 32,
L18719, doi:10.1029/2005GL023680.
30
NAME Science Working Group, cited 2005: North American Monsoon Experiment
Science and Implementation plan. [Available online at
http://www.cpc.ncep.noaa.gov/products/precip/monsoon/NAME.html].
Viramontes, D., and L. Descroix, 2003: Changes in the surface water hydrological
characteristics of an endoreic basin of northern Mexico from 1970 to 1998. Hyd.
Process., 17, 1291-1306.
Wood, S.J., D.A. Jones, R.J. Moore, 2000: Accuracy of rainfall measurement for scales
of hydrological interest. Hydrol. and Earth Sys. Res., 4, 531-543.

31
Figure Captions
Figure 1: Map of northwest Mexico showing the NERN domain and tipping bucket rain
gauge locations (black circles). Grey shading indicates topography and bounding box
indicates extent of spatially-interpolated products (i.e. NERN domain).
Figure 2: Experimental data used during calibration of the TE525USW tipping bucket
rain gauges. a) Controlled flow rate versus TE525USW estimated flow rate (black
diamonds) and TE525USW-calibrated flow rates (open circles). b) Average relative error
of uncalibrated (black diamonds) and calibrated (open circles) TE525USW flow rate
estimates.
Figure 3: Map of Jul-Aug total precipitation (mm) as estimated from the NERN for a)
2004, b) the ERIC-II long-term climatology and c) for 2003 from the NERN. Markers
indicate respective NERN and ERIC-II station locations.
Figure 4: GOES infrared satellite images of two large mesoscale convective systems
occurring over northwest Mexico from a) 0709 UTC on 23 July, 2004 and b) 0539 UTC
on 24 July, 2004. Panel c) shows the four day total precipitation from 21-24 July, 2004
corresponding with IOP-3 (units are in mm) and d) shows the fraction of total 2004 Jul-
Aug precipitation occurring within the 21-24 July, 2004 period.

32
Figure 5: a) Probability density function of 24 hr precipitation events from all NERN
gauges. b) Cumulative distribution plots of the 24 hr events separated by high (2000-
3000 m ASL-black circles), middle (1000-2000 m ASL-light grey circles) and low (0-
1000 m ASL- dark grey boxes) elevations. Vertical lines indicate partitioning between
‘L’-light (0-10 mm/d), ‘M’-moderate (10-50.8 mm/d) and ‘H’-heavy (> 50.8 mm/d) event
sizes.
Figure 6: 2002-2004, NERN-observed maximum precipitation intensities for a) 10-
minute, b) 60-minute and c) 24-hour time intervals. Units for a) and b) are in mm/hr and
c) in mm/d.
Figure 7: Comparison of the maximum 24 hour precipitation intensity values as
estimated from a) the NERN and b) the ERIC-II climatology. Units in mm/d.
Figure 8: Scatterplot of the maximum observed precipitation values for the 10-minute,
60-minute and 24 hour time intervals versus distance from the Gulf of California
coastline (km). Maximum precipitation intensity values on the y-axis have been
normalized by the respective time interval mean maximum intensity.
Figure 9: Counts of heavy (a and b), moderate (c and d) and light (e and f) precipitation
occurrence from the NERN for JAS of 2004 (a, c and e) and the JAS average from 2002-
2004 (b, d, and f).

33
Figure 10: a) Hour of day of the NERN-observed maximum 10-minute intensity from
2002-2004 (Local solar time). b) Month of NERN-observed maximum 24-hr
precipitation intensity.
Figure 11: NERN corrected CPC minus the operational CPC total precipitation (mm) for
a) JJAS, b) Jul, c) Aug and d) Sep 2004.
Figure 12: As in 10 but for daily precipitation totals from a) 23 July, b) 24 July, and c)
25 July, 2004. Units in mm.

34
List of Tables
Table 1: Top five dates where precipitation was observed at a large number of stations
(e.g. ‘widespread precipitation’)
Table 2: Top five dates where individual station 24 hour maximum intensities were
observed.
Table 3: Precipitation intensity statistics from NERN observations from 2002-2004.

SONORA
CHIHUAHUA
SINALOA
DURANGOBAJA CALIFORNIA SUR

0
50
100
150
200
250
300
0 50 100 150 200 250 300Design Flow Rate (mm/hr)
TE52
5USW
Rai
n Ra
te (m
m/h
r)
TE525USWDesign Rate (1:1)Bias Corrected Rate
-30.0
-25.0
-20.0
-15.0
-10.0
-5.0
0.0
5.0
10.0
0 50 100 150 200 250 300
Dispensed Flow Rate (mm/hr)
Aver
age
Rela
tive
Erro
r (%
)
Uncalib. Rel. Error
BIAS Corr Rel. Error
Figure 2: Experimental data used during calibration of the TE525USW tipping bucket rain gauges. a) Controlled flow rate versus TE525USW estimated flow rate (black diamonds) and TE525USW-calibrated flow rates (open circles). b) Average relative error of uncalibrated (black diamonds) and calibrated (open circles) TE525USW flow rate estimates.


0
0.5
1
1.5
2
2.5
3
0.0 50.0 100.0 150.0 200.0 250.0 300.0 350.0
Distance to Gulf of California (km)
Stan
dard
ized
Pre
cipi
tatio
n R
ate 10-Minute Rate
60-Minute Rate24-Hr Rate
Figure 8: Scatterplot of the maximum observed precipitation values for the 10-minute, 60-minute and 24 hour time intervals versus distance from the Gulf of California coastline (km). Maximum precipitation intensity values on the y-axis have been normalized by the respective time interval mean maximum intensity.


l
Figure 11: NERN corrected CPC minus the operational CPC total precipitation (mm) for a) JJAS, b) Jul, c) Aug and d) Sep 2004.
a) b)
c) d)
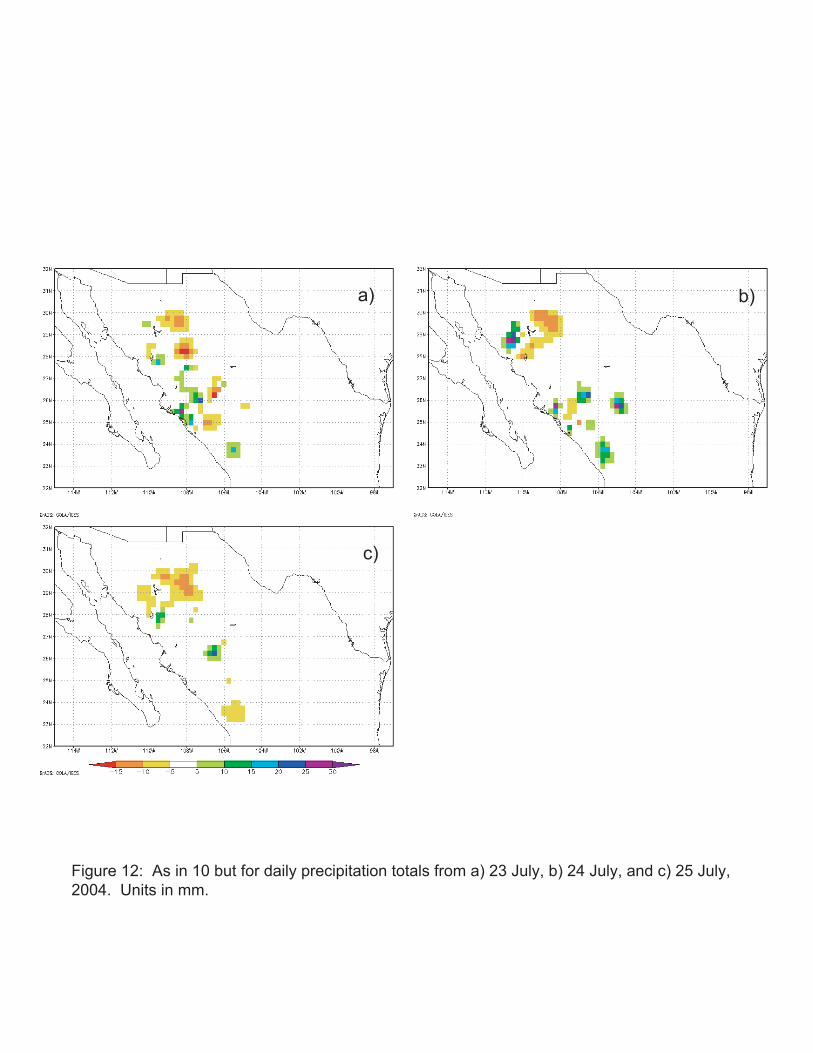
Figure 12: As in 10 but for daily precipitation totals from a) 23 July, b) 24 July, and c) 25 July, 2004. Units in mm.
a) b)
c)

Days of Widespread No. Stations
Precipitation Receiving Precipitation
July 23 80
July 24 80
Aug 2 77
July 14 76
Aug 29 74
Table 1: Top five dates where precipitation was observed at a large number of stations (e.g. 'widespread precipitation')

Dates of Maximum No. Stations Receiving
Precipitation Occurrence 2004 Maximum Precipitation
July 22 7
Sep 18 6
July 21 5
July 23 5
Aug 28 4
Table 2: Top five dates where individual station 24 hour maximum intensities were observed.
Maximum 90th Percentile Mean St. Dev. Coeff. Var.
Intensity (mm) (mm) (mm) (mm)
10 Minute
All Sites 27.7 2.0 0.9 1.7 0.31
Low El. 27.7 2.5 1.2 2.2 0.31
Mid. El. 23.1 1.8 0.9 1.6 0.30
Hi. El. 27.7 1.5 0.7 1.2 0.28
Hourly
All Sites 87.2 5.1 2.4 4.7 2.00
Low El. 87.2 6.1 3.1 6.3 2.03
Mid. El. 48.0 5.1 2.2 4.1 1.86
Hi. El. 55.4 4.3 1.8 3.2 1.78
Daily
All Sites 117.4 23.9 8.9 12.0 1.35
Low El. 117.4 27.8 10.8 14.6 1.35
Mid. El. 110.7 20.8 8.2 11.0 1.34
Hi. El. 89.5 19.1 7.3 8.9 1.22
Table 3: Precipitation intensity statistics from NERN observations from 2002-2004.