Spain’s electricity market design A case study
62
Spain’s electricity market design – A case study PATRIK BENNERSTEDT JOHAN GRELSSON Master of Science Thesis Stockholm, Sweden 2012
Transcript of Spain’s electricity market design A case study

Spain’s electricity market design – A case study
PATRIK BENNERSTEDT JOHAN GRELSSON
Master of Science Thesis
Stockholm, Sweden 2012

Spain’s electricity market design -A case study
Patrik Bennerstedt Johan Grelsson
Master of Science Thesis INDEK 2012
KTH Industrial Engineering and Management
Industrial Management 2012:31
SE-100 44 STOCKHOLM
Master of Science Thesis KTH School of Industrial Engineering and
Management Energy Technology EGI-2012-025MSC
Division of Applied Thermodynamics SE-100 44 STOCKHOLM

Master of Science Thesis INDEK 2012:31
Master of Science Thesis EGI 2012: EKV883
Spain’s electricity market design
-A case study
Patrik Bennerstedt
Johan Grelsson
Approved
2012-06-08
Examiner
Staffan Laestadius
Supervisor
Thomas Sandberg
Commissioner
Vattenfall
Contact person
Mats Nilsson
Abstract
Spain’s rapid implementation of renewable energy has been described as a success but the
governmental cost associated to this rapid implementation has grown significantly. The purpose
of this report is to investigate Spain’s electricity market, its current situation and present it, using
the Swedish system as a reference.
The report commences with a presentation of the Spanish and the Swedish electricity markets,
followed by a chapter where they are compared. The renewable electricity production and the
associated development during the last decade is one focus of the comparison. The other focus is
how the costs of the subsidy systems have evolved and how they are connected to the different
energy sources. Two sources, wind and solar, receives a higher interest than the others.
Wind power shows a strong development in electricity production and contributes to a
significant part of the Spanish electricity mix. The costs of subsidies connected to the wind
power reflect the produced electricity. Wind power in Sweden has had a rapid development over
the last two years and the subsidies costs are aligned with the electricity production through the
use of a quota system.
There are great differences between the two countries regarding solar power. Sweden has hardly
any, while Spain has a noticeable contribution of electricity from solar power to its electricity
mix. Solar power has an even more noticeable share in the Spanish subsidy system. The high
subsidies to solar power, which have not followed the reduced investment costs of equipment in
recent years, have led to a high degree of participation which has led to soaring costs for the
system. Spain’s subsidy system is based on fixed earnings and variable costs and in combination
with higher than expected costs, an annual deficit between the earnings and cost has been created
for the government. This yearly deficit has increased and the Spanish government is now in debt
to the five largest energy suppliers. The Swedish subsidy system carries its own costs and the
Swedish government does not have a financial risk associated with the system.

This study shows that the Spanish subsidy system has been too generous towards solar power
which is a large part, but not the only one, to the country’s huge deficit and debt. Sweden, with
its quota system constructed without fixed earnings, does not risk creating a debt similar to
Spain’s. Spain’s large part of wind power and how the volatile power is regulated could be of
interest for Sweden which aims to increase its share of wind power in the future. This study find
the answer to how Spain copes with its high share of intermittent power production in that it
accepts a lower efficiency in its gas turbines in order to regulate the power output. Sweden, a
country without a large share of gas in its electricity mix, but with a large share of hydro power,
uses its hydro capacity to regulate volatility in electricity system. Prior studies have already been
made in this area with the result that 30 TWh of electricity from wind power, more than
Sweden’s goal for 2020 regarding wind power, would be possible to regulate with the present
system each year.
Key-words
Electricity market design, renewable energy support scheme, feed-in tariff, quota system

Examensarbete INDEK 2012:31
Examensarbete EGI 2012: EKV883
Elektricitetsmarknaden i Spanien
-En fallstudie
Patrik Bennerstedt
Johan Grelsson
Godkänd
2012-06-08
Examinator
Staffan Laestadius
Handledare
Thomas Sandberg
Uppdragsgivare
Vattenfall
Kontaktperson
Mats Nilsson
Sammanfattning
Spanien har haft en kraftig ökning av förnyelsebar kraftproduktion och utvecklingen har
beskrivits som en framgångssaga. Det finns dock indikationer på att det inte täcker hela
situationen då statens utgifter i form av subventioner har ökat dramatiskt och skapat en avsevärd
skuld. Den här rapporten beskriver och analyserar den spanska elmarknaden och situationen
idag, med den svenska elmarknaden som referens.
Inledningsvis beskrivs de spanska och de svenska elmarknaderna inklusive stödsystemen i
respektive land. Denna beskrivning följs upp av en analys och jämförelse av dels utformningen
av hur elmarknaderna ser ut och dels hur de subventionerade kraftslagen och kostnaderna för
stödsystemen har utvecklats över en sjuårsperiod. Vind och solkraft visade sig vara mest
intressanta för djupare analys.
Vindkraften i Spanien står för en stor del av den årliga elproduktionen och kostnaderna för
subventionerna till vindkraft är i proportion till elproduktionen. I Sverige ökade andelen
vindkraft ordentligt under de två senaste åren och tack vare handeln med elcertifikat är
subventionskostnaderna i proportion mot produktionen.
Spanien och Sverige skiljer sig kraftigt åt vad det gäller utbyggnaden av solkraft, i Sverige är den
kommersiella elproduktionen från solkraft näst intill obefintlig medan den i Spanien står för en
märkbar del av den totala produktionen. Den spanska statliga ersättningen till solkraft är relativt
hög och den har inte följt utvecklingen och prissänkningen på utrustning till solkraft, vilket har
lett till en större utbyggnad än väntat. Detta, tillsammans med att det spanska
subventionssystemet är baserat på fasta inkomster och varierande kostnader, har lett till ett stort
underskott i systemet. Vilket i sin tur har lett till att den spanska staten nu har en stor skuld till
landets fem största energileverantörer.
Studien finner att det spanska subventionssystemet för solkraft har varit för generöst, vilket är en
delförklaring till underskottet och den nuvarande statliga skuldsättningen. Sveriges handel med
elcertifikat bär sina egna kostnader och riskerar inte att generera ett statligt underskott.

Spaniens stora andel vindkraft och hur den balanseras skulle kunna vara av intresse för Sverige
som planerar att öka sin andel vindkraft i framtiden. Dock visar den här studien att skillnaderna i
naturliga förutsättningar och den nuvarande elmixen är stora, vilket gör en sådan analys mindre
intressant. Spanien använder sin stora mängd gasturbiner för att balansera kraftproduktion mot
efterfrågan. I Sverige används vattenkraften till den balanseringen, något som är att föredra
framför att använda gasturbiner. Tidigare studier har visat att Sverige skulle kunna balansera 30
TWh årlig vindkraftsel, vilket överstiger de politiska målen för 2020.

Comments by the authors There are a number of persons that have been helpful and contributed with their knowledge to
us and our work with this master thesis, especially during the start up phase and information
collecting regarding the Swedish energy system. The authors needed help structuring the
knowledge gained from literature and discussions with competent people working in the
business significantly helped that work. These discussions and interviews may not have
rendered into a direct source in the report but were extremely helpful to us and we were often
provided with further relevant sources from the discussions. However, there is a larger
amount of people that deserve a thank you and we have chosen not to mention each and every
one here, but that does not mean that we are any less grateful for their contribution.
We would like to thank Mats Nilsson at Vattenfall for the guidance during this master thesis
and we are grateful for the discussions, ideas and knowledge that he contributed with to this
report and its work progress in general.
Cesar Martinez Villar at Endesa has been an excellent contact in Spain and provided us with
literature, relevant facts, numbers and has both patiently and quickly answered all our
questions. We are very grateful for all of his help and it is no exaggeration to say that this
project would have been significantly harder without him.
Last but not least, we would like to thank Thomas Sandberg, our supervisor at KTH, he has
been a helpful supervisor and contributed with ideas and knowledge throughout the whole
project.
Patrik Bennerstedt & Johan Grelsson
Stockholm May, 2012

Table of contents
1 Introduction ......................................................................................................................... 11
1.1 Background ..................................................................................................................... 11
1.2 Task ................................................................................................................................ 12
1.3 Objective ......................................................................................................................... 13
1.4 Delimitations .................................................................................................................. 13
1.5 Theses ............................................................................................................................. 13
1.6 Report outline ................................................................................................................. 14
2 Research paradigm and methodology ............................................................................... 15
2.1 Research paradigm ......................................................................................................... 15
2.2 Methodology ................................................................................................................... 16
2.3 Method ............................................................................................................................ 17
3 Definitions ............................................................................................................................ 18
3.1 Subsidies ......................................................................................................................... 18
3.2 Feed-in tariff ................................................................................................................... 18
3.3 Premium system ............................................................................................................. 18
3.4 Quota system .................................................................................................................. 19
3.5 Third party access tariffs ................................................................................................ 19
3.6 Bilateral contracts ........................................................................................................... 19
3.7 Combined cycle gas turbine or CCGT ........................................................................... 20
4 The Swedish case ................................................................................................................. 21
4.1 Natural conditions ........................................................................................................... 21
4.2 The current electricity mix ............................................................................................. 21
4.3 History ............................................................................................................................ 22
4.4 The electricity market ..................................................................................................... 22
4.4.1 Elspot – the day ahead market ................................................................................. 23
4.4.2 Elbas – the intraday markets .................................................................................... 24
4.4.3 The frequency regulation ......................................................................................... 24
4.4.4 The balance settlement ............................................................................................. 25
4.5 Political ambition ............................................................................................................ 26
4.6 Subsidies ......................................................................................................................... 26
4.6.1 Green certificate – A quota system .......................................................................... 26
5 The Spanish case .................................................................................................................. 28

5.1 Natural conditions ........................................................................................................... 28
5.2 The current electricity mix ............................................................................................. 28
5.3 History ............................................................................................................................ 30
5.4 The electricity market ..................................................................................................... 30
5.4.1 Bilateral forward trading .......................................................................................... 30
5.4.2 The Spanish pool – the day ahead market................................................................ 30
5.4.3 The intraday markets ................................................................................................ 31
5.4.4 The frequency regulation ......................................................................................... 31
5.4.5 The balance settlement ............................................................................................. 32
5.5 Political ambition ............................................................................................................ 32
5.6 Subsidies ......................................................................................................................... 33
5.6.1 The fixed feed-in tariff system – A market-independent system ............................. 34
5.6.2 Premium price system – A market-dependent system ............................................. 34
5.6.3 Costs of the two systems .......................................................................................... 35
5.6.4 Premium system more profitable for producers ....................................................... 35
5.7 The Spanish deficit ......................................................................................................... 35
6 Comparison of the two cases .............................................................................................. 37
6.1 Biomass, hydro, wind and solar power ........................................................................... 37
6.2 Biomass .......................................................................................................................... 40
6.3 Small scale hydro power ................................................................................................. 41
6.4 Wind power .................................................................................................................... 43
6.5 Solar power ..................................................................................................................... 45
6.6 Within-case analysis ....................................................................................................... 48
6.7 Other subsidised electricity sources ............................................................................... 51
6.8 Uncertainty comparison between feed-in tariff & quota system .................................... 52
6.9 Comparison of frequency regulation systems ................................................................ 53
7 Conclusion ............................................................................................................................ 54
8 Discussion ............................................................................................................................. 55
8.1 Spanish subsidies ............................................................................................................ 55
8.2 The regulation question .................................................................................................. 56
8.3 General discussion .......................................................................................................... 56
8.4 Source criticism .............................................................................................................. 56
8.5 Future research ............................................................................................................... 57
8.5.1 A European subsidy system ..................................................................................... 57

8.5.2 An adaption to electricity mix 2.0 ............................................................................ 57
References ............................................................................................................................... 59
Table of figures & tables Figure 1. The electricity mix in Sweden 2009.………………..……………………...………22
Figure 2. Schematic of how the electricity price and volume is set....…………………..…....23
Figure 3. Schematic of the ordinary reserve’s operating interval..……………………...……24
Figure 4. The Spanish electricity production ...……………………………………………....29
Figure 5. Power flow in Spain..………………………………………………………………29
Figure 6. Schematics of the premium price system...………………………………………...30
Figure 7. Share of biomass, small hydro, solar and wind in Spain and Sweden...……...........38
Figure 8. Annual Spanish electricity price between 2004 and 2010.…………………............39
Figure 9. Average subsidy cost per MWh to renewable energy……………………………...39
Figure 10. Share of electricity produced from biomass ...……………………………………40
Figure 11. Cost of subsidies per MWh of electricity produced from biomass……………….41
Figure 12. Share of electricity production from small hydro power………………….………42
Figure 13. Subsidy cost per MWh of electricity produced from hydro power……………….42
Figure 14. Annual share of wind power in Spain and Sweden…………………….…………43
Figure 15. Availability of wind power in Spain and Sweden from 2004 to 2011...………….44
Figure 16. Subsidy cost per MWh of electricity produced from wind power……..…………45
Figure 17. Share of solar power in Spain from 2004 to 2011……………………..………….46
Figure 18. Subsidy cost per MWh of electricity produced from solar power ...…..………….47
Figure 19. Annual cost of subsidies to solar power in Spain from 2004 to 2011….…………47
Figure 20. Annual electricity production in Spain from biomass, small hydro, wind and solar
power from 2004 to 2011……………………………………………………………………..48
Figure 21. Annual cost of subsidies to biomass, small hydro, wind and solar power in Spain
between the years 2004 to 2011………………………………………….…………………...49
Figure 22. Annual electricity production in Sweden from biomass, small hydro and wind
power between the years 2004 to 2011……………………………………………………….50
Figure 23. Annual cost of subsidies to biomass, small hydro and wind power in Sweden…..51
Figure 24. Fuel mix in Spanish combined heat and power plants……………….…………...52
Table 1. Definition of biomass, small hydro, wind and solar entitled to subsidies…………..37

11
1 Introduction
The report’s background, task, objective, delimitations, theses and general outline are
presented to provide the report’s structure and content.
1.1 Background A number of European countries have ambitions to increase the amount of renewable energy
in their electricity mixes. There are different techniques that enable electricity to be produced
without the use of fossil fuels or nuclear power. The two most popular techniques in recent
investments utilize wind or solar power (Clean Technica, 2012).
In Sweden, solar power is not particularly viable due to the climate, but the share of electricity
produced from wind power is growing rapidly. The electricity produced from wind increased
with over 70 %, from 3.5 to 6.1 TWh from 2010 to 2011 (Svensk Vindenergi, 2012a). In
2011, wind power produced approximately 4 % of Sweden’s total electricity production of
146.5 TWh (Swedish Energy Agency, 2011a, 2012; Swedenergy, 2012). A large share of
wind power in an electricity system can create situations that may cause problems in the
system and threat both technical and economic stability due to the volatile nature of the wind
speed.
Several European countries have introduced different subsidy systems in order to increase the
share of renewable energy. Two of these countries are Spain and Sweden. Spain has
ambitious goals for its renewable electricity production and has, until recently, had generous
subsidies to renewable electricity producers. In the beginning of 2012, Spain stopped new
power plants from entering the subsidy scheme because of high costs and problems of
financing the system. The government’s debt due to the accumulated deficit connected to
these subsidies had at this time increased to € 24 billion (Bloomberg, 2012). The yearly deficit
continues to increase the debt and it is questionable if a system that is considered to be a
pioneer in implementing renewable energy and by Dong (2006) and Schallenberg-Rodriguez
(2012) described as best practice, should result in such a high deficit and debt. The changes in
the subsidies to solar power in 2010 and the freezing of all new installations in 2012 raises
even more thoughts of how well designed the Spanish system has been (Bloomberg, 2010;
Bloomberg, 2012).
However, until the subsidies to new power plants were frozen, the Spanish subsidy system
had led to an increasing amount of installed capacity and electricity being produced from
wind and solar power. This has complicated the electricity system since wind and solar power
have a more intermittent production compared to more traditional electricity production such
as coal and nuclear power plants. An electricity system with a large share of wind and solar
power needs access to other electricity production to support the system when the wind or
solar power produces less electricity than expected. Different ways of solving this could be
having back-up power available, through a closer connection with other countries which
would allow for larger volumes being internationally transferred or by increasing the demand

12
elasticity in such a manner that the demand follows the production from wind and solar power
more closely (IEA, 2011).
These three solutions are significantly easier to suggest than to implement. Firstly, to invest in
new back-up capacity with low yearly runtime is expensive. Secondly, to invest in new
connections to other countries is also associated large investments and such investments are
often carried out by the government and not by market players. To increase demand elasticity
could mean running industry at night and implementing hourly prices to homeowners. All of
these solutions create a number of additional questions and problems which are not answered
in full today (IEA, 2011).
Spain’s recent changes in its subsidies system also raise doubts of its success. It has led to an
increasing amount of new power but it has at the same time resulted in a large debt. Sweden’s
subsidies system on the other hand has not resulted in the same increase of capacity but has
been financed through a market and has therefore not resulted in an unfinanced and
problematic debt.
Further investigation is necessary and through an investigation of how Spain has managed and
is managing its current situation, important conclusions can be drawn. These conclusions
could aid Sweden in avoiding pitfalls if intermittent electricity production continues to
increase in Sweden.
Spain is considered to have successfully increased its share of renewable energy and it is not
unlikely that ideas and methods derived from a country, perceived to be successful, can be
spread in the European Union and then directly affect Sweden (González, 2008; Dong, 2011).
1.2 Task Vattenfall’s department of external relations and communication has a responsibility to
process and interpret how external changes and legislation, mainly from the EU, can and will
affect Vattenfall. The department gives recommendations and clarifies the standpoints that
Vattenfall should have in different questions and how it should respond and act regarding new
suggestions.
This department has observed the current problems in Spain, primarily the financial deficit
connected to its subsidies of renewable energy. Since Spain is not a market where Vattenfall
is present, there is a lack of knowledge of the current situation. The electricity markets in
Europe can affect each other through the EU and it is in Vattenfall’s interest to keep itself
adjourned with important external events, even in markets where it does not participate, in
order to anticipate changes to its own markets.
It is the task of this master thesis to present the Spanish electricity system, its problems and to
make a comparison with the Swedish electricity system and lastly conclude if Sweden can
suffer from the same problems as Spain and explain why or why not.

13
1.3 Objective This master thesis’s objective is to:
Explain the electricity systems in both Spain and Sweden.
Present the current situation in Spain with its problems.
Make a comparison between the two markets and explain the differences.
Investigate if Sweden has similar problems.
Explain why Sweden in the future should or should not fear similar problems as Spain
has today.
1.4 Delimitations It is a clear focus within the industry of electricity production to produce electricity without
emitting carbon dioxide. To align with the trend in the industry, this report focused only on
electricity from subsidised renewable sources. That means that Sweden’s large share of
unsubsidised hydro power was excluded from this report together with electricity from
sources that are not renewable.
The focus of this report was on renewable electricity production with purpose of selling it in
the market. Thus is electricity production from peat excluded, even though it receives support
in Sweden.
The Swedish subsidy system came into effect in May 2003 while the Spanish system traces
back to 1997. The analysis presented within this report was focused on the time period
between 2004 and 2011 due to the coherence in data from both countries for those years.
1.5 Theses Sweden aims to increase its share of renewable intermittent power production, Spain has
implemented an amount of renewable energy that surpasses Sweden’s political goal.
However, Spain’s implementation of renewable energy is not a pure success. It has increased
its share of renewable energy successfully, but the price has been high. This is the foundation
to this report’s two theses.
1. With a renewable portfolio system instead of a feed-in tariff, more cost-efficient
technologies would have been chosen which would have resulted in a lower deficit.
2. Through studying Spain, important knowledge could be obtained that could benefit
how Sweden should cope with an increased share of volatile renewable power and the
problem of keeping a balance between volatile production and consumption

14
1.6 Report outline The layout of the report is presented to provide the reader with guidance of the structure and
the main content of the report’s following chapters. The chapters are motivated in order to
show the purpose and its importance in relation to the complete report.
Research paradigm, methodology and definitions
The report’s research paradigm is clarified and the chosen methodology is described. These
choices set the foundation of the report and explain some of the decisions made within this
project. The definitions should help explain some terminology for a reader which is
unfamiliar with topic.
The Swedish case
The electricity market design in Sweden is presented and described in order to provide the
reader with an understanding of the current system. This chapter in combination with the one
of the Spanish case are deemed necessary to give a background to the comparison between the
two.
The Spanish case
The Spanish market design is presented and it is described in the same way as the Swedish
market to simplify the comparison. It is constructed in a fashion that will help the reader
compare sections which are not explicitly discussed in the next chapter.
Comparison of the two cases
The Swedish and Spanish markets are compared and the purpose is to visualize the important
differences and pin-point some similarities of interest. The authors have made a selection to
focus the attention to the parts they believe deserve the greatest interest.
Conclusion
The conclusions of the report are presented in a concentrated form with the purpose of giving
the readers an explicit view of the conclusions of this master thesis
Discussion
This chapter enables the authors to contribute with their opinions on the results from the
comparison and give an understanding of the conclusions presented in the previous chapter.
During this project, several interesting ideas arose that did not suit the scope of this report.
They are presented to show areas which the authors found interesting to continue working
with or to provide ideas for other persons in search for a research question.

15
2 Research paradigm and methodology This chapter presents the research theory of this study, which paradigm, methodology and
methods that were used and why.
2.1 Research paradigm A research paradigm governs the philosophical fundamentals of the study such as how reality
is perceived and how knowledge is obtained. The chosen paradigm establishes and limits the
methods that are available for the study (Ritzer, 1975).
The different research paradigms can be visualized as ordered within a range with the
positivistic view on one extreme and the interpretivistic view on the other (Collis & Hussey,
2009).
The positivistic paradigm originates from natural science and was for a relatively long period
of time the only paradigm in practice. It states that the object of study is independent of the
researchers’ actions, that knowledge is gained through observations and measurements and
that reality is objective and the same for everyone. The goal of knowledge is to describe the
phenomena that is observed and to gain knowledge of anything else is according to positivists
impossible (Krauss, 2005).
Interpretivism is the opposite to positivism on the range of paradigms. Reality is subjective
and different for everyone. The researcher influences the object of study. The goal of
knowledge is to express how a phenomenon is perceived by the participants. The natural
settings are important because it is within these that the participants act, field studies are
therefore judged to be a more appropriate method than manipulating variables in a controlled
environment (Johari, 2006.).
The paradigm adopted for this study is none of the extremes described above, but a
combination with aspects from both. Critical realism as a paradigm concerns multiple
perceptions about a single, independent reality. It is the view that there is one reality but it is
perceived differently and cannot be understood or discovered in absolute terms. The research
goal is to identify and verify the underlying mechanism that causes the studied actions and
events. This leads to conclusions that are probable, rather than absolutely true (Krauss, 2005;
Bisman, 2010).
The critical realism paradigm accepts both qualitative and quantitative methodologies,
something that the two extremes do not and naturalistic methods such as case studies and
semi-structured in-depths interviews are appropriate. This means that the most suitable
research approach for the stated topic can be utilized based on what the existing knowledge
permits (Krauss, 2005; Bisman, 2010).
This study follows the critical realism paradigm as:
No absolute truth is sought but the goal was to state plausible explanation to the
objectives.

16
The authors acknowledge that the topic is value-laden and that biases can be present.
The final report was written in formal style where a passive voice with set definitions
and wordings were used.
The research was iterative in nature and categories were continuously identified during
the process.
2.2 Methodology A variety of methodologies fits within the critical realism paradigm (Krauss, 2005; Bisman,
2010). A case study is a methodology that can be used to explore a phenomenon in its natural
environment, using a variety of methods to obtain in-depth information (Collis & Hussey,
2009).
The working pattern of a case study can be divided into five different stages (Collis &
Hussey, 2009):
1. Selecting the case. It is not necessary to find the most representative case possible
because no statistical evaluations are used to generalize from the sample case to a
broader view. It can be valuable to select a critical case in order to capture the essence
of the questions.
2. Preliminary investigations. This stage covers the initial process of information
gathering where the researchers are familiarized with the context of the study. It is at
this stage important to understand what knowledge and prior experiences that the
researchers have, in order to maximize the efficiency as this stage otherwise can be too
time consuming.
3. Data collection. This is where the researchers decide how, where and when to collect
data or other information. The possible methods appropriate for case studies include
primary and secondary sources in addition to observations and questioners. It is
advised to use a combination of different data collective methods.
4. Data analysis. Researchers are here able to choose between within-case analysis or
cross case analysis. Within-case analysis implies more in-depth knowledge of the case
in order to formulate events, opinions and phenomena in such a way that patterns can
be identified. For cross case analysis, the researcher can choose which characteristics
to compare in order to identify patterns. Both within-case and cross case analysis were
performed in this project.
5. Writing the report. It is of importance that the report shows a clear link between the
collected data, the analysis and the conclusions drawn. Quotes from the interviews are
important for justification purposes and it is advised to use diagrams to show patterns
that can be helpful.
Case studies are viewed as both challenging to delimitate and to choose an appropriate scope
of the study. This is because the case in question is a part of a larger context and it is
influenced by other parts of the society. The case has a history and a future where
delimitations in time period can be difficult to make (Collis & Hussey, 2009).

17
2.3 Method The difference between this section and the earlier Methodology section is while the
Methodology is an approach to the process of research, a method is a technique for collecting
and/or analysing data (Collis & Hussey, 2009). The purpose of this chapter is to describe the
methods used during this project and the writing of this paper.
The sources used in this report are both primary and secondary and the definition for primary
and secondary sources is provided by Bell (2005, p 125), who writes:
“Primary sources are those which came into existence in the period of research… Secondary
sources are interpretations of events during that period based on primary sources.“ (Bell,
2005, p.125)
The theoretical framework in this paper has been created by the use of secondary sources
published by the transmission system operators in Spain and Sweden, publications from other
governmental agencies and departments in addition to academic journals and books.
The primary sources were collected through a number of both semi-structured and
unstructured qualitative interviews. Easterby-Smith, Thorpe and Lowe claim that unstructured
interviews are appropriate when the aim is to develop an understanding of the respondents
“world” (Collis & Hussey, 2009). Unstructured interviews were mainly used in the beginning
of the project to ensure the authors gained initial knowledge of the subject and provide
guidelines for a suitable literature study. As the project proceeded the semi-structured
interview became more dominant in order to gain more specific knowledge of certain areas.
However, the interviews did not always result in primary sources, but they did give an
understanding of the subject and the authors were in most cases given presentations or written
articles that could be used as sources in the report.
The analysis was performed as a meta-analysis, meaning that a number of sources were
combined in order to provide sufficient material to draw relevant conclusions from, an
analysis of analyses (Glass, 1976). The sources and material gathered during this project was
deemed sufficient to solve the given problem and provide an answer to the task. It was the
authors’ task to determine which areas were of highest interest to analyse during the initial
literature study. The analysis itself was performed with a closer connection to the
interpretivistic than to the positivistic paradigm, in that the statements were supported and
validated through multiple sources and arguments.
Additionally, the objectives were found to be of such a nature that performing tests of some
sort was not possible in the dimensions of a master thesis since the questions were directly
related to an entire nation’s electricity system.

18
3 Definitions This chapter presents explanations of word or terms that may be more or less known to the
reader. A reader with good knowledge and experience within the area may pass this chapter
without losing a complete view of the report. A reader with somewhat limited experience
regarding the European electricity markets might find this chapter useful as it provides an
initial introduction to some terminology.
3.1 Subsidies In this report, the terms “subsidies” and “subsidy” are widely used. Subsidies is a broader
term than support. Subsidies can be performed in different ways, either by supporting certain
players or by relieving others from “punishments”. One example is that a player that is
subsidised does not have to pay a certain tax that other players do have to pay.
In this report, “subsidies” is often used when the term “support” would have served the same
purpose. The choice to use subsidies derives from a will to use the same terminology as used
in the report’s sources, in order to avoid confusion. However, "support" is a suitable synonym
in a majority of the occasions where the word "subsidy" is used.
3.2 Feed-in tariff A feed-in tariff, often referred to as FIT, is a system where the government offers electricity
producers to sell their electricity at a specific price. This kind of subsidy is widely used for
producers of renewable energy. The producers are guaranteed to sell all their electricity at a
specific price, depending on a number of variables. It may differ depending on location, size
of power plant, type of technology among other. It may also be constructed in a fashion where
the remuneration decreases with time. However, with this system it is possible for a producer
to know the remuneration that the power plant will receive for a long period ahead. The time
span which the feed-in tariff covers may differ but it is often between 10 to 20 years. The
difference between the market energy price and the cost of the feed-in tariff paid to the
producers is often transferred to the consumer and added on their electricity bills through
different methods. There are fixed feed-in tariffs and premium based feed-in tariffs.
3.3 Premium system A subsidy can be paid to producers as a premium on top of the electricity price for
technologies that the government wants to promote. The producers sell their electricity
through the market and then receive a premium from the government where the size of the
premium often differs between separate technologies but may also be differentiated based on
other properties. The premium is less stable than the fixed feed-in tariff. The remuneration
from the government is known but it adds uncertainty since the electricity price fluctuates
over time. This characteristic makes it harder for producers using this system to predict their
earnings but offers at the same time the possibility to increase the earnings when the
electricity price and premium together exceeds the fixed feed-in tariff. This system also
encourages producers to produce more electricity during times with high electricity prices in a

19
way fixed feed-in tariffs do not. However, renewable technologies such as wind and solar
power do not have the technical possibility to adapt their production to times with high
consumption, they always have the interest to produce as much as possible since their fuel
costs are zero. There are however technologies such as biomass and hydro power that can use
this incentive to produce more during peak demand when the electricity price increase.
Another reason to have a premium system instead of a fixed feed-in tariff system is that it
encourages development of technologies that can steer its production to the times when it is
most needed.
3.4 Quota system Where the feed-in tariff and premium system offers different compensation depending on the
technology, the quota system is supposed to be technology neutral. This means that all the
technologies receive the same compensation and the most economic feasible technology
should therefore be chosen. With a remuneration system that is separated between
technologies, the cheapest alternative does not have to be chosen, instead the technology that
generates the largest profits is the most probable choice. To avoid that situation and not spend
an excessive amount of the electricity consumers’ money, the quota system promotes the
cheapest technology. It is often constructed in the way that producers of electricity qualified
for the system, primarily producers of renewable energy, receive certificates which they can
sell. Electricity providers have demands to buy a specific percentile of certificates related to
their trade of electricity and they will suffer from repercussions if the quota is not satisfied
each year. This situation creates a market and if there is a low amount of certificates on the
market, the price will increase. High prices of certificates gives higher incentives for
producers to produce electricity from renewable sources and in this way receive certificates.
The quotas that electricity providers need to purchase may increase over time to reach the
targets of renewable power.
3.5 Third party access tariffs This term is occasionally used when the Spanish electricity system is discussed. The third
party refers to the customers and end users of electricity. It can be a company or an individual.
Spanish electricity bills contain two parts, the customer pays one sum connected to the
amount of electricity used and another sum to cover the costs of the grid and Spain’s
renewable energy subsidies. The latter sum is the one which is referred to as the third party
access tariff or TPA.
3.6 Bilateral contracts Bilateral contracts mean that both the buyer and seller have obligations to another. In an
electricity market, this means that if a seller promises to deliver a specific amount of
electricity, the buyer has an obligation to purchase the same amount.

20
3.7 Combined cycle gas turbine or CCGT The difference between an ordinary gas turbine and a combined cycle gas turbine is that the
combined cycle gas turbine has a steam cycle attached. The steam cycle uses the high
temperature exhaust from the gas turbine to generate electricity which leads to higher overall
efficiency. To add a steam cycle significantly increases the cost of installation. Roughly 2/3 of
the installation cost of a combined cycle gas turbine is connected to the steam cycle and it
accounts for roughly 1/3 of the produced electricity. The steam cycle is not as rapid in
changes as the gas cycle is and if a combined cycle gas turbine is run with variable loads and
numerous starts and stops, the overall efficiency is decreased.
However, an installation of a steam cycle attached to a gas turbine enables better utilisation of
the fuel and thus decreases the emissions of carbon dioxide per unit of electricity and
increases the revenues without increasing the fuel costs.

21
4 The Swedish case In this chapter is the Swedish electricity system described including the country’s natural
conditions, the current electricity mix, a brief historical overview and an in-depth description
of the current Nordic electricity market design. This is presented as a reference to the later
presented Spanish case.
4.1 Natural conditions Mountains inhabit Sweden’s north western border to Norway which together with moist
weather from the Atlantic Ocean produces relatively large amount of yearly precipitation.
This creates rivers, flowing down from the mountain regions in the northwest, into the Baltic
Sea in the east, with a seasonal flow variation primarily due to melting of snow during the
spring season. This has created favourable conditions for hydro power in the northern part of
the country and since the rivers are unfriendly for ships, dams could be built that enables
possibilities to regulate the power of the turbines with relatively small amounts of lost energy
in the form of spilled water (Kungliga Ingenjörsvetenskapsakademien, 2002).
A majority of the Swedish population and therefore also the electricity consumption is located
in the southern parts which has led to a geographical separation of the consumption from the
production in the hydro power plants. Nuclear power plants have been placed in the vicinity
of areas with higher consumption in order to minimise the mismatch between the production
and consumption locations. Sweden is currently separated into four different price areas and
the two most northern areas have a surplus of electricity while the most southern one has a
deficit and has to import from other regions (Nord Pool Spot, 2012a).
Sweden has four distinct seasons with yearly outdoor temperature varying from -40 °C in the
northern parts during wintertime, to 30 °C during summer. The yearly average outdoor
temperature in Stockholm is approximately 6 °C (SMHI, 2006). The cold climate increases
the need of heating and is part of the explanation to an above average usage of electricity
compared to other countries. Another explanation to Sweden’s relatively high electricity
intensity is the good natural conditions for hydro power and (at least earlier) low electricity
prices that attracted some electricity intensive industries.
4.2 The current electricity mix A majority of the Swedish electricity mix is based on nuclear and hydro power which can be
seen in Figure 1. The hydro power plants also serve as the main peak load. 136.7 TWh of
electricity was produced in Sweden in 2009 and the net import was 4.7 TWh (IEA, 2012). The
international balance has varied over the last decade where Sweden some years served as a net
exporter and some years, as 2009, a net importer of electricity (SCB, 2009).

22
Figure 3. The electricity mix in Sweden 2009 by source (IEA, 2012).
Nuclear and hydro power produced 84 % of all electricity consumed in Sweden during 2009
and the renewable sources accounted for 59 % of the domestic electricity production.
4.3 History The electricity mix in Sweden originates from the good natural conditions for large scale
hydro power and the governmental decision to start a Swedish nuclear program. A large part
of Sweden’s hydro power plants were built during the first half of the twentieth century and
have since then played an important role in the Swedish electricity system. When the
possibilities for new hydro power plants decreased, other alternatives had to be considered to
meet the increasing demand of electricity. A decision was made to decrease the heavy
dependency of imported oil to sustain the relatively large electricity demand during the 1950s.
12 commercial nuclear reactors were started during the 1970s and 1980s of which 10 are still
in operation today (Tekniska museet, 2011). In the last decade, wind energy has increased its
production of electricity and is today the energy source with the highest annual growth in
installed capacity (Svensk vindenergi, 2012a).
The Swedish electricity market was deregulated in 1996 and Nord Pool ASA was established
as a shared market place between Norway and Sweden (Nord Pool Spot, 2012b). More
countries and areas have joined Nord Pool since then, today it includes all the areas in
Denmark, Estonia, Finland, Norway, Sweden and some parts of northern Germany. Nord Pool
is owned by the transmission system operators in the Nordic countries where Svenska
Kraftnät (Sweden) and Stattnett (Norway) each own 30 % and Fingrid Oyj (Finland) and
Energinet.dk (Denmark) 20 % each (Bye & Hope, 2005; Nord Pool Spot, 2011a). Sweden
was in the fall of 2011 divided into four different electricity price areas due to transmission
limitations. This means that there today can be 13 different electricity prices in four different
currencies simultaneously on Nord Pool (Nord Pool Spot, 2011b).
4.4 The electricity market It is the transmission system operator, Svenska Kraftnät, which has the responsibility to
secure that the power production and consumption are in balance while the market players

23
have the economic responsibility (Heden & Doorman, 2009). Electricity producers and large
consumers are by law obligated to have a balance responsibility, either by handling it
themselves or by outsourcing the service to another company. There are approximately 30 so
called balance providers with balance responsibility in Sweden today.
There are four different systems that manage the electricity market in Sweden, Elspot (a spot-
or day ahead-market), Elbas (an intraday market), a regulatory market and a balancing
settlement.
Roughly 150 players participate in the spot market on a daily basis but only balance providers
can participate in the trade at Elbas and in the regulatory market and the balance providers are
subject to the balance settlement (Nord Pool Spot, 2011a).
4.4.1 Elspot – the day ahead market
A new trading session opens at midnight every day which covers the electricity that will be
produced in the time period between 24 and 48 hours later. Electricity producers, larger
consumers and trading companies then have 12 hours to deliver their projections and bids for
their electricity production, consumption and prices for every hour of the time period covered
in the trading session. This market closes at 12:00, 12 hours before the first hour of delivery.
The bids are made official approximately one hour later, when Nord Pool has calculated and
set the hourly prices depending on where the demand and supply meets, as shown in Figure 4
(Nord Pool Spot, 2012c).
Figure 4. Schematic of how the electricity price and volume is set based on the bids in a specific electricity
price area, so called marginal pricing.
The method of using marginal prices for an electricity market as shown in Figure 2 provides a
framework similar to an economically efficient market (Nielsen, Sorknæs & Østergaard,
2011). The marginal price works as follows:

24
Players who want to sell and buy electricity have placed bids of volume in MWh of
electricity and price for every hour of the full time period of 24 hours. The spot price
for each hour is then defined as the crossing where supply and demand meets. This
means that producers demanding higher prices than the defined spot price will not be
able to sell their electricity and buyers asking for lower prices than the spot price will
not be able to buy. Simplified, it is the most expensive price bid that was needed to
cover the requested demand that sets the price for everyone.
Two price areas will have different electricity price if the transmission capacity in a section
between those areas is reached. Two different markets will then be created with separate price
crossings between supply and demand.
4.4.2 Elbas – the intraday markets
Elbas is an intraday trading market that opens after Elspot has closed at 12:00 and is open
until 45 min before the corresponding delivery hour commences (Heden & Doorman, 2009).
The purpose of Elbas is to give balance providers an opportunity to trade electricity so that
their commitments from Elspot are covered. Due to the fact that Elspot closes at 12:00, which
is 12 hours before the first and 36 hours before the last delivery hour, events could occur that
alter the possibility to produce or consume the electricity that was first projected and traded.
Elbas is therefore a way of adapting to later projections and alter the obligations accordingly.
4.4.3 The frequency regulation
The frequency in the grid will change if the power supply and demand are not equal, how fast
this change happens depends on the total rotating inertia in generators and motors connected
to the grid. The frequency will increase if the total power production is higher than the total
demand and decrease if the situation is the opposite. It is therefore important to keep the
balance between power production and consumption, or the frequency in the whole grid will
continue to change.
There are two systems in place to keep this balance in the Nordic grid, primary and secondary
regulations, both controlled by the transmission system operators in the different countries,
Svenska Kraftnät in Sweden.
The primary regulation is an automatic system where the participating power plants, mostly
larger hydro power plants, increase or decrease their power output according to the frequency
changes in the electricity grid. Svenska Kraftnät has decided that these power plants should
respond with a power change rate of 6000 MW/Hz and that the primary regulation should
operate between 49.5 and 50.1 Hz. This span is divided into two different segments or
reserves. The ordinary reserve of 1200 MW operates between 49.9 and 50.1 Hz meaning that
these power plants should together be able to increase or decrease the power output with 600
MW from the nominal value at 50.0 Hz as shown in Figure 3.

25
Figure 3. Schematic of the ordinary reserve’s operating interval where the nominal value is marked with a
dotted line.
The second segment of 2400 MW operating between 49.5 and 49.9 Hz is called the
disturbance reserve. The systems for the two segments are almost identical.
The defined power change rate of 6000 MW/Hz is there to ensure that all power plants
participating in the primary regulation work together and are strained equally when the
frequency changes. The primary regulation is there to stop the change in frequency due to
imbalance between power production and consumption, not to restore the frequency to the
nominal value at 50 Hz.
It is the frequency deviation from the nominal value that Svenska Kraftnät uses to judge how
large the imbalance is. This quantity is traded within the secondary regulation market where
Svenska Kraftnät acts as a single buyer and balance providers place bids of quantity in MW
and price in advance. These bids are sorted in accordance to price and quantity and Svenska
Kraftnät activates the bids that are needed to reset the frequency and thus the primary
regulation. If both up and down regulation are needed during the same delivery hour, the
weighted average is used to establish if the hour is classified as an up or down regulation
hour. The price is set to the most expensive up or the cheapest down regulation bid that was
activated to satisfy the balance during that hour. The cheapest down regulation bid is used
because the balance providers repurchase already sold electricity on Elspot that they do not
have to deliver. This means that the balance providers get paid to decrease the electricity
production and if they have the possibility to store the energy in some way, for instance as
water in a reservoir, it can be profitable even at prices close to the Elspot price.
4.4.4 The balance settlement
At 12:15 every day, the Swedish transmission system operator Svenska Kraftnät compiles and
publishes a preliminary balance settlement for the previous day’s trade. This is based on the
trade on Elspot and Elbas in addition to the electricity metering readings gained through grid
companies who supply these on a daily basis to Svenska Kraftnät. The primary and secondary
regulations are also included. The balance settlement bills the balancing providers that have
diverged from their projections and caused imbalances in the system (Heden & Doorman,
2009).

26
4.5 Political ambition The Swedish government has stated the ambition that 63 % of the electricity production in
2020 ought to originate from renewable sources (Regeringskansliet, 2010). This is in
accordance with the EU directive that states that Sweden’s total energy use in form of
electricity, heat and transportation ought to be met by 49 % renewable sources in 2020. In
2009, the Swedish parliament approved a planning framework for wind power to produce 30
TWh of electricity in 2020 of which 10 TWh is to be produced from offshore wind farms
(Swedish Energy Agency, 2010)
4.6 Subsidies The Swedish Government has established a market based subsidy system in the form of trade
with green certificates in order to promote investments and operation of electricity production
from renewable sources and to increase its share in the Swedish electricity mix.
4.6.1 Green certificate – A quota system
The stated goal is to generate a total of 95 TWh of electricity from renewable sources in
Sweden during 2020. That corresponds to 25 TWh more than what was generated from
renewable sources in 2002 (Swedish Energy Agency, 2011b). The trade with green
certificates was geographically enlarged to cover both Norway and Sweden in 2012.
Electricity production eligible for green certificates are utilising (Swedish Energy Agency,
2011b):
Biomass, defined as the biodegradable part of products and waste of biological origin
within agricultural, forestry and fishing industry and the biodegradable part of
industrial and urban waste.
Peat in combined heat and power plants.
Geothermal energy.
Hydro power such as:
o Small scale hydro power that in May 2003 had a maximum rated power of
1.5 MW per unit.
o New hydro power stations.
o Restarted hydro power stations that previously were abandoned.
o Hydropower stations that due to legislation or major renovations no longer are
economically feasible to operate.
Solar power.
Wave power.
Wind power.
Green certificates are distributed per MWh of electricity produced to producers which are
entitled to such by the Swedish Energy Agency. It is the transmission system operator,
Svenska Kraftnät, which distributes the certificates based on measurements from the grid
companies. It is also Svenska Kraftnät that governs the trade of the certificates. A power plant
is eligible to green certificates for 15 years after its operation commences. The power plant is
then judged to be able to cover its own costs without subsidies.

27
The demand for green certificates is created by a requirement on electricity providers to
purchase certificates corresponding to a set proportion of their total electricity that year. If
they fail to meet their obligations, the electricity provider is enforced to buy the missing
certificates to a price 50 % higher than the average price that year (Swedish Energy Agency,
2010).
Electricity intensive companies, defined as those who use more than 190 MWh of electricity
to increase product value during the manufacturing process by one million SEK, can apply to
be exempt from the obligations of purchasing green certificates (Näringsdepartementet,
2011). Electricity intensive companies can only be exempted from the quota obligations for
the electricity used within the manufacturing process. During 2010, 419 Swedish companies
were exempted from the quota obligations and roughly 40 TWh of electricity was purchased
without the quota obligation (Swedish Energy Agency, 2011b).
The price on green certificates is set by market expectations and varies over the year as well
as from one year to another. Companies can save their certificates, both bought and gained
until 2035 when the current system ends (Swedish Energy Agency, 2010). Larger companies
can hold certificates from the market and sell them when they believe to gain more profit,
something smaller companies perhaps cannot as they may need the income to finance their
ongoing business.
It is the end user that pays for the green certificates through their electricity bill. It is
estimated that the average price for the end user was 0.8 euro cent per kWh (0.073 SEK/kWh)
including taxes and administrative costs in 2009 (Swedish Energy Agency, 2011b).

28
5 The Spanish case A description of the Spanish electricity system with the country’s natural conditions, the
current electricity mix, a brief historical overview and an in-depth description of the current
electricity market design is presented in this chapter.
5.1 Natural conditions The Pyrenees, a mountain ridge in the northeast, creates a natural border to France and the
small nation of Andorra. The northern regions experience relatively cool summers, mild
winters and even distributed and abundant rainfall which create large rivers. Spain is the
second most elevated country in Europe with an average altitude of 650 meters and peaks
higher than 3 400 meters. Large parts of the high inland plateau offers dry and hot climate
which creates unfavourable farming possibilities. The south eastern parts of the country
receives approximately one sixth of the precipitation that the northern parts receive which
together with high solar irradiation creates good conditions for solar power (World-
geography, 2010).
Some opportunities for hydro power can be found in Spain, but not to the same extent as in
Sweden. However, the hot and dry climate provides good conditions for solar power.
Additionally, the electricity production and consumption are closely located, and evenly
spread over the country. Spain has no larger oil, gas, coal or hydrologic resources and that has
led to a more diversified electricity mix than Sweden. Spain has an even spread between a
number of different sources and technologies.
Yearly average temperature is approximately 14 °C in Madrid located in the central plateau at
an elevation of 650 meters above sea level. The temperature in this region varies strongly with
season and the average temperature is above 24 °C in July and below 5 °C in January
(Worldclimate, 1988). The Spanish climate decreases the need for heating compared to the
need in Sweden but it results in a requirement of cooling that Sweden does not share to the
same extent.
5.2 The current electricity mix The Spanish electricity market is strongly dominated by a few large players, especially two,
Endesa and Iberdrola. The Spanish electricity mix consists of nuclear, hydro, coal, combined
cycle gas, wind and solar power as shown in Figure 4 where the extra-peninsular regions, the
Balearic and Canary islands, are included.

29
Figure 4. The Spanish electricity production in 2011 divided by source (Red Electrica de Espana, 2012).
The total net electricity production was 280 TWh in 2011, of which approximately 6 TWh
was exported and 3 TWh was used for pumped hydro. The domestic demand was roughly
270 TWh. The electricity production from fuel/gas is exclusively in the extra-peninsular
regions (Red Electrica de Espana, 2012).
The electricity production is relatively decentralized in the sense that all major Spanish
regions have power plants. Madrid and Barcelona are significant consumers without large
local power production which means that large quantities of power are transmitted into these
regions as shown in Figure 5.
Figure 5. Power flow in Spain where power flows from high regions to lower regions (Conejo, 2007).

30
Areas in Figure 5 with relatively even colour and height can be seen as areas with even
distribution of production and consumption and areas with steep inclines represent large
power inflows such as Madrid in the centre of the country and Barcelona in the north east.
The red lines represent large transmission lines.
5.3 History Investments in the Spanish electricity system were dominated by coal power plants during the
1940s when domestic coal was used as fuel. These early coal fired plants were replaced by
large scale hydro plants during the 1950s. After most of the technically feasible locations for
large scale hydro power plants were used, investments in oil fired power plants began to
dominate. Spain commenced a nuclear program parallel to the oil fired plants were being
installed, with small nuclear power plants introduced during the 1960s and larger plants being
finalised during the 1970s and 1980s. The oil crises in 1974 and 1979 led to a strong urge to
reduce the Spanish dependency of imported oil and evolved into an accelerated coal plan
where imported coal was used in this second coal period of Spanish electricity installations.
Investments into combined cycle gas turbine, CCGT, began in the 1990s which is believed to
have a continued large role in the near future (Moreno & Martínez-Val, 2011). Wind power
development began slowly in the 1970s but it was not until 1997 when the Spanish
government introduced subsidies that the capacity started to increase. The goal in 1999 was to
have 9 GW of wind power installed by 2011, a target that was met in 2005 and the
government stated a new target of 20 GW of installed wind power capacity by 2011 which
was met on time as 20.9 GW was connected to the grid at the end of 2011 (Graber, 2006; Red
Electrica de Espana, 2012)
5.4 The electricity market Spain’s electricity market was deregulated in 1998 and integrated with the Portuguese
electricity market in 2007. There is a relatively high degree of concentration and vertical
integration in the Spanish electricity market as a few players have dominant roles. Measures
have been taken to address this in the form of virtual power plants where the two largest
Spanish companies had to sell some of their capacities in quarterly auctions. The last of a total
of seven auctions was held in 2009 and the government decided that the concentration on the
market was diverse enough to end the auctions of virtual power plants (MIBEL, 2009).
5.4.1 Bilateral forward trading
The electricity producers, distributors and customers have the right to engage in bilateral trade
with each other. They have no obligation to state the prices of their trades but they do have to
report their volumes to the system operator. During 2007, 30 % of all the electricity traded in
Spain was sold at the bilateral market (Heden & Doorman, 2009).
5.4.2 The Spanish pool – the day ahead market
Qualified producers and consumers can between midnight and 11:00 place bids for the 24
hours of the following day. A producer can place up to 25 different bids per production unit
and hour within the price range from 0 to 180 €/MWh, a price cap established by the
government. This enables complex offers with conditions taken for minimum revenue and
loading gradients for the unit in question. The buyers can also place up to 25 bids of price and

31
volume creating different blocks for each hour. The pool administrator, OMEL, combines the
production and consumption bids for each hour and finds the marginal price and volume as
explained in the Swedish case in section 4.4.1 Elspot – the day ahead market. After the
marginal price and volume are calculated, the pool administrator sends the plan to the
transmission system operator, Red Eléctrica de España, which checks the technical feasibility
of such a trade in transmission capacities. If some transmission lines are judged to become
overloaded, actions are taken where producers in the relevant area are taken out from the trade
and replaced by others in order to make the trade technically feasible and thus a new marginal
price and volume are calculated (Ciarreta & Espinosa, 2010).
5.4.3 The intraday markets
At 16:00, the day before the first hour of delivery, the first of a total of six different intraday
markets opens. This is after the day ahead market is closed at 11:00 and the spot prices and
volumes are established, made technically feasible by the transmission system operator and
made official by the pool administrator. The first of these intraday trading sessions is open for
3.5 hour and covers the whole 24 hour period of the following day. The other five sessions are
open for 2.5 hour and begins at 21:00 the day before, 01:00, 04:00, 08:00 and 12:00 during
the day of delivery. The intra-day markets exist to allow traders to rely on more precise
predictions and buy or sell electricity accordingly in order to have their production and
consumption covered. The trade on these markets is, just as the day ahead market, checked for
transmission overloads by the transmission system operator, Red Eléctrica de España.
Measures are taken if the trade is believed to cause such overloads. The price influence and
volumes traded on the different intraday markets are substantially lower than the trade on the
day ahead market (Ciarreta & Espinosa, 2010; Heden & Doorman, 2009).
5.4.4 The frequency regulation
The transmission system operator, Red Eléctrica de España, controls three different regulatory
systems: the primary, the secondary and the tertiary regulation, in order to keep the stability in
the system.
The primary frequency control in Spain has the same purpose and is automated similar to the
Swedish system but all the Spanish electricity producers must contribute to the primary
control and if their own units are not suitable for this service, contracts with other players
must be made. The Spanish primary regulation is without reimbursement and it is mandatory
for all producers to contribute with 1.5 % of their rated power to the primary control. The
units that offer primary regulation have to be able to respond fully within 30 seconds for
frequency deviations up to 0.2 Hz (Miguélez, Cortés, Rodríguez & Camino, 2007).
The secondary regulation is handled through daily auction based on Red Eléctrica de España’s
projected need for the coming day that is made public at 14:00. The electricity producers can
place bids of power and price for the different hours until 15:30 when Red Eléctrica de
España examines the bids and at 16:00 publish the bids it believes will be needed in the
secondary regulation for each of the following days 24 hours. The units able to participate in
this auction must be able to respond fully within 15 minutes (Heden & Doorman, 2009). The
secondary regulation is automated and keeps the frequency and thus relieves the primary
regulation which operates during a shorter time span. The price for the power to be available

32
for secondary regulation is set to the marginal price for each hour and the price for electricity
for the secondary regulation is set as the marginal price for the tertiary regulation during the
corresponding hour (Miguélez, Cortés, Rodríguez & Camino, 2007).
The tertiary regulation is a manual system that serves to relieve the secondary regulation. This
is achieved by power production units that are able to respond within 15 minutes and can
continue to produce at the new assigned power output for at least two hours afterward
(Miguélez, Cortés, Rodríguez & Camino, 2007). All production units approved by Red
Eléctrica de España must submit projections of available capacity and price for the tertiary
regulation before 23:00 for all of the hours during the next day. The marginal price for each
hour of needed tertiary regulation is established in the same fashion as for the Swedish
secondary regulation, the most expensive bid of the ones activated (if production needs to be
increased) or the lowest bid of the ones activated (if the production needs to be decreased)
sets the price for that hour of delivery (Heden & Doorman, 2009).
Red Eléctrica de España can commence balancing auctions one hour before each hour of
delivery if they believe that errors in projections would add up to more than 300 MW.
Producers then have 30 minutes to place bids for decreasing or increasing their power output
where an error margin of 10% is accepted. Red Eléctrica de España then uses these bids to
stabilize the system during the delivery hour (Miguélez, Cortés, Rodríguez & Camino, 2007;
Heden & Doorman, 2009).
5.4.5 The balance settlement
The balance settlement in Spain is similar to the Swedish case where producers and
consumers are billed for the unbalances, defined as the difference between the projected and
the real electricity transmitted. Spain has a two price system and it is the transmission system
operator Red Eléctrica de España who administrates the balance settlement. The costs
associated with unbalances are calculated in the same way as for the Swedish case. All
production units with hourly measurements in Spain are held accountable for their unbalances
and are incorporated in the balance settlement, including wind power (Heden & Doorman,
2009).
5.5 Political ambition Spain is a country with a scant presence of energy resources which has led to a high
dependency of imported fossil fuel. The high rate of fossil fuel has also led to considerable
emissions of greenhouse gases. The Spanish electricity policy, giving strong financial
incentives to renewable energy, has led to an impressive increase of renewable electricity
production. This helps Spain not only to lower its emissions of greenhouse gases but also to
decrease its dependency of imported fossil fuels and to stimulate the national industry of
renewable technologies (NREAP, 2010).
The implementation of renewable energy has led to new challenges, mainly how the power is
regulated and how to cope with the variations of production connected to renewable
electricity production. Today, the connection between Spain and France is relatively limited
but there is a stated goal that the connection between the two countries should be able to
transfer 10 % of the total Spanish installed capacity in 2020. That will correspond to a

33
transmission capacity of approximately 10 000 MW, which is a significant increase from the
transmission capacity of 1 400 MW installed today (NREAP, 2010).
Spain’s increase of its renewable energy has made an echo in the rest of the world and Spain
is often mentioned as one of the pioneers in building, constructing and implementing
renewable energy into its electricity system. The Spanish model to promote renewable energy
is, according to the European Commission, a success story (González, 2008; NREAP, 2010).
5.6 Subsidies Spain has two different systems of feed-in tariffs that producers of electricity from renewable
sources can choose between. The producers can either sell their electricity to a fixed price, a
fixed feed-in tariff, or to market price with an additional premium on top. The second system
also includes a premium cap and floor (González, 2008; Couture & Gagnon, 2010;
Schallenberg-Rodriguez & Haas, 2012). The fixed feed-in tariff is a market-independent
system, while the premium is market-dependent (Couture & Gagnon, 2010). Once an investor
has decided between the two feed-in tariffs systems, it has to remain within the chosen system
for at least one year (Schallenberg-Rodriguez & Haas, 2012).
The electricity producers entitled to subsidies in Spain can be categorised as follows:
Wind
o Onshore.
o Offshore.
Solar
o Photovoltaic (PV).
o Concentrated solar power (solar thermal).
Small scale hydro
o Rated power less than 10 MW.
o Rated power greater than 10 MW but less than 50 MW.
Biomass
o Energy crops.
o Agricultural or gardening wastes.
o Forest operation waste.
o Biogas from waste treatment.
o Biogas from anaerobic digestion of manures, agricultural, biodegradable
wastes from industry and black water treatment.
o Black liquors from paper industry.
Combined heat and power
o 95 % natural gas or 65 % natural gas in combination with 35 % biomass and/or
biogas.
o Liquid fuels in the form of diesel, fuel-oil or liquefied petroleum gas.
o 90 % biomass and/or biogas.
o Other fuel such as residual refinery gases, coke, process fuels and coal.
Energy recovery from industries.
Municipal solid waste.

34
In 2009, 96 % of all wind power capacity in Spain used the market-dependent system,
compared to 2.5 % in 2004. The transfer from the market-independent, or fixed feed-in tariff,
to the premium-scheme can mainly be explained by the high energy prices in 2005-2006
which led to high profits for producers using the premium-scheme, which also may explain
the cap established in the premium-scheme in 2007. However, not all of the renewable
electricity producers prefer the premium-scheme. In the electricity production from waste
treatment, all plants are using the fixed feed-in tariff (Schallenberg-Rodriguez & Haas, 2012).
5.6.1 The fixed feed-in tariff system – A market-independent system
The fixed feed-in tariff gives the producer good knowledge about future cash flows. A secure
flow of future payments results in lower interest rates from the financial markets, due to the
security of the investment and the high probability of an exact investment plan. A well
designed fixed feed-in tariff system could also lead to lower cost for the end-consumer than a
market dependent system. However, the fixed feed-in tariff offers no incentive to produce
more electricity during times with high demand, to schedule the maintenance during low
demand hours or in any other way adapt to consumption patterns (Couture & Gagnon, 2010;
Schallenberg-Rodriguez & Haas, 2012).
5.6.2 Premium price system – A market-dependent system
The premium payment on top of the electricity market price-system, the premium price
system, has a more clear connection to the market and its demand than the fixed feed-in
system. The premium price system gives incentives for producers to produce more electricity
at times with high demands since it increases their earnings (Couture & Gagnon, 2010).
However, if the technology cannot utilize this advantage, it could be argued how big of an
advantage it really is. In Spain, the system is not only based on a fixed premium on top of the
electricity price, it also consists of a premium cap and floor as shown in Figure 6.
Figure 6. Schematics of the premium price system visualising the premium cap and floor.
The premium floor dictates the lowest price a producer can receive and the cap decides the
highest electricity price before the premium is withdrawn. The purpose of the premium floor

35
is to guarantee the producers a minimal level of income, lowering the investment risk. The
purpose of the premium cap is to reduce the costs of the subsidies when the market price is
high enough to provide profitability for the producers, decreasing the profits. If the market
price is higher than the premium cap, the producers receives the same price as the market
price. This means that there is no limit of the top price due to this system, the cap only limits
the premium. An advantage with the premium system is that it increases the incentives to
produce more electricity during high demand and high prices, making the system more stable
due to coherence between production and consumption in comparison to the fixed feed-in
tariff system. (Couture & Gagnon, 2010; Schallenberg-Rodriguez & Haas, 2012).
5.6.3 Costs of the two systems
It is considered that the fixed feed-in tariff creates less direct costs for the end-consumer, but
the premium-system provides incentives for a better match of consumption and production
that may be more favourable in a long-term perspective. It may lead to a faster integration of
renewable energy and in the end a more effective energy system (Couture & Gagnon, 2010;
Schallenberg-Rodriguez & Haas, 2012).
5.6.4 Premium system more profitable for producers
In order to minimize the differences between electricity production from renewable and
traditional sources, the Spanish government aimed to make the premium system more
profitable and through economic incentive increase the numbers of producers switching to the
premium-system from the fixed feed-in system (Couture & Gagnon, 2010, Schallenberg-
Rodriguez & Haas, 2012). Ragwitz et al. conclude that the extra cost of a premium-scheme
ranges from one to three Euro cents/kWh in the European countries (Couture & Gagnon,
2010). The slightly higher amount that the premium system provides should compensate the
producers for the extra risk connected to a market-dependent system (González, 2008).
5.7 The Spanish deficit Spain’s generous subsidies to renewable energy has resulted in a governmental deficit of € 24
billion and is at the moment financed through a debt, held by Spain’s five largest energy
companies (Bloomberg, 2012). Spain’s system with subsidies to renewable energy can in
short terms be explained as a system with fixed earnings and variable costs where the variable
costs have been higher than the fixed earnings.
The costs of the implementation of renewable energy were supposed to be covered by the
third party access tariff, paid by the consumers. However, the rapid expansion of renewable
energy increased the costs higher than expected and the third party access tariff paid by the
customers did not cover all the costs. That resulted in a yearly deficit between the earnings
and costs of the system which resulted in an accumulated debt. The third party access tariffs
that the customer pays have been increased but the costs of the subsidies have increased as
well, resulting in a yearly deficit and an increasing accumulated debt. An additional cost that
the third party access tariff has to carry is the deficit from previous years. The deficit in one
year, resulting in a debt, will be paid back in the following 15 years. Meaning that in 2011,
the third party access tariff does not only have to cover the costs of that year’s subsidies, but
also 1/15 of the deficit from 2010, 1/15 of the deficit from 2009 and so forth. The third party
access tariff purpose is not only to cover the subsidies to renewable energy but all regulated

36
costs such as transmission and distribution. However, these costs are fairly stable and the
increasing cost of the subsidies to renewable energy is the reason to the deficit (Bloomberg,
2012).
An underlying reason why the third party access tariff has not followed the costs of the
subsidy system could be of political character. Too high energy costs are not appreciated by
the consumer, who also is a voter, which has resulted in unwillingness from the politicians to
raise the third party access tariffs accordingly.
The deficit has been an issue during the last decade, with the exception of 2003-2004,
reaching its highest value in 2008 with a deficit of € 5 billion. The yearly earnings from the
third party access tariffs are close to € 18 billion, but that should cover all the regulated costs
such as transmission and distribution in addition to the subsidies to renewable energy. The
subsidies to renewable energy were € 7 billion in 2011 (National Energy Commission, 2009).
That means that a yearly deficit of € 5 billion is substantial.
The Spanish government has observed this development, but its ability to act has been
affected by the financial crisis and the implications following this crisis. Not only is the
Spanish government under a financial pressure, but the average citizen has also been affected
by these events. An increase of energy prices is not something that will go by unnoticed. This
is a dilemma for the Spanish government, to not be able to increase the cost to the citizens in
accordance with the cost of the system and thus having to cover the cost through a dept. The
third party access tariff has been increased but not to the degree that the system cost is
covered in full.
In February 2012, the Spanish congress approved the suggestion to freeze subsidies to new
power plants (Bloomberg, 2012). However, this action alone is not sufficient to decrease the
deficit. The costs of already installed power plants are not affected by this action and that
means they will continue to receive subsidies and therefore continue to create a deficit. An
increase of the third party access tariff is needed to avoid that the current deficit continues. A
termination of existing debt or subsidies system could also be an option but that would mean
an illegal expropriation and letting the taxpayers pay these costs is difficult with consideration
to Spain’s current financial situation.

37
6 Comparison of the two cases In this chapter the comparison between the two cases with focus on four separate areas is
presented. Firstly, the electricity productions from primary sources similar for both countries’
subsidy systems are compared. This section opens with a general comparison, description and
motivation of used key values followed by a source by source comparison. Secondly, the
primary energy sources that do not have a counterpart in the other country’s subsidy system
are discussed. Thirdly, a general analysis of the two countries is presented and finally the
differences in frequency regulation are compared.
6.1 Biomass, hydro, wind and solar power There are four different primary sources included in both the Spanish and the Swedish
subsidy system for electricity production. These are biomass, small hydro, wind and solar
power. The definitions of these differ to some degree between the two countries as shown in
Table 1.
Table 2. Definition of biomass, small hydro, wind and solar power entitled to subsidies in Spain and
Sweden (National Energy Regulatory Commission, 2009; Swedish Energy Agency 2011b).
Definition in Spain Definition in Sweden
Biomass Agricultural or gardening wastes.
Biogas from anaerobic digestion of
manures, agricultural, biodegradable
wastes from industry and black water
treatment.
Biogas from waste treatment.
Black liquors from paper industry
Energy crops.
Forest operation waste.
The biodegradable part of products and
waste of biological origin within
agricultural, forestry and fishing industry
and the biodegradable part of industrial
and urban waste.
Small hydro All plants with a rated power less than
50 MW.
Small scale hydro power that in May 2003
had a maximum rated power of 1.5 MW
per unit.
New hydro power stations.
Restarted hydropower stations that
previously were abandoned.
Hydro power stations that due to
legislations or major renovations no
longer are economically feasible to
operate.
Solar Photovoltaic (PV) and concentrated
solar power.
Photovoltaic (PV).
Wind Onshore and offshore. Onshore and offshore.
The table above explains that differences are present between the classifications of each
source between the two countries, but the differences are minor.

38
In order to compare electricity production from these sources, a key value is defined as the
share between electricity production from a specific source and the total national electricity
consumption. There are two reasons for using this key value in the comparison. Firstly, the
countries have different total consumption and production. It is therefore more relevant to
compare this key value instead of a fixed unit of power or energy. Secondly, the electricity
production is used in relation to the countries’ consumption instead of production because a
larger import would otherwise give the impression of a more favourable situation.
The electricity production from the comparable and renewable categories, biomass, small
hydro, solar and wind power have increased in both countries but with a greater increase in
Spain than in Sweden as shown in Figure 7.
Figure 7. Share of biomass, small hydro, solar and wind power in Spain and Sweden during the time
period from 2004 to 2011 (REE, 2009, 2010, 2011, 2012; Swedish Energy Agency, 2011b, 2011c; CNE,
2012).
Spain has increased its share from subsidised electricity within the four directly comparable
categories from 9.6 % in 2004 to 23.3 % in 2011 while Sweden has increased its share from
7.2 % to 13.7 % during the same time period. The total increase has been relatively constant
for both countries with an average annual increase of approximately 1 percentage in Sweden
and 2 percentages in Spain.
Another key value was defined as the subsidy cost per MWh of electricity produced from the
different sources to enable a cost comparison. Since Sweden’s and Spain’s energy
consumptions and their implementation of renewable energy differ, it was deemed most
suitable to use a value which reflects the costs in proportion to a specific amount of energy.
The Swedish numbers have been converted from SEK to EUR using the average exchange
rate for the year 2011 which was 9.03 SEK/EUR (Exchange Rates, 2012). The cost of the
Spanish system varies with the inverse of the electricity price as the government has
guaranteed a price level to the electricity producers entitled to subsidies and the governmental
cost of the system is the difference between the market price and the guaranteed price. The

39
annual average Spanish electricity prices from the daily and intra-day markets are presented in
Figure 8.
Figure 8. Annual Spanish electricity price between 2004 and 2010 (REE, 2009, 2011).
The electricity price has fluctuated over recent years. The average price for the time period
between 2004 and 2010 is approximately 46 €/MWh. Increases in subsidy system costs in
2009 and 2010 in comparison to 2008 can partly be explained by decreased electricity prices.
The annual average cost per MWh of electricity produced within the subsidy system was
compared in order to evaluate how successful the two systems have been. The average
subsidy cost per MWh of electricity to biomass, small hydro, wind and solar power have
increased in Spain since 2004 as visualized in Figure 9.
Figure 9. Average subsidy cost per MWh to biomass, small hydro, wind and solar power in Sweden and
Spain (REE, 2009, 2010, 2011, 2012; Swedish Energy Agency, 2011b, 2011c; CNE, 2012).

40
The average cost per MWh has increased in Spain from 2004 to 2009 with a slight decrease in
2010 and 2011. The average cost was more than three times as high per MWh produced in
Spain than in Sweden during 2011. This, in addition to that Spain has had a larger increase in
electricity production from these primary sources, has led to dramatically increased total costs
of the system which is further analysed in section 6.6 Within-case analysis. The increase in
cost per MWh may stem from the fact that more capacity, generating more electricity, has
been installed in technologies that receive high subsidies, which increases the average costs of
Spain’s subsidy system.
The electricity sources are presented separately in further sections in order to clearly visualise
the difference between the two countries. It may then be clear why the costs of the subsidy
system have increased significantly from the level in 2007.
6.2 Biomass Both Sweden and Spain have good potential for electricity production from biomass, both in
the form of forest operation and agricultural waste (Hagström, 2006; Invest in Spain, 2011;
Energia Sierra Segura, 2012). Sweden has a significantly larger share of biomass in its system
and it has steadily increased during the last years. Spain has a small share of biomass, but it
has almost doubled its share of the total consumption in seven years, which can be seen in
Figure 10.
Figure 10. Share of electricity produced from biomass (REE, 2009, 2010, 2011, 2012; Swedish Energy
Agency, 2011b, 2011c; CNE, 2012).
Spain’s share of biomass has increased from 0.8 % in 2004, to 1.4 % in 2011. This
corresponds to 1.8 TWh in 2004 and 3.7 TWh in 2011. Sweden’s share has increased from
5.2 % in 2004, to 7.4 % in 2011 which corresponds to 7.7 TWh in 2004 and 10.3 TWh in
2011.
Spain’s subsidies to one MWh of electricity produced from biomass are higher than
Sweden’s, visualized in Figure 11. It may be one of the explanations to the relatively high
development pace of biomass in Spain.

41
Figure 11. Cost of subsidies per MWh of electricity produced from biomass (REE, 2009, 2010, 2011, 2012;
Swedish Energy Agency, 2011b, 2011c; CNE, 2012).
One possible reason for the increased remuneration in Spain to one MWh of electricity
produced from biomass between 2008 and 2009 may be the decrease in electricity prices
between 2008 and 2009. If the electricity price decreases while the producers sell their
electricity to a fixed feed-in tariff, the cost of the subsidies increases.
The Swedish biomass produced approximately 10.3 TWh of electricity while Spain’s biomass
produced 3.7 TWh in 2011. However, Spain’s costs for its biomass subsidies were higher,
€ 271 million compared to € 236 million in Sweden. Spain’s total costs are higher, but their
production from biomass is at the same time lower. However, electricity from biomass has a
faster development in Spain and it is possible that Spain focuses more on development than
on keeping costs down.
The costs of the subsidies connected to biomass have increased significantly over the last
couple of years. However, the increase in Spain’s total costs connected to its subsidy system
cannot be explained in full by the progress in the biomass sector since the increase in annual
electricity production has not seen similar development and the share is still relatively small.
6.3 Small scale hydro power The definition of small hydro plants subject to subsidies differs between the two countries. All
hydro power plants with a rated power less than 50 MW receives subsidies in Spain, but there
are two different price levels with a threshold at 10 MW. The definition in Sweden is not as
clear. All new and restarted plants along with all plants with a rated power less than 1.5 MW
as of May 2003 are entitled to subsidies in Sweden. No large scale hydro power plants have
been built during the time the subsidy system has been in operation.
Electricity production from small scale hydro power accounts for a small share of the total
electricity mix in both countries. The production varies with hydrologic properties of each
year but a slight increase in both countries can be seen as illustrated in Figure 12.

42
Figure 12. Share of electricity production from small hydro power (REE, 2009, 2010, 2011, 2012; Swedish
Energy Agency, 2011b, 2011c; CNE, 2012).
The share of small scale hydro power receiving subsidies has fluctuated to some extent in
both countries during the analysed time period. The share in both countries has generally been
between 1.5 and 2 % with slightly higher shares in Spain than in Sweden. The theoretical
potential of hydro power is in general lower than the theoretical potential of solar or wind.
This is due to the fact that hydro power needs rivers or other forms of flowing water due to
differences in height which is a more limited resource compared to sunshine or wind. Most of
the economically feasible rivers in Sweden are already occupied with large hydro power
plants, and the remaining four great rivers are subject to legal restrictions. The electricity
production from all hydro power plants is dependent on the precipitation which varies from
year to year. The electricity production will therefore also vary from year to year and this
could explain the fluctuating shares in the figure above as the installed capacity has increased
throughout the time period for both countries.
The costs of the subsidies to small hydro power have generally been higher in Spain than in
Sweden with one exception in 2008. The cost of the subsidies to small hydro power is
presented in Figure 13 for the years 2004 to 2011.
Figure 13. Subsidy cost per MWh of electricity produced from small scale hydro power (REE, 2009, 2010,
2011, 2012; Swedish Energy Agency, 2011b, 2011c; CNE, 2012).
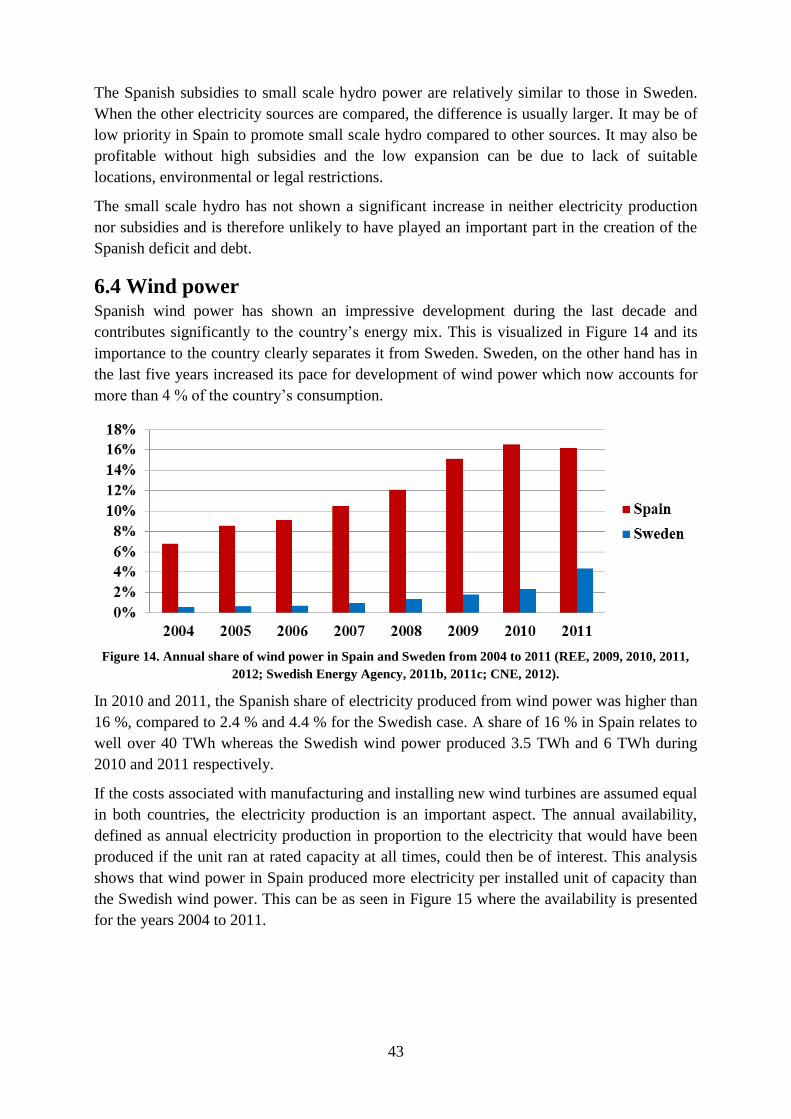
43
The Spanish subsidies to small scale hydro power are relatively similar to those in Sweden.
When the other electricity sources are compared, the difference is usually larger. It may be of
low priority in Spain to promote small scale hydro compared to other sources. It may also be
profitable without high subsidies and the low expansion can be due to lack of suitable
locations, environmental or legal restrictions.
The small scale hydro has not shown a significant increase in neither electricity production
nor subsidies and is therefore unlikely to have played an important part in the creation of the
Spanish deficit and debt.
6.4 Wind power Spanish wind power has shown an impressive development during the last decade and
contributes significantly to the country’s energy mix. This is visualized in Figure 14 and its
importance to the country clearly separates it from Sweden. Sweden, on the other hand has in
the last five years increased its pace for development of wind power which now accounts for
more than 4 % of the country’s consumption.
Figure 14. Annual share of wind power in Spain and Sweden from 2004 to 2011 (REE, 2009, 2010, 2011,
2012; Swedish Energy Agency, 2011b, 2011c; CNE, 2012).
In 2010 and 2011, the Spanish share of electricity produced from wind power was higher than
16 %, compared to 2.4 % and 4.4 % for the Swedish case. A share of 16 % in Spain relates to
well over 40 TWh whereas the Swedish wind power produced 3.5 TWh and 6 TWh during
2010 and 2011 respectively.
If the costs associated with manufacturing and installing new wind turbines are assumed equal
in both countries, the electricity production is an important aspect. The annual availability,
defined as annual electricity production in proportion to the electricity that would have been
produced if the unit ran at rated capacity at all times, could then be of interest. This analysis
shows that wind power in Spain produced more electricity per installed unit of capacity than
the Swedish wind power. This can be as seen in Figure 15 where the availability is presented
for the years 2004 to 2011.

44
Figure 15. Availability of wind power in Spain and Sweden from 2004 to 2011
(Swedish Energy Agency, 2011b; CNE, 2012; Svensk Vindenergi, 2012b).
The annual availability is almost consistently lower in Sweden than in Spain with the
exception of 2011, which could mean that the natural conditions for wind power are better in
Spain than in Sweden. This could further mean that investments in Swedish wind power will
not yield the same amount of electricity production as if they were made in Spain. Spain’s
goal to become a pioneer in renewable energy in combination with its better natural
conditions are part of the explanation to the greater increase of wind power in Spain than
Sweden.
The Spanish average annual increase was 3.6 TWh or 1.7 GW per year whereas it in Sweden
has increased with 0.75 TWh or 0.35 GW on average per year during the time period from
2004 to 2011.
If the annual increase in electricity production from wind power is related to the yearly
consumption the average annual increase was 1.34 percentages in Spain and 0.54 percentages
in Sweden.
A share of 16 % of annual consumption in Sweden is equal to approximately 22 TWh. There
is an ongoing debate as to how much wind power that can be implemented into the Swedish
system without causing problems to the system. 22 TWh of wind power in Sweden is seen as
a very high level and believed to be as much as the system could handle within reasonable
economic limits. This is interesting as some literature suggest that Sweden has a more
favourable electricity mix with significantly larger share of large scale hydro power, which is
better suited to regulate its power output than Spain’s electricity sources (Söder, 2011;
Kungliga vetenskapsakademin, 2012).
Wind power producers in Spain have had the possibility to change from a fixed price feed-in
tariff to a premium price system. In 2004, 2.5 % of the Spanish wind power producers
received the premium prices whereas this percentage had changed to 96 % in 2006. The
reason for this major change is due to the relatively high electricity prices in 2005 and 2006
(Schallenberg-Rodriguez & Hass, 2012).
The subsidies for wind power in Spain are generally higher than the Swedish ones, presented
in Figure 16, and the Swedish subsidies are more fluctuating. This gives two advantages in

45
favour of Spain through an investor’s point of view, since investors tend to prefer higher and
more stable remuneration.
Figure 16. Subsidy cost per MWh of electricity produced from wind power in Spain and Sweden (REE,
2009, 2010, 2011, 2012; Swedish Energy Agency, 2011b, 2011c; CNE, 2012).
An explanation for the increasing cost of subsidies to wind power between 2008 and 2010 in
Spain may be due to a decrease in electricity price. A clear majority of the wind power is
connected to the price premium system, which guarantees a price floor. A lower electricity
price in 2009 than 2008 means that the distance between the electricity price and the premium
floor is increased leading to a higher cost per MWh.
Wind power in Spain has had an impressive development and is now responsible for a large
share of the Spanish electricity mix. It has led to higher total cost for Spain than Sweden’s
cost for its wind power. However, the differences in costs are not extraordinary, considering
that Spain subsidises all its power more generously than Sweden. Wind power is on the lower
scale of subsidies in Spain but its great development means that it has rendered costs for the
country and is a part of the deficit. What separates wind power from other electricity sources
is that it also has created a lot of renewable electricity and has rendered a proportional amount
of costs compared to its electricity production. It is therefore not the single explanation to the
deficit and debt since it has not created an unreasonable amount of costs compared to its
production.
When the Spanish system is praised as a success, it is likely it refers to the development of
wind power which has grown faster than its goal. Another source that has grown rapidly is the
Spanish solar power which will be analysed further in the following section.
6.5 Solar power Sweden has poor natural conditions for solar power in comparison with Spain. The yearly
average irradiance in Sweden is between 800 and 1000 kWh/m2
while these numbers are
twice as high in Spain (Peña, 2007; SMHI, 2009). The better natural conditions for solar
power in Spain can also be seen in the higher level of availability which on average was
11.5 % in Spain and 6 % in Sweden for the years 2004 to 2010. Installed capacity for 2011

46
was not available at the time of this analysis and thus could no availability be calculated for
the Swedish case for that year.
Electricity production from photovoltaic (PV) and from steam cycles using concentrated solar
power is included in this comparison. Concentrated solar power is not found in Sweden but
contributed to approximately 10 % of all electricity from solar in Spain during 2010 and
approximately 19 % in 2011. The availability of concentrated solar power plants is higher
than for PV which increases the overall availability of solar power in the Spanish case. This
increase is neglected in the above comparison of availability because the average availability
over multiple years were used and concentrated solar power only affected the availability of
2010.
Solar power in Sweden is neglected as it contributed to less than 0.0004 % of the total
consumption in Sweden in 2011.That corresponds to 556 MWh and can be compared to a
single standard wind turbine of 1.5 MW, which alone produces five times more electricity
during a normal year.
However, solar power in Spain can and shall not be neglected. It has increased its share
rapidly during the last decade and now contributes to a noticeable share of the Spanish
production, as shown in Figure 17.
Figure 17. Share of solar power in Spain from 2004 to 2011 (REE, 2009, 2010, 2011, 2012; CNE, 2012).
The increase in solar power is remarkable as it has increased from being able to cover 0.2 %
of the Spanish electricity consumption in 2007 to 3.6 % in 2011. This corresponds to almost
5 GW of installed capacity which in 2011 produced a total of over 9 TWh of electricity. If it is
compared to the 0.5 TWh electricity produced from 0.7 GW of installed capacity in 2007, it is
clear that the Spanish solar power has had an impressing development during the last couple
of years.
Solar power subsidies differ widely between the two compared countries, both in total
remuneration and when the total remuneration is divided by produced electricity. Spain’s
installed capacity is roughly 5 GW while Sweden has an installed capacity of around 0.5 MW,
which means that Spain has approximately 10 000 more installed capacity and since its
remuneration to solar power is roughly 10 times higher, presented in Figure 18, it is clear that
this is an aspect which separates the countries from each other.

47
Figure 18. Subsidy cost per MWh of electricity produced from solar power in Spain and Sweden (REE,
2009, 2010, 2011, 2012; Swedish Energy Agency, 2011b, 2011c; CNE, 2012).
Spain’s high subsidies to solar power may stem from an ambition to become a market leader
in renewable technologies and create green jobs. Sweden uses a certificate system and
subsidises solar power with the same amount as its wind power, which is a too low amount in
order to make solar power economically feasible. This, in combination with Sweden’s less
favourable conditions, is the explanation for Sweden’s low installed capacity of only 0.5 MW
compared to Spain’s 5 GW.
The high remuneration to solar power in Spain has been questioned during the last couple of
years and was changed, when the costs increased rapidly, see Figure 19 below. However, the
subsidies to solar power that already have been installed are not changing. That means
changes in the subsidy system will only affect future installations.
Figure 19. Annual cost of subsidies to solar power in Spain from 2004 to 2011 (REE, 2009, 2010, 2011,
2012; CNE, 2012).
Figure 19 illustrates that the total cost of the subsidies to solar power significantly increased
from year 2007 to 2008 and from 2008 to 2009. The government met this problem by
decreasing the subsidies for new power plants in 2010 (Bloomberg, 2010) but as previously
mentioned, the already installed power plants are not affected by this change. The

48
development of solar power between 2006 and 2009 has increased Spain’s subsidies cost, but
the electricity production has not increased proportionally.
It is safe to say that the development of Spanish solar power is and has been expensive, which
also is confirmed by the decreases in the remuneration system (Bloomberg, 2010, 2012). In
order to avoid transferring all these costs directly to the customers, the third party access
tariffs have not been increased accordingly. The deficit which occurs between the systems
incomes and costs has resulted in a debt for the government to Spain’s five largest energy
companies. Solar power contributes with little electricity in proportion to its costs, meaning
that the Spanish solar power is a part of the explanation to the large deficit in its subsidy
system.
6.6 Within-case analysis This section focuses on the cases separately in order to facilitate a comparison of how the
different technologies and the associated subsidy cost have developed within the two
countries.
Wind power in Spain contributes to a majority of the electricity production of these primary
sources. Wind and solar power have had the largest increase during the time frame of this
analysis, biomass has increased slightly whereas small hydro has been relatively stable. The
development can be seen when studying the annual Spanish electricity production from
biomass, small hydro, wind and solar power, presented in Figure 20.
Figure 20. Annual electricity production in Spain from biomass, small hydro, wind and solar power from
2004 to 2011 (REE, 2009, 2010, 2011, 2012; CNE, 2012).
Wind, solar and small hydro power are dependent on the weather, where different conditions
favour different electricity production. Biomass on the other hand is not directly dependent on
the weather, at least not on a year to year basis.
These technologies receive subsidies and an increase in subsidised electricity leads to an
increase of the costs. The total cost of subsidies to biomass, small hydro wind and solar
power are presented in Figure 21 where it is clear that the total costs have significantly
increased in Spain.

49
Figure 21. Annual cost of subsidies to biomass, small hydro, wind and solar power in Spain between the
years 2004 to 2011 (CNE, 2012).
Figure 21 clearly indicates that it is the cost of the subsidies to solar power that have increased
the most, from very low levels in 2006 to surpassing the costs to wind power within three
years. In 2011, the total cost of solar power subsidies accounted for almost 40 % of the cost of
the whole subsidy system whereas solar power produced less than 10 % of all subsidised
electricity in Spain. For the renewable sources, the cost of the solar power subsidies
accounted for over 50 % of the total cost and contributed to only 15 % of the renewable
electricity production within the subsidy system in 2011. The Spanish government tried to
meet these soaring costs by decreasing the subsidies for new power plants in 2010 but as
previously mentioned, already installed power plants are not affected by such changes
(Bloomberg, 2010).
The development is clearly unsound and it can be compared to Sweden’s development which
has a more even distribution of costs compared to amount of produced electricity. For the
Swedish case, the breakdown between the biomass, small hydro and wind power can be seen
in Figure 22.

50
Figure 22. Annual electricity production in Sweden from biomass, small hydro and wind power between
the years 2004 to 2011 (Swedish Energy Agency, 2011b, 2011c).
In Sweden, electricity produced from biomass contributes to a major part of the renewable
electricity production within the subsidy system, but it does not have the most rapid
development. Wind power has shown a greater increase during the studied time period and is
increasing faster than biomass. The Swedish solar power is negligible in comparison to the
other sources. The small scale hydro power plants have produced a relatively stable amount of
annual electricity with a slight general increase.
In Spain, the costs were unevenly distributed compared to the different technologies’
production which separates it from Sweden. Sweden, which uses a quota system, subsidises
all sources with the same amount which makes the costs proportional to the electricity
production. The costs can be differentiated by primary source and is presented in Figure 23.
Figure 23. Annual cost of subsidies to biomass, small hydro and wind power in Sweden for the years 2004
to 2011 (Swedish Energy Agency, 2011b, 2011c).
The total cost of the subsidy system per definition has the same distribution as the production,
but the trends are different due to changes in cost per unit of electricity.

51
6.7 Other subsidised electricity sources When comparing the two countries and the different electricity sources they subsidise, a
number of technologies appear that do not have a direct counterpart in the other country’s
system. These categories are electricity production from:
Combined heat and power plants in Spain.
Waste incineration in Spain.
Energy recovery in industries in Spain.
Peat fired combined heat and power plants in Sweden.
Combined heat and power generates a non negligible share of the Spanish electricity
production, covering between 7 to 10 % of total consumption. However, these plants are fossil
fuelled as visualized in Figure 24 and therefore not analysed in detail due to the delimitations
of this report.
Figure 24. Fuel mix in Spanish combined heat and power plants (CNE, 2012).
The Swedish electricity generation from peat is also excluded from further analysis due to the
report’s delimitations to analyze renewable primary sources. Peat is not classified as a
renewable source in this report as it needs thousands of years to evolve.
Urban waste in Spain does not meet the definition of renewable and is therefore also excluded
from a more in depth analysis.
The electricity production from energy recovery facilities is excluded as it can not be
classified as completely renewable. It is however a way to increase energy efficiency in the
system.

52
6.8 Uncertainty comparison between feed-in tariff & quota system When comparing a feed-in tariff with a green certificate, or quota system, it could be of
interest to point out which of the two systems offers the most stability and security. One of the
most important advantages with a fixed feed-in tariff system for the producers is that the
system pays a fixed price for the electricity produced. That provides the electricity producers
with fixed revenue and as long as their costs are known, the profit is easily predicted. The
price is not fixed with a quota-system as both the electricity price and the price of the
certificates fluctuate over time. A premium system is somewhere in between a quota and fixed
price system as the price will fluctuate in accordance with the electricity price but the
minimum earnings are guaranteed through the premium floor.
One aspect of a feed-in tariff system with a fixed remuneration is that the price is either set
too low or too high. When it is too low, the interest will be low, resulting in a low or no
capacity increase and the system is unsuccessful. When the price is set too high, it will result
in a high capacity increase and the system can be viewed as a success. If the producers find
the remuneration sufficient to make their investments profitable it might be recommended that
they take into consideration the risk of changes to the system. This means that a system
considered as a low risk system with fixed earnings may as well be changed due to too
generous remuneration. It can also be changed because of too low remuneration, but in that
case producers would probably not have invested due to the too low earnings and they will
then not be affected. It is unlikely that the feed-in tariff remuneration changes for power
plants that already have entered the scheme, but the feed-in tariff system for new and not yet
introduced power plants is not unlikely to change. If the costs of a certain technique are
lowered, it is likely the subsidies are lowered as well to decrease excessive profits.
A quota system can be changed by changing the obligated quotas. In Sweden, this happened
in 2010 when the Swedish government increased the quotas for the years 2013-2035. This
was caused by underestimates in electricity production from certified producers resulting in a
larger than expected surplus of certificates on the market and to ensure that Sweden reaches
the goal of 25 TWh more electricity produced from renewable sources in 2020 than in 2002.
Another change to the system is that Norway is included in the trade of green certificates from
2012 which is believed to initially increase the demand for certificates. It should be noted that
these changes benefit the supported electricity producers and increases the price of certificates
but it is an uncertainty whether the system is changed in the future. An anticipated change to
the system could affect the price and thus the income of the electricity producers especially
when considering the price of certificates partly is based on future price projections.
Uncertainty for the policy makers is different from the uncertainty for the electricity
producers. The policy makers for a feed-in tariff system do not know the total cost of the
system as the total amount of electricity production is unknown. This uncertainty can be
transferred to the customers directly. This design is not in practice in Spain today, instead the
Spanish government absorbs the risk of soaring costs as the third party tariff is fixed on a
yearly basis. It has not been increased sufficiently to cover the increasing total costs, probably
for political reasons.

53
6.9 Comparison of frequency regulation systems The regulation system in each country has significant similarities in a number of ways. One
difference is the mandatory and non-remunerated participation in the Spanish primary
frequency regulation system, while Sweden has a voluntary system with remuneration.
The similarities of how the systems are created decrease the interest of investigating them in
detail. The opinion of this report is that Sweden’s system is an advanced and well functioning
system which cannot benefit significantly through using methods or framework from Spain’s
system. Both countries have an electricity mix consisting of some slow regulated power,
nuclear power in Sweden and both coal and nuclear power in Spain, in addition to volatile
power in the form of wind and for the Spanish case also solar power.
Sweden has a large share of adjustable hydro power which gives good possibility to handle
the unbalances in production and consumption. Spain does not have as much hydro power to
handle all of its unbalances which has led to the use of combined cycle gas turbine power
plants to adjust its production in order to keep the balance. This results in lower efficiency in
these power plants, but it still is the most used option since it is the cheapest one and the gas
producers receive remuneration from other producers to compensate for their unbalances.
Sweden’s good natural conditions for hydro power are the foundation of Sweden’s regulatory
system and use of gas turbines as in Spain would not improve the situation.
Hydro power’s advantage over combined cycle gas turbines is that a hydro power plant is not
operated at rated power at all times, meaning that capacity is often available. If the hydro
power plants have to lower or increase their production, it does not create a direct problem
since they can use the saved water later, and over a longer period their total production will
not have changed. A gas turbine on the other hand is built to produce at its maximum all the
time, since the installation should be depreciated. Every time it does not produce at its
maximum, it saves some fuel, but it produces less electricity that has to bear the same cost of
deprecation.
Frequency regulation is an important characteristic for an electricity system with increasing
amounts of volatile power. Sufficient controllable power must be available to handle the
errors in prognoses which are higher for wind and solar power than for more conventional
power production units. This is because small changes in wind speed or cloudiness can greatly
influence the power output. The systems in each country are similar to each other, even
though they may use different names for parts of their system. Both are based on an
automatic, fast responding system and a slower manual system. The similarities of the
regulations systems, except from how they are remunerated, make it less interesting when
comparing the two with the purpose of gaining knowledge that could be brought to the
Swedish system.
In this area, there was not much knowledge that could be obtained from the Spanish case that
could benefit Sweden’s system. The differences in how to cope with the regulation problem
are related to the differences in natural conditions and the installed capacity available. This
area was therefore not examined further, it was considered preferable to prioritize the
attention where it was believed possible to draw clearer conclusions that could benefit
Sweden through studying Spain.

54
7 Conclusion This section presents the report’s conclusions. They are structured in connection to the two
initial theses presented in the introduction with the purpose of giving the reader an explicit
presentation of the report’s outcome.
With a renewable portfolio system instead of a feed-in tariff, more cost-efficient
technologies would have been chosen which would have resulted in a lower deficit.
The Spanish subsidy system has proven to be too generous, and without transferring the costs
to the customers this has led to a governmental debt. The debt was created due to the
governmental unwillingness to transfer the actual cost of the system to the customers. One
reason for this unwillingness could be the soaring total cost of the system which could have
come as a shock for the customers. It is primarily the subsidies to solar power which have
caused the soaring costs and forced the government to close down the system to all new
investors. The resulting debt would not have been created with a renewable portfolio system
such as the Swedish quota system. This is because the costs are transferred to the customers
and the policy makers have a more certain prediction of the pace of implementations than
with a feed-in tariff system. A renewable portfolio system would further have promoted the
most cost effective alternative and solar power would not have been at today’s level of
electricity production.
The implementation of new renewable electricity production has been significantly faster in
Spain than in Sweden. It cannot be advised that Sweden would have been better off with a
feed-in tariff system with similar design as the Spanish. The costs associated with such a
system are deemed too high even though the deployment of new renewable electricity
production could have been faster than today.
Through studying Spain, important knowledge could be obtained that could benefit how
Sweden should cope with an increased share of volatile renewable power and the problem
of keeping a balance between volatile production and consumption.
Spain uses gas turbines to balance the electricity system whereas Sweden uses hydro power
and this difference is the main reason behind the differences in market design of the two
countries. These differences in market design are judged to be small and did not seem
significant enough to motivate further analysis. During the work process, the possibility to
draw conclusions that would benefit Sweden in this question was deemed low. The authors
suspect that the thesis is false, but have not proven it due to limited time and resources.

55
8 Discussion The discussion is separated into five parts. The first two parts discuss the reports two theses,
the third and fourth section is a more general discussion of the complete paper including
source criticism and finally is suggestions for future research presented.
8.1 Spanish subsidies With consideration to the question of subsidies system, two topics are suitable to discuss.
It is mentioned in this report that the Spanish subsidies system has been expensive and too
generous. That is the authors’ opinion which they have concluded through this report, but it
should be noted that an understanding exists that the Spanish system, most likely, was
constructed to be generous to stimulate a rapid increase of its renewable electricity. However,
there is a difference between generous and too generous. That difference has led to
mismatches in implementation, where the solar power produces a small share of the electricity
but receives a great share of the subsidies. It is unlikely that the average Spaniard favours
solar power to the extent that he or she wants to pay ten times more for electricity produced
from solar power compared to wind power. When the authors used the term “too generous”, it
refers to that Spain probably would have been able to get roughly the same electricity from
renewable sources with lower costs. It would just have to steer the development, using its
remuneration, towards technologies which are cheaper. With the current system, solar power
may not have been the best choice from the nation’s point of view, but the producers have
nonetheless chosen to invest in solar power since it gave them the largest profits.
In Spain’s case, there has been a mismatch between the costs of subsidies system and the
earnings from the customers through the third party access tariffs. That is not a principle of a
general feed-in tariff system. It is therefore not the feed-in tariff system itself that has created
the Spanish deficit and debt. It is however the Spanish feed-in tariff, which was poorly
constructed for this large increase and participation in the system that did not raise the
earnings accordingly with the increase of its costs. Hence, a well constructed feed-in tariff
system would not have created a deficit and the conclusion is not that all feed-in tariff
systems, by definition, create deficit.
It is possible that the financial crises played a part in the unwillingness from politicians to
increase the costs for customer, which would have supported the implementation of renewable
electricity without creating a debt. It is not an easy question to investigate and does not align
with this report’s purpose and that is the reason why this report did not search after a direct
answer as to why this situation occurred.

56
8.2 The regulation question One of this report’s two theses was that Sweden, with an increasing amount of volatile
renewable power, would be able to gain knowledge from Spain, which already has a large
amount of volatile renewable power installed. The thesis was formulated as follows:
Through studying Spain, important knowledge could be obtained that could benefit how
Sweden should cope with an increased share of volatile renewable power and the problem
of keeping a balance between volatile production and consumption.
In this report, this thesis was not confirmed. However, a part of this paper was to explain why
or why not conclusions from the Spanish case was interesting to the Swedish case and it is the
authors’ opinion that the information regarding the regulation question still should be
included in this report. This information also serves the objective of explaining the Spanish
electricity system. The conclusions that were made in this area were not expected in the
beginning of this project, but the explanation that the natural conditions have formed the
systems in the two countries is a conclusion in itself. The thesis were not proven to be correct,
but neither to be false.
It is the authors’ opinion that the thesis is more or less false, but this project has not gathered
enough information to give a final answer. The authors have had a discussion regarding this
situation, that this topic was not finally settled. The opinion was that the purpose of the report
was to present the Spanish case and compare it to Sweden, present why or why not similar
situations could appear or if knowledge could be obtained that would benefit Sweden. This
purpose have been met, the task of proving if the initial thesis was correct or not was therefore
not of highest priority. It would of course be preferable if that could have been succeeded as
well, but the time was the limiting reason why it was not performed.
8.3 General discussion It is the authors’ opinion that the overall targets of this master thesis have been met when the
task and objectives are taken into consideration.
The three first objectives and the sub questions connected to those, regarding the design of the
Swedish and Spanish electricity markets and the differences between the two, all have
sections or chapter which makes it rather easy to find this report’s answer to each question.
The last question, if Sweden could face the same problems as the Spanish one is not as
explicitly answered in a specific section but it is the authors’ opinion that it has been
answered within this report.
8.4 Source criticism The information used in this report was gathered from academic journals, companies,
agencies or official statistic and it serves as a foundation to the report that the information
presented is valid. Official statistics can include errors which would lead to errors in this
report. One way to reduce the uncertainty of such errors could have been to use statistics from
multiple sources such as professional bodies for the different primary energy sources. The
authors believe that the errors in the official statistics are insignificant enough that the
conclusions in this report still are valid. When interviews were conducted, the interviewed

57
persons were asked to state their sources in order to validate the information. This was
important to minimise bias in the report and in particular regarding the Spanish section. One
single person was very helpful and provided a lot of information regarding Spain and if the
report only would have referred to him, without examining his sources, bias would have been
present.
8.5 Future research This section presents areas that came to the authors’ attention during the time this master
thesis was conducted but was less suitable to investigate in the regime of this project, due to
delimitations and time limit. The questions and wonderings that evolved during the project are
presented and each section ends with possible research questions.
8.5.1 A European subsidy system
It is stated in literature that a feed-in tariff system leads to larger amount of new installed
capacity than a quota system (Dong, 2012). This could be due to the fact that the subsidies in
feed-in tariff systems are set too high due to the risk of non action if the prices are set too low.
The prices in feed-in tariff systems must therefore be set “too” high. A question raised by the
authors was whether a quota system also could be tuned “too” high with the same result of
participation, and would not increased obligations increase the prices and thus increase the
installed capacities in the same order as a feed-in tariff system?
What would happen if the quotas in the Swedish quota system were increased drastically?
Can it be that quota systems are the norm, reflecting the amount of installation that the policy
makers sought and if feed-in tariff systems generally increase the capacities more, would this
not mean that the feed-in tariff overcompensates and reaches levels of implementations higher
than optimal? Generally speaking, which system, feed-in tariff or quota, is the overall best
practice for the EU to implement as a cross-country subsidy system? Research questions that
could be interesting to examine:
How would a successful and well functioning subsidy system look that would be accepted as a
standard for the European Union?
Can a quota system be tuned in such a way that the results in increased installed capacities
are equal to those obtained for a feed-in tariff system?
8.5.2 An adaption to electricity mix 2.0
This master thesis involves the subject of different systems for frequency regulation and the
market design for power trading. It was found that the differences between the Spanish and
the Swedish systems were small and mostly due to the different natural conditions. This could
mean that the market design needs to be modified if major changes are made to transform the
electricity mix. A whole new system could be built in theory based on a well defined and
likely scenario of the future electricity mix in Sweden. This differs from the mindset of today
where new power is forced to fit an old system which is built around steady and slow
responding nuclear power and fast changing hydropower.
The current market design was judged to be optimal for the electricity mix Sweden has had
for many decades and could prove inadequate for the electricity mix of tomorrow. By creating

58
a new market design for a new electricity mix and compare this to the current system
conclusions and recommendations of how to account for the changes in an optimal way could
be reached. Further, such an analysis could give the “break-even point” between the current
market design and the new in terms of at which level of volatile power would there be
benefits to change the market design. Thus an optimal time for change could be found and
made clear well in advance in order to ensure stability and certainty to the market players. To
conclude that the current Swedish market design is optimal even for the electricity mix of
tomorrow would send signals of stability and reduce the uncertainty for the market players.
In short, the electricity mix in Sweden is changing, these changes might create situations that
the current market design is not properly tuned for. It could therefore be interesting to build a
completely new system based on a future scenario of the Swedish electricity mix. The
differences between this new system and the current one could be investigated and a time
frame of when changes would be optimally introduced could be found from pin pointing at
which level of installed capacity of volatile power the new system is preferred over the
current one.
If a new system was created, without using the market design from today and trying to adapt
it to Sweden’s future electricity mix 2.0, how would it be designed?

59
References Bell, J. (2005) Doing Your Research Project: A Guide for First-Time Researchers in
Education, Health and Social Science, 4th
Edition, Berkshire: Open University Press.
Bisman, J. 2010. Postpositivism and Accounting Research: A (Personal) Primer on Critical
Realism, Australasian Accounting Business and Finance Journal, pp 3-25. Available at
<http://ro.uow.edu.au/aabfj/vol4/iss4/2> [Accessed 12 March 2012].
Bloomberg, 2010. Spain Slashes Prices 45% for New Ground-Based Solar Plants, 5% for
Homes. [online] Available at <http://www.bloomberg.com/news/2010-11-19/spain-slashes-
prices-45-for-new-ground-based-solar-plants-5-for-homes.html> [Accessed 12 April 2012].
Bloomberg, 2012. Spain Halts Renewable Subsidies to Curb $31 Billion of Debts. [online]
Available at <http://www.bloomberg.com/news/2012-01-27/spain-suspends-subsidies-for-
new-renewable-energy-plants.html> [Accessed 14 March 2012].
Bye, T. and Hope, E., 2005. Deregulation of eletricity markets - The Norwegian experience.
Economic and Political Weekly, [e-journal] 40 pp 5269-5278. Available through: JSTOR.
Clean Technica, 2012. 70% of New EU Power from Renewable Energy in 2011 (47% solar,
21% Wind). Clean Technica, [online] 7 February. Available at:
<http://cleantechnica.com/2012/02/07/70-of-new-eu-power-from-renewable-energy-in-2011-
47-from-solar-21-from-wind/> [Accessed 20 March 2012].
Ciarreta, A. and Espinosa, M. P., 2010. The Impact of Regulation on Pricing Behavior in the
Spanish Electricity Market. [pdf] Available at:
<http://www.ucm.es/info/icae/seminario/Ciarreta_May24.pdf> [Accessed 21 March 2012].
CNE, 2012. Información Estadística sobre las Ventas de Energía del Régimen Especial [In
Spanish]. Available at:
<http://www.cne.es/cne/Publicaciones?id_nodo=143&accion=1&soloUltimo=si&sIdCat=10
&keyword=&auditoria=F> [Accessed 16 May 2012].
Collis, J., and Hussey, R., 2009. Business research. 3rd ed. London: Palgrave Macmillan
Conejo, A. J., 2007. The Electricity Market of Mainland Spain: A Brief Critical Review. [pdf]
Ciudad Real: University of Castilla. Available at:
<http://www.ieee.org/organizations/pes/meetings/gm2007/html/SLIDES/PESGM2007P-
000625.PDF> [Accessed 22 March 2012].
Energia Sierra Segura, 2012. What is biomass? Energia Sierra Segura, [online]. Available at:
< http://www.energiasierrasegura.com/preguntas_EN.htm> [Accessed 25 April 2012].
Exchange Rates, 2012. Euro (EUR) to Swedish Krona (SEK) exchange rate history. [online]
Available at: <http://www.exchangerates.org.uk/EUR-SEK-exchange-rate-history.html>
[Accessed 9 May 2012].

60
González, P., 2008. Ten years of renewable electricity policies in Spain: An analysis of
successive feed-in tariff reforms. Energy policy [e-journal] 36, pp 2917-2929. Available
through: ScienceDirect [Accessed 19 March 2012].
Graber, C., 2006? Wind Power in Spain [pdf] Available at:
<http://uprm.edu/aceer/pdfs/wind_power_spain.pdf> [Accessed 23 March 2012].
Hagström, P., 2006. Biomass Potential for Heat, Electricity and Vehicle Fuel in Sweden.
Uppsala: Faculty of Natural Resources and Agricultural Sciences.
Heden, H., and Doorman, G., 2009. Modeller för en förbättrad balansavräkning [In Swedish].
[pdf] Stockholm: Elforsk. Available at:
<http://www.marketdesign.se/images/uploads/projects/0954_Balansavrakning.pdf> [Accessed
11 March 2012].
IEA, 2011. Harnessing Variable Renewables A Guide to the Balancing Challenge. Paris:
OECD/IEA.
IEA, 2012, Electricity/Heat in Sweden in 2009. [online] Available at:
<http://iea.org/stats/index.asp> [Accessed 11 March 2012].
Invest In Spain, 2011, Opportunities in the Spanish biomass and biogas sector. [pdf]
Availalable at: <
http://www.investinspain.org/icex/cma/contentTypes/common/records/mostrarDocumento/?d
oc=4331074> [Accessed 25 April 2012].
Johari, J. 2006. Interpretivism in Information System (IS) Research. Serdang: Universiti Putra
Malaysia.
Krauss, S. E., 2005. Research Paradigms and Meaning Making: A Primer, The Qualitative
Report, Vol. 10, pp 758-770.
MIBEL, 2009. DESCRIPTION OF THE OPERATION OF THE MIBEL. Madrid: MIBEL
Regulatory Council.
Miguélez, E.L., Cortés, I.E., Rodríguez, L.R. and Camino, G.L., 2007. An overview of
ancillary services in Spain, Electric Power Systems Research, 78, pp 515-523.
Moreno, F. and Martínez-Val, J.M., 2011. Collateral effects of renewable energies
deployment in Spain: Impact of thermal power plants performance and management. Energy
Policy 39, pp 6561-6574.
National Energy Commission, 2009. Electricity Tariff Structure: The Spanish case. [online]
Avilable at:
<http://www.aneel.gov.br/arquivos/PDF/El%20Sistema%20tarifario%20en%20Espa%C3%B
1a%20(ingl%C3%A9s)%20-%20MARTI.pdf> [Accessed 14 May 2012].
National Energy Regulatory Commission, 2009. Legislation development of the Spanish
Electric Power Act, Volume 11. Madrid: CNE
Nielsen, S., Sorknæs, P. and Østergaard P.A., 2011. Electricity market auction settings in a
future Danish electricity system with a high penetration of renewable energy sources – A
comparison of marginal pricing and pay-as-bid. Energy, 36, pp 4434-4444.

61
Nord Pool Spot, 2011a. THE LEADING POWER MARKET. [pdf] Nord Pool Spot. Available
at: < http://www.nordpoolspot.com/Global/Download%20Center/Annual-report/Nord-Pool-
Spot-Company-Presentation_2011.pdf> [Accessed 6 February 2012].
Nord Pool Spot, 2011b. No. 45/2011 – Euro to be the official trading currency. [online] Nord
Pool Spot. Available at: <http://www.nordpoolspot.com/Message-center-container/Exchange-
list/2011/09/No-452011---/> [Accessed 30 March 2012].
Nord Pool Spot, 2012a. Power system overview. [online] Nord Pool Spot. Available at:
<http://www.nordpoolspot.com/Market-data1/Maps/Power-System-Overview/Power-System-
Map/> [Accessed 16 April 2012].
Nord Pool Spot, 2012b. Histiry. [online] Available at: < http://www.nordpoolspot.com/About-
us/History/> [Accessed 29 May 2012].
Nord Pool Spot, 2012c. Day-ahead market. [online] Available at:
<http://www.nordpoolspot.com/How-does-it-work/Day-ahead-market-Elspot-/> [Accessed 8
February 2012].
NREAP, 2010. Spain's national renewable energy action plan 2011-2020 [pdf] Available at
<http://ec.europa.eu/energy/renewables/transparency_platform/doc/national_
renewable_energy_action_plan_spain_en.pdf> [Accessed 22 March 2012].
Kungliga Ingenjörsvetenskapsakademien, 2002. Vattenkraften i Sverige. [In Swedish]
Eskilstuna: Energimyndigheten.
Peña, R., 2007. Photovoltaics in Spanish Deserts: Evaluation of the Technology Potential and
Costs. [pdf] Available at: < http://www.icrepq.com/icrepq07/283-pe%F1a.pdf> [Accessed 26
April 2012].
Red Electrica de Espana, 2009. The Spanish electricity system Summary 08. Madrid: Red
Electrica de Espana.
Red Electrica de Espana, 2010. The Spanish electricity system Summary 09. Madrid: Red
Electrica de Espana.
Red Electrica de Espana, 2011. The Spanish electricity system Summary 2010. Madrid: Red
Electrica de Espana.
Red Electrica de Espana, 2012. the Spanish electricity system – preliminary report 2011,
Madrid: Red Electrica de Espana, S.A.U.
Regeringskansliet, 2010. The Swedish National Action Plan for the promotion of the use of
renewable energy in accordance with Directive 2009/28/EC and the Commission Decision of
30.06.2009. [pdf] Available at
<http://ec.europa.eu/energy/renewables/transparency_platform/doc/national_renewable_energ
y_action_plan_sweden_en.pdf> [Accessed 22 March 2012].
Ritzer, G., 1975. Sociology: a multiple paradigm science, The American Sociologist
Vol. 10, pp. 156-167.
SCB, 2009. Annual Energy Balance Sheets 2009-2010. Örebro: SCB

62
Schallenberg-Rodriguez, J and Haas, R., 2011. Fixed feed-in tariff versus premium: A review
of the current Spanish system, Renewable and Sustainable Energy Reviews [e-journal] 16, pp
293-305. Available through: SciVerse ScienceDirect [Accessed 19 March 2012].
SMHI, 2006, 250 Years of Weather Observations at the Stockholm Observatory. Faktablad nr
27. Norrköping
SMHI, 2009. Normal globalstrålning under ett år. [In Swedish] [online] Available at
<http://www.smhi.se/klimatdata/meteorologi/stralning/1.2927> [Accessed 26 April 2012].
Svensk Vindenergi, 2012a. Nya rekord för vindkraften under 2012. [In Swedish] [online]
Svensk Vindenergi, 2012b. Vindkraftstatistik 2011 och prognos. [In Swedish] [pdf] Available
at < http://www.vindkraftsbranschen.se/wp-content/uploads/2012/02/Statistik-vindkraft-
20120213.pdf> [Accessed 1 June 2012].
Available at <http://www.vindkraftsbranschen.se/blog/pressmeddelanden/nya-rekord-for-
vindkraften-under-2012/> [Accessed 30 March 2012].
Swedenergy, 2012. Om vindkraft [In Swedish]. [online] Available at:
<http://www.svenskenergi.se/sv/Om-el/Vindkraft> [Accessed 14 March 2012].
Swedish Energy Agency, 2010, Energy in Sweden 2010, Eskilstuna: Swedish Energy Agency
Swedish Energy Agency, 2011a, Vindkraftstatistik 2010 [In Swedish]. Eskilstuna: Swedish
Energy Agency.
Swedish Energy Agency, 2011b, The Electricity Certificate System 2011. Eskilstuna: Swedish
Energy Agency.
Swedish Energy Agency, 2011c, Energiläget i siffror 2011 [In Swedish]. Eskilstuna: Swedish
Energy Agency.
Swedish Energy Agency, 2012. Hög nettoexport då användning av el minskade under 2011
[In Swedish]. [online] Available at:
<http://energimyndigheten.se/sv/Press/Pressmeddelanden/Hog-nettoexport-da-anvandningen-
av-el-minskade-under-2011/> [Accessed 30 March 2012].
Tekniska museet, 2011, Kärntekniska anläggningar i Sverige [In Swedish]. [online] Available
at: <http://www.tekniskamuseet.se/1/867.html> [Accessed 11 March 2012].
Worldclimate, 1988, MADRID/RETIRO, SPAIN. [online] Available at:
<http://www.worldclimate.com> [Accessed 19 March 2012].
World-geography, 2010, Spain. [online] Available at:
<http://world-geography.org/europe/629-spain.html> [Accessed 19 March 2012].