Spain and the euro - Banco de España12 Spain and the euro. The fi rst ten years and structural...
290
Transcript of Spain and the euro - Banco de España12 Spain and the euro. The fi rst ten years and structural...


Spain and the euro
The fi rst ten years
Madrid, 27 February 2009


Edited by Juan F. Jimeno
Spain and the euro
The first ten years
Madrid, 27 February 2009
An international conference sponsored
by the Banco de España

© Banco de España, 2010Calle Alcalá, 48. Tel.: 91 338 50 00; 28014 Madridwww.bde.es
Legal deposit: M. 22431-2010
Printed in Spain by Artes Gráfi cas Coyve, S.A.Avenida de Córdoba, 21. 28026 Madrid.
All rights reserved. The contents of this publication are protected by Spanish law, which imposes prison sentences and/or fi nes, in addition to the related damages, on whosoever should reproduce, plagiarise, distribute or publicly communicate, in its en-tirety or in part, a literary, scientifi c or artistic work. Such works may not be modifi ed, interpreted or their performance reproduced or communicated in any medium without express permission.

CONTENTS
Foreword ................................................................................................................. 9Miguel Fernández Ordóñez, Governor of the Banco de España
Introduction: conference summary ................................................................... 11Juan F. Jimeno, Banco de España
INTRODUCTORY REMARKS: AN OVERVIEW OF THE FIRST DECADE OF THE EURO
A decade of the euro ........................................................................................... 21Miguel Fernández Ordóñez, Governor of the Banco de España
Spain’s membership of EMU: lessons for 2009 ................................................ 27Luis Ángel Rojo, Former Governor of the Banco de España
EMU at 10: coming of age in a global crisis ................................................ 31
Joaquín Almunia, European Commissioner for Economic and Monetary Affairs
EMU: ACHIEVEMENTS AND CHALLENGES AHEAD
Ten years of EMU: successes and puzzles ................................................... 41Charles Wyplosz, The Graduate Institute, Geneva, and CEPR
Comments
Daniel Gros, Centre for European Policy Studies................................................ 63Jose M. González-Páramo, European Central Bank ........................................ 73

THE PERFORMANCE OF THE SPANISH ECONOMY IN EMU
The performance of the Spanish economy in EMU:
the fisrt ten years .............................................................................................. 83Á. Estrada, J. F. Jimeno and J. L. Malo de Molina, Banco de España
Comments
Jordi Galí, CREI-UPF ...................................................................................... 139
EMU AND FINANCIAL MARKETS
The euro as a reserve currency for global investors ................................ 149Luis M. Viceira, Harvard Business School and Ricardo Gimeno, Banco de España
Comments
Rafael Repullo, CEMFI .................................................................................. 179Jaume Ventura, CREI-UPF .............................................................................. 185
CHALLENGES FOR ECONOMIC POLICY
Ageing and real convergence: challenges and proposals ........................ 191Ángel de la Fuente, IAE-CSIC and Rafael Doménech, BBVA
Comments
Juan J. Dolado, Carlos III University of Madrid & CEPR .............................. 275Ángel Ubide, Tudor Investment ........................................................................ 281

Foreword
Governor of the Banco de EspañaMiguel Fernández Ordóñez
On 27 February 2009 the Banco de España organised a conference under the heading “EMU: the first ten years” to commemorate the adoption of
the euro on 1 January 1999. The conference was part of a series of events organ-ised last year by the Spanish Central Bank to celebrate the tenth anniversary of Spain’s entry into EMU.
The international conference analysed what membership of the single cur-rency had meant for the euro area countries and, in particular, for Spain. It was organised around four main sections: the achievements of and challenges ahead for EMU; the implications for the Spanish economy; the impact of the euro on financial markets, and the consequences of EMU for the conduct of fiscal policy and for structural reforms.
This volume presents the conference proceedings, which will contribute to understanding the main implications of the Monetary Union and to identifying those elements that were to prove crucial for the smooth implementation of a common monetary policy during the first ten years of EMU. We acknowledge the contribution of all the participants, speakers and discussants who, through their interventions, helped to shed light on the functioning of EMU over the past decade and the implications for the adjustment to the new macroeconomic scenario emerging in the wake of the global financial crisis. Finally, let me convey my special thanks to all the staff involved in the design and organisation of the conference.


Introduction: conference summary
Banco de EspañaJuan F. Jimeno
This volume contains the papers presented at the conference organised on 27 February 2009 to celebrate the 10th anniversary of the euro and of Spain’s
participation in the third phase of Economic and Monetary Union. The confer-ence, attended by academics, public officials, central bankers and financial mar-ket participants, offered an opportunity to discuss the achievements of EMU to date, the challenges ahead and the performance of the Spanish economy in EMU. It was organised around five main blocks: an introductory session, with opening remarks and a keynote speech, followed by four sessions devoted to the function-ing of EMU during its first decade, the performance of the Spanish economy within EMU, the impact of the euro on financial markets, and the economic poli-cies needed to augment the benefits of monetary integration, in all cases paying particular attention to the changing macroeconomic scenario in the wake of the global crisis. At each of the four sessions there were presentations of a main paper, followed by comments and general discussion. What follows is a brief summary of these contributions.
1 The first decade of the euro: an overview
Opening remarks were delivered by Miguel Fernández Ordóñez, the Governor of the Banco de España, and by Luis Ángel Rojo, his predecessor. The keynote speech was delivered by Joaquín Almunia, the EU Commissioner for Economic and Financial Affairs. All highlighted the macroeconomic stability provided by EMU, even at times of great uncertainty, as at present, marked by the global fi-nancial crisis. Miguel Fernández Ordóñez’s remarks also focused on the sources of divergence between EMU members, contending that inflation and growth rate differentials were not so large during the first decade of the euro and that it is not the role of monetary policy to counter these divergences, but rather that fiscal

12 Spain and the euro. The fi rst ten years
and structural policies needed to play a more active part. Accordingly, countries with low potential growth and countries with higher inflation and unemployment rates should undertake structural reforms, increasing product market competition, in some cases, and reforming the labour market, in others, to consolidate the euro further. In the Governor’s view, the ECB has reacted quickly and resolutely, in the current crisis, to the financial market difficulties, but other economic and social agents have not yet fully internalised the “rules of the game” of monetary union.
In his remarks, Professor Rojo, who was Governor of the Banco de España when the Maastricht Treaty was signed and up to completion of the third phase of EMU, set Spain’s participation in EMU in a historical perspective. He described the challenges that Spain faced to join the monetary union as a founding member, and clearly identified the advantages of integration, on the basis that macroeco-nomic stability was a necessary condition for sustained economic growth. He indi-cated that, despite all the difficulties that had to be overcome during the transition to EMU, such as correcting large macroeconomic imbalances and imposing strong budgetary consolidation, he considered the efforts worthwhile. However, he also conceded that problems remain and that not all agents have adopted patterns of behaviour more consistent with monetary union. Commitment to sound policies was vital to join EMU, and this commitment remains essential today, to limit the cost of the current recession and restore economic growth in the medium term.
Commissioner Almunia’s keynote address focused on two main themes: the performance of the euro area in the global financial crisis and the measures needed to build on its achievements in the new economic and financial scenario. After praising the main achievements of EMU in its first ten years – namely. macroeconomic stability and closer economic integration among the member countries – he set great store by how the euro area has performed during the “most severe economic and financial crisis since the Second World War”. First, it has shielded many member countries, in particular, the smaller and more vulner-able ones, from the exchange rate volatility and widening sovereign debt spreads that would have occurred in its absence. Second, the institutional framework has proved sufficiently flexible to allow for common policies that, first, contained the crisis, and then pushed for recovery. As for the measures required to further con-solidate the euro area, Mr Almunia referred both to the internal and external di-mensions. To improve the internal functioning of the euro area, he regarded the deepening of fiscal surveillance and the broadening of economic surveillance as crucial for maintaining macroeconomic stability and for restoring a sound basis for sustained economic growth after the strong impact of the crisis on members’ fiscal positions and macroeconomic imbalances. Mr Almunia also argued that a more ambitious structural reform programme was needed to ease adjustment within the euro area. Among the key areas for reform, he highlighted energy and environmen-tal policies, education and R&D and regulation of markets for goods, services and

Introduction: conference summary 13Juan F. Jim
eno
labour. As for the external dimension, he called for a comprehensive international strategy for the euro and the euro area economy, paying particular attention to reform of the international regulatory and supervisory arrangements for financial markets, sending a strong message against protectionism and taking further steps towards a new and more inclusive multilateralism.
2 EMU: achievements and challenges ahead
At the first session, chaired by Dr. Axel Weber, president of the Bundesbank, Professor Wyplosz described the first decade of EMU as nine successful years followed by a painful last year. He recognised price stability as the main result of EMU during the first nine years, together with enhanced trade and financial in-tegration. While deeming it debatable whether this satisfactory performance was due to “good luck, good policies or both”, he conceded that the euro area had “operated better than most observers had predicted”. Nevertheless, he also said that the global financial crisis had highlighted some, previously identified, insti-tutional drawbacks in the organisation of the euro area, such as the regulation and supervision of an internationally integrated banking sector, the design and implementation of the Stability and Growth Pact, the application of entry crite-ria to new members and the Eurosystem’s “slow” response to changing monetary conditions. Professor Wyplosz also referred to the asymmetries observed during the first decade of EMU, considering it “puzzling”, not that current account im-balances had risen and inflation and growth rate differentials had widened, but rather that these imbalances and differentials had been persistent and were to some extent connected, meaning that two groups of countries could be clearly identified within the euro area: i.e. low-inflation, low-growth and external sur-plus countries, and high-inflation, high-growth and large external deficit coun-tries. His explanation drew on a reformulation of the “Walters critique”, namely that monetary union could be unstable simply because of divergent initial infla-tion rates, meaning that a common nominal interest rate would deliver lower real interest rates in countries with higher inflation. In his view, the persistent asym-metries observed within the euro area during its first decade could be rationalised by incorporating the effects of divergent real interest rates into the real exchange rate. The bad news was that, were this hypothesis to be right, correcting imbal-ances in highly-indebted countries would “require a significant fall in demand, which could only be imposed by serious financial stress”.
In his comments, Professor José Manuel González-Páramo, a member of the Executive Board of the ECB, argued that the successes of the euro area during the first nine “happy” and “easy” years described by Professor Wyplosz should not al-low us to forget that the euro was launched against a background of numerous

14 Spain and the euro. The fi rst ten years
difficulties and extensive scepticism. First, as a new institution, the ECB had no track record and had to win credibility quickly. Second, knowledge of how the euro area economy functioned was very incomplete, due to the absence of har-monised data and common methodological instruments. Accordingly, in his view, the beneficial effects of EMU in many macroeconomic areas should not be played down simply because of the prevailing favourable international macroeconomic scenario. However, he recognised that progress had been slow in some areas, such as structural reforms and fiscal consolidation. As for the “puzzles” identified in the paper, he criticised the explanation based on the extended version of the Walters critique, indicating that there was no evidence of increasingly divergent real inter-est rates following the introduction of the euro, while it was wage and price rigidi-ties and barriers to cross-border trade that were responsible for the loss of competi-tiveness. He also opposed the view that devaluations would have been helpful in response to the financial crisis, given the global nature of the crisis and the fact that devaluations are less effective when there is trade openness.
Daniel Gros, the director of the Centre for European Policy Studies, focused his remarks on three points: the nature of the crisis; the sources of the observed asymmetries among euro area countries; and the empirical importance of the Wal-ters critique. In his view, the two developments that almost always precede major crises, namely credit expansion and unusual increases in asset prices, occurred not only in the US, which was usually considered to be the country of origin of the crisis, but also in Europe, so it was not purely a crisis made in the USA. Never-theless, regarding these two developments, there were also significant differences across countries, and these differences could not be explained by inflation differen-tials. He argued that EMU entry led to housing price bubbles in some countries, and that house prices were, in fact, the main driver of intra-euro area divergences. To prevent this, he called for more government intervention when housing prices and construction activity overheat.
3 The performance of the Spanish economy in EMU
The second session was devoted to the performance of the Spanish economy in the euro area. In the paper presented at this session, Ángel Estrada, Juan F. Jimeno and José Luis Malo de Molina analysed the experience of the Spanish economy in the first decade of EMU in four stages. The paper first referred to a series of trans-formations in the 1990s that shaped the starting point for the long expansion of the 1996-2006 period. The main pillars of the transition to a new regime based on macroeconomic stability were a monetary policy stance anchored to the objective of nominal convergence with other potential EMU members, fiscal consolidation and structural reforms, laying the groundwork with a view to benefiting from the

Introduction: conference summary 15Juan F. Jim
eno
economic stimulation entailed by euro area membership. The paper then high-lighted the consequences of euro area membership for the Spanish economy. Fis-cal consolidation under way, and subsequently that imposed by EMU fiscal rules, helped drive down the risk premia associated with Spanish assets. The elimination of the exchange rate vis-à-vis other euro area countries, besides contributing to reducing the risk premia, was also instrumental in expanding international trade and raising the degree of openness of the Spanish economy. The sharp reduction in interest rates was also of vital importance for future developments, as it was perceived as permanent and, as such, significantly increased the borrowing capac-ity of Spanish households and firms. These favourable developments were com-plemented, to some extent, by privatisation and liberalisation policies, but less so by labour market reforms, something which proved to be a major handicap once the Spanish economy had to undergo a profound adjustment further to the financial crisis. Subsequently, the paper documented the characteristics of the ex-pansion seen during the first eight years of EMU, featuring high rates of growth of GDP and GDP per capita and a surge in population and employment, but low rates of productivity growth. The interpretation was that the demand boom, based on optimistic expectations of future growth and on the large-scale availabil-ity of cheap credit, was not fully met by increased supply. As a result, significant imbalances built up: high indebtedness of households and firms; worsening inter-national competitiveness; and an excessive concentration of productive resources in the construction sector. Lastly, the paper discussed how the Spanish economy is adjusting to these imbalances, in the context of the global financial crisis, and pointed to supply-side improvements as the main objective for reducing the stress associated with the adjustment, and to structural reforms as the main instruments available to the government in order to restore growth to a sustainable path.
In his comments, Jordi Galí basically agreed with the overview presented by Messrs Estrada, Jimeno and Malo de Molina, regarding the diagnosis of the Spanish economic situation, and with the policy implications contained in the paper, and fo-cused on two important points. First, he addressed the issue of the contribution euro area membership had made to the imbalances built up by the Spanish economy. In his view, membership had been a stabilising factor, since the adjustments needed to join the euro area would have been difficult to introduce without the entry payoff. However, he acknowledged that during the first eight years of EMU, real interest rates in Spain were lower than they would have been, had monetary pol-icy remained independent. In any case, he argued that a positive inflation dif-ferential was not a factor of instability, since the demand boom experienced by the Spanish economy required this response and, moreover, the inflation differ-ential would have been higher, had wages and prices been more flexible. In this regard, he pointed to fiscal policy as the main destabilising factor during this pe-riod. He then went on to discuss whether or not EMU was compatible with bal-

16 Spain and the euro. The fi rst ten years
anced growth, and his answer was a qualified yes, identifying three conditions for balanced growth within EMU: countercyclical domestic fiscal policy, stabilising fi-nancial policies and greater wage flexibility.
4 EMU and financial markets
The third session of the conference was devoted to the impact of the euro on international financial markets. In this connection, the paper by Luis Viceira and Ricardo Gimeno focused on the role played by the euro as a reserve cur-rency, paying particular attention to the demand for euro by global investors. The sources of this demand could be varied. First, some currencies can help investors hedge against unfavourable changes in future real interest rates, changes shown by empirical evidence to be considerable and persistent over time. Thus, investors may find the so-called reserve currencies more attractive, given the association of their attendant real interest rates with low volatility. The authors derived the op-timal portfolio allocations of investors with different degrees of risk aversion, and showed that high risk-averse long-term investors all allocated more than 50% of their portfolio to the euro, regardless of their home currency, while conservative short-term investors were almost always fully invested in their home currency. Hence, the euro has become a reserve currency, in the sense that it helps inves-tors reduce the volatility of real interest rates. Viceira and Gimeno also looked at the euro’s contribution to capital market integration and, therefore, to the promo-tion of better risk-sharing. In this regard, they attempted to measure the cross-country correlation of discount factors pricing securities. Their findings suggested an increased covariation of unexpected returns and revisions in expectations of discount rates of national stock markets in the euro area with revisions in expecta-tions of EMU-wide discount rates.
In his comments, Rafael Repullo raised three issues. The first two referred to analysis of the optimal portfolio allocation of risk-averse long-term investors that can hold nominal bonds denominated in domestic currency and in a single foreign currency. He asked what would happen if the analysis were not restricted to cur-rency pairs, but rather to a set of nominal bonds denominated in more than two currencies. He also highlighted the negative correlation found between the real re-turns on short-term euro-denominated bonds and the real returns on short-term bonds denominated in the other three currencies (US dollar, Japanese yen and ster-ling), which led to large optimal exposure to the euro. He put it that the sample period used for the estimation, the fact that the authors derived static rather than dynamic exposures to currencies and the lack of consideration of general equilib-rium effects might explain this surprising finding. In the second part of the paper, he called for a more detailed investigation of why the model used to analyse capital

Introduction: conference summary 17Juan F. Jim
eno
market integration might be valid both before and after the introduction of the euro, and argued that using national stock market returns might overestimate the degree of capital market integration, since these returns were affected by common macroeconomic and monetary policy shocks.
Jaume Ventura questioned the starting point of the paper, namely the associa-tions between the demand by central banks and financial institutions for reserve currencies and the financial decisions of households and firms wanting to hedge against risk. In his opinion, more empirical evidence was needed to support the view that the value of the euro in this regard was a quantitatively significant com-ponent of the demand for it as a reserve currency. As for the empirical results re-garding the correlation of the euro with other currencies and the degree of capital market integration, he found them very suggestive and worthy of further research aimed at ascertaining why the euro was a good hedge against real interest rate and global equity return risks.
5 Challenges for economic policy
At the final session of the conference, the focus was on the implications of EMU for other economic policies, in particular, fiscal and structural policies. The paper presented by Ángel de la Fuente and Rafael Doménech identified two main challenges for the Spanish economy over the coming decades: achieving real convergence with the most advanced euro area countries and facing the major socioeconomic changes entailed by demographic developments. In order to meet these challenges it would be necessary to increase the productivity growth rate, to improve the functioning of the labour market and to ensure the viability of the social protection system in the context of a rapidly ageing population. They argued that the reforms needed to achieve these goals would be far-reaching, and more necessary within EMU. To make the case for these structural reforms, they started by documenting the growth process of the Spanish economy over the last half-century, so as to identify the sources of income differentials with other ad-vanced countries. These proved to be a poor performance of productivity growth over the last decade, and a labour market that had delivered very high and very volatile unemployment rates. As for the demographic outlook, they relied on available projections from the National Statistical Office that showed accelerating population ageing that has already begun and that will reach levels above those of other euro area countries. Given this situation, they identified three policy areas that were crucial to Spain’s economic future: the education sector, the la-bour market and the pension system. In the second part of the paper, they identi-fied the main reforms needed to achieve the three goals outlined above as those that should have priority on the policy agenda. From their detailed analysis of
18 Spain and the euro. The fi rst ten years
the educational challenge, labour market reforms and the pension system and the challenge of ageing, they arrived at a set of conclusions regarding how the reforms should be designed, with several recommendations to improve the functioning of the educational system, the labour markets and social policies.
Juan J. Dolado praised the diagnosis contained in the paper but would have preferred more specific policy proposals on reform of the labour market and edu-cation and pension systems. He argued that only with specific measures, accom-panied by a careful analysis of their political viability, would it be feasible to coun-ter the opposition of those in favour of the status quo. In this regard, he set out three examples concerning the reform of labour, education and the markets for goods and services: how to address the duality of the labour market; how to trans-fer funds from the inefficient and oversized higher-education system to the public secondary and vocational training system; and how to complement the increase in competitiveness in the markets for goods and services with labour market reforms.
In his comments, Ángel Ubide argued that Spain faced serious structural prob-lems, since the rapid economic growth of the past decade was based on highly unstable foundations and served only to return to the relative position, in terms of income per capita, already occupied in 1975. He then stressed some problems such as low female labour market participation and the poor performance of the education system, arguing in favour of extending out-of-school educational offer-ings and extending the teaching year, initiatives which, in his view, could solve both problems simultaneously. He also pointed to the lack of policy coordination among regions as an obstacle to economic growth. Finally, he discussed the poten-tial impact of the crisis over the long term and concluded that, in the absence of the necessary structural reforms, the economic outlook could be similar to that of the long and slow recovery from the crisis of the 1970-80 period.

Introductory remarks: an overview of the first
decade of the euro

Miguel Fernández Ordóñez
Governor of the Banco de España
A decade of the euro
I would like, first of all, to welcome you and thank you for being here today at the Banco de España to share with us this event commemorating the tenth
anniversary of Economic and Monetary Union (EMU), of which Spain has been a member since inception. In particular, I would like to thank Professor Rojo for kindly agreeing to take part in this opening session. He was one of the foremost figures in the huge effort of persuasion and economic and monetary policy ac-tion which made it possible for Spain to join EMU. He was Governor of the Bank from the time the Maastricht Treaty was signed up until 2000, when the project had become a reality and, to many people’s surprise, Spain’s economy had success-fully negotiated the rocky road to convergence. A celebration like today’s without the presence of someone who has been so closely linked to the project would have been incomplete. Thank you very much, Ángel.
For a country like ours which has often arrived late at the key events in mod-ern history, the fact of having been a founding member of EMU marks a historic milestone and demonstrates that Spaniards are willing and able to make an active contribution to the construction of Europe and thus to the present and future wel-fare of its citizens. This project of European integration, dynamic and permanently under construction, is today facing up to the challenges of a global economic re-cession and an international financial crisis of unknown proportions.
More than ten years ago, before the euro had been created, an academic de-bate drawing on the theory of optimal monetary areas questioned whether a single interest rate, and therefore a single monetary policy, could be feasible for such a varied group of countries. Ten years after the birth of the euro, both those of us in EMU and many who have not joined the project acknowledge the huge advan-tages of belonging to a monetary union.
Today, the single currency’s contribution to reducing uncertainty for econom-ic agents is evident. The enormous advantages of a moderate rate of inflation, of

22 Spain and the euro. The fi rst ten years
interest rates with a limited range of volatility, and of companies which do not have to think about the exchange rate when buying and selling in an area with 330 million consumers are obvious. All this means stability, which contributes significantly to growth, as we have seen in other monetary areas of similar size, such as the United States, and we ought to make the most of it.
At the same time, we should celebrate the success of the Eurosystem as an in-stitution. The European Central Bank has fulfilled the goal set for it in the Trea-ty, namely keeping inflation expectations anchored, even through difficult times, and the Eurosystem is itself a truly fascinating experiment. Those of us who are privileged enough to attend its meetings in Frankfurt every fortnight are witness-es to the success of this achievement, which is quite unique in the process of Eu-ropean construction.
The Eurosystem is based on a mixture of centralised and decentralised deci-sions that is perfectly in tune with the common European project. On the one hand, the ECB makes centralised decisions affecting the three hundred and thirty million citizens who share the euro as their common currency, but on the other, the Eurosystem operates in a highly decentralised and cooperative manner. Na-tional central banks are involved in many joint projects, but let me mention one which I have experienced at first hand in recent years: the design and launch of Target 2 Securities which, although perhaps oddly named, is an ambitious project which will enable settlement of securities across Europe. This platform is being designed and built by four central banks, namely those of Germany, France, Italy and Spain. Any pro-European would take great satisfaction from seeing the staff of these countries’ banks working together day-by-day on a common project.
The euro’s critics, today a clear minority, raise the issue of divergences in mem-ber countries’ inflation and growth rates during the first ten years of European Monetary Union.
But the data do not support their case. Over these ten years the diversity of inflation and growth in the EMU countries has been moderate compared with the situation prior to monetary union. And compared with other regions, this diversity, although somewhat more persistent, has been of the same order of mag-nitude as that observed between regions and states in the United States, to take an example of a monetary union of approximately the same size as the euro area and whose viability nobody questions. Nobody thinks that on account of these divergences California should have a different currency from New York or Illinois. Moreover, the empirical evidence from EMU shows that national economic cycles have become more synchronised following economic and monetary integration.
However, it should be recognised that growth and inflation differentials have persisted over this period, and that we need to reduce them. However, it is no good asking what the euro can do to solve this problem; we need to ask what we should do through other policies to narrow these differentials, because monetary

A decade of the euro 23M
iguel Fernández Ordóñez
policy cannot do anything to narrow these differences. The best way in which it can contribute to boosting growth, jobs and citizens’ welfare is by keeping infla-tion at bay throughout the euro area. If, as I said earlier, we are convinced of the enormous advantages of the euro – not just in political terms, but also economi-cally and socially – what we need to ask is what governments and national parlia-ments can do to consolidate the euro even further.
And here much important work remains to be done. The first task, which was identified early on, was that of attending to fiscal policy. The Stability and Growth Pact, and all the Eurogroup’s efforts over these years to maintain a disci-plined and coordinated fiscal policy, have been essential and will continue to be so in the future. But over the next decade, as well as continuing in this direction, efforts need to focus on designing and adopting the necessary structural policies.
If we look at how these divergences are perceived in the countries concerned, we can gain some insight into the importance of making an effort to carry out structural reforms. Thus, in Spain, many people feel that the Spanish economy’s problems of divergence in this period are related to a lack of dynamism in some of the countries of the euro area, whose growth potential is consequently much lower than ours. And this is true. Spain has a greater degree of privatisation, which makes its economy much more dynamic. Moreover, the relative weight of public expenditure in the economy is much lower. The advances in competi-tion in many sectors make for greater potential growth in Spain than in other countries in the euro area. The problem with belonging to an area in which some countries have lower potential growth is that when the ECB set interest rates dur-ing the period 2000 to 2004, it set them at a level that, although possibly high for those other countries, was very low for Spain. This led to greater levels of debt, rising inflation and, consequently, a loss of competitiveness.
But, let us look now at how this divergence is seen by the other countries. The less dynamic countries in EMU with lower potential growth rates feel that they were being made to “suffer” higher interest rates than were suitable for them, be-cause the more dynamic countries were more prone to inflation than they were. And this is also true. Both sides of the story are true.
The lesson we should all draw from this is that, on the one hand, the less dynamic countries have to undertake structural reforms – more privatisation, in-creased competition, greater weight of the private sector in the economy, etc. in order to raise their potential growth rate – and, on the other, the countries more prone to inflation should, as I said a couple of weeks ago in Zaragoza, undertake their own structural reform of labour institutions, the rental property market, etc. so that increased demand, deriving from relatively low interest rates, does not lead to inflation.
This ten-year anniversary is taking place just when the global macroeco-nomic scenario has seen profound changes as a result of the financial crisis and

24 Spain and the euro. The fi rst ten years
is dominated by high uncertainty and powerful recessionary trends. Those who are against a single monetary policy are now emphasising the uneven impact of changes in the global economic situation on the member countries of the euro area, as these countries lack the macroeconomic stabilisation instrument provided by national monetary policies.
Once again, this is not an argument against monetary union but, again, in favour of speeding up structural reforms. But, first let us note the enormous ben-efits of monetary union precisely in these times of crisis. Can anyone imagine how the 16 countries of the euro area might have weathered the international financial storm had they kept their 16 currencies? The scale and severity of the financial problems these countries would have faced if they had kept their cur-rencies in such an upheaval should be clear to anyone.
Cast your minds back to the events of the early nineties, when although the effects of the recession in the US were slow to make themselves felt in Europe, they finally did so with unwonted virulence. In the midst of the major challenges posed by German reunification, the lack of coordination among the monetary policy responses on this side of the Atlantic led to massive speculative pressure on exchange rates and a currency crisis on a huge scale, an event which some peo-ple did not hesitate to dub the collapse of the European Monetary System. This speculation ended up imposing huge costs on all the countries involved. That will not happen this time around.
In these times of huge uncertainty, the reaction of the key institution in the European Monetary Union, the European Central Bank, has been exemplary. Firstly, it has managed to bring down the five-month Euribor from 5.3% to 2% through changes in monetary policy, despite the wider spreads resulting from the crisis. Secondly, it has adopted a policy of unlimited liquidity provision in co-ordination with other central banks, as illustrated by the agreements to provide liquidity in currencies other than the euro.
Other European economic authorities have also reacted decisively to sup-port the financial system, safeguard its functioning and stimulate their econ-omies. Against this background of worldwide difficulties, cooperation and coordination between national authorities, particularly in Europe and the Monetary Union, is today more necessary than ever. Responses based on the adoption of measures designed from a primarily national perspective, as would have been the case in the past, are destined to fail. The answer to the current difficulties besetting our economies is more Monetary Union and more Euro-pean Union.
Let me end by answering the argument currently seen in the press about the uneven impact of the crisis on different economies. As I said earlier when I men-tioned the differentials observed in the past, this problem cannot be resolved by the ECB, but must be addressed by national governments and parliaments, which

A decade of the euro 25M
iguel Fernández Ordóñez
need to adopt the structural reforms I have alluded to. Moreover, the crisis should be taken as an opportunity to embark on all these structural reforms.
Weak potential growth, problems of competitiveness and productivity, the need to find the appropriate level of regulation and government intervention, insufficiently flexible labour and product markets ... these are only some of the challenges which remain crucial to the welfare of European citizens, and there-fore, should continue to figure prominently in policy-makers’ agendas. Beyond the short term, these are the factors that will determine the relative economic performance of the euro area countries.
National policies have the task of raising the capacity of each national econ-omy to adjust to adverse shocks and fostering productivity and the use of the various factors of production. The longer the delay in adopting the necessary na-tional policies, the higher the potential cost of adverse events. As central bankers, our task is basically to focus our efforts on maintaining price stability, thus pro-viding an appropriate framework for sustained growth and increased employment and welfare. But it is also our role to remind the economic authorities and social agents of the importance of being fully aware of the “rules of the game” of mon-etary union.
Clearly, this anniversary has come at an extremely complex time for the in-ternational economy, and this also goes for the euro area and Spain. The chal-lenges are of the first order and uncertainty abounds. But it would be unjust not to recognise that the path taken over these ten years of the common European project is a solid basis for being reasonably optimistic about our ability to meet these challenges.


Luis Ángel Rojo
Former Governor of the Banco de España
Spain’s membership of EMU: lessons for 2009
First of all, I would like to express my gratitude to the Governor of the Banco de España for having invited me to take part in this conference. This has al-
lowed me to return to a place I consider home and given me the opportunity to address you all at the start of this seminar to commemorate the tenth anniversary of the creation of the European Economic and Monetary Union and Spain’s par-ticipation in this project.
As numerous economists have frequently reminded us, the history of the Span-ish economy in the second half of the 20th century is an example of the advantages of openness, liberalisation and deregulation for citizens’ economic welfare. In the case of Spain, three fundamental milestones mark this process of opening-up. The first two are the 1959 Stabilisation Plan and, after the transition to democracy, membership of the European Union in 1986. The third milestone in this process is undoubtedly Spain’s joining EMU in 1999, as one of the group of countries be-ginning the so-called third phase of the project of economic and monetary union. At a time when the advantages of globalisation are being questioned in numer-ous economic and political fora, and calls are being heard for a return to protec-tionism, Spain’s experience should serve as an example of the progress that can be made by abolishing protectionist practices and opening up to the outside world.
All these milestones represented opportunities for the country to modernise its economy, improve the quality of its economic institutions and expand its possibili-ties for growth. In the first two cases, 1959 and 1986, Spain joined a moving train, namely the West’s rapid progress after the end of the Second World War. This was a process in which the countries of Europe had strengthened their ties through a range of commercial, economic and financial accords. In 1999, for the first time, Spain joined the train before it had left the station, by becoming a founding mem-ber of the new Economic and Monetary Union and adopting the single European currency that was created.

28 Spain and the euro. The fi rst ten years
The journey to the euro was not without its difficulties. As many of you will recall, the crisis of the European Monetary System in 1992 highlighted the dif-ficulty of progressing towards the economic integration of Europe while still re-taining separate national currencies. However, rather than derailing integration, the EMS crisis led to the project being given fresh momentum. In these circum-stances, there was a commitment to making more determined progress towards monetary union, and a belief that tightening the links by creating a new currency with a single monetary policy would make it possible to bring the single market project to its culmination.
The challenge was clear for a country like Spain, which had evidently been on its way towards real convergence with Europe, albeit with some ups and downs owing to inadequate macroeconomic discipline, which led to higher inflation rates than those of our partners and to the periodic devaluation of the currency. We had before us the possibility of sharing a currency and monetary policy with some of the countries with the highest levels of welfare and stability in the world. The loss of an independent national monetary policy was relative, as our room for manoeuvre, given the leadership Germany exercised in monetary policy, was limited. In this respect EMU represented a reasonable institutional solution to the asymmetries in the way national monetary policy had tended to be handled in the 1980s and the early 1990s. Moreover, Economic and Monetary Union gave national markets a powerful stimulus to move towards integration, by elimi-nating the last barrier to the free circulation of goods and capital within the area, thus promoting greater transparency in price-setting and more competitive prod-uct markets.
At the heart of the integration process there was a clear consensus that macr-oeconomic stability was an essential prerequisite for sustained economic growth, and that there was a need to create the instruments for rigorous and balanced economic policies based on a set of structural reforms to increase the efficiency and flexibility of the member countries’ economies. For this reason, member-ship of EMU required countries to demonstrate the suitability of their econom-ic structures, institutions and economic policy tools, and to meet the so-called Maastricht criteria. Finally, it was also necessary for economic agents, specifically the financial markets, to perceive Spain as being able to meet this challenge in a credible way.
Those of us who were on the front line of Spain’s economic policy in the years leading up to the creation of EMU were aware of the advantages of integration, advantages from which Spain had benefited so much in the previous decades. However, we were also aware of the resistance that such a significant step might face. Clearly, although joining EMU was an opportunity we could not let pass us by, it was not in itself going to solve all the Spanish economy’s problems, and many of these problems are unfortunately still with us today.

Spain’s membership of EMU: lessons for 2009 29Luis Ángel Rojo
Obviously, there were some bumps along the road. The peseta suffered sev-eral devaluations between 1992 and 1994, creating upward inflationary pressure, while the public finances were weakened by the 1993 recession, which also led to extremely high unemployment. Nor could it be claimed that the support from the international sphere was unanimous. Spain was viewed as a relatively large country within the European Union, with a recurrent tendency for imbalances to appear, thus inviting close scrutiny of its candidacy as a future member of the Union to create a common currency.
But the opportunity was seized. Various measures were adopted in a range of areas to iron out the macroeconomic imbalances. The Banco de España, with its independence enshrined in law in 1994, was made responsible for defining and executing monetary policy independently. Its basic mission was price stability, and it embarked on a strategy of inflation targets which managed to bring eco-nomic agents’ expectations towards more moderate price increases, which was a necessary part of meeting the convergence criteria.
There was also a considerable budgetary consolidation drive, and changes to how certain markets for goods and the services sector operated. There was like-wise labour market reform, together with stimulus for privatisation, which brought the Spanish economy’s structural behaviour up to higher standards of flexibility and liberalisation. The growing social support for integration also helped achieve the goals that had been set.
I believe the effort was worthwhile. As an example of a country with a fairly weak tradition of macroeconomic discipline, we have managed to show that, far from the fears that pursuing stability-oriented polices would put a brake on eco-nomic growth, their application has yielded healthy dividends in terms of output, jobs and welfare.
No doubt, over the course of today’s session many of the speakers will ana-lyse the achievements EMU has made possible in countries like Spain, as well as the outstanding challenges. I would like to conclude by saying a few words on this latter point. It is certainly the case that belonging to EMU has helped solve certain problems and prevented others from arising. It is no coincidence that many of the countries in the EU today that are not yet members of the euro would have preferred to confront the challenges of the current financial crisis from within the single currency. However, EMU is not a panacea and does not automatically facilitate the design of economic policy. To obtain its full benefits it is necessary to make an effort in certain areas. The agents con-cerned have gradually adapted to the new framework of stability brought about by the euro since 1999, although they need to adopt patterns of behaviour more consistent with a low-inflation environment, something which calls for changes both in markets and in the institutional arrangements. We should not forget that the context of the single currency calls for more ambitious execu-

30 Spain and the euro. The fi rst ten years
tion of fiscal policy and supply-side policies, as these are the only tools avail-able to national authorities.
An ambitious commitment to economic policy made it possible for Spain to join EMU in 1999. Today, once again, a similar commitment is essential – and perhaps more clearly so, given the unfavourable circumstances in which we find ourselves – in order to limit the costs of the current recession, quickly to resume to positive growth and be able to entrench sustainable growth rates over the me-dium to long term.

Joaquín Almunia
European Commissioner for Economic and Monetary Affairs
EMU at 10: coming of age in a global crisis
It gives me great pleasure to join you this morning to celebrate ten years of Spain in the Economic and Monetary Union.The euro turned ten years old in January against the most difficult economic
backdrop since its birth. The economic and financial storms that are currently bat-tering economies across the world not only represent the worst financial condi-tions and the first recession in EMU’s short history, they are the surely the most severe that any of us here this morning have seen in our lifetime.
With our economies under unprecedented strain, this anniversary year will prove a stress test for the euro and EMU. However, should anyone doubt the resilience of our Economic and Monetary Union, it suffices to look back on its record over the last decade to see that EMU is well equipped to weather this crisis.
1 The first ten years: a positive assessment
The euro has emerged from its first decade an undisputed success. Economic and Monetary Union has underpinned prosperity in the euro area, it has driven the economic integration of its members and, in just ten years, the euro has be-come the world’s second currency, rivalling the dollar as a medium for interna-tional trade and finance.
The central achievement of EMU was its anchoring of macroeconomic stability in the euro area. True, we did not experience turmoil on the scale of the current crisis; but external conditions during the euro’s first decade have been anything but smooth. The last few years have been marked by high volatility in the global economy, triggered by the bursting of the dot com bubble, the attacks of 9/11 and sharp rises in oil prices. Indeed, we experienced an oil price shock comparable to anything we had seen in the 1970s.

32 Spain and the euro. The fi rst ten years
Throughout this period, euro area countries have been shielded from the kind of internal currency strains that were a regular feature of past crises. Apart from last summer’s increases caused by the hikes in food and energy prices, the euro area has enjoyed a decade of low and stable inflation which in turn has fostered histori-cally low interest rates.
Let me take this opportunity to commend the solid record of the European Central Bank, which can take a large part of the credit for anchoring inflation expectations in the euro area. The ECB’s proficient conduct of monetary policy quickly conferred credibility and confidence on the euro at an early stage.
Stability is also due to EMU’s macroeconomic framework, including the fiscal rules of the Stability and Growth Pact which, since its reform in 2005, have helped secure a renewed commitment to healthy public finances. Government deficits were reduced to a record 25 year low in 2007, putting Member States in a solid position to confront the current downturn. The Stability and Growth Pact will also prove crucial to safeguard public finances in the aftermath of the crisis, but I will return to this issue in a moment.
EMU has driven closer economic integration and furthered the completion of the single market. It has raised the level of intra-EU trade and FDI, created more efficient markets and greater opportunities for businesses. The euro has had a par-ticularly striking impact on European financial markets, fostering the rapid inte-gration of interbank money markets, bond and equity markets.
It was expected that overall GDP growth and productivity performance would be supported by the adoption of the euro. These expectations have not been fully borne out, although the growth performance of the euro area is not as disappoint-ing as some would claim. Averaging around 2% over the last decade, growth has been similar to that of the previous 10 years and GDP per capita has equalled that of the United States.
However, it is true that progress towards structural reforms has not advanced at a sufficient pace and this has prevented the euro area from fully benefiting from the productivity transfers that new technology could bring. More rigorous reforms of labour, product and service markets could also have prevented the divergenc-es in growth and inflation that have been a persistent problem among euro area members, caused by slow adjustment to economic shocks and changes in competi-tiveness.
On the other hand, EMU has seen an impressive rate of job creation over the last 10 years: 16 million new jobs were created in the euro area during the euro’s first decade, twice that of the previous decade and more than the United States.
In sum, EMU has surpassed nearly all the expectations that accompanied its launch. For those that predicted break up and disaster for the euro area, their ar-guments have been discredited. The EMU has brought multiple economic benefits for its members, and no more so than for Spain.
EMU at 10: coming of age in a global crisis 33Joaquín Alm
unia
Notwithstanding the current challenges, this country has flourished over the last 10 years in EMU’s environment of stability and economic integration. Thanks to its efforts to meet the Maastricht Criteria for euro adoption, as well as intense international integration and liberalisation of the domestic financial sec-tor, inflation and interest rates were brought down dramatically ahead of entry in EMU and have been kept low for the last decade. Nominal interest rates, for example, fell from 15% in 1990 to 3% in 1999.
Spain has enjoyed a spectacular growth rate, outpacing the EU and rapidly converging with the rest of the euro area economies. Spanish GDP per capita jumped fom 84% of the euro area average in 1999 to 95% in 2007. We have seen an outstanding rate of job creation – 5 million to be precise since 1999 – that’s one third of the the euro area total. Spain has also, in line with the Stability and Growth Pact, applied a sound management of its public finances. Thanks to rigorous fiscal consolidation, government debt was dramatically reduced and Spain was able to post a surplus of 2.2% of GDP in 2007.
Our backwards assessment for EMU and the Spanish experience with the euro is therefore very positive.
2 EMU and the global financial crisis
Today, in the midst of the most severe financial and economic crisis since the Second World War, EMU continues to provide a stabilising anchor for its members. Without the single currency, we would be experiencing highly vola-tile exchange rates that would impact trade and investment and generate politi-cal tensions in the process. EMU is shielding those smaller and more vulner-able economies that would have seen speculative attacks on their currencies by markets. Many euro area countries, Spain included, are already witnessing ris-ing spreads on their sovereign debts. Without the credibility and stability that EMU brings, these spreads would be even higher and countries would be pay-ing an even greater cost to finance their debt.
So despite the doom-mongering of certain commentators in the press, the chan- ces of a member leaving the euro area is zero. In fact, the reality is just the oppo-site: interest in joining the euro area has distinctly increased.
Nevertheless, the financial crisis that swept in from the Atlantic has ushered in a testing time for EMU, and brought with it a new set of challenges for the euro area economies.
The first of these challenges is to contain the immediate crisis and imple-ment policies for recovery. This we are doing with an ambitious and coordinated European recovery plan which combines immediate support to the banking sector with a monetary and fiscal stimulus.

34 Spain and the euro. The fi rst ten years
The decision to launch a coordinated budgetary stimulus for the economy was not taken lightly. But faced with a collapse in investment and consumption and with little room left for monetary easing, it became clear that a massive budgetary stimulus would be the only effective means of re-starting demand.
This is the first time in EMU’s history that expansionary fiscal policies have been deemed necessary. However, let me be clear that the stimulus must be dif-ferentiated according to the fiscal room for manoeuvre available to each country. And it must be timely, targeted and temporary – both to maximise its impact and to avoid lasting damage to public finances.
The Stability and Growth Pact is a major asset when it comes to striking a balance between short term action to fight the recession, and medium to long term strategies to safeguard government budgets. Over the last weeks The Com-mission has been assessing the Stability and Convergence Programmes – in which Member States detail their budgetary plans for the next 5 years – and next month we will adopt recommendations and deadlines for the correction of excessive deficits.
In doing so we will draw on the full flexibility that was introduced in the Pact when it was reformed in 2005. This means that we will take into account the eco-nomic situation, the impact of fiscal stimulus measures and the strategies devised by Member States to reverse any build up of deficits and debts one growth returns. It should be clear then that the Pact is not about sanctions. It is about guiding an exit strategy from the crisis and anchoring the credibility and sustainability of the EU’s public finances.
Provided we see a swift and continued implementation of the recovery plan, the bold financial, monetary and fiscal actions should begin to curb the fall in activity and put a floor under the downturn this year. As a result, we should see a gradual recovery for the European economy at the end of 2009.
3 Priorities for a challenging second decade
However, an economic recovery will not necessarily imply a return to ‘business as usual’. The global downturn will have serious repercussions for our economies, for our financial models and for the very fabric of our societies.
In addition, the financial turmoil has coincided with energy crises and food price rises that are symptomatic of broader global trends such as climate change and a growing scarcity of the world’s natural resources: challenges that will imply economic costs of their own.
The euro is clearly coming of age in a new and altogether more challenging era. How then can we safeguard and build on EMU’s achievements at a time when the world’s economic and financial landscape is changing so dramatically?

EMU at 10: coming of age in a global crisis 35Joaquín Alm
unia
The answer involves improving both the internal functioning of the euro area economy and strengthening EMU’s international role.
On the internal side, we need to begin by deepening fiscal surveillance. This is now particularly urgent given that the crisis is taking its toll on governments’ deficits and debts. Credible medium term budgetary frameworks, a closer atten-tion to improving the quality of public finances and surveillance better geared to ensuring budgetary sustainability over the long term will be crucial not only to anchor expectations of an orderly resolution of the crisis, but to prepare for long-term challenges related to ageing and climate change.
We also need to broaden economic surveillance in EMU beyond fiscal po-licy. Current and future challenges will make stronger demands on EMU’s ad-justment mechanism – the channels through which euro area countries adjust to economic shocks in the absence of an exchange rate tool. We already know that this mechanism has not worked perfectly over the last decade, hence the build up of macroeconomic imbalances within the euro area, growth and inflation diver-gences and the cumulated loss in competitiveness suffered by some members.
Here, Spain is a case in point. The growth of the Spanish economy has been overly reliant on a booming construction sector and domestic demand. This has allowed Spain to continue expanding despite seeing a steady decline in its exter-nal competitiveness. The growth of prices and unit wage costs has outpaced those of the euro area, ultimately resulting in a sizeable current account deficit. With the onset of the financial crisis, such imbalances are becoming more acute and countries are having to undergo painful processes of adjustment.
The crucial lesson here is that some euro area members were able to accrue current account imbalances despite maintaining sound public finances. Therfore, although EMU’s framework has successfully delivered stability and fiscal disci-pline, it has not fully defused the risks stemming from the macroeconomic side.
This is why the European Commission is now working on extending the focus of surveillance beyond fiscal policy, to identify risks stemming from macroeco-nomic imbalances or changes in competitiveness and to address them before they become entrenched.
A rigorous implementation of structural reforms will also go a long way to enhance adjustment in the euro area and increase competitiveness. Reforms take on an added urgency in light of the current crisis. A programme of targeted structural measures would underpin a quick and sound recovery in the euro area. They would prime members to grasp the growth opportunities that will emerge in the aftermath of the crisis and boost the overall resilience of EMU against fu-ture shocks.
In particular, we need to exploit the potential of the energy and environmen-tal sector as a means to advance Europe’s competitiveness as well as fight climate change. We need good-quality education at every level, more expenditure on

36 Spain and the euro. The fi rst ten years
R&D, improvement of the regulatory environment of SMEs, and greater flexibility in the way the markets for goods, services and labour operate. Labour market re-forms should be carefully designed given the recession and its likely fall out for employment. Measures should aim both to enhance euro area adjustment while alleviating social costs.
Finally, on the external side, we need to develop a comprehensive international strategy for the euro and the euro area economy.
Up to now, the euro area has punched below its weight in the international arena. And yet our economic size and international currency mean we have a strong stake in the global policy making process. Never has this been more relevant than today.
The unfolding of the financial crisis has shown us just how vulnerable we are to events originating in other parts of the world. And it has shown us the impor-tance of international partnerships for overcoming international challenges: only through global cooperation will we speed the recovery of the world economy and prevent a disaster of this magnitude from ever happening again.
In this respect, I am encouraged that the EU has taken a leading role in build-ing a global consensus overhauling the international regulatory and supervisory system for financial markets. The action plan launched at the G20 Summit in Washington last November strongly reflects Europe’s own priorities and progress in reforming its financial sector.
With the follow up summit in London on the 2nd April fast approaching, the EU needs to ensure that it can continue to be an influential partner in this process. We need to maintain a strong and coherent voice on the key issues that will form the focus of April’s meeting.
For example, we need to push for ambitious reforms to the multi-lateral gover-nance of the global economy and financial system, with a central role for the IMF. In the past, the IMF has been very effective at providing expertise in macroeco-nomic matters such as global imbalances and exchange rates. It now needs to team this with a deeper analysis of financial developments and financial sector surveil-lance.
We need to send a clear message on protectionism. The trade restrictions we have seen building up in the global economy will only dampen demand and in-hibit the international fiscal stimulus efforts. Of course, here our own actions will speak louder than words and the EU must lead by example in keeping its own markets open to trade and investment.
These are among the immediate, pressing issues on our agenda. But they reflect a broader shift in global policy making – perhaps accelerated by the crisis but long overdue – towards a new, and more inclusive multilateralism. If the euro area is to take its rightful place in this process, we will need to develop in a more systematic way, common positions and common policies on the key questions in international finance and economics.

EMU at 10: coming of age in a global crisis 37Joaquín Alm
unia
4 Conclusion
At ten years old, the single currency is a success. It has delivered a decade of stability and employment to the euro area and today it is steering its members through the greatest economic and financial crises we have seen in our lifetimes. The euro is an emblem of European unity, and as such, it demonstrates just what can be achieved through the power of European cooperation and partnership.
We will need to draw on these values during the current difficult period and in the years to come. The challenges that lie ahead for the euro and for the Eu-ropean economy will be extremely demanding. But by coordinating action at the European level, I believe we have a unique advantage to adapt and prepare our economies and societies for a new era.


EMU: achievements and challenges ahead


Charles Wyplosz
The Graduate Institute, Geneva, and CEPR
Ten years of EMU: successes and puzzles
1 Introduction1
When the euro was launched in January 1999, most European economists who had spent much time studying the project had no doubt that it would
work (Wyplosz, 1997) but they were concerned about possible dogmatism at the helm (Begg et al., 1998), asymmetric transmission of monetary policy (Dornbusch et al. 1997), the Stability Pact (Eichengreen and Wyplosz, 1997), membership (Gros and Thygesen, 1997) and some missing elements, such as proper accounta-bility and an Euro-wide regulatory and supervisory framework (Begg et al., 1998). Meanwhile, most non-European economists regarded the monetary union as in-feasible or doomed to failure. Five years down the road, the euro was declared an astounding success (European Commission, 2004; Wyplosz, 2006).
Ten years later, the old themes are all back. After nine easy years, marked by what has come to be called the Great Moderation, the Euro area brutally hit the highly troubled waters of the Great Crisis. As a result old concerns, voiced at the start and then studiously ignored, resurface. In addition, questions that could not be answered gradually become clearer. For instance, the record of the first ten years makes it abundantly clear that “one size does not fit all”. Persistent inflation dif-ferentials and a growing divergence of current account balances indicate that the Euro area is not immune to asymmetries, the Achilles’ heal of a monetary union long identified by the Optimum Currency Area literature.
The present paper briefly surveys the successes of the nine first years. It then offers an early assessment of the tenth year, mainly attracting attention that, while
1 The citations that follow are not meant to be representative of a vast literature. They are self-serving sim-ply because it is always easier to dig out one’s own works and because, with the passage of time, memories tend to fade away. I apologize to the many researchers whose inspiring and far-sighted works are not mentioned.

42 Spain and the euro. The fi rst ten years
the crisis could not be anticipated, it was only a matter of time until institutional weaknesses would surface. The main part of the paper is devoted to the area’s asymmetries and to the question of whether the observed evolution could be-come lethal. The last section concludes with cautious optimism. This distribution of space may seem unfair. Why focus on just one year, the worst of all largely because of worldwide developments? Why dwell on difficulties and de-empha-size the successes? Yes, it is unfair and the intention is not to belittle the unique achievement of the single currency. But, in economics as in novels, trouble is much more interesting to examine than plain happiness.
2 Nine out of ten
During its first nine years of existence, the Eurosystem has delivered the es-sential, price stability. Expected inflation has mostly remained anchored at the 2% mark, bringing low interest rates. The common currency has also delivered the expected benefits of more trade integration, largely by expanding the range of traded goods (Baldwin and Di Nino, 2006), which suggests more competition and therefore more effectiveness and welfare gains. Financial integration has progressed in some market segments, although national regulation is prevent-ing other market segments from benefitting of the common currency. This list of achievements is impressive enough to declare the single currency a stunning success.
An important macroeconomic issue is how much credit for low inflation and, more generally, for macroeconomic stability should be attributed to the euro and to monetary policy. After all, the Great Moderation is a worldwide phenomenon. The raw data, as in Chart 2.1.1, suggest that the euro area per-formance is simply in line with what other developed countries have achieved. It is not better but not worse for both inflation and economic growth. One possible interpretation is that the Eurosystem, along with many other central banks, has adopted a monetary policy of superior quality than had been the case before. Gerlach et al. (2009) indeed suggest that monetary policy has im-proved greatly over the last ten to twenty years, including in Europe. Some supporting formal evidence is provided by Giannone et al. (2008), but it is dis-puted by Gali and Gambetti (2009). This could be seen as an achievement for a new, untested and supranational institution. Alternatively, this could be seen as the minimum that was to be expected in view of the expectations that this unique experiment has created.
In the end, whether the satisfactory performance of the first nine years is due to good luck, good policies or both, the euro area has operated better than most observers had predicted. In particular, the Eurosystem has shown considerable

Ten years of EMU: successes and puzzles 43Charles W
yplosz
flexibility, deflating fears that its policy framework would lead to harmful restric-tive actions designed to achieve a reputation as a determined inflation-fighter. Much like the Bundesbank, whose reputation it sought to inherit and success-fully did, the Eurosystem has talked rigidly and acted flexibly. Of course, this disconnect has been criticized. For instance, Geraats et al. (2008) provide sugges-tive evidence that it may have reduced policy effectiveness. Yet, this debate, while important, is of second order of importance.
3 Painful number ten
Made in America, the Great Crisis that started in 2007 has presented the euro area with its first real challenge. Much to its credit, the Eurosystem lost no time when the crisis erupted. It promptly provided liquidity to the interbank market and, over the months, it has displayed an ability to adapt its mode of operation. Here again, the Eurosystem has not been alone among central banks in taking forceful action in attempts to stabilize the financial markets. In fact, the coopera-tion of the major central banks has been impressive and has probably helped each one individually to take unprecedented steps. The unorthodox increase in the size of central bank balance sheets, in particular, testifies to the willingness of central bankers of taking serious risks.
The crisis has delivered the biggest prize that the single currency was intended to provide: the complete elimination of currency crises. The sharp rise in bond
-5
0
5
10
15
20
25
30
1970 1972 1974 1976 1978 1980 1982 1984 1986 1988 1990 1992 1994 1996 1998 2000 2002 2004 2006 2008
UNITED STATESUNITED KINGDOMEURO AREA CHANGING COMPOSITIONSWEDENOECD AVE TOTAL
SOURCES: OECD, Eurostat and ECB calculations.
INFLATION RATES 1970-2008CHART 2.1.1

44 Spain and the euro. The fi rst ten years
spreads has clearly shown that markets discriminate among countries. The size of these spreads also suggests that markets are overreacting. Discussions about the possibility that some countries may leave the euro area are clearly misguided and reflect more the panic mood than reasoned analysis. This shows that bandwag-ons can be dangerous. Undoubtedly, absent the monetary union, some currencies would have been under intense speculative pressure and some would have had to be depreciated, probably very deeply.
Like other central banks, the Eurosystem was unable to head off a sharp surge in inflation in the wake of rising oil prices. Then, inflation slowed down very fast as oil prices declined and the recession added downward pressure. These rapid shifts in inflation rates have generally not been predicted, neither by central banks, nor by other forecasters, displaying serious gaps in the empiri-cal tools currently available. More importantly, the crisis has revealed a number of cracks in the organization of the euro area, all of which had been previously identified. Among them, the absence of euro area-wide regulation and supervi-sion, the Stability and Growth Pact and the treatment of outsiders deserve at-tention.
3.1 Regulation and supervision
Begg et al. (1998) wrote: “If several European banks are simultaneously hit by a default anywhere in the world, a very plausible occurrence, who is responsible for coordinating the orderly workout? [...] Financial system regulation and super-vision needs to be more clearly centralized within Europe and needs to be more clearly coordinated with the ECB headquarters in Frankfurt. To assure the appro-priate speed of response in the event of a crisis, the ECB needs to be prepared to act as temporary lender of last resort.”
An explicit response to this warning was offered by Padoa-Schioppa (1999): “My response to this criticism is threefold. To my mind, the criticism reflects a notion of lender-of-last-resort operations that is largely outdated; it underesti-mates the Eurosystem’s capacity to act; and, finally, it represents too mechanistic a view of how a crisis is, and should be, managed in practice. [...] Nowadays and in our industrial economies, runs may occur mainly in textbooks. The probability that a modern bank is solvent, but illiquid, and at the same time lacks sufficient collateral to obtain regular central bank funding, is, in my view, quite small.”
With the exception of Fortis, no major European bank with significant cross-border operations has been hit so far. But the difficulties faced by the Fortis rescue and the acrimonious debate among governments about deposit insurance have illustrated that the decentralized system of bank regulation and supervision is inadequate in crisis time. Of course, one can consider that the fact that no major euro area bank with significant cross-border operations has

Ten years of EMU: successes and puzzles 45Charles W
yplosz
faced acute difficulties is an indication that the system works well. This is un-convincing. Several banks within the euro area have failed, a clear indication that the euro area is not immune from bank failures. Luckily, the failed banks were predominantly local, so the policy response could be circumscribe to the home country authorities.
The dangers of existing arrangements have now been recognized.2 For exam-ple, Papademos (2009) states: “Given the increasing financial integration in Eu-rope, and especially within the euro area, and notably the growing number and systemic relevance of cross-border banking groups, central banks in general, and the ECB and the Eurosystem in particular, are well placed to assume the tasks of macro-prudential supervision.” However, there seems to be limited support for this option, suggesting that little has changed since Begg et al. (1998) wrote: “It is ironic that while the international financial community is arguing for a ‘world-wide financial regulator’, national jealousies appear to prevent the ESCB from centralizing such responsibilities at the EU level.”
3.2 Stability and Growth Pact
Debates about the Stability and Growth Pact are as old as the pact itself, see e.g. Eichengreen and Wyplosz (1997). Following the first downturn of the euro short history, the pact was already suspended once in 2003, slightly modified and reinstated in 2005. Criticism has long focused on two main aspects. First, it may be procyclical in the downside of the cycle. The list of circumstances when the deficit limit would not bind was initially too restrictive. The extensions admit-ted in the 2005 update are relatively imprecise, with the result that it is unclear whether the pact remains strict or whether its new flexibility amounts to an effec-tive dismantling. The 2009 recession means that most, if not all, countries will be able to claim exceptional circumstances so that the pact will be effectively sus-pended.
The second criticism is that the pact is distracting policymakers away from other collective aims. In a generalized crisis situation, in contrast to normal times when it matters little or not at all, fiscal policy coordination becomes paramount. Given tight trade integration, the benefits of expansionary policies partly, in some case largely, accrue to trade partners. This creates an externality with the likely ef-fect that too little action is undertaken.
Taken together, these two drawbacks of the Stability and Growth Pact were always expected to represent a major danger. Indeed, Begg et al. (1998) observed
2 See also Padoa-Schioppa (2008): “The French supervisor oversees French subsidiaries, the German supervisor oversees German subsidiaries and no-one has the full picture of the major EU-wide banking groups. This supervision is neither ‘super’ nor ‘vision’”.

46 Spain and the euro. The fi rst ten years
that “a banking and financial crisis will require additional government borrow-ing to support healthy companies and banks affected by a severe credit crunch, a quick separation of fundamentally healthy parts of the financial system from fun-damentally bankrupt parts, a deep pocket approach to take over troubled parts, and a flooding of the healthy parts with liquidity, to be siphoned off when times become better again. [...] It is easy to imagine how the decentralized nature of fis-cal policies may lead to a co-ordination failure.”
The tensions that have surfaced among a number of euro area governments indicate that these fears were fully justified. The main surprise is that, although the pact is suspended due to the gravity of the economic situation, most gov-ernments are extremely reluctant to undertake sizeable fiscal policy expansions at a time when monetary policy’s effectiveness is undermined by the sorry state of many banks and by the extreme prudence of all banks. Obviously, governments are worried that opening large deficits will make it difficult to close them once the crisis has abated. In a way, a condition for fiscal policy to be effective is that reassurances be given that the deficits are strictly temporary. If effective, this is precisely what the Stability and Growth Pact should provide. That it does not seem to be the case is particularly worrisome, especially if it leads governments to underprovide stabilization policies.
3.3 Keeping the outsiders outside
The decision to apply the Maastricht entry criteria to the new member states has been another contentious subject. It is deeply rooted in earlier debates, as reviewed e.g. in Wyplosz (2006), but it is further made complicated by the fact that some countries have rigidly tied their exchange rates to the euro for an ex-tended period of time. As they operate a currency board, Estonia and Latvia have effectively given up the control of their monetary policies and of their inflation rates. Imposing conditions on their interest and inflation rates, therefore, is hard to justify and yet these are the conditions that have kept these two countries out-side the euro area for many years.
Along with full capital mobility and the Single Act ban on market entry restric-tions, the rigidly fixed exchange rate arrangements of these countries have encour-aged their citizens to borrow in euros. Predictably in a massive financial turmoil, the resulting currency mismatch has led to speculative pressure, forcing Latvia to apply to the IMF for emergency support and putting Estonia in a difficult posi-tion. Even though their currencies are not pegged, currency mismatch is prevalent in many other EU countries. Like Estonia, Hungary has asked for IMF support.
Beyond legal principles, a key reason why there has been no willingness to consider alternative admission criteria has been the perception among the in-cumbents that they bear no risk by keeping the Outsiders out of the euro area.

Ten years of EMU: successes and puzzles 47Charles W
yplosz
In effects the risks are seen as one-sided, but this may turn out not to be the case. Acute financial instability within the EU is clearly undesirable, if only be-cause banks from the incumbent countries have very large exposures in the new member countries. This has led the ECB to set up swap arrangements with some countries under pressure. One channel through which financial stability operates is through the exchange rate. Indeed, Chart 3.3.1 shows that some exchange rates have depreciated by 10% to 30%. Such movements are bound to have substan-tial effects on the relative competitiveness of countries within the Single Market. Indeed, a key motivation for setting up the EMS and, later on, for adopting the common currency was precisely the avoidance of large exchange rate fluctuation. As long as the countries with depreciating currencies are small, the pressure on euro area countries is limited but the situation may change rapidly.
3.4 The Eurosystem behind the curve?
Almost from the start, it has been observed that the Eurosystem moves more slowly and by smaller steps than the Fed. The evidence is overwhelming as Chart 3.4.1 shows. Yet, the comparison is nearly meaningless for a simple rea-son: the situation faced by the ECB is usually different from that faced by the Fed. Indeed, Chart 3.4.2 shows that the Euro area cycles have tended to follow those in the US. This justifies the impression of delayed action by the ECB, at least unless contagion from the US to Europe would be systematic, in which case the ECB could have pre-empted the cyclical fluctuations. While there is a
80
90
100
110
120
130
02-01-08 02-04-08 02-07-08 02-10-08 02-01-09
CZK GBP HUF PLN SEK
SOURCE: ECB.
EURO EXCHANGE RATES OF SOME OUTSIDERS(INDEX: 2.1.2008=100)
CHART 3.3.1
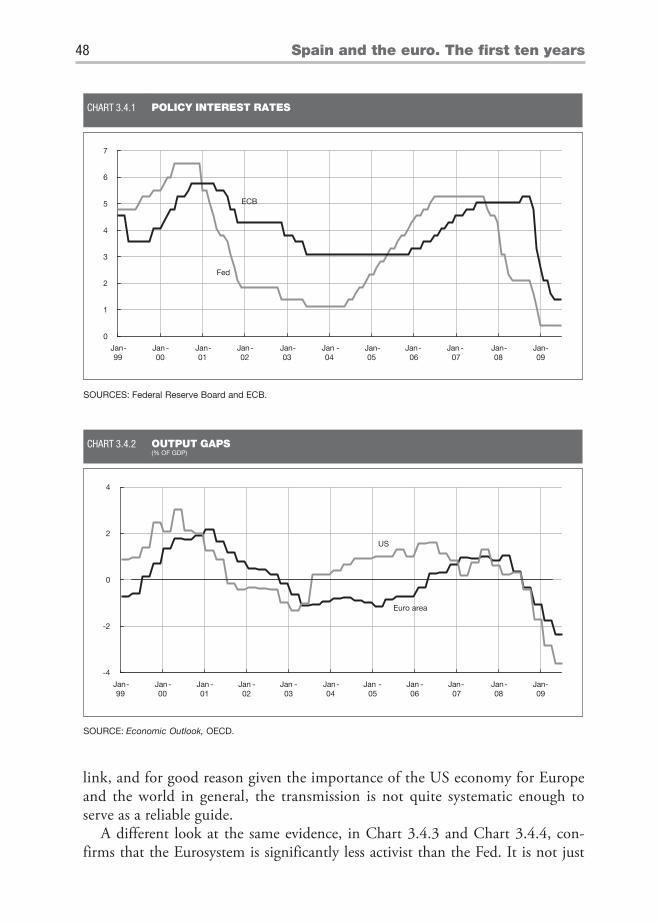
48 Spain and the euro. The fi rst ten years
link, and for good reason given the importance of the US economy for Europe and the world in general, the transmission is not quite systematic enough to serve as a reliable guide.
A different look at the same evidence, in Chart 3.4.3 and Chart 3.4.4, con-firms that the Eurosystem is significantly less activist than the Fed. It is not just
-4
-2
0
2
4
Jan Jan Jan Jan Jan Jan Jan Jan Jan Jan Jan-99
-00
-01
-02
-03
-04
-05
-06
-07
-08
-09
SOURCE: Economic Outlook, OECD.
OUTPUT GAPS(% OF GDP)
CHART 3.4.2
US
Euro area
0
1
2
3
4
5
6
7
Jan Jan Jan Jan-99
-00
-01
-02
-03
-04
-05
-06
-07
-08 09
SOURCES: Federal Reserve Board and ECB.
POLICY INTEREST RATESCHART 3.4.1
ECB
Fed
Jan Jan Jan Jan Jan Jan Jan-
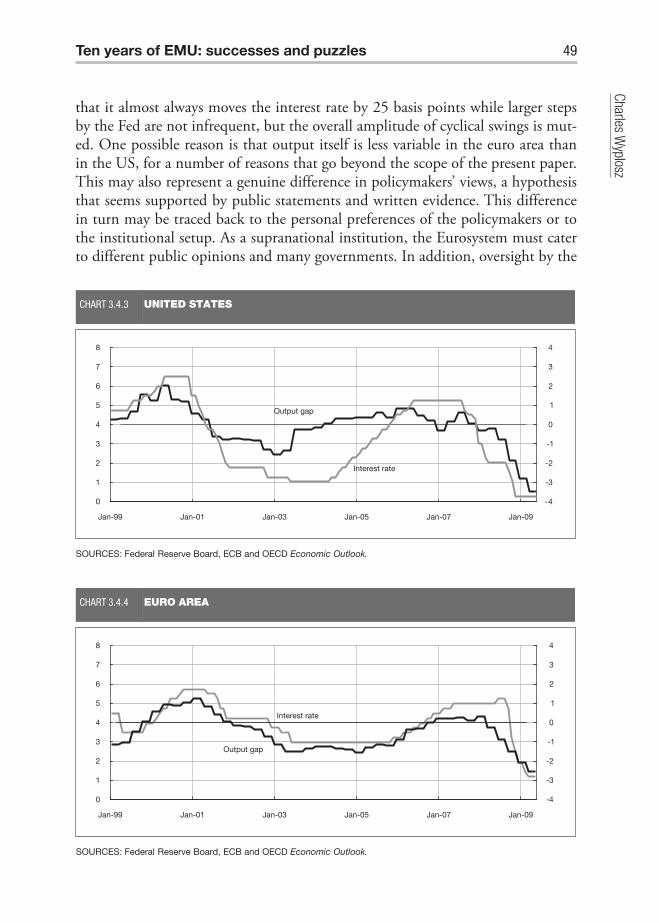
Ten years of EMU: successes and puzzles 49Charles W
yplosz
that it almost always moves the interest rate by 25 basis points while larger steps by the Fed are not infrequent, but the overall amplitude of cyclical swings is mut-ed. One possible reason is that output itself is less variable in the euro area than in the US, for a number of reasons that go beyond the scope of the present paper. This may also represent a genuine difference in policymakers’ views, a hypothesis that seems supported by public statements and written evidence. This difference in turn may be traced back to the personal preferences of the policymakers or to the institutional setup. As a supranational institution, the Eurosystem must cater to different public opinions and many governments. In addition, oversight by the
-4
-3
-2
-1
0
1
2
3
4
0
1
2
3
4
5
6
7
8
Jan-99 Jan-01 Jan-03 Jan-05 Jan-07 Jan-09
SOURCES: Federal Reserve Board, ECB and OECD Economic Outlook.
UNITED STATESCHART 3.4.3
Output gap
Interest rate
-4
-3
-2
-1
0
1
2
3
4
0
1
2
3
4
5
6
7
8
Jan-99 Jan-01 Jan-03 Jan-05 Jan-07 Jan-09
SOURCES: Federal Reserve Board, ECB and OECD Economic Outlook.
EURO AREACHART 3.4.4
Output gap
Interest rate

50 Spain and the euro. The fi rst ten years
US Congress is arguably more demanding than the loose “dialogue” between the European Parliament and the ECB.
These two charts also belie the view that the Eurosystem is slow to react. The visual impression, which should be formally studied, is that the euro area interest rate is closely synchronized with the output gap while in the US the interest rate keeps moving in the same direction for several months after the output gap has reached its peak or trough.
4 Ten-year old puzzles
A common theme of the previous sections is that most of the good and bad news of the first decade had been anticipated.
4.1 Three puzzles
An unexpected feature of the first ten years is that some national current ac-count imbalances have become large, in both directions, while the euro area as a whole has remained nearly balanced as Chart 4.1.1 shows. For a long time, the markets imposed limits on external borrowing, a phenomenon called the Feldstein-Horioka paradox. There is mounting evidence (Blanchard and Gia-vazzi, Lane and Milesi-Feretti 2004, Caballero et al., 2008), that the paradox is vanishing as financial globalization makes it possible to borrow and lend in-
-20
-15
-10
-5
0
5
10
15
1999 2000 2001 2002 2003 2004 2005 2006 2007 2008
GERMANY GREECE SPAIN LUXEMBOURG EURO AREA PORTUGAL
SOURCE: Economic Outlook, OECD.
CURRENT ACCOUNT BALANCES(PERCENT OF GPD)
CHART 4.1.1

Ten years of EMU: successes and puzzles 51Charles W
yplosz
ternationally on a large scale. Markets are larger and have been more willing to take risks, until 2007 at least. The risks are the possibility of debt default and, when the debt is in the borrower’s currency, the exchange risk.
Within the euro area there is no currency risk, which would predict that the new phenomenon should be even more pronounced than elsewhere. The fact that the euro area’s current account has remained approximately balanced indicates that some countries lend to others, quite possibly indirectly. We could expect that differences in cyclical situations temporarily lead some countries to borrow and others to lend, with the list of borrowers and lenders varying over time. The striking feature of Chart 4.1.1 is that it is always the same countries that borrow and the same that lend. Even more striking is the impression that the imbalances grow in size since the launch of the euro. Does this challenge the “one size fits all” requirement for monetary policy? Worse, could we face growing, and ultimately unstable disequilibria?
The second puzzle concerns the national inflation rates. It was widely believed that the common monetary policy would deliver similar, if not identical inflation rates. Chart 4.1.2 suggests that this is not what happened. Not only have infla-tion rates differed quite markedly but, as with the current imbalances, the same countries have tended to exhibit the lowest rates while others typically underwent the fastest price increases. This feature has been spotted quite early on (Honohan and Lane, 2003; Angeloni and Ehrmann, 2004).
The third puzzle is shown in Chart 4.1.3. Growth rates have differed from country to country and, again, there is substantial persistence in the relative po-
0
1
2
3
4
5
1999 2000 2001 2002 2003 2004 2005 2006 2007
GERMANY GREECE SPAIN ITALY PORTUGAL
SOURCE: AMECO, European Commission.
INFLATION RATESCHART 4.1.2

52 Spain and the euro. The fi rst ten years
sitions of member countries. There was no pretense that the monetary union would equalize growth rates, so this is not a puzzle. What is puzzling is the apparent similarity with the previous charts, as well as some noteworthy differ-ences. For example, Germany emerges as a low-inflation, low-growth rate and external surplus country. At the other end of the spectrum, Greece has enjoyed fast growth alongside relatively high inflation and large current deficits. This may look unsurprising but then Italy has high inflation and large deficits (not shown in Chart 4.1.1) along with low growth.
4.2 Plausible interpretations
A number of explanations can help explain the three puzzles. The first one is that the euro area has faced a number of asymmetric external demand shocks. Since the first nine year mostly coincided with the rapid world growth perform-ance associated with the Great Moderation, these external shocks should have taken the form of shifting preferences for goods produced by some countries.3
Evidence in favor of this interpretation would have to include significant mar-ket share losses for the countries that have undergone current account deficits. This is not what Chart 4.2.1 suggests. Market shares have generally declined but there is no evidence that this evolution has been asymmetric.
-2
0
2
4
6
8
10
1999 2000 2001 2002 2003 2004 2005 2006 2007
GERMANY IRELAND GREECE SPAIN ITALY
SOURCE: AMECO, European Commission.
GROWTH RATES (REAL GDP PER CAPITA, PERCENT)
CHART 4.1.3
3 This would include shifts in relative income levels in foreign countries that have different preferences for various European goods and services.

Ten years of EMU: successes and puzzles 53Charles W
yplosz
The second possible interpretation is that euro area member countries have undergone asymmetric domestic demand shocks that directly affect imports. Demand shocks can originate in the private or in the public sector. A priori, it is quite unlikely that such asymmetric shocks last for a decade or that they re-peatedly occur over such a long period. Fully testing for this possibility would require estimating the shocks themselves but Chart 4.2.2 provides first-pass evidence that this interpretation is indeed not plausible.
A further possibility is that the deficit countries have suffered from external competitiveness losses, which benefitted the surplus countries. This interpre-tation would imply changes in market shares, which is not what we have seen in the previous section. Alternatively, given that the euro area as a whole has been approximately balanced, it could be either that the euro has remained close enough to its equilibrium level or that overvaluation is being compen-sated by relatively slow growth in the area, an issue that used to be popular under the concept of speed limits.4 This interpretation is compatible with the combination of national imbalances and of overall balance. It interpretation receives some support from Chart 4.2.3, which plots cumulated current ac-count balances (in percent of GDP) and cumulated changes of the real ex-change rates (measured as relative unit labor costs) over the first decade of the euro. However it sits uncomfortably with the previous evidence on market shares.
60
80
100
120
140
1990 1994 1998 2002 2006
GREECE SPAIN ITALY PORTUGAL GERMANY
SOURCE: AMECO, European Commission.
MARKET SHARES (INDEX: 1990=100)
CHART 4.2.1
SHARE OF WORLD GOODS EXPORTS
4 For a recent restatement of speed limits, see Székely, István P. and Max Watson (2007).

54 Spain and the euro. The fi rst ten years
The conclusion so far is that relative competitiveness emerges as the more likely, but not compelling, reason why current accounts have diverged within the euro area.5 Competitiveness, however, is not exogenous, so we need to explain why it may have happened. It turns out that explaining this divergence accounts with a modified version of the Walters critique can account for all three puzzles listed above.
-15%
-10%
-5%
0%
5%
10%
-6% -4% -2% 0% 2% 4%
CU
MU
LA
TE
DC
UR
RE
NT
AC
CO
UN
T D
EF
ICIT
(% O
F G
D)
CUMULATED BUGET BALANCE (% OF GDP)
SOURCE: Mongelli and Wyplosz (2009).
-15%
-10%
-5%
0%
5%
10%
-50% 0% 50% 100% 150% 200%
Y= -0.0837x + 0.0282R = 02556
CU
MU
LA
TE
DC
UR
RE
NT
AC
CO
UN
T D
EF
ICIT
(% O
F G
D)
CUMULATED GPD GROWTH
DOMESTIC PRIVATE AND PUBLIC DEMANDCHART 4.2.2
ATDE
NL
BEFR
IT
PTES
GR
IE
FI
2
DEAT
NL
FR
IT
FI
IE
ESPT
GR
BE
Y= -0.7768x - 0.023
R = 0.08062
5 Other possible interpretations include the presence of a Balassa-Samuelson effect, discussed in Hofmann and Remsperger (2005), and different impacts of fluctuations of the euro exchange rate, as suggested by Honohan and Lane (2003).

Ten years of EMU: successes and puzzles 55Charles W
yplosz
4.3 The Walters critique
It has long been recognized that, a unified bond market implies that nominal interest rates are equalized, at least as long as all countries are expected to re-main in the euro area or as long as public debts are expected to be fully serviced. This observation further implies that real interest rates are lower where inflation is higher, and expected to remain so. The Walters critique holds that the common monetary policy is bound to be more expansionary in countries where inflation is higher to start with, and more contractionary in countries with initially low infla-tion rates. This opens up the possibility of growing disequilibria, with inflation rising where it started higher and declining where it started lower.
Several steps of the reasoning have been clearly borne out by the euro area ex-perience. To start with, note that the elimination of intra-euro area exchange rates implies that inflation divergences translate into changes in relative competitiveness. Chart 4.3.1 confirms that countries where inflation rates have been relatively high, and where therefore real interest rates have been relatively low, are also countries that suffered competitiveness losses, with the exact opposite effects in low-inflation coun-tries. The chart presents average real interest rates over 1999-2008 and the cumu-lated change in competitiveness, which is close to cumulated relative inflation rates.6
-20%
-10%
0%
10%
20%
-40% -30% -20% -10% 0% 10% 20% 30% 40%
Y= -0.3191x - 0.005
CU
MU
LA
TE
DC
UR
RE
NT
AC
CO
UN
T (R
AT
IO T
O G
DP
)
CUMULATED CHANGE IN REER (ULC)
SOURCE: Mongelli and Wyplosz (2009).
CURRENT ACCOUNTS AND REAL EXCHANGE RATES (1999-2008)CHART 4.2.3
R = 0.74952
AT
DE
BE
FINL
FR
ES IE
IT
PTGR
6 The effect is not entirely mechanical. Relative competitiveness is properly measured with real effective exchange rates, which compare domestic prices to prices (converted in euros) in all other trading partner countries, with weights that differ from country to country.

56 Spain and the euro. The fi rst ten years
0.00
0.25
0.50
0.75
1.00
Jul-89 Jul-92 Jul-95 Jul-98 Jul-01 Jul-04 Jul-07
EU 12 US 14
COEFFICIENT OF VARIATION
SOURCE: Mongelli and Wyplosz (2009).
INFLATION DIVERGENCE: THE EURO AND THE US COMPAREDCHART 4.3.2
The link is quite tight and as expected. Looking at relative real growth rates and competitiveness further confirms that faster growth is indeed associated with lower real interest rates.
While this part of the Walters critique is borne out by the facts – but this part is essentially mechanical – the rest is not. The critique predicts that inflation rates
0%
1%
1%
2%
2%
3%
3%
4%
-30% -20% -10% 0% 10% 20% 30% 40%
RE
AL IN
TE
RE
ST
RA
TE
S
REER ULCT
SOURCE: Mongelli and Wyplosz (2009).
REAL INTEREST RATES AND COMPETITIVENESSCHART 4.3.1
Y=-0.0296x + 0.0235
R = 0.60312
ES
DE ATFI
BEFR
NL
PT
IE
GR
IT

Ten years of EMU: successes and puzzles 57Charles W
yplosz
continuously diverge in an explosive manner, to the point where the monetary union would become unsustainable. This has not happened. If anything, infla-tion rates have converged over the last decade. As previously mentioned, national inflation rates have durably differed from the euro area average but there is decid-edly no evidence of growing divergence. For example, Chart 4.3.2 plots, month after month, the coefficient of variation of inflation rates measured in the twelve countries that made up the euro area for most of the first ten years and in 14 re-gions of the United States. The chart shows that inflation rates do not differ more within the euro area than they do within the dollar area.
However, as previously noted, inflation has been very persistent in the euro area, so that there are regularly high and regularly low inflation countries, while there is non such systemic divergence in the dollar area. This, in turn, explains the evolution of relative competitiveness and, we saw, current account imbalances. The next question is why the Walters critique has only been partly verified.
4.4 The revised Walters critique
Why did the diverging effects of monetary policy not lead to diverging in-flation rates? A logical answer, previously suggested by Angeloni and Ehrmann (2004) and Hofmann and Remsperger (2005), is provided by the current account asymmetries. With a fixed exchange rate, higher inflation means an appreciating exchange rate, which deteriorates competitiveness, as indeed happened. The re-sulting deterioration of the current account reduces demand. The expansionary
-12
-8
-4
0
4
8
12
0 2 4 6 8 10
Y=-1.9519x + 6.223
R = 0.5577
CU
RR
EN
TA
CC
OU
NT
INFLATION 1998
SOURCES: AMECO and IFS.
CURRENT ACCOUNTS AND PRE-EMU INFLATIONCHART 4.4.1
2

58 Spain and the euro. The fi rst ten years
effect of low real interest rates is thus offset by the contractionary effect of an ap-preciating real exchange rate.
The acid – yet informal – test of the revised Walters critique is whether cur-rent account balances are explained by initial inflation. This would support the view that the relative distribution of initial inflation rates linger because of the distribution of real interest rates, as suggested by Walters, which ultimately af-fects the relative current accounts trough diverging external competitiveness trends. Chart 4.4.1 provides some support for this interpretation. The fit is far from perfect, which is not surprising given the many other possible shocks that are likely to affect the current accounts. The surprise is rather that there is any visual evidence, clearly an encouragement to explore this question formally in greater detail.
5 Conclusions
The Walters critique asserted that a monetary union could well be unstable sim-ply because of divergent initial inflation rates. Does the revised version, which can account for the apparently diverging current account balances displayed in 4.1.1, still imply instability? There is no theoretically unambiguous answer. The process that runs from real interest rates to inflation is clearly destabilizing. The process that runs from real appreciation to current deficits is also destabilzing, but the link from current deficits to lower demand is clearly stabilizing. It is partly an empiri-cal issue which effect dominates.
On the other hand, unless it is justified by higher productivity gains, a con-tinuing real appreciation is impossible to sustain, but what would bring a revers-al? For the process to be stable, we need that the increasingly large current defi-cits lead to declining demand and, eventually, to enough pressure for prices (and wages) to slow down and remain below the euro area average for long enough to restore competitiveness. In that case, the original sin of joining the monetary union with inflation in excess of the average may require a long purgatory period. This may seem like a justification the Maastricht entry conditions that, among many others, I have long seen as not just useless but also counterproductive.7 It is not, for three reasons at least. First, it matters little whether disinflation oc-curs before or after joining the monetary union. Second, it may be economically (through expectations) and politically easier to disinflate when there is monetary policy is not in the hands of the domestic central bank any more. Finally, local inflationary shocks are bound to occur now and then after the adoption of the euro, which will anyway trigger the Walters process.
7 See e.g. Wyplosz (1997 and 2006).

Ten years of EMU: successes and puzzles 59Charles W
yplosz
If, however, the process is not stable, the revised Walters critique implies in-creasingly large current account imbalances. If these imbalances are privately fi-nanced, i.e. if they reflect net external borrowing by the private sector, and if the borrowing is mostly in euros, the limit is the ability and willingness of individual agents to borrow. This is remindful of the debate about “global imbalances” and the ability of US agents to borrow internationally. The similarity can be pushed further. The process involves low real interest rates, which can lead to asset prices bubbles, including in the housing sector. The similarity is not particularly reassur-ing for it implies that the correction requires a significant fall in demand, which could only be imposed by serious financial stress.
60 Spain and the euro. The fi rst ten years
References
ANGELONI, I., and M. EHRMANN (2004). Euro Area Inflation Differentials, Working Pa-per No. 388, ECB.
BALDWIN, R., and V. DI NINO (2006). Euros and Zeros: the Common Currency Effect on Trade in New Goods, CEPR Discussion Paper 5973.
BEGG, D., F. GIAVAZZI, L. SPAVENTA and CH. WYPLOSZ (1991). “The Making of Monetary Union”, in Monitoring European Integration, 2, CEPR, London.
BEGG, D., P. DE GRAUWE, F. GIAVAZZI, H. UHLIG and CH. WYPLOSZ (1998). “The ECB: Safe at Any Speed?”, Monitoring the European Central Bank,1, CEPR, London.
BLANCHARD, O., and F. GIAVAZZI (2003). “Macroeconomic Effects of Regulation and Deregulation in Goods and Labor Markets”, Quarterly Journal of Economics, 118 (3), Au-gust, pp. 879-907.
DORNBUSCH, R., C. FAVERO and F. GIAVAZZI (1997). “Immediate Challenges for the European Central Bank”, Economic Policy, 26, pp. 17-64.
EICHENGREEN, B., and CH. WYPLOSZ (1997). “The Stability Pact: Minor Nuisance, Major Diversion?”, (with B. Eichengreen), Economic Policy, 26, pp. 65-114.
EUROPEAN COMMISSION (2004). “EMU After Five Years”, European Economy, Special Report No.1.
GALÍ, J., and L. GAMBETTI (2009). “On the Sources of the Great Moderation”, American Economic Journal: Macroeconomics, 1 (1), pp. 26-57.
GERAATS, P., F. GIAVAZZI and CH. WYPLOSZ (2008). Monitoring the European Central Bank 6, CEPR, London.
GERLACH, S., A. GIOVANNINI, C. TILLE and J. VIÑALS (2009). “Are the golden years of central banking over? The Crisis and the Challenges”, Geneva Report on the World Econ-omy, 10, forthcoming.
GIANNONE, D., M. LENZA and L. Reichlin (2008). Explaining the Great Moderation: It Is Not the Shocks, ECB Working Paper No. 865.
GROS, D., and N. THYGESEN (1998). European Monetary Integration, 2nd edition, Long-man, Harlow.
HOFMANN, B., and H. REMSPERGER (2005). “Inflation Differentials Among the Euro Area Countries: Potential Causes and Consequences”, Journal of Asian Economics, 16 (3), pp. 403-419.
HONOHAN, P., and PH. LANE (2003). “Inflation Divergence”, Economic Policy, 37, pp. 357-394.
LANE, PH., and G. M. MILESI-FERRETTI (2006). “Examining Global Imbalances”, Finance and Development, 43 (1).
MONGELLI, F. P., and CH. WYPLOSZ (2009). “The Euro at Ten: Unfulfilled Threats and Unexpected Challenges”, in ECB (ed.), Fifth ECB Central Banking Conference, forth-coming.
PADOA-SCHIOPPA, T. (1999a). “EMU and banking supervision”, Lecture at the London School of Economics, Financial Markets Group, 24 February 1999, http://www.ecb.int/press/key/date/1999/html/sp990224.en.html.
— (1999b). “Interview”, Reuters, 3 October 2008, http://www.notre-europe.eu/uploads/tx_publication/TPS_intervista_a_Reuters_EN_3_oct_08.pdf .

Ten years of EMU: successes and puzzles 61Charles W
yplosz
PAPADEMOS, L. (2009). “Tackling the Financial Crisis: Policies for Stability and Recovery”, Speech at the Annual Dinner of the Society of Business Economists, 11 February 2009, London, http://www.ecb.int/press/key/date/2009/html/sp090211.en.html.
RICARDO, C., E. FARHI and P.-O. GOURINCHAS (2008). “An Equilibrium Model of Glo-bal Imbalances and Low Interest Rates”, American Economic Review, 98 (1), pp. 358-393.
SZÉKELY, I. P., and M. WATSON (2007). Growth and Economic Policy: Are There Speed Limits to Real Convergence?, Economic Papers No. 294, European Commission.
WYPLOSZ, CH. (1997). “EMU: Why and How It Might Happen”, Journal of Economic Perspectives, 11 (4), pp. 3-22.
— (2006). “European Monetary Union: the Dark Sides of a Major Success”, Economic Policy, 46, pp. 207-262.


Comments on “Ten years of EMU: successes and puzzles”
Centre for European Policy Studies
Daniel Gros
Was the EMU a success? Charles Wyplosz does not ask directly this question but his paper provides an answer to it. In facts a twofold answer. The first
nine years of the EMU were a success to the extent the Eurosystem delivered – to use Charles’ words – the essential price stability. Then the tenth year came with a crisis, an American crisis according to Charles, and the EMU delivered another essential element: the elimination of the currency risk. Yet the success was only partial. The crisis put under the spotlights the existence of destabilizing elements: internal asymmetries and institutional weakness.
The main contribution of the paper consists in investigating and explaining these asymmetries. The author suggests the fallowing stylized facts as a summary description of how EMU worked:
i) National current account imbalances have been growing in size since the launch of the euro, while the Euro Area (EA) as whole is nearly balanced.
ii) Despite the common monetary policy, initial cross-country differences in inflation, did not disappeared: same countries with lowest and highest in-flation (but there is no evidence of divergence)
iii) Cross-country differences in growth rates go hand in hand with the differ-ences in inflation and current account imbalances.
As explanation to these puzzling evidences, the paper proposes a “revisited” ver-sion of the Walters critique. In short, the initial cross-country differences, in terms of inflation, are reflected in different real interest rates, which through the expan-sionary effect on domestic demand influence inflation and therefore competitive-ness and current account. If this is the end of the story, the monetary union is doomed to be instable, as suggested by Walters. But if current account deficits lead

64 Spain and the euro. The fi rst ten years
to a decline in domestic demand, the process could become stable (with the cave-at that real exchange appreciation is not sustainable for ever). This consideration leads to a timid optimism in the conclusion.
The following comments will focus on three main aspects. In contrast with Wyplosz’ view, it will be argued that:
i) This crisis is not made in America.ii) The area’s asymmetries result from asymmetries in housing markets which
drive the key variables: domestic demand and credit growth.iii) The Walters critique is not supported by the data for the major economies.
1 Is this crisis really made in America?
The literature on financial crisis has demonstrated that almost all major cri-ses are preceded by a combination of two phenomena: an increase in leverage (or credit expansion) and an unusual increase in asset prices.1 These two alarm signals could be observed not only in the US but in Europe as well. Yet, unfortu-nately, they were largely ignored on both sides of the Atlantic.
It is instructive to look more closely at both financial instability indicators sep-arately:
a) Credit expansion. Generally low standards of risk aversion invite financial institutions to increase credit and this happened on a large scale on both sides of the Atlantic feeding excessive levels of leverage. At micro level, leverage is defined as debt-to-equity financing ratio; when this ratio increases capacity of the finan-cial firms to absorb losses lowers and hence its fragility increases. In macroeco-nomic terms, leverage is better defined as the ratio of credit to GDP. A credit ex-pansion not followed by a consistent change in the GDP (in a environment with stable price nominal and real GDP move together), implies that many agents have issued promises to pay but do not have necessarily the ‘expected’ regular cash flow (which is proportional to GDP) to honor these promises. (See Minsky (2008) for the classical description of leverage schemes leading systems towards instability). It is not possible to establish an absolute threshold level for lever-age as different financial systems can support quite different ratios of credit to GDP. However, rapid and persistent increases in this ratio constitute alarm sig-nals which have been identified as reliable predictors of financial crisis.
1 According to Borio and Lowe (2002) a low inflation environment increases the likelihood that excess demand pressures show up in form of credit growth and asset prices bubble rather than in goods price infla-tion. If this is the case, inflation-targeting central banks with a ‘myopic behavior’ could contribute to finan-cial instability. See de Grauwe (2009) and de Grauwe and Gros (2009).

Comments on “Ten years of EMU: successes and puzzles” 65Daniel Gros
This warning signal was certainly flashing in the Euro Area before 2007/8. The increase in overall leverage, measured by the debt-to-GDP ratio, was broadly similar to the one experienced in the US, only its distribution over different sec-tors was different. In facts, as shown in Table 1.1, the increase in the economy-wide leverage has been higher in the EA than in the US. Between 1999 and the end of 2007, it reached 100% of GDP for the EA and ‘only’ 80% in the US. Similarly, in both regions, the increase in the leverage of the nonfinancial corpo-rate sector has been relatively small, but larger in the EA than in the US.
The most relevant differences between the US and the EA emerge in the lev-erage of households and the financial sector. As one would expect, leverage in-creased considerably in the US household sector (40% of GDP) but very little in the EA. By contrast, the financial sector leverage is at a much higher level and increased by much more in the EA (about 70% of GDP compared to 40% in the US). Not only has the leverage of financial sector (and the economy as whole) in the EA increased by more than in the US, over time it also exhibits higher volatil-ity (see Charts 1.1 and 1.2).
This is the key underlying cause of the widespread stress in the European banking system. The conclusion is thus clear: the crisis might have started in the US, but it was not made only there: the European financial sector was very fragile and exposed to losses from US (and other) assets.
b) Asset price bubble. Another reason why the EA was as exposed as the US to this crisis is that Europe experienced the same real estate price bubble as the US. Chart 1.3 provides evidences of this by showing the evolution of the price–to-rent ratio.
a) Economy wide b) Non-Financial corporate sector
EA US EA US
1999 3.51 2.66 0.67 0.46
2007 4.54 3.47 0.92 0.49
2008 4.73 3.46 0.97 0.49
Change 1999-2007 1.03 0.81 0.25 0.03
c) Financial sector d) Households & small business
EA US EA US
1999 1.61 0.79 0.48 0.88
2007 2.32 1.17 0.61 1.28
2008 2.42 1.17 0.61 1.24
Change 1999-2007 0.71 0.38 0.13 0.40
NOTES: Economy wide includes households, non-financial Co., financial sector and government.The financial sector in the EA is defined as MFIs, insurance corporations and pension funds and other financial intermediaries including financial auxiliaries.
SOURCES: ECB Statistical data Warehouse, Euro Area Accounts & Federal Reserve Z1. March 2009.
DEBT-TO-GDP RATIOTABLE 1.1
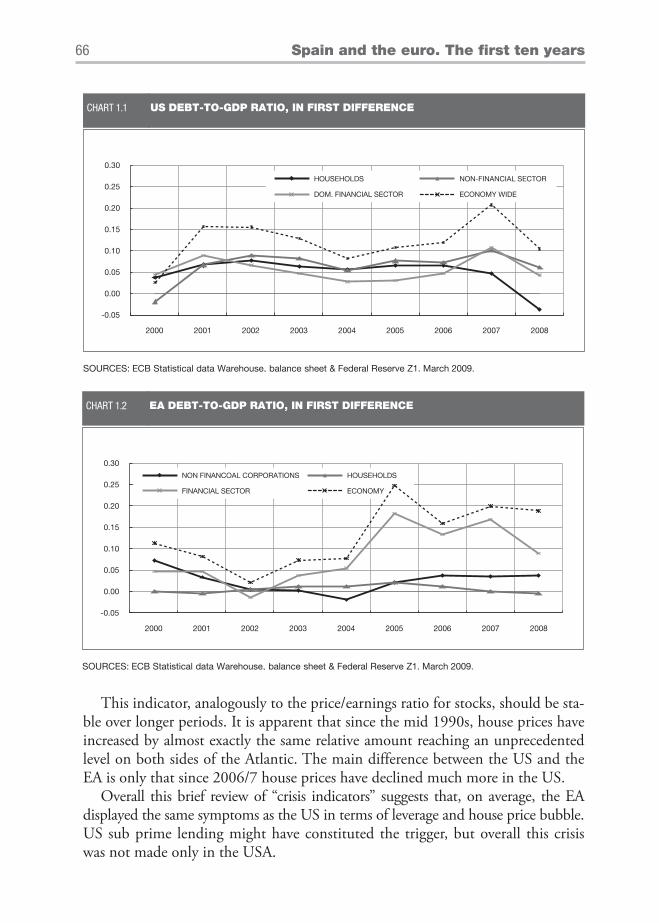
66 Spain and the euro. The fi rst ten years
This indicator, analogously to the price/earnings ratio for stocks, should be sta-ble over longer periods. It is apparent that since the mid 1990s, house prices have increased by almost exactly the same relative amount reaching an unprecedented level on both sides of the Atlantic. The main difference between the US and the EA is only that since 2006/7 house prices have declined much more in the US.
Overall this brief review of “crisis indicators” suggests that, on average, the EA displayed the same symptoms as the US in terms of leverage and house price bubble. US sub prime lending might have constituted the trigger, but overall this crisis was not made only in the USA.
SOURCES: ECB Statistical data Warehouse, balance sheet & Federal Reserve Z1. March 2009.
-0.05
0.00
0.05
0.10
0.15
0.20
0.25
0.30
2000 2001 2002 2003 2004 2005 2006 2007 2008
HOUSEHOLDS NON-FINANCIAL SECTOR
DOM. FINANCIAL SECTOR ECONOMY WIDE
US DEBT-TO-GDP RATIO, IN FIRST DIFFERENCECHART 1.1
SOURCES: ECB Statistical data Warehouse, balance sheet & Federal Reserve Z1. March 2009.
-0.05
0.00
0.05
0.10
0.15
0.20
0.25
0.30
2000 2001 2002 2003 2004 2005 2006 2007 2008
NON FINANCOAL CORPORATIONS HOUSEHOLDS
FINANCIAL SECTOR ECONOMY
EA DEBT-TO-GDP RATIO, IN FIRST DIFFERENCECHART 1.2

Comments on “Ten years of EMU: successes and puzzles” 67Daniel Gros
2 Asymmetries within the EA
Yet the EA averages hide important differences across countries, both in terms of leverage and house prices. Chart 2.1 shows that, within the EA, enormous dif-ference exists in terms of evolution of house prices (relative to rents): they have been stable in Germany, but increased by over 80% (and thus more than in the US) in France and Spain.
The evolution of credit growth (Chart 2.2) exhibits similar differences: lever-age (as measured by MFI debt relative to GDP) was high, but stable in Germany, whereas it increased considerably in those countries where house prices increased (most in France and Spain).
3 Is the Walters critique confirmed by the data?
The conventional view of the: Walters critique (to which Charles. subscribes partially) can be easily summarised: an initially high inflation in any one member country of the currency area implies lower real interest rates which in turn fuel domestic demand and hence drive inflation even higher, thus lowering real rates. This feed back loop is self amplifying and explosive. Charles observes that this did not happen, the initial (small) intra area differences in were not magnified possibly because of the interaction of a stabilizing link running from current ac-count deficit to demand.
NOTE: Euro Area index is defined as the weighted average (by GDP) of Germany, France, Italy, Spain, Finland, Ireland and Netherlands.
SOURCE: OECD, May 2009, and own computation.
0.80
0.90
1.00
1.10
1.20
1.30
1.40
II70
II71
II72
II73
II74
II75
II76
II77
II78
II79
II80
II81
II82
II83
II84
II85
II86
II87
II88
II89
II90
II91
II92
II93
II94
II95
II96
II97
II98
II99
II00
II01
II02
II03
II04
II05
II06
II07
II08
EURO AREA USA
HOUSE PRICES: PRICE-TO-RENT RATIOCHART 1.3

68 Spain and the euro. The fi rst ten years
Here I shall try to argue that the Walters critique (in terms of interest rate dif-ferentials), applies more to the housing market than to the overall economy.
Since Germany is usually taken to be the benchmark it might be useful to make some pair wise comparisons with the major EA members.
France and Germany displays almost the same inflation rate, but divergent house prices, while Spain and Germany have large inflation differential and di-
NOTE: MFI’s debt is computed as liabilities other than capital and reserves.
SOURCES: OECD, May 2009 and ECB Statistical data Warehouse, MFIs Accounts.
0.40
0.60
0.80
1.00
1.20
1.40
1.60
1.80
2.00
I95
III95
I96
III96
I97
III97
I98
III98
I99
III99
I00
III00
I01
III01
I02
III02
I03
III03
I04
III04
I05
III05
I06
III06
I07
III07
I08
III08
DEU
DEU
FRA
FRA
ITA
ITA
SPA
SPA
HOUSE PRICES: PRICE-TO-RENT RATIOCHART 2.1
NOTE: MFI’s debt is computed as liabilities other than capital and reserves.
SOURCES: OECD, May 2009 and ECB Statistical data Warehouse, MFIs Accounts.
0.0
1.0
2.0
3.0
4.0
1999 2000 2001 2002 2003 2004 2005 2006 2007 2008
TOTAL MFI's DEBT (RELATIVE TO GDP)CHART 2.2
GERMANY
FRANCE
SPAIN
ITALY

Comments on “Ten years of EMU: successes and puzzles” 69Daniel Gros
verging house prices. A comparison of Spain vs. France yields a reverse picture: similar house prices but different inflation. Finally, Spain and Italy exhibit similar real interest rates but there was no construction boom in Italy.
The last two results are not compatible with the Walters critique. If the infla-tion rate is the key variable to explain the overall economic developments (in-cluding house prices, which drive demand) one should observe the same impact of inflation on house prices and housing investment in all countries.
In facts, real mortgage rates have been different for other reasons than differ-ences in CPI inflation. First of all, mortgage rates were lower in Spain because they were short term or indexed on short term rates. This effect alone (-1.1%, see Table 3.1) is almost as important as the difference in CPI inflation. Yet the most relevant difference between Germany and the rest of the EA was in the behaviour of house prices: house prices increased by 10% more in France and Spain (on average for ten years, see Table 3.1) than in Germany. This is the key reason why the real perceived cost of a mortgage was so much lower in Spain and France than in Germany. Under these circumstances it is not surprising that mortgage debt exploded in Spain (as documented above).
These facts suggest an alternative view of the persistent divergences within the EA: a real estate bubble developed in some countries. During the 1990s most countries outside Germany had high real interest rates, a depressed economy and declining real estate markets. Joining the EMU these conditions reversed and bubbles developed in the housing markets of these countries. By contrast, in Germany house prices (and construction) continued to decline after the excess of construction caused by the post unification boom and the generous subsidies the government had for some years lavished on the sector.
The view that house prices constitute the main driver of intra area divergence is also supported by the fact that differences in the expansion of the banking sec-tor correlate well with differences in the evolution of house prices. As shown ear-lier in Chart 2.2, Germany has the highest starting level in terms of leverage and almost no increase over the EMU decade. The other EA member countries all ex-
Differential w.r.t.Germany average
1999-2007
HCPIInflation
MortgageRates
Real house prices(Growth rate)
Residentialmortgage debtas % of GDP
France 0.2 -0.5 10.3 17.8
Spain 1.6 -1.1 10.4 31.2
Italy 0.7 -0.2 5.8 14.3
SOURCES: ECB, OECD and European Mortgage Federation.
DIVERGENCES WITHIN EUROPE. WALTERS CRITIQUE?TABLE 3.1

70 Spain and the euro. The fi rst ten years
perience large increases. Italy has the lowest starting level but a big boost. Spain, which has experienced the biggest real estate boom also has the biggest increase in leverage and overtakes Germany.
4 Concluding remarks
What does this alternative view suggest?First of all: Within a monetary union national real estate markets can (they
do not have to) go on different trajectories. What to do, when this happens? The general prescription is quite clear: Intervene when prices/construction activity gets out of hand. This intervention could take several forms:
1 Limit loan to value ratios for mortgages.2 Auction off building permits.3 Dynamic provisioning for banks (well done BdE!).
Unfortunately the first two measures were not taken and the last one (used by the Banco d’Espana to its credit) is not sufficient to avoid the strong and lasting decline in demand that is unavoidable if the previous construction boom has led to a large housing overhang. Dealing with the legacy of national real estate bub-bles and busts will remain a challenge for EMU for some time to come.

Comments on “Ten years of EMU: successes and puzzles” 71Daniel Gros
References
BORIO C. and PHILIP LOWE (2002) “Asset prices, financial and monetary stability: explor-ing the nexus”, BIS Working Paper 114.
DE GRAUWE, PAUL (2009) “Keynes’ savings paradox, Fisher’s Debt Deflation and the Bank-ing Crisis”, Centre for European Policy Studies (CEPS) de Grauwe and Gros (2009).
MINSKY, HYMA (2008) “Stabilizing an unstable economy”, McGraw Hill.


José Manuel González-Páramo
European Central Bank
Comments on “Ten years of EMU: successes and puzzles”
1 Introduction
I am very grateful to have been invited to discuss the paper by Charles Wyplosz at this conference organised on the occasion of the 10th anniversary of the Start
of Stage Three of European Monetary Union (EMU). Professor Wyplosz’s paper provides an interesting review of the first ten years of the ECB, identifies some key economic features in which significant cross-country heterogeneity can be ob-served within the euro area and assesses whether such heterogeneity has the poten-tial to undermine the monetary union.
While reviewing the first decade of the Eurosystem’s monetary policy, Professor Wyplosz stresses the distinction between the first nine “happy” and “easy” years for monetary policy-makers (not only at the ECB) and one final year of intense challenges stemming from the financial crisis started in the summer 2007. A key contention of the author is that, while the first ten years of the euro area have been marked by many successes (facilitated by the Great Moderation at the internation-al level), there are also macroeconomic areas in which the experience of the first decade has been less favourable. In addition, the financial crisis has exposed some institutional weaknesses of the euro area (e.g. supervision and regulation of cross-border banks) that have been set aside during the “easy” years.
More specifically, the author is concerned by the persistence of asymmetry and heterogeneity across countries in key areas of macroeconomic performance: (1) in-flation differentials; (2) growth differentials; and (3) current account imbalances. The author labels them “puzzles” and argues that they can be explained to a large extent by the following three factors:
– The indirect impact of the so-called “Walters Critique” (basically, the tradi-tional “one size does not fit all” argument);

74 Spain and the euro. The fi rst ten years
– loss of competitiveness (partly as a result of sustained inflation differentials and the inability to devalue currencies for competitive purposes); and
– asymmetric demand factors (also macroeconomic policies).
The author concludes that the long-term implications for the stability of the EMU stemming from the persistence of growth and inflation differentials as well as current account imbalances are ambiguous. These factors would affect the economies of the euro area countries in different – and, sometimes, opposite – directions (for instance, in countries with relatively high inflation, the dampening effect on growth of loss of competitiveness can to some extent offset overheating stemming from excessive private demand), making it difficult to predict whether their net effect will be destabilising or not.
2 The first ten years: many successes…
Let me start from asking a simple question to the author: Were the first few years really so easy?
The success of the euro seems to have made us forget that its launch involved a number of major challenges. A new supranational institution was founded to take over the task of conducting monetary policy in a large region (initially) made up of eleven different countries. The ECB and the NCBs of the Eurosystem had to design and quickly implement an effective framework to collaborate effectively in a number of policy-related, operational and technical tasks.
As a new institution, the ECB had no “track record” to lean on in hard times and, by contrast, it faced the task of quickly establishing its own credibility and gaining the confidence of the public and the financial markets. Besides, the char-acteristics of the euro area were yet to be comprehensively studied or understood. There was limited knowledge of how the behaviour of agents and key structural features of the euro area (e.g. the monetary transmission mechanism) might func-tion once integrated into a monetary union. Things were made worse by the lack of reliable harmonised data to study the structure and functioning of the new economic area.
In practice, the “EMU framework” worked smoothly from the first few days and effectively handled the subsequent enlargement of both the euro area and the EU.1 The institutional setting and infrastructures (notably, the operational framework and payments systems infrastructures) were functional from the start of 1999. The monetary policy strategy of the Eurosystem was rapidly understood
1 See ECB (2008) and European Commission (2008) for a detailed account of the first ten years of the euro.
Comments on “Ten years of EMU: successes and puzzles” 75José M
anuel González-Páramo
and credible, though its monetary pillar proved initially controversial. The Eu-rosystem decision-making process was up and running right away.
With hindsight, we can tell that the EMU framework worked well and proved robust to a number of shocks (9/11, the new technology bubble at the start of the decade, the boom in commodity prices since 2003, etc.) and major financial stress. However, we should recall that there was initially a great deal of scepticism among prominent economists (e.g. Martin Feldstein, 1997) about the prospects of the euro. For instance, it was often argued that the conditions for an Optimal Currency Area a-la-Mundell were not in place and that national business cycles were not sufficiently synchronised for countries to lose their ability to use mon-etary policy as a stabilisation tool.
Again with hindsight, we now know that the introduction of the euro had be-nign effects in many macroeconomic areas. In particular, inflation rates remained on average low and relatively stable, while longer-term inflation expectation were well anchored. Besides, interest rates converged to the levels of the best pre-EMU performers. Financial integration also advanced, though at different paces across the various markets. Trade integration deepened, with an expansion in intra-euro area trade in goods, but also rapid growth in trade in services. At the same time, FDI and M&As significantly increased over the last ten years. Remarkably, the euro area was able to achieve all of this, while also accommodating an expanding number of countries and increasing its openness toward the rest of the world.
3 …and some mixed developments
Of course, there are also areas – particularly, in the fields of structural reforms and fiscal consolidation – in which progress was not entirely satisfactory over the past decade.
Before the introduction of the euro, many commentators wondered whether entering the EMU would encourage or hinder structural reforms and the liberali-sation of product and factor markets. There were at the time two opposing views: on the one hand, it was argued that monetary union would hinder large-scale reforms by precluding national authorities from using monetary stimulus to miti-gate the short-run pain that is typically associated with adjustments to reforms; on the other hand, it was more optimistically argued that the loss of national monetary policies and of the nominal exchange rate mechanism would in fact reinforce the need for structural reforms.
After ten years, some empirical evidence suggests that, on average, the inten-sity of structural reforms over 1994-2004 was greater in the euro area countries than in the rest of the OECD (Duval and Elmeskov, 2006). However, the assess-ment is not entirely positive. The data suggests that not all countries engaged in

76 Spain and the euro. The fi rst ten years
reforms to the same degree: small EMU countries were among the top reformers, while efforts by large EMU countries were more timid. In addition, reform ef-forts seem to have generally declined after the launch of the euro.
Another area in which the assessment of the first years is relatively mixed re-gards fiscal policy. Before the launch of the euro, there was much discussion over how the combination of a centralised monetary policy with decentralised fiscal policy – though coordinated within the institutional framework provided by the Stability and Growth Pact – would work. With hindsight, the overall fiscal posi-tion of the euro area significantly improved in the few years preceding the start of the financial crisis. On the other hand, some euro area countries failed to achieve and maintain sound fiscal positions and reduce government debt ratios to more sustainable levels. This means that they entered the current crisis in a relative-ly weak fiscal position and relatively limited room of manoeuvre to react to the sharp economic contraction.
4 The “puzzles”
As mentioned above, the author notes that the first decade of the euro was characterised by the persistence of inflation and growth differentials across coun-tries as well as growing national current account imbalances.
According to the author, one of the main factors behind such developments is the old “one size does not fit all” argument (labelled the “Walters critique” after Alan Walters, who used it extensively to campaign in the late 1980s against UK membership of the Exchange Rate Mechanism). As is well known, this critique postulates that countries relinquishing the ability to independently set nominal interest rates end up with the inappropriate level of real interest rates for their economies, thereby accumulating imbalances and disequilibria that will prove destabilising for the national economies and ultimately undermine the monetary system.
A crucial prediction of the critique is that in countries with comparatively high levels of inflation, real interest rates will be lower, which in turn stimulates the economy and fuels inflation, setting in motion a self-reinforcing mechanism that takes the economy along a dynamically unstable path. If this description of the destabilising effect of the single policy is correct, there should be increasing divergence of real interest rates within the monetary union.
However, as Table 4.1 shows for the five largest euro area countries, there is no evidence that the introduction of the euro has led to increasingly divergent real interest rates. To the contrary, the dispersion of both the ex-post short- and long-term real interest rates actually declined in the second half of the decade. Even when we consider ex-ante rates (i.e. deflated by expected instead of realised infla-

Comments on “Ten years of EMU: successes and puzzles” 77José M
anuel González-Páramo
tion), the dispersion of the rates did not increase over time. In fact, it remained stable for long-term real rates, while slightly declining for short-term rates. Thus, the data on real interest rates does not support the prediction that a single mon-etary policy has led to perverse effects at least for the five large countries consid-ered.
At the same time, inflation differentials may translate into differences in real exchange rates and contribute to competitiveness losses and current account defi-cits. To illustrate this point, Chart 4.1 plots the current account deficits and a harmonised competitiveness indicator (conceptually similar to a real effective ex-change rate). The experience of the last ten years suggests that, in most euro area countries, there is a clear relationship between developments in competitiveness and in current account balances.
Competitiveness losses are likely to be higher in economies characterised by significant frictions. In particular, there are two types of rigidities that under-mine the functioning of the competitiveness channel: (1) wage and price rigidi-ties; and (2) barriers to cross-border trade (notably, for services). Wage and price rigidities hinder the adjustment of relative prices to shocks and changes in cyclical conditions. Barriers to trade limit the response of external demand and supply to relative price changes and also imply that larger cost/price differentials are needed in order to close output gaps.
Overall, rigidities can prove very costly to the economies, especially at times of economic downturn, when frictions delay and may even prevent adjustment
Short-term real interest rates (a) Long-term real interest rates (b)
Ex-ante Ex-post Ex-ante Ex-post
Nominal interest rates deflated by:
Inflationforecasts forthe following
year
Current HICPannual
inflation rate
Long-term(6 to 10
years ahead)inflation
forecasts
Current HICPannual
inflation rate
STANDARD DEVIATION
1999-July 2004 unweighted 0.53 0.80 0.26 0.62
weighted (c) 0.45 0.70 0.23 0.57
1999-2008 unweighted 0.46 0.61 0.26 0.48
weighted (c) 0.40 0.54 0.23 0.45
DISPERSION OF REAL INTEREST RATES IN THE FIVE LARGEST EURO AREA COUNTRIES
TABLE 4.1
SOURCES: BIS, ECB, ECB calculations, Eurostat, Consensus Economics.
a. 3-month money market interest rates (EURIBOR for the period 1999-2004). All euro area countries excluding Luxembourg. b. Figures refer to the dispersion between Germany, France, Italy, Spain and the Netherlands.c. Based on 2002 GDP weights at PPP exchange rates.

78 Spain and the euro. The fi rst ten years
in nominal wages and prices to undo previous competitiveness losses, ultimately leading to large scale employment and output losses.
5 The euro area and the financial crisis
At a time of severe financial crisis and economic contraction, the euro area has proven a major area of stability, especially for the smaller countries and those with traditionally less strong currencies. The euro shield proved all the more useful af-ter Lehman’s default in September 2008, when we witnessed a very severe dete-rioration of conditions in international financial markets and banking sectors.
The financial crisis has since spilled over to the real economies across the world, also affecting all the euro area countries where economic activity is con-tracting, while unemployment rises. Against this background, it is not uncom-mon to hear some nostalgic remarks about the “good old days” in which coun-tries could devalue their way out of this recession. But would a competitive devaluation be feasible in the current conditions?
There are factors suggesting that this would not be the case. Indeed, eco-nomic theory tells us that the more open economies are, the less effective uni-lateral nominal devaluations are. Against the background of increased trade and financial integration, it is legitimate to expect that any impact from devaluations
-25
-20
-15
-10
-5
0
5
10
15
-30
-25
-20
-15
-10
-5
0
5
10
DE AT FI BE FR NL IT PT LU ES IE GR
NOTE: 2000 in Greece as an initial period for CA and HCI, negative value implies a loss in competitiveness. HCI calculated on the basis of weighted averages of bilateral exchange rates vis-à-vis the other 15 euro area countries and the group of 21 trading partners and are deflated by unit labour costs. Weights are based on bilateral data on trade in manufactured goods for the periods 1995-1997 and 1999-2001.
SOURCES: European Commission and ECB calculations.-1997 and 1999-2001.
CURRENT ACCOUNT BALANCES AND COMPETITIVENESSCHART 4.1
CA AS A % OF GDP 1998
CA AS A % OF GDP 2007
CHANGE IN HCI (ULC-BASED), 1999Q1-2007Q4 (SIGN CHANGED), (Right-hand scale)

Comments on “Ten years of EMU: successes and puzzles” 79José M
anuel González-Páramo
would be these days much reduced. In addition, given the global nature of the crisis, if countries engaged in competitive devaluations, this would not bring real benefits, but simply start a race towards increasingly softer nominal exchange rates and higher inflation, ultimately leading to weaker long-term growth. By contrast, especially at times of crisis, it is crucial to preserve nominal stability and maintain long-term inflation expectations and interest rates at low and stable lev-els. In addition, it is particularly important to make sure that structural reforms are pursued and fiscal sustainability is preserved in order to address long-term challenges.
6 Concluding remarks
While it is true that economic and financial structures take time to evolve, it is clear that the overall effects of the euro are positive. These ten years have shown that the foundations of EMU were sound and that a high degree of economic convergence had been achieved by those countries that adopted the euro.
The combination of a centralised monetary policy with decentralised – although coordinated – fiscal and structural policies has worked in a broadly satisfactory fashion. The monetary policy strategy of the ECB is now well understood and has gained credibility. In particular, in most euro area countries inflation has been sig-nificantly below the levels experienced in the decades preceding the launch of the currency and also proven less volatile, while long-term inflation expectations have remained anchored at levels consistent with the ECB’s defintion of price stability.
For many euro area countries, this is a significant benefit and would not have been possible outside the Eurosystem. The benefits of belonging to a large and credible monetary union have become all the more evident during the present global crisis. At the same time, the euro area has proven capable of handling en-largement successfully.
In addition, over the past decade the Eurosystem has actively contributed to promoting financial integration and has been very active in strengthening the in-stitutional arrangements designed to preserve financial stability.
These successes notwithstanding, many challenges remain. Key among them is the need to pursue further and deeper reforms of product and labour market reforms. In order to maintain price stability, it is crucial to continue encourag-ing responsible behaviour of all social partners, while preserving the long-term sustainability of public finances. This is also necessary to address the challeng-es arising from adverse demographic developments. The financial crisis has also shown that it is urgent to strengthen regulatory and supervisory frameworks both in Europe and at the international level in order to correct market and regulatory failures that were at the root of the current crisis.

80 Spain and the euro. The fi rst ten years
References
DUVAL, R., and J. ELMESKOV (2006). The Effects of EMU on Structural Reforms in Labour and Product Markets, ECB Working Paper No. 596.
EUROPEAN CENTRAL BANK (2008). “Monthly Bulletin 10th Anniversary of the ECB”, ECB Monthly Bulletin, Special issue, May.
EUROPEAN COMMISSION (2008). “EMU@10 Successes and challenges after ten years of European Monetary Union”, European Economy, 2/2008.
FELDSTEIN, M. (1997). “EMU and international conflict”, Foreign Affairs, November/De-cember.

The performance of the Spanish economy
in EMU


Banco de EspañaÁ. Estrada, J. F. Jimeno and J. L. Malo de Molina
The perfomance of the Spanish economy in EMU: the fi rst ten years
1 Introduction
The opening decade of the 21st century will probably occupy a notable place in the history of the European economy. The early years of the decade
coincided with the initial years of the culmination of the process of economic and monetary integration, following the launch of the common monetary policy and the single currency in 1999. And its closing years are witness to an international economic crisis of momentous scope and intensity.
The Spanish economy is among those that have most benefited from Economic and Monetary Union (EMU) membership. But the long upturn in which the benefits materialised has ended in a process of adjustment in a markedly adverse setting. From the mid-1990s to 2007, the Spanish economy enjoyed a phase of sustained economic growth in which real convergence with the core EMU member countries advanced no-tably (GDP per capita relative to the EMU average increased by more than 15 pp from 79% to 95%) and in which the labour force and employment grew by almost 6 million (approximately 35%) and over 7.5 million (almost 60%), respectively.
Yet significant imbalances built up in the period 1999-2007, ultimately resulting in an inevitable adjustment. Firstly, low interest rates and favourable financial conditions prompted strong growth in corporate and household credit and debt. Secondly, the con-tinuous pressure of demand exceeded the responsiveness of the productive system, in spite of the significant structural transformations made and of the notable expansion in the labour factor, generating a positive inflation differential with the rest of the euro area that resulted in a strong appreciation of the real exchange rate, an erosion of price-com-petitiveness and a sharp increase in foreign debt. Finally, easy credit and demographic pressure fuelled a property boom, with surging house prices and an excessive concentra-tion of productive resources in the construction sector.

84 Spain and the euro. The fi rst ten years
These imbalances progressively undermined the foundations of the expansion, leading to a slowdown in economic activity. This started gradually but subse-quently became more acute with the outbreak of the international financial crises of 2007-2008. As a result the adjustment became much more severe, as the crisis struck one of the most vulnerable parts of our economy, namely the continuing and growing resort to international funding, which at one point amounted to as much as 10% of GDP per annum. From having posted high growth rates, the economy moved over a brief period into a contractionary dynamic, with a fall-off in activity and job destruction in the second half of 2008.
Assessing the effects of EMU on the behaviour of the Spanish economy over the past decade, from the standpoint both of the factors that underpinned the expan-sion and of those that have triggered the adjustment, is a complex exercise for many reasons. First, the start-up of EMU coincided in time with significant structural changes in the international economy, namely: i) the generalised use of informa-tion and communications technologies (ICTs); ii) the globalisation of economic activity, in a broad sense, i.e. including migratory flows, and iii) an abundance of liquidity and diminished risk aversion. Indeed, for much of the last decade, the spread of ICTs has given rise to growing international integration in trade and fi-nance. And this, along with the greater participation of newly emerging economies in world markets, increased capital mobility and led to a new international divi-sion of labour. With globalisation, international flows of goods and services and of capital, together with international migratory movements, increased notably. This occurred while certain structural changes and the greater effectiveness of macroeco-nomic policies were providing for a better absorption of economic shocks, with a lesser response by output, employment and inflation. Under these conditions, the integration of capital markets and the emergence of new financial products shaped, for much of the decade, a setting marked by more readily available credit, abun-dant liquidity and the low cost of risk. This situation would turn around dramati-cally following the effects of the international financial crisis, which superimposed themselves on the adjustment that the Spanish economy had embarked upon a few quarters earlier, making it more complex and costly. It will thus be very difficult to disentangle the contribution of each process separately.
Secondly, EMU membership was conditional upon compliance with a series of requirements laid down in the Maastricht Treaty, to ensure a high degree of nomi-nal convergence among the member countries. This was the basis for the applica-tion of a single monetary policy that would not generate unsustainable monetary and financial pressures, given the appropriate conditions of homogeneity in place.1
1 Indeed, some of these requirements paved the way for the subsequent setting of a series of fiscal policy rules to ensure budgetary rigour on the part of the member countries. These rules seek to prevent a lack of fiscal discipline distorting monetary policy decisions.

The performance of the Spanish economy in EMU 85Á. Estrada, J. F. Jim
eno and J. L. Malo de M
olina
However, in the mid-1990s, Spain was one of the candidates for Monetary Union membership that was furthest from meeting the requirements in the Treaty. Accord-ingly, significant changes had to be made to the policy stance, along with specific reforms to help achieve the required objectives. This effort meant that some of the positive effects of Monetary Union on the Spanish economy began to be felt before the Union was formally in place. EMU membership aside, nonetheless, it should be borne in mind that the European Union had also developed mechanisms (including the Structural and Cohesion Funds) to facilitate the real convergence of the econo-mies with lower levels of welfare. Thanks to this, Spain was the recipient during this period of a considerable volume of capital transfers, which provided for notable infrastructure development and, moreover, was key to promoting greater conver-gence in per capita income across Spanish regions [see, for example, De la Fuente (2003)]. Yet now a high degree of real convergence has been attained, Spain’s net financial contribution to the European Union has moved to a position of balance, so that this impulse had disappeared at the end of the period.
Lastly, it should be stressed that a full analysis of the impact of EMU on the Spanish economy unquestionably requires a broader time perspective than that provided by the first ten years of membership. Until very recently the Spanish economy was enjoying a lasting expansion that benefited from some of the fac-tors associated with Monetary Union. In the coming years the outcome of the current adjustment will reveal how sound the Spanish economy’s structural fun-damentals deriving from EMU membership really are, and to what extent these fundamentals are going to allow growth potential to remain high. In this respect, it is worth considering to what extent the increase in debt, the appreciation of the real exchange rate and the concentration of resources in construction may have been excessive and in what way these imbalances may influence future develop-ments in the Spanish economy in the new international setting arising from the financial crisis and the slowdown in the world economy.
This paper analyses the Spanish economy’s experience in the first decade of EMU. It is structured as follows. Section 2 defines the starting conditions of the Spanish economy, when there was only a commitment to join monetary union as a founding member. Section 3 describes the main transformations made to attain this objective, and details the advantages of belonging to the euro area compared with remaining outside. Section 4 describes the developments in the economic variables that best represent the main events of the past decade, focusing on the factors underpinning the expansion and the increase in convergence, and on the imbalances that triggered the start of the adjustment. Section 5 attempts to assess the scope of these imbalances using an intertemporal consumption model, a tool frequently used to analyse international macroeconomics issues, explicitly incorporating the behaviour of the real estate sector. Section 6 then analyses the sources of the recent recession, a combination of internal adjustment factors and

86 Spain and the euro. The fi rst ten years
the effects of the international crisis, and describes the fundamentals of the process of adjustment towards a new path of sustained economic growth. Finally, Section 7 presents the main conclusions of this assessment of the behaviour of the Spanish economy during the first ten years of EMU membership.
2 The starting point: adjustments prior to EMU accession
Accession to EMU marked the culmination of lengthy efforts to attain a re-gime of macroeconomic stability in Spain. This was achieved by a series of trans-formations that, on balance, shaped the starting point for the long expansion and subsequent adjustment of the Spanish economy within EMU [see Malo de Mo-lina (2005 and 2007)].
In the early 1990s the imbalances that had built up with the sharp – but uneven – expansion in the second half of the previous decade led to a major ma-croeconomic crisis and to an abrupt and deep recession that meant that the entire convergence strategy had to be reconsidered. The difficulties facing most Euro-pean countries and widening macroeconomic divergences brought about a delay in the monetary integration timetable that ultimately gave the Spanish economy sufficient time to right its course.
The change in tack of the Spanish economy was based on keeping the mon-etary policy stance anchored to the objective of joining the Monetary Union as soon as possible, ideally from its creation. This involved implementing structural changes that the economy required, the need for which had been particularly evi-dent during the sharp crisis in the early 1990s, along with a sufficiently ambitious macroeconomic stability strategy based on realistic assumptions. In adopting this stance, it was decided to prioritise the macroeconomic stability that EMU could provide and it was expected that the change in macroeconomic regime would al-low the introduction of certain incentives for the structural reforms needed to equip the Spanish economy with the flexibility that participation in a monetary union requires.
The employment adjustments induced by the sharp recession in the 1990s made for considerable productivity gains that enabled mark-ups and profit levels to be restored. The adjustments firstly led to a considerable rejuvenation and to an in-crease in the educational attainment and skills of workforces which, in many cases, had not been able to adapt to the technological changes that had begun to be in-troduced into the productive system. In turn, the high financial costs induced by a stability-geared monetary policy requiring high interest rates prompted a reduc-tion in excess external financing, allowing very sound financial positions to be at-tained. The adjustment was particularly costly in terms of unemployment, which

The performance of the Spanish economy in EMU 87Á. Estrada, J. F. Jim
eno and J. L. Malo de M
olina
rose to close to 25% of the labour force, but it placed businesses in a very healthy and competitive position. The recession proved relatively short-lived and the start of the recovery, underpinned by the macroeconomic policies set in place and by the structural reforms that were beginning to be rolled out, helped revive employment creation. The experience of the rapid increase in unemployment triggered by the economic downturn prompted a change in the attitude of social agents, who now better appreciated the need for structural reforms in the workings of many markets and institutions, particularly in the labour market, and were somewhat more sensi-tive to the effects of wage rises on the behaviour of employment and inflation. This change was, at least incipiently, in the direction required to achieve behaviour com-patible with a permanent regime of macroeconomic stability.
The relatively short duration of the contractionary phase prior to the start of the expansion had much to do with the role played by the adjustment of the exchange rate. Unavoidable devaluations of the peseta occurred at that time as a result of the markets sanctioning economic policies and price and wage for-mation practices that were not consistent with exchange-rate stability. Once the markets were aware of the unsustainability of the cumulative losses in competi-tiveness and of the level of the external deficit that had to be financed, specula-tive pressures made it impossible to maintain exchange-rate commitments. When that happened, accepting even a certain overreaction that would eventually lead to EMU accession with a relatively favourable conversion rate became inevita-ble. The exchange rate adjustment acted as a swift and effective mechanism for absorbing the imbalances that had built up, and was instrumental in engineering the emergence from recession according to the traditional pattern, based on re-covery in net external demand and in corporate surpluses, followed by a reactiva-tion of productive investment and of household consumption. The exchange-rate level reached following the successive devaluations provided significant leeway not only to consolidate the dynamism of activity in the sector most exposed to competition but also to subsequently absorb the additional erosion in the behaviour of relative prices. All these factors ultimately contributed positively to shaping a favourable starting point for the success of monetary integration.
Yet such favourable results from the exchange-rate depreciation were only possible because, unlike the pattern of conduct prevailing in the past, under which agents reacted immediately to protect themselves from purchasing power losses and gains in competitiveness were short-lived, the markedly stabilising na-ture of the convergence policy and the monetary policy inflation targets helped prevent a rapid dissipation of the effect of the parity adjustment. This is a mat-ter of great importance, since integration into the Monetary Union would entail renouncing the use of this instrument in any future processes of adjustment. In-deed, the complexity of the severe adjustment the Spanish economy is undergo-ing stems not only from the adverse international financial conditions and from

88 Spain and the euro. The fi rst ten years
the global recessionary setting in which it is taking place, but also from the diffi-culty and uncertainty inherent in the correction of accumulated imbalances with-out an independent monetary policy and without the possibility of resoring to the relative price adjustment through an exchange rate realignment. That said, the serious difficulties that certain economies with exchange-rate flexibility and lit-tle tradition of macroeconomic stability have experienced have once more high-lighted the sizeable protection that euro area membership provides against abrupt financial shocks.
In short, the convergence drive to comply with the criteria laid down for EMU accession proved particularly complex and eventful, although ultimately satisfac-tory. In turn, the change of tack needed in budgetary policy to curb the growing budget deficit, amid a very marked recession, laid the foundations for resuming the path of consolidation that would contribute significantly to providing the ap-propriate base from which to attain the convergence targets and to benefit from the stimulating aspects of participation in the euro area.
3 The change in macroeconomic regime
From this starting point, and before considering the trajectory of the Span-ish economy within the euro area, we may ask what was the scope of the trans-formations in macroeconomic arrangements entailed by entry into the area. Probably, the most telling consequence of EMU membership is the change in how imbalances and their attendant adjustments manifest themselves. Set against the significance of the external financial constraint existing for coun-tries with monetary sovereignty, strains tend to build up within the euro area mainly in terms of loss of competitiveness and excess debt. And, in respect of adjustment, the impossibility of altering the exchange-rate relationship shifts the response to the weakening of demand and the reduction in debt levels to-wards flexibility in the functioning of markets and in cost and price forma-tion. If wage and price formation has not become more flexible, adjustment in the face of aggregate shocks will fall on quantities, whereby the process will be slower and, above all, much more costly, given the adverse effect this may have on human capital.
Compliance with the convergence criteria and participation in the euro from the outset entailed attaining a regime of macroeconomic stability that would have hardly been achievable outside the area, as the troubled course of previous stabi-lisation attempts had demonstrated. On the inflation front a substantial reduc-tion was brought about, despite the fact that, as will be seen below, convergence in terms of price stability has not been fully achieved. On all the studies avail-able, the Spanish economy had comparatively high sacrifice ratios before joining

The performance of the Spanish economy in EMU 89Á. Estrada, J. F. Jim
eno and J. L. Malo de M
olina
the euro area; accordingly, the reduction in inflation entailed considerable losses in output and higher unemployment which, moreover, had a sizeable permanent component, given that a notable presence of hysteresis was apparent in the behav-iour of the Spanish labour market (see Dolado and Jimeno, 1997). However, the same studies associated considerable benefits with reducing inflation that were clearly greater than the attendant costs. In the short run, this was the result of interaction with an unindexed tax system and of a legal system in which all limits are set in nominal terms. And in the long run, because the creation of a setting characterised by confidence conducive to profitable investment allows the poten-tial level of per capita income to be raised.
An essential component of the regime of macroeconomic stability was fiscal consolidation. This was one of the requirements laid down in the Maastricht Treaty and enabled Spain to progress from posting deficits of above 7% in the early 1990s to a surplus position based on broad social consensus on the need for the budget to be in balance over the business cycle. This improved fiscal po-sition allowed the potential crowding-out effects and the risk premiums associ-ated with a lack of fiscal discipline to be sharply curtailed, and macroeconomic management and the very dynamics of public finances benefited accordingly. At the same time, the substantial reduction in Spain’s nominal divergences with its main trading partners and the elimination of the speculative component of the exchange rate lessened the costs of trading for firms, increasing their profitabili-ty, and reduced the costs of tourism for individuals. The elimination of the risks of a currency depreciation were not only decisive in reducing the risk premiums associated with the dangers of macroeconomic instability; they also prompted a cut in the relative cost of trade with the euro area and contributed to forging closer trading relations with, and to smoothing integration into, this area, al-lowing comparative advantages to be harnessed.
EMU membership ensures interest rates consistent with the area’s price sta-bility standards. The biggest consequence of all these changes was, therefore, a considerable and permanent reduction in interest rates. A return to rate increases characteristic of situations of macroeconomic and exchange-rate instability, en-tailing high risk premiums for the Spanish economy, was inconceivable. Accen-tuating this reduction in rates was the predominantly expansionary monetary policy adopted by the area for most of the period, and the accommodative finan-cial conditions that have prevailed worldwide, meaning that interest rates reached abnormally low levels, even for the area’s core countries.
As a result, Spanish households and firms alike saw their borrowing capacity increase. And this had forceful expansionary effects on demand in the econo-my. Several analyses have sought to estimate the intensity of these effects, dis-tinguishing between the various channels (the substitution effect, income effect and wealth effect) through which they operate. One central aspect of agents’ in-
90 Spain and the euro. The fi rst ten years
creased borrowing capacity derived from the disappearance of the constraint aris-ing from country-specific macroeconomic risk, given the absence of exchange rate differentiation. Consequently, when attracting the financing flows required, the main determinant was, under normal financial market operating conditions, the return/risk profile of the individual borrower, which permitted a consider-able increase in the economy’s capitalisation. More recently, international mar-ket financing conditions have changed drastically following the abrupt financial crisis, and dependence on external finance has become an unexpected factor of vulnerability, since it involves something of a return to a more local orientation for these markets.
Lastly, we should not forget the role played by EMU membership in establish-ing powerful stimuli to shift the stance of policies that remain under national sovereignty towards a framework of medium-term stability and growth. The fiscal policy rules are, in substance, common to all the EU countries, but EMU mem-bership gives fiscal policy a more decisive role and reinforces the factors favour-ing an appropriately counter-cyclical and stabilising use of demand. In parallel, structural reform policies take on significant importance for a country belonging to a monetary union. Indeed, given the constraints on the traditional instruments for regulating aggregate demand and the insufficient labour mobility in the area (due, among other matters, to purely cultural factors), such policies become the most effective resource available to the authorities to encourage agents’ adapta-tion to the requirements of the new environment.
Evidently, the disciplining influence of the policies has been key to the be-haviour of the core of the public sector (State and Social Security), which moved from sizeable deficits to a surplus position, with the public debt/GDP ratio shrinking substantially. However, the change is not so apparent in the case of the regional and local governments, since these assumed current expenditure com-mitments on the basis of revenue with a sizeable temporary component, probably due to the fact that the arrangements in place did not involve a sufficient degree of fiscal co-responsibility. In fact, with the adjustment that suddenly began at the end of the period, the high sensitivity of overall general government revenue to the pattern of deceleration and subsequent contraction of the economy was high-lighted, so that the structural improvement in public finances can be expected to be ultimately less than thought.
In the case of the structural reform policies, headway has been more uneven across sectors and markets, and has also depended on the territorial distribution of competencies. In the case of certain privatisation and liberalisation policies, some progress has been reported, enabling programmes adopted in previous stag-es to be furthered. But this has not been the case in certain services branches or, above all, in the labour market. The only relief to the labour market stemmed from the sharp influx of immigrants and from the reduction in hysteresis, evi-
The performance of the Spanish economy in EMU 91Á. Estrada, J. F. Jim
eno and J. L. Malo de M
olina
denced by the notable decline in long-term unemployment and in the NAIRU (non-accelerating-inflation rate of unemployment) in the Spanish economy dur-ing the expansion.
The absence of far-reaching labour reforms has left the workings of the labour market largely intact. Such workings are characterised by considerable rigidity in wage-bargaining and wage-setting mechanisms and by a deep-seated dichot-omy in hiring arrangements which tends to shift the intensity of the adjustment onto employment, as the explosive rise in unemployment in previous recessions has evidenced. This inefficiency goes unnoticed while conditions conducive to economic dynamism are in place. But it tends to exacerbate and accentuate the virulence of adjustments as employment acts as a mechanism for the spread and amplification of adjustment effects rather than inducing a less costly adjustment in wages.
From this perspective it is worth considering the benefits that have arisen from monetary integration compared with the effects that would have come about had the economy remained outside EMU. Unquestionably, the tenden-cies towards macroeconomic instability would have been considerably greater outside, so that the economy would not have been capable of the same degree of expansion and convergence, and the costs of stabilising efforts would have been greater. Further, the economy would have not have enjoyed the protec-tion against global and idiosyncratic financial shocks provided by EMU mem-bership. Nonetheless, the tendency for greater specialisation in the economy in some specific industries (such as construction and related activities) might have been less strong and exposure to real asymmetrical shocks outside the area more limited. It is possible, too, that integration may have been conducive to trade with an area whose growth has been very small when compared with the Americas or Asia, which may have contributed to increasing net borrowing.
Finally, it might be ventured that the possibility of building up imbalances would have been less outside the euro area. One risk factor involved in belong-ing to a monetary area is the possibility that macroeconomic imbalances may be built up and amplified, delaying the necessary adjustment. This is because the disciplining factors that arise from the existence of a market price for the country’s macroeconomic risk are absent. Hence it is possible that, in the ab-sence of risks to macroeconomic stability, interest rate cuts are conducive to a larger increase in household and corporate debt than would have been the case had EMU membership not been an option. Seen from another angle, that entails the possibility of reaching a level of net borrowing for the economy as a whole that would not have been possible outside EMU. Before reaching such levels an adjustment of financial conditions, of domestic demand and of the rate of growth would have been triggered by means of exchange rate and long-term interest rate pressures.

92 Spain and the euro. The fi rst ten years
4 The performance of the Spanish economy in EMU
This section summarises the key features of the Spanish economy’s expansion during the period it has been a member of EMU. Firstly, it describes the main macroeconomic variables in terms of the level of economic activity, employment, productivity and inflation, distinguishing between the period prior to EMU en-try and the subsequent period, and comparing with other advanced countries and possible areas of reference. Secondly, it analyses the main imbalances that built up during the long expansion – the appreciation of the real exchange rate and the increase in the external deficit, the property boom, and the rise in the levels of corporate and household debt – which would trigger the subsequent process of adjustment.
4.1 The expansionary phase: 1999-2007
In an initial approach to the performance of the Spanish economy in EMU, Table 4.1.1 shows the annual average growth rates of GDP, population and per capita income (with the corresponding standard deviations) recorded in Spain in the nine years up to the creation of EMU (1990-1998) and in the nine sub-sequent years (1999-2007).1 Comparison with the behaviour of other countries (the United States, the three biggest euro area members – Germany, France and Italy – and the euro area itself ) in both periods gives a first impression of the po-tential impact of EMU on the growth of the Spanish economy.
As can be seen, while the GDP growth rate for the United States declined by 0.3 pp from one period to the next and held stable for the euro area, the pace of growth climbed by 1 pp for the Spanish economy, reversing the negative growth dif-ferential with the United States before 1999 (0.3 pp) to a positive difference of 1 pp. This increase is particularly notable insofar as the growth gap between the United States and the euro area in the second period was, at 0.5 pp, still considerable.
Also of note was the reduction in the variability of GDP growth, especial-ly in the United States. This appeared to be following on from the structural reduction in business cycle fluctuations that came to be known as the “Great Moderation”.2 A similar reduction in GDP volatility was perceptible in the euro area, although it did not appear to be extensive to all the member countries. In-deed, in the three biggest euro area economies the fluctuations in output seem
1 The use of these average growth rates over a relatively long period means that the different cyclical po-sitions of the economies at each point in time are not the main determinant of the differences highlighted in the text.
2 See McConnell and Pérez-Quirós (2000), who identify a structural change in US GDP volatility in the mid-1980s.

The performance of the Spanish economy in EMU 93Á. Estrada, J. F. Jim
eno and J. L. Malo de M
olina
to be on a similar scale before and after the creation of EMU. By contrast, in Spain there was a most significant reduction in the volatility of GDP growth: from being the country with the biggest fluctuations it became that show-ing least volatility. That would suggest that expansionary phases have become longer and more stable, reflecting the materialisation of the structural improve-ments in macroeconomic workings that was expected from EMU membership.
A very important factor behind the growth of economic activity in Spain dur-ing the period 1997-2007 was the notable demographic expansion. Indeed, be-fore 1999, and as in the other European countries, population growth was very small, especially when compared with that in the United States. This gap in pop-ulation increases actually explains the differences in GDP growth, since per cap-ita income in the euro area was expanding at the same pace as that in the United States. In any event, this aggregate development in the euro area masked the dif-ferences in the behaviour of the large euro area countries which, in terms of per capita income, were slipping relative to the United States and to the other coun-tries, including Spain, which was posting an annual average increase in per capita income of 2.5% and was narrowing the differences both with respect to the EU-3 and the United States.
From the onset of EMU, the population in Spain accelerated sharply, growing at an annual average rate of 1.4%, 0.4 pp more than in the United States. As earlier discussed in the introduction, this sizeable demographic expansion was the result, above all, of a massive influx of immigrants, but also of the increase in Spaniards’ life expectancy which, at present, stands at one of the highest levels for the developed countries. Growth in per capita income in Spain fell by 0.1 pp, while in the euro area as a whole and in the United States the dynamism of the previous period was
GDP Population Per capita income
1990-1998 1999-2007 1990-1998 1999-2007 1990-1998 1999-2007
United States 3.0 2.7 1.2 1.0 1.7 1.7
(1.5) (1.1) (0.1) (0.1) (1.5) (1.1)
EU-3 (b) 1.5 1.7 0.4 0.3 1.1 1.4
(1.0) (1.0) (0.3) (0.1) (1.1) (1.1)
Euro area-12 2.1 2.2 0.4 0.5 1.7 1.7
(1.3) (1.0) (0.2) (0.1) (1.2) (1.1)
Spain 2.7 3.7 0.2 1.4 2.5 2.4
(1.9) (0.7) (0.1) (0.4) (1.9) (1.1)
SOURCE: Eurostat.
a. The standard deviation is in brackets.b. The EU-3 aggregate includes Germany, France and Italy.
GROWTH OF GDP. POPULATION AND PER CAPITA INCOMEAVERAGE ANNUAL RATE (a)
TABLE 4.1.1

94 Spain and the euro. The fi rst ten years
sustained and in the three biggest countries in the area it was increased. Accord-ingly, Spain’s rate of convergence fell slightly both relative to the euro area (on Eurostat figures the per capita income gap is only 3%) and to the United States (though in this case the gap is 30%). Although the euro area’s biggest countries raised the average growth of their per capita income after 1999, this is still far removed from US growth rates.
Table 4.1.2 offers some information on the sources of per capita income growth over the last decade, breaking this growth down into two different factors: labour intensity and productivity. Greater labour utilisation can be achieved either through increases in the employment rate (the proportion of the working-age population in employment)3 or increases in hours worked per em-ployee. In turn, the employment rate can be broken down into the participation rate (the percentage of the working-age population in employment or actively seeking employment) and (the inverse of ) the unemployment rate (percentage of the labour force seeking employment).
As can be observed, labour intensity has been much greater in the United States than in the euro area. Indeed, the US employment rate has constantly maintained a gap of over 6 pp relative to that of the euro area and annual aver-age hours worked are currently 10% higher in the United States. Secondly, the behaviour of the US and European economies before and after the creation of EMU has been radically different. From 1989 to 1998, the employment rates in both areas held stable; however, from 1999 there was a considerable increase in that in the euro area and a reduction in that in the United States. Adding to this the fact that average hours worked in the United States have also fallen over this period (albeit at a much lesser pace than in the euro area) suggests that
3 To make international comparisons easier, the working-age population is taken to be that in the 15-64 age range.
Employment rate Participation rate Unemployment rate Average hours
1989 1998 2007 1989 1998 2007 1989 1998 2007 1989 1998 2007
United States 73.1 73.8 71.7 77.1 77.3 75.2 5.3 4.5 4.6 1,821 1,867 1,778
EU-3 (b) 59.9 59.2 64.8 65.5 66.6 70.3 8.3 11.1 7.7 1,685 1,641 1,570
Euro area-12 58.5 59.0 65.7 63.7 66.5 71.1 8.2 11.2 7.4 1,722 1,669 1,608
Spain 48.0 51.0 65.6 58.2 62.7 71.6 17.3 18.7 8.3 1,753 1,732 1,635
SOURCE: Eurostat.
a. There may be breaks in the series.b. The EU-3 aggregate includes Germany, France and Italy.
LABOUR UTILISATIONAVERAGE ANNUAL LEVEL (a)
TABLE 4.1.2

The performance of the Spanish economy in EMU 95Á. Estrada, J. F. Jim
eno and J. L. Malo de M
olina
while the growth of US per capita income after 1999 has been based exclusively on the improved efficiency of the labour factor, in the euro area labour inten-sity has played a prominent role. Thirdly, in this connection Spain represents an extreme case within the euro area, since from 1999 its labour intensity has increased significantly, the employment rate reaching the euro area average (and exceeding that of the three biggest economies) while, at the same time, it has maintained a positive gap with regard to average hours worked. If we factor in the enormous growth of the population in our country in this period, it is not surprising that Spain has created more than one-third of all employment gener-ated in the euro area during these years.
The strong increase in the Spanish economy’s employment rate from the start of EMU to 2007 stemmed in virtually equal proportions from an increase in the participation rate and a reduction in the unemployment rate. The rise in the par-ticipation rate was driven by greater female participation and by immigration. As Chart 4.1.1 shows, the inflow of immigrants into Spain began to reach a sig-nificant scale in the years immediately before the creation of EMU. Subsequently, immigration became progressively greater so that, from 2002 onwards, its con-tribution to the growth of total employment was higher than that of nationals. Indeed, although the Spanish economy began to destroy employment at the ag-gregate level in mid-2008, immigrant employment continued increasing until the end of the year. The enormous influx of immigrants into the Spanish economy can be explained by three types of factors: a) factors responsible for their depar-ture from their country of origin; b) permanent factors of attraction; and c) tem-porary factors of attraction. Under the first category, the difference between the
SOURCE: Instituto Nacional de Estadística (INE).
-4
-2
0
2
4
6
90 91 92 93 94 95 96 97 98 99 00 01 02 03 04 05 06 07
IMMIGRANTS NATIONALS TOTAL%
EMPLOYMENT IN SPAINANNUAL GROWTH AND CONTRIBUTIONS
CHART 4.1.1
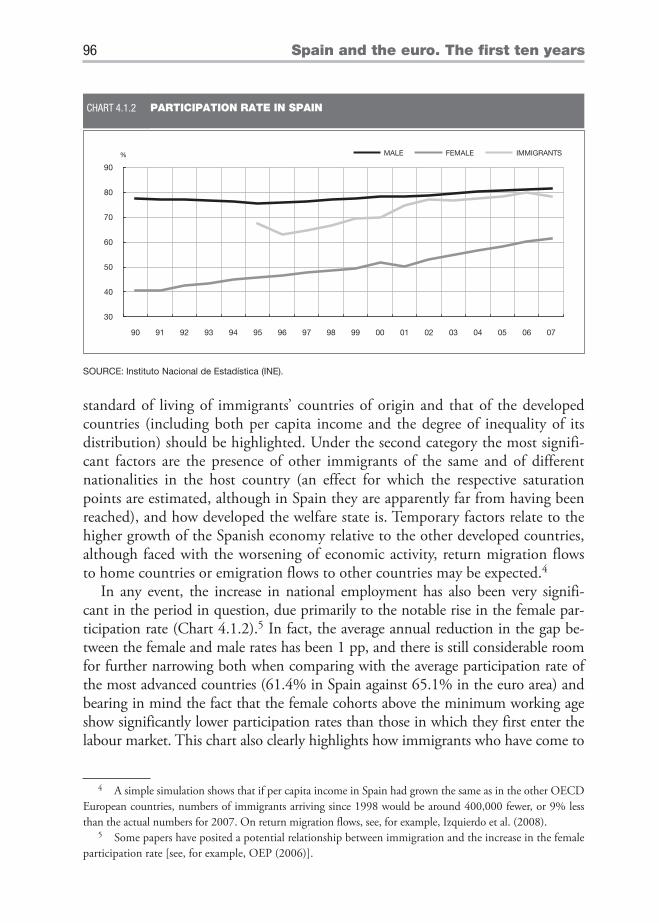
96 Spain and the euro. The fi rst ten years
standard of living of immigrants’ countries of origin and that of the developed countries (including both per capita income and the degree of inequality of its distribution) should be highlighted. Under the second category the most signifi-cant factors are the presence of other immigrants of the same and of different nationalities in the host country (an effect for which the respective saturation points are estimated, although in Spain they are apparently far from having been reached), and how developed the welfare state is. Temporary factors relate to the higher growth of the Spanish economy relative to the other developed countries, although faced with the worsening of economic activity, return migration flows to home countries or emigration flows to other countries may be expected.4
In any event, the increase in national employment has also been very signifi-cant in the period in question, due primarily to the notable rise in the female par-ticipation rate (Chart 4.1.2).5 In fact, the average annual reduction in the gap be-tween the female and male rates has been 1 pp, and there is still considerable room for further narrowing both when comparing with the average participation rate of the most advanced countries (61.4% in Spain against 65.1% in the euro area) and bearing in mind the fact that the female cohorts above the minimum working age show significantly lower participation rates than those in which they first enter the labour market. This chart also clearly highlights how immigrants who have come to
30
40
50
60
70
80
90
90 91 92 93 94 95 96 97 98 99 00 01 02 03 04 05 06 07
MALE FEMALE IMMIGRANTS%
SOURCE: Instituto Nacional de Estadística (INE).
PARTICIPATION RATE IN SPAINCHART 4.1.2
4 A simple simulation shows that if per capita income in Spain had grown the same as in the other OECD European countries, numbers of immigrants arriving since 1998 would be around 400,000 fewer, or 9% less than the actual numbers for 2007. On return migration flows, see, for example, Izquierdo et al. (2008).
5 Some papers have posited a potential relationship between immigration and the increase in the female participation rate [see, for example, OEP (2006)].

The performance of the Spanish economy in EMU 97Á. Estrada, J. F. Jim
eno and J. L. Malo de M
olina
Spain during these years have done so for purely economic reasons: their aggregate participation rate is practically identical to that of male nationals.
As regards the unemployment rate, it is difficult to quantify precisely the causes of its sharp reduction. Some papers have attempted to assess the extent to which the labour reforms since the early 1990s have contributed to lowering the structural rate of unemployment [see, for example, Bentolila and Jimeno (2006), and Izquierdo and Regil (2007)], although there appears to be some consensus that the scope of these reforms is not sufficient to explain such a large and rapid reduction in the unemployment rate. Thus, other papers attribute part of the re-duction to immigration [see, for example, Bentolila, Dolado and Jimeno (2009)], and to the wage restraint during these years prompted, among other factors, by the discipline induced by the process of convergence towards EMU.
Moving to the second of the per capita income components, labour productiv-ity, Table 4.1.3 presents the two indicators habitually used to measure it: apparent labour productivity and total factor productivity (TFP). This table highlights once again the notable dichotomy between the performance of the US economy and that of the euro area before and after 1999. US labour productivity, which was growing less than in the euro area before 1998, quickened significantly in the subsequent decade, in clear contrast to the slowdown recorded in the euro area; accordingly, its growth was almost 1 pp higher in annual average terms. As a result, the euro area ceased to converge with the United States in terms of the degree of efficiency with which the labour factor is used. From this standpoint, Spain’s case is even more ac-centuated than that of the euro area, since the average increase in labour productiv-ity fell by half following the introduction of the euro, even though it started from lower levels than those of the area.
GDP/hour worked Capital/labour ratio TFP
1990-1998 1999-2007 1990-1998 1999-2007 1990-1998 1999-2007
United States 1.5 2.1 3.1 3.5 0.5 0.9
(1.0) (0.8) (1.2) (1.2) (0.8) (0.8)
EU-3 (b) 1.6 1.3 3.3 2.3 0.5 0.5
(1.0) (0.7) (0.8) (0.9) (0.9) (0.6)
Euro area-12 2.0 1.3 3.2 2.2 0.9 0.5
(0.6) (0.6) (0.8) (0.6) (0.7) (0.5)
Spain 1.5 0.7 3.3 2.3 0.4 0.0
(1.6) (0.5) (1.7) (0.7) (1.4) (0.3)
SOURCES: Eurostat. EU-KLEMS and AMECO.
a. The standard deviation is in brackets.b. The EU-3 aggregate includes Germany, France and Italy.
LABOUR AND TOTAL FACTOR PRODUCTIVITYAVERAGE ANNUAL RATE (a)
TABLE 4.1.3

98 Spain and the euro. The fi rst ten years
The higher growth of US labour productivity in the second period considered was the outcome, above all, of the acceleration in TFP (whose annual average growth practically doubled) but also of the step-up in investment, in clear con-trast to developments in the euro area and in most of its members. This result is perhaps surprising when it is borne in mind that the weight of gross fixed capital formation in GDP is 27% in Spain, 21% in the euro area and 19% in the United States. Yet it should be taken into account that the stock of capital used to calcu-late TFP is quality-adjusted, i.e. not all investment goods are considered to be equally productive. Specifically, this reflects the fact that the euro area (and Spain) has fallen behind in incorporating the new ICTs into its productive system and, in Spain’s specific case, it shows the strong increase in housing investment. Yet in the euro area, TFP growth has eased in the past 10 years, although not across the board; in fact, Germany has managed to improve its levels, albeit without at-taining those of the United States, and France has maintained them at pre-EMU levels, which were similar to those now attained by the United States.
In Spain’s case, average TFP growth since the introduction of the euro has been virtually zero. This is surprising since, although there are admittedly still de-ficiencies in the endowment of factors of production that may explain why Span-ish productivity levels are lower than in other European countries (less skilled hu-man capital, a very low stock of technology knowhow due to low investment in R&D, a relatively unfavourable business environment owing to the fact that the degree of competition in certain services and labour markets is low, an underde-veloped enterprise culture, a high administrative burden, etc.), there has also been progress on these fronts that should have resulted in higher productivity growth.
Measurement and estimation difficulties aside, there are in principle several reasons that may explain this slowdown in TFP. First, the bias in growth to-wards relatively unskilled-labour-intensive activities (construction and services) has brought about a negative composition effect on productivity. However, this composition effect cannot explain in full the slowdown in TFP, since it has been observed practically across the board in all sectors of activity. Further, the higher level of educational attainment and the greater weight in employment of skilled jobs also generate a composition effect of the opposite sign that largely offsets that stemming from the rise in the weight of jobs in lower-productivity sectors. Second, just as labour availability may have been conducive to specialisation in specific productive sectors, it may also have prompted firms to use less advanced technologies. Finally, the complementarity between new technologies and corpo-rate restructuring, a primary source of the TFP gains observed in other countries, may have been hampered in Spain’s case by labour regulations that restrict flexible working arrangements at firms to the use of temporary contracts.
The buoyant activity and headway in convergence experienced by the Spanish economy within EMU have arisen from the demand and supply-side conditions

The performance of the Spanish economy in EMU 99Á. Estrada, J. F. Jim
eno and J. L. Malo de M
olina
that its stability regime favoured. But the information available to date suggests that the strength of demand in the economy may have been too great for the capacity of expansion of the supply side, since the increase in productivity was very moderate and the reduction in the unemployment rate was based, to some extent, on the hiring of lower-skilled workers.
One analytical approach to tackling this question involves estimating the output gap, i.e. the difference between actual GDP and the level of output that could be attained without generating inflationary pressures. It is well known that this potential level of output is not observable, but there are several procedures for estimating it. Apart from the most commonly used options, based on purely statistical techniques which involve filtering the series under study without taking into account any of the conditions imposed by economic theory, there are other, much more informative procedures that introduce specific constraints suggested by economic theory and which are not too controversial among researchers.
For instance, Galí et al. (2007) have developed a procedure that highlights a close relationship between the output gap and the degree of inefficiency existing in an economy. This lack of efficiency is determined by two factors. Firstly, that arising from the non-competitive functioning of the market for goods and services, which is reflected in the behaviour of the mark-up of product price over marginal produc-tion cost, i.e. in firms’ monopoly power. The basis for this is that, in the absence of market failings, perfect competition in markets reduces the equilibrium level of prices which, under normal conditions, increases the amount of the good produced and traded, which is one of the determinants of the level of consumer welfare. In this way, monopoly power leads to an inefficiently low level of production of goods and services. Secondly, there is the inefficiency that stems from the non-competitive functioning of the labour market, which is reflected in the mark-up of real wages over consumers’ valuation of leisure (which is the second determinant of the level of agents’ welfare), i.e. the marginal rate of substitution between consumption and lei-sure. In this case, the explanation is that if real wages are higher than the maximum price workers are prepared to pay to increase their leisure time, then an inefficiently low number of workers will be hired at an inefficiently high cost.6
As can be seen in Chart 4.1.3, the inefficiency gap7 has shown some volatility since the 1980s. This measure of the output gap based on the degree of inefficien-cy suggests that, since 1980, the Spanish economy has had two clearly recession-
6 To calculate these mark-ups it is necessary to make assumptions regarding firms’ production technology and consumer preferences. In this connection, we follow the recommendations of Galí et al. (2007), with three particularities: i) consumers also obtain utility from the housing they purchase; ii) the wages received by house-holds exclude all types of contributions and direct taxes; and iii) producer prices exclude indirect taxes.
7 Given the definition of inefficiency gap, it might be expected always to be negative; however, for ease of comparison with other methods of calculating the output gap, it is normalised to zero mean in the period considered.

100 Spain and the euro. The fi rst ten years
ary phases (1983-1986 and 1993-1998) and two expansionary phases (1987-1992 and 1999-2007). The results obtained for 2008 involve a considerable turnaround in the economy’s cyclical position, comparable only in terms of its intensity to the events that followed the second oil shock in the early 1980s; everything suggests that, in 2009, the inefficiency gap will exceed the historical low reached in 1985.
Chart 4.1.4 depicts the disaggregation of the inefficiency gap into the product market mark-up and the labour market mark-up. Firstly, the fluctuations in the labour market mark-up are much greater than those of the market for goods and services (note that the chart has different scales for each variable), meaning that, as in Galí et al. (2007), labour market inefficiencies (with the sign changed) are the main determinants of changes in the aggregate degree of inefficiency. This might be a consequence of the fact that a substantial proportion of the markets for goods and services are open to international competition, which exerts a very significant disciplining effect on tradeable goods markets. Secondly, the contem-poraneous correlation between both mark-ups is not statistically significant. This may be a consequence of the presence of the public sector, which can influence private agents’ decisions both through the regulations it imposes on markets and through the taxes and subsidies it sets. Thirdly, the recessions the Spanish econo-my has undergone appear always to have been preceded by a significant increase in product market mark-ups, so that the increase in monopoly power linked to demand pressure, when the expansionary phase matures, acts as a trigger for such recessions. This process is followed by a significant increase in the wage mark-up which, subsequently, further heightens recessionary processes. Likewise, expan-sions are also preceded by an increase in price mark-ups, once the cyclical adjust-ment leads to a significant reduction in labour market inefficiencies.
-20
-10
0
10
20
81 82 83 84 85 86 87 88 89 90 91 92 93 94 95 96 97 98 99 00 01 02 03 04 05 06 07 08
%
SOURCES: INE and Banco de España.
INEFFICIENCY GAP AS A PERCENTAGE OF GDP
CHART 4.1.3

The performance of the Spanish economy in EMU 101Á. Estrada, J. F. Jim
eno and J. L. Malo de M
olina
4.2 Imbalances
As highlighted, the growth in the Spanish economy in the 1999-2007 pe-riod was based on foundations that could not be maintained indefinitely. The notable demand stimulus was only partially accommodated by a quantitative expansion of output, based on an exceptional increase in the rate of employ-ment. This was not adequately matched by an improvement in productivity, since the capitalisation of the economy failed to provide for convergence on the levels prevailing in the more developed countries and gains in efficiency were not sufficiently sharp. A series of imbalances thus began to emerge during this period, undermining the dynamism of the expansion. And, as there were no significant changes in agents’ patterns of behaviour, the imbalances led to the need for an adjustment. As is usually the case in economics, all these imbal-ances are very closely related, given that they are not generated sequentially but jointly and in a mutually reinforcing fashion. For the purposes of presentation, the imbalances have been grouped under three major headings: a) inflation dif-ferentials, the appreciation of the real exchange rate and the external financing of the economy; b) property sector developments; and c) household and corpo-rate debt.
4.2.1 Inflation differentials, appreciation of the real exchange rate and the financing of the economy
One of the basic advantages for the Spanish economy of EMU entry was that it could gain the necessary credibility to reduce the average level of inflation with-out incurring real costs which, owing to the rigidities in the market for goods
-16
-8
0
8
16
-4
-2
0
2
4
81 82 83 84 85 86 87 88 89 90 91 92 93 94 95 96 97 98 99 00 01 02 03 04 05 06 07 08
PRODUCT MARKET
LABOUR MARKET (right-hand scale)
% %
SOURCES: INE and Banco de España.
MARK-UPS IN THE GOODS AND SERVICES MARKET ANDIN THE LAB0UR MARKETAS A PERCENTAGE OF GDP
CHART 4.1.4
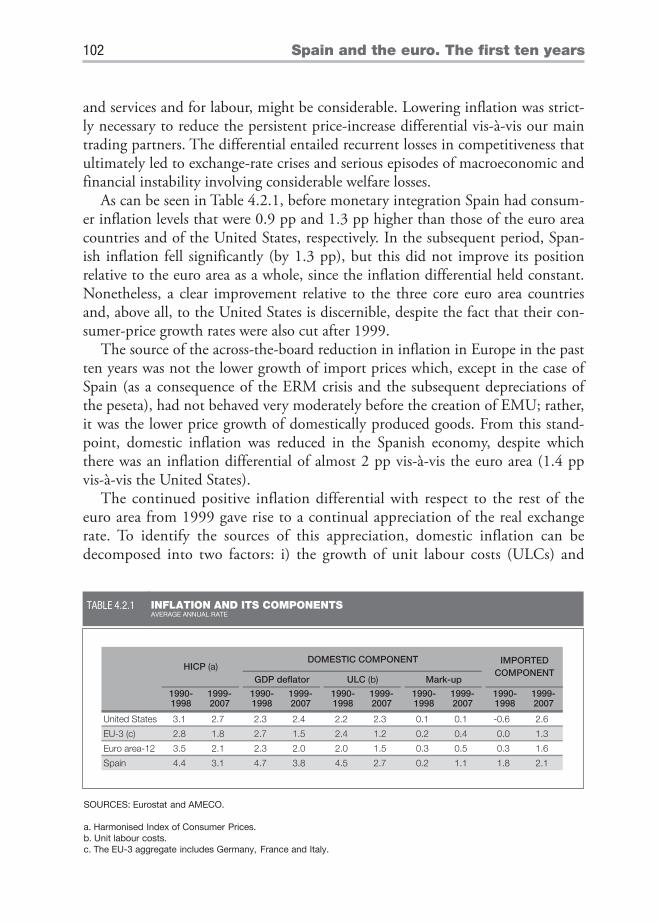
102 Spain and the euro. The fi rst ten years
and services and for labour, might be considerable. Lowering inflation was strict-ly necessary to reduce the persistent price-increase differential vis-à-vis our main trading partners. The differential entailed recurrent losses in competitiveness that ultimately led to exchange-rate crises and serious episodes of macroeconomic and financial instability involving considerable welfare losses.
As can be seen in Table 4.2.1, before monetary integration Spain had consum-er inflation levels that were 0.9 pp and 1.3 pp higher than those of the euro area countries and of the United States, respectively. In the subsequent period, Span-ish inflation fell significantly (by 1.3 pp), but this did not improve its position relative to the euro area as a whole, since the inflation differential held constant. Nonetheless, a clear improvement relative to the three core euro area countries and, above all, to the United States is discernible, despite the fact that their con-sumer-price growth rates were also cut after 1999.
The source of the across-the-board reduction in inflation in Europe in the past ten years was not the lower growth of import prices which, except in the case of Spain (as a consequence of the ERM crisis and the subsequent depreciations of the peseta), had not behaved very moderately before the creation of EMU; rather, it was the lower price growth of domestically produced goods. From this stand-point, domestic inflation was reduced in the Spanish economy, despite which there was an inflation differential of almost 2 pp vis-à-vis the euro area (1.4 pp vis-à-vis the United States).
The continued positive inflation differential with respect to the rest of the euro area from 1999 gave rise to a continual appreciation of the real exchange rate. To identify the sources of this appreciation, domestic inflation can be decomposed into two factors: i) the growth of unit labour costs (ULCs) and
DOMESTIC COMPONENT
GDP deflator ULC (b) Mark-up
1990-1998
1999-2007
1990-1998
1999-2007
1990-1998
1999-2007
1990-1998
1999-2007
1990-1998
1999-2007
United States 3.1 2.7 2.3 2.4 2.2 2.3 0.1 0.1 -0.6 2.6
EU-3 (c) 2.8 1.8 2.7 1.5 2.4 1.2 0.2 0.4 0.0 1.3
Euro area-12 3.5 2.1 2.3 2.0 2.0 1.5 0.3 0.5 0.3 1.6
Spain 4.4 3.1 4.7 3.8 4.5 2.7 0.2 1.1 1.8 2.1
HICP (a)IMPORTED
COMPONENT
SOURCES: Eurostat and AMECO.
a. Harmonised Index of Consumer Prices.b. Unit labour costs.c. The EU-3 aggregate includes Germany, France and Italy.
INFLATION AND ITS COMPONENTSAVERAGE ANNUAL RATE
TABLE 4.2.1
The performance of the Spanish economy in EMU 103Á. Estrada, J. F. Jim
eno and J. L. Malo de M
olina
ii) developments in gross profit margins (the difference between inflation and ULCs). Unlike in the US economy, where margins have held at very low levels, in the euro area they have risen to some extent, with the weight of the inflation adjustment falling on ULCs and, given the aforementioned slowdown in pro-ductivity, on nominal (and real) wages. In this respect, Spain is an extreme case in the euro area since the increase in margins steepened after 1999, and nomi-nal wages (and ULCs, all the more so given lower productivity growth) contin-ued growing at above the related euro area average. That suggests that neither wage behaviour nor the formation of business margins appear to have adapted fully to the demands of membership of a monetary union, and this is having an adverse effect on the competitiveness of our economy. This lack of adaptation is a factor of vulnerability whose consequences may be particularly patent if the adjustment coincides with adverse external conditions as at present.
From a more structural perspective, the inflation differential of an economy such as Spain’s, which belongs to a monetary union but which started with a lower level of welfare, may be broken down into three elements. First, a real component, associated with convergence on the area’s average level of welfare, which should thus be considered as benign. This is what is known as the Balas-sa-Samuelson effect. The intuition behind this is that the difference in welfare levels between two countries lies in the different technological level in the man-ufacture of tradeable goods, while in the production of non-tradeable goods the technologies are much more similar. Conversely, the sale prices of trade-able goods should be equal in the two countries, as there are no restrictions on trade between them. In contrast, the prices of non-tradeable goods may differ and, indeed, they should be lower in the countries with a lower standard of living. As time goes by, the laggard country progressively incorporates the supe-rior technology for producing tradeable goods used in the other country, duly increasing the productivity and, consequently, workers’ wages in this branch. But as individuals may work in either the tradeable or non-tradeable products branch, their wages should be identical, whereupon the wages of workers in the non-tradeables branch will also increase. However, as their productivity does not improve, and given a constant mark-up, the attendant prices will be pushed upwards, raising aggregate inflation. Consequently, this model has at least five predictions susceptible to empirical testing: a) countries with a lower level of welfare will have lower price levels; b) convergence in per capita in-come will entail convergence in price levels, meaning inflation in the country that converges will be higher; c) there will, moreover, be dual inflation, with a higher increase in prices in the non-tradeable sectors; d) convergence should be determined by higher productivity growth in the laggard country; and e) there should also be a productivity growth differential between the tradeable and non-tradeable branches.

104 Spain and the euro. The fi rst ten years
The evidence for Spain on the existence of a benign inflation component as-sociated with an increase in citizens’ welfare is not overly compelling. True, for the euro area countries there is a positive correlation between price and welfare levels (see Chart 4.2.1). Moreover, in Spain’s specific case, the increase in the price level relative to the euro area can be seen to have been accompanied by convergence in the relative welfare level (Chart 4.2.1 tracks the course followed by Spain since 1995).
However, regarding the third prediction of the Balassa-Samuelson hypoth-esis, namely dual inflation, the conclusions differ (see Table 4.2.2). This table shows how in all the countries and in both periods inflation in the tradeables branches is lower than that in the non-tradeables branches, suggesting there are other mechanisms, besides real convergence, explaining this phenomenon. Fur-ther, this is more surprising in Spain’s case since, although inflation has fallen following Monetary Union in the tradeables branch, the differential with re-spect to the euro area has widened. In contrast, in the case of non-tradeables, the reduction in inflation has been greater than in tradeables, and the differen-tial with the euro area has narrowed.
Turning to the determinants, in the case of tradeables a generalised im-provement in the margins of all countries can be seen, which is not overly consistent with the fact that EMU entails an increase in transparency and competition among firms. However, this might be the result of globalisation, which causes the activities with most value added (those that are most prof-itable) to be retained in the country of origin while externalising labour-in-tensive activities to the developing countries (note that the weight of indus-
y = 0.6305x + 32.769R2 = 0.6558
60
80
100
120
140
60 70 80 90 100 110 120 130 140
PR
ICE
LE
VE
L (%
EU
RO
AR
EA)
PER CAPITA INCOME (% EURO AREA)
1995
1999
2007SPAIN
SOURCES: Eurostat and Banco de España.
PRICE LEVELS AND WELFARE IN THE MONETARY UNIONCHART 4.2.1

The performance of the Spanish economy in EMU 105Á. Estrada, J. F. Jim
eno and J. L. Malo de M
olina
try has fallen over these years in all the developed countries). Accordingly, the inflation adjustment has fallen on ULCs, which have declined on average in all countries since 1999 except in Spain. Conversely, in the case of the non-tradeables branches, accelerations in margins can only be seen in the United States and in Spain. In both cases this is the consequence, in particular, of the construction sector. In contrast, the adjustment of ULCs is much more mod-erate than in tradeable goods. Lastly, the adjustment in the growth of ULCs in the non-tradeables branch in Spain has been considerable, due above all to the fact that most immigrant employment has been directed towards this sector and that the wages of this group are around 20% lower than for nationals; in any event, ULC growth is still far higher than in the euro area countries or the United States.
As earlier highlighted in Table 4.2.3, the growth of both labour productiv-ity and of TFP has been lower than in the more advanced countries. As a re-sult the Spanish economy, which started out some distance back, has moved even further from the standards towards which it should aspire to converge. Conceivably, however, this behaviour might be due, rather than to the exist-ence of a benign component in the inflation differential, to a shift in activity in Spain towards branches, like construction, which are less productive. Table 4.2.3 provides some information on this issue. As can readily be seen from a separate analysis of productivity developments in the tradeables and non-trade-ables branches, in all countries and in both sub-periods, productivity in the former branch increases much more quickly than in the latter. This suggests, once again, that the Balassa-Samuelson hypothesis is not the only argument to warrant a productivity growth differential in favour of the branches exposed to international competition in countries with a lower welfare level. Furthermore, productivity growth in Spain is lower than that of these countries both in the
TRADEABLES NON-TRADEABLES
GDP deflator ULC (a) Mark-up GDP deflator ULC (a) Mark-up1990-1998
1999-2007
1990-1998
1999-2007
1990-1998
1999-2007
1990-1998
1999-2007
1990-1998
1999-2007
1990-1998
1999-2007
United States 0.4 0.2 -0.2 -0.6 0.5 0.8 2.7 2.7 3.1 2.4 -0.5 0.3
EU-3 (b) 1.7 0.2 1.7 -0.3 -0.1 0.5 2.7 1.8 2.0 1.5 0.7 0.3
Euro area-12 1.2 0.6 1.4 -0.2 -0.2 0.8 2.4 2.2 2.1 1.8 0.3 0.4
Spain 3.0 2.6 4.9 1.5 -1.9 1.1 5.8 4.3 6.6 3.3 -0.8 0.9
SOURCES: Eurostat and AMECO.
a. Unit labour costs.b. The EU-3 aggregate includes Germany, France and Italy.
BREAKDOWN OF DOMESTICALLY GENERATED INFLATION AVERAGE ANNUAL RATE
TABLE 4.2.2

106 Spain and the euro. The fi rst ten years
tradeables and non-tradeables branches, and this is not merely the reflection of a lower rate of capitalisation in the economy. Yet, on the positive side, the dif-ferences in growth have been reduced in the EMU membership phase. Lastly, it is also illustrative that the bigger increase in aggregate productivity in the United States in the second sub-period is due to an acceleration in the tradea-bles and non-tradeables branches, which is consistent with the hypothesis that it is the branches that use and produce ICTs that are responsible for this phe-nomenon.
A second factor potentially behind this inflation differential between Spain and the euro area is the considerable pressure of demand that the Spanish pro-ductive system has had to face. As noted in the previous section, the Spanish economy’s output gap has been positive practically since 1999 owing to the re-duction in interest rates, the influx of immigrants, the expansion of employment and the rise in the value of real assets, among other factors. Nonetheless, in the euro area demand pressures remained more contained.
To test whether demand pressure may explain part of the Spanish economy’s inflation differential, Chart 4.2.2 performs a very simple exercise. Its vertical axis shows the services inflation differential vis-à-vis non-energy industrial goods for the euro area countries (according to the harmonised indices of consumer prices for the 1990-2007 period), and its horizontal axis shows the trend output gap (which is highly correlated with other gaps that take into account the restrictions imposed by economic theory) for these same countries over the same period. The idea behind this exercise is that if demand pressure has an inflation-increasing effect, this should be discernible above all in the price of services, since as these are mostly non-tradeable products, they do not have the potentially unlimited supply that tradeable goods have via imports, at least in the short run. However, developments in non-energy industrial goods prices should be taken into account
TRADEABLES NON-TRADEABLES
Productivity/hour worked
Capital/hour worked
TFPProductivity/
hour workedCapital/hour
workedTFP
1990-1998
1999-2007
1990-1998
1999-2007
1990-1998
1999-2007
1990-1998
1999-2007
1990-1998
1999-2007
1990-1998
1999-2007
United States 3.8 5.3 4.0 4.7 2.5 3.8 0.9 2.0 3.2 3.6 -0.5 0.5
EU-3 (a) 2.9 3.0 4.3 3.1 1.5 2.0 1.8 0.9 3.0 2.1 0.5 0.0
Euro area-12 2.9 3.2 4.3 3.2 1.5 2.1 1.5 0.9 2.7 2.0 0.4 0.0
Spain 1.2 1.9 3.2 2.9 0.2 1.0 -1.2 0.0 2.8 2.4 -2.4 -1.0
SOURCES: Eurostat and AMECO.
a. The EU-3 aggregate includes Germany, France and Italy.
PRODUCTIVITY IN THE TRADEABLES AND NON-TRADEABLES SECTORS AVERAGE ANNUAL RATE
TABLE 4.2.3

The performance of the Spanish economy in EMU 107Á. Estrada, J. F. Jim
eno and J. L. Malo de M
olina
in order to normalise (as far as possible) the monetary conditions prevailing in the economy.8
As can be seen, there is a positive (and statistically significant) association be-tween these two variables, although most of the observations tend to be in the upper section of the chart, meaning that on average there is a positive inflation differential (of almost 2 pp) between the two products. Initially, in the early 1990s, the Spanish economy had one of the highest differentials of the countries considered; however, the abrupt adjustment in activity in the middle of this dec-ade meant that for two consecutive years (1994 and 1995) this differential turned negative.9 Subsequently, the behaviour of this differential in Spain has been con-sistent with the relationship between these two variables in the other euro area countries, although most observations tend to be above the regression line. This suggests, first, that the medium-term inflation differential between these two types of products has been somewhat wider in Spain’s case and, further, that de-mand pressure in Spain has also been greater.
A further factor potentially contributing to the existence of inflation differen-tials between countries belonging to a common monetary area is that which arises
8 It could be argued that non-energy industrial goods prices in the HICP also have a large non-tradea-ble component, since they include product marketing margins and trade is (practically) neither imported nor exported. Accordingly, the same exercise was repeated normalising with the producer prices of consumer goods, with qualitatively similar results being obtained. It was deemed preferable to leave the results with the HICP since these series are obtained with a methodology common to all the countries considered.
9 In the past two decades such an adjustment has only been observed in Germany, on the occasion of reunification (1990 and 1991), and in Finland, following the break-up of the Soviet Union (1994 and 1995).
y = 0.2873x + 1.9027
R2 = 0.0619
-10
-5
0
5
10
-10 -8 -6 -4 -2 0 2 4 6 8 10
SPAIN
INF
LATIO
ND
IFFE
RE
NTIA
L(%
)
OUTPUT GAP (% TREND OUTPUT)
CHART 4.2.2 INFLATION DIFFERENTIAL AND OUTPUT GAP
SOURCES: Eurostat, EU-KLEMS and Banco de España.

108 Spain and the euro. The fi rst ten years
from the combination of expansionary demand shocks (common or specific to each country) with a differing degree of real rigidity in product markets and in nominal price inertia. Andrés et al. (2008) show how countries with a greater lev-el of competition in their markets have a lesser degree of real rigidity in inflation; consequently, in the face of an expansionary demand shock, inflation will tend to increase more in the country with less monopoly power. This is due to the fact that the more competition a firm has to face, the more its profits will diminish if it does not set prices in keeping with its fundamentals. Similarly, the lower the nominal inertia in price setting, the greater the reaction of inflation will be to an expansionary demand shock, since prices are less dependent on past conditions.
In recent years, many researchers have attempted to analyse whether the euro area countries show differences in this respect, by estimating the so-called “new Phillips curves”. One of the most systematic analyses is by Rumler (2005), as part of the Inflation Persistence Network (IPN) created by the European System of Cen-tral Banks to analyse this type of issue and to clarify how it might affect monetary policy implementation in the area. The main findings are shown in Chart 4.2.3. Here, the degree of sensitivity of inflation to the real conditions in the economy (i.e. the inverse of the degree of real rigidity) is identified by the parameter that multiplies the marginal production costs, while nominal inertia corresponds to the parameter that multiplies the inflation of the immediately prior period. Evidently, Spain is, with the sole exception of France, the country that shows the greatest sen-sitivity of inflation to the real conditions in the economy, which suggests that there is a greater degree of competition in product markets, as corroborated in Estrada (2008). Moreover, Spain is the country that has least nominal inertia. This means that, even if all the euro area countries had faced identical expansionary demand shocks, inflation in Spain would have been higher, the result being an accentuation of the differences associated with the fact that the shocks were greater in our case.
Nonetheless, translating the inflation differential into losses in competitiveness, when a differential cannot be attributed to benign factors, is neither straightfor-ward nor immediate. Chart 4.2.4 shows that between 1999 and 2007, despite the deterioration in the real exchange rate, Spain’s world export share held stable, unlike the reduction in the United States (4 pp) and in the three main euro area economies (over 2 pp).10 Yet it should be taken into account that, controlling for size, Spain’s export share in world markets is relatively low by international stand-ards. Hence, Spain should seek to increase significantly its share in world trade.
Competitiveness is not only measured by the efficiency with which Spanish prod-ucts are sold abroad, but also by the ease with which foreign products are introduced into our economy. From this standpoint the situation is also unfavourable, since the
10 Specifically, the share held up in Germany, but declined in Italy (0.7 pp) and, above all, in France (1.5 pp).

The performance of the Spanish economy in EMU 109Á. Estrada, J. F. Jim
eno and J. L. Malo de M
olina
weight of imports in final demand rose from 22% in 1998 to 29% in 2007. This is not surprising given the estimates in Tables 4.2.2 and 4.2.3, which show how infla-tion for domestically manufactured goods remained higher than that for imported products. Compounding this deterioration of the trade balance against the back-ground of demand pressures have been other changes that have tended to increase the nation’s net borrowing. Such is the case of the reduction in the tourism balance, the fact that – as a result of immigration – Spain has moved from being a net re-cipient of remittances to a net payer, and the fall in net transfers from the European
0.0
0.1
0.2
0.3
0.4
0.5
0.6
0.7
AUSTRIA BELGIUM GERMANY SPAIN FINLAND FRANCE GREECE ITALY NETHERLANDS
DEGREE OF REAL SENSITIVITY DEGREE OF NOMINAL INERTIA%
SOURCE: Rumler (2005).
DEGREE OF REAL SENSITIVITY AND NOMINAL INERTIA OF INFLATIONCHART 4.2.3
0
5
10
15
20
25
90 91 92 93 94 95 96 97 98 99 00 01 02 03 04 05 06 07
UNITED STATES EU-3 SPAIN%
SOURCES: Eurostat, IMF, INE and Banco de España.
EXPORT SHARES AS A PERCENTAGE OF WORLD TRADE
CHART 4.2.4

110 Spain and the euro. The fi rst ten years
Union (which at one point accounted for 1% of GDP), in keeping with the conver-gence achieved. As a consequence, the nation’s net borrowing has increased to 10% of GDP, in circumstances marked by the high cost of energy imports, when in the past this figure had averaged around 3% (see Chart 4.2.5).
From a sectoral standpoint, it is households and firms that have been chiefly re-sponsible for the large increase in net borrowing. As a result of the real estate boom, these agents switched from generating funds to demanding them (this is analysed in greater detail elsewhere in the paper). In contrast, the public sector contributed to lessening net borrowing having posted successive surpluses from 2005 to 2007. The latest developments show that this contribution of the public sector was hardly sustainable, since the surpluses were obtained, primarily, due to an increase in rev-enue that could not be indefinite, since it was closely linked to the over-expansion of the real estate sector; that said, public spending growth continued to outpace nominal GDP in practically every year of EMU membership. At a greater level of detail, both the State and the Social Security system posted significant surpluses, enabling a reserve fund for pension payments (currently at over 5% of GDP) to be created that would offset, at least in part, the effects of the foreseeable future ageing of the population. In contrast, regional and local governments assumed greater cur-rent expenditure obligations financed by this extraordinary increase in revenue.
The financing of the external deficit had not posed problems until the inter-national financial crises broke. Country-risk premiums had disappeared in prac-tice and Spain was obtaining more financing than it needed to cover its domestic requirements. Indeed, Spanish firms were able to use funding facilities to press ahead with internationalisation, especially by seizing the opportunities arising in
-15
-10
-5
0
5
10
90 91 92 93 94 95 96 97 98 99 00 01 02 03 04 05 06 07
HOUSEHOLDS FIRMS GENERAL GOVERNMENT TOTAL%
SOURCES: INE and Banco de España.
SECTORAL FINANCING SURPLUS (+) OR DEFICIT (-) AS A PERCENTAGE OF GDP
CHART 4.2.5

The performance of the Spanish economy in EMU 111Á. Estrada, J. F. Jim
eno and J. L. Malo de M
olina
Latin America as a consequence of the privatisation of former State monopolies. As Chart 4.2.6 shows, Spain changed from being a net recipient of foreign direct investment into a net investor.
The substantial resources needed were raised through portfolio and other in-vestment flows, mainly by Spanish financial institutions through the issuance of covered bonds and other simple mortgage-backed securities at relatively long terms and without the moral hazard problems implicit in complex securitisa-tion operations. The functioning of these arrangements highlighted the non-existence of external financial constraints when a country is part of a monetary union, where what counts is the credit confidence of borrowers, without any interference from factors of risk arising directly from the country’s macroeco-nomic equilibrium situation. The absence of this constraint did not, however, mean that the external imbalance was meaningless or that sizeable external net borrowing was not a potential factor of vulnerability. The external deficit re-flected determinants of income generation and of spending decisions that en-tailed a trend of rising debt that could only be financed abroad and which posed risks in terms of sustainability, leaving the economy particularly sensitive to the climate on international financial markets. The coincidence of the adjustment of the Spanish economy with the emergence of a serious international financial crisis would escalate the potential importance of these risks to a level that could hardly have been foreseen.
4.2.2 Real estate sector developmentsOne of the key factors in the growth of economic activity over the past decade
was the real estate boom. Indeed, when analysing the growth of GDP from the
-12
-8
-4
0
4
8
AVERAGE 1990-1998 AVERAGE 1999-2007
SPANISH DIRECT INVESTMENT DIRECT INVESTMENT IN SPAINSPANISH PORTFOLIO INVESTMENT
PORTFOLIO INVESTMENT IN SPAINSPANISH OTHER INVESTMENT OTHER INVESTMENT IN SPAIN
SOURCES: INE and Banco de España.
FINANCIAL ACCOUNT OF THE BALANCE OF PAYMENTS AS A PERCENTAGE OF GDP
CHART 4.2.6

112 Spain and the euro. The fi rst ten years
standpoint of demand, it is clear that the expansion of the Spanish economy tilt-ed excessively towards investment in housing. As Table 4.2.4 shows, the resources allocated to investment in housing increased by almost 2 pp in Spain, whereas in the United States, where there was also an intense real estate boom, the weight of such resources in GDP held stable.
The rise in US external debt was the outcome, above all, of a substantial in-crease in consumption, while the greater weight of investment in equipment was offset by fewer resources being allocated to infrastructure. In Spain’s case, al-though there was considerable productive investment and, in recent years, infra-structure investment, this did not suffice to check the reallocation of resources towards non-tradeable activities. The corollary of this was the enormous increase in the trade deficit and, consequently, in external debt. Conversely, in other Eu-ropean countries, as in the United States, infrastructure investment was replaced by investment in equipment, but without such expansionary behaviour by pri-vate consumption, which resulted in a significant increase in the trade surplus of the euro area as a whole, and above all of the three biggest economies, particu-larly in Germany.
This strong expansion in real estate activity was driven by the availability of abundant credit and unskilled labour. As earlier noted, EMU membership en-tailed a notable reduction in interest rates and an increased availability of loana-ble funds, which gave previously excluded groups access to housing and boost-ed second-home purchases. The buoyancy of credit was particularly intense in sectors such as construction where it is easier to provide an asset as collateral (see Arce, Campa and Gavilán, 2008). This prompted an increase in construc-tion activity and, consequently, an expansion in the demand for labour. Here, Spain had considerable reserves to draw on given its high unemployment rate and low participation rate, which enabled this demand initially to be met by
Privateconsumption
Equipmentinvestment
Housinginvestment
Investmentin other
constructionTrade balance
1990-1998
1999-2007
1990-1998
1999-2007
1990-1998
1999-2007
1990-1998
1999-2007
1990-1998
1999-2007
United States 67.4 70.3 6.8 9.6 4.4 4.8 5.2 4.5 -0.9 -4.7
EU-3 (a) 58.3 58.2 7.0 7.7 6.1 5.5 5.9 5.1 0.4 1.5
Euro area-12 58.4 57.7 7.0 8.1 5.8 5.7 5.9 5.5 0.5 1.1
Spain 60.1 59.9 6.4 8.0 5.0 6.8 8.1 7.7 -1.2 -5.8
SOURCES: Eurostat and AMECO.
a. The EU-3 aggregate includes Germany, France and Italy.
EXPENDITURE COMPOSITION OF GDPAVERAGE PERCENTAGE
TABLE 4.2.4

The performance of the Spanish economy in EMU 113Á. Estrada, J. F. Jim
eno and J. L. Malo de M
olina
nationals. Very soon, however, the buoyancy of employment triggered, as seen, a sharp increase in immigration, which would re-fuel the demand for residen-tial services.
Yet although supply responded swiftly (Chart 4.2.7 shows how the weight of investment in housing in GDP began to increase sustainedly from the mid-1990s), it did not suffice to prevent a notable climb in house prices as from 1999 (see Chart 4.2.8). As a result housing became one of the most profitable and at-tractive assets, which boosted the demand for it as an investment and led to an excessive expansion of the sector. Specifically, at the height of the boom there were more than 800,000 housing starts per year, more than in Germany, France and Italy combined. The easing of restrictions on construction in response to the ex-pected return on real estate projects, despite the rigidities in town planning proc-esses, meant that the price elasticity of supply of new housing was particularly high (Bover and Jimeno, 2007). As a result, the weight of investment in housing in GDP stood more than 1.5 pp higher than in the euro area (see Chart 4.2.7).
Admittedly, Spain’s demographic fundamentals and advantages as a location for non-residents’ second homes provide a solid basis for the future demand for housing. But the forceful real estate expansion under particularly lax conditions ultimately generated substantial excesses both in terms of overpricing and over-production. Given the long lead-times for housing and the information shortcom-ings in this market, the expansion continued even when the short-term determi-nants had already begun to erode the attractiveness of house purchases. Finished housing would thus reach an all-time peak when demand had fallen off drastically given the widespread perception of the need for an adjustment following such an
0
2
4
6
8
90 91 92 93 94 95 96 97 98 99 00 01 02 03 04 05 06 07
UNITED STATES EU-3 EURO AREA SPAIN%
SOURCES: Eurostat and Banco de España.
WEIGHT OF HOUSING INVESTMENTAS A PERCENTAGE OF GDP
CHART 4.2.7

114 Spain and the euro. The fi rst ten years
exceptionally long and intense period of expansion. At the same time, this percep-tion was compounded by an international financial crisis whose roots lay deep in the excesses of the US real estate market. The outcome was the build-up of a large supply surplus that would exert pressure to correct the overvaluation. The adjustment of house prices started the change in trend in Spain a year earlier than in the United States and in the euro area (the starting point was, nonetheless, at a far higher level), although the correction of the overvaluation is following a less pronounced path, reflecting the major differences between the characteristics and fundamentals of the respective real estate markets (see Chart 4.2.8).
The intensity of the imbalance that built up in the real estate sector ultimately acted as the main trigger for the adjustment and for the recessionary trends that would spread across the whole of the Spanish economy.
4.2.3 Household and corporate debtDevelopments in Spanish household and corporate credit have been close-
ly linked to the real estate boom and to the appreciation of the real exchange rate. The improvement in the Spanish economy’s growth expectations as a re-sult of membership of the EU first, and of EMU later, the reduction in interest rates and readier access to credit all boosted the rise in Spanish household debt. Much of the growth of credit was used to purchase real estate assets, which were very attractive under the new macroeconomic and financial conditions, giving rise to a strong increase in house prices and in activity in the residential construction sector. In turn, the rise in real estate wealth generated fresh in-creases in credit, insofar as real estate acted as collateral for the granting of new loans.
-10
-5
0
5
10
15
20
90 91 92 93 94 95 96 97 98 99 00 01 02 03 04 05 06 07
UNITED STATES EU-3 EURO AREA SPAIN%
SOURCES: Ministerio de Vivienda and Banco de España.
HOUSE PRICESREAL RATE OF CHANGE
CHART 4.2.8

The performance of the Spanish economy in EMU 115Á. Estrada, J. F. Jim
eno and J. L. Malo de M
olina
As regards households, the growth of debt was particularly high following EMU entry. As can be seen in Chart 4.2.9, the debt/gross disposable income ra-tio moved on a rising trend from 1995, which became more pronounced from 1999. In the mid-1990s, Spain’s rate of indebtedness was higher than the EU av-erage but still below that of the United States and the United Kingdom.
The availability of macroeconomic data on household income, debt and wealth allows a more detailed analysis of the extent of the growth of indebt-edness. Chart 4.2.10 plots the debt/gross wealth ratio against the household
0
20
40
60
80
100
120
140
160
180
95 96 97 98 99 00 01 02 03 04 05 06 07
GERMANY SPAIN UNITED STATES EU UNITED KINGDOM%
SOURCES: Eurostat, INE and Banco de España.
RATIO OF HOUSEHOLD DEBT TO GROSS DISPOSABLE INCOMECHART 4.2.9
0
20
40
60
80
100
0-20 20-40 40-60 60-80 80-90 90-100
SPAIN 2002 SPAIN 2005 ITALY 2002
ITALY 2006 UNITED STATES 2001 UNITED STATES 2004
% G
RO
SS
WE
AL
TH
PERCENTILE OF INCOME
SOURCES: Banca d'Italia, US Federal Reserve and Banco de España.
RATIO OF HOUSEHOLD DEBT TO GROSS WEALTH BY PERCENTILE OF INCOME
CHART 4.2.10
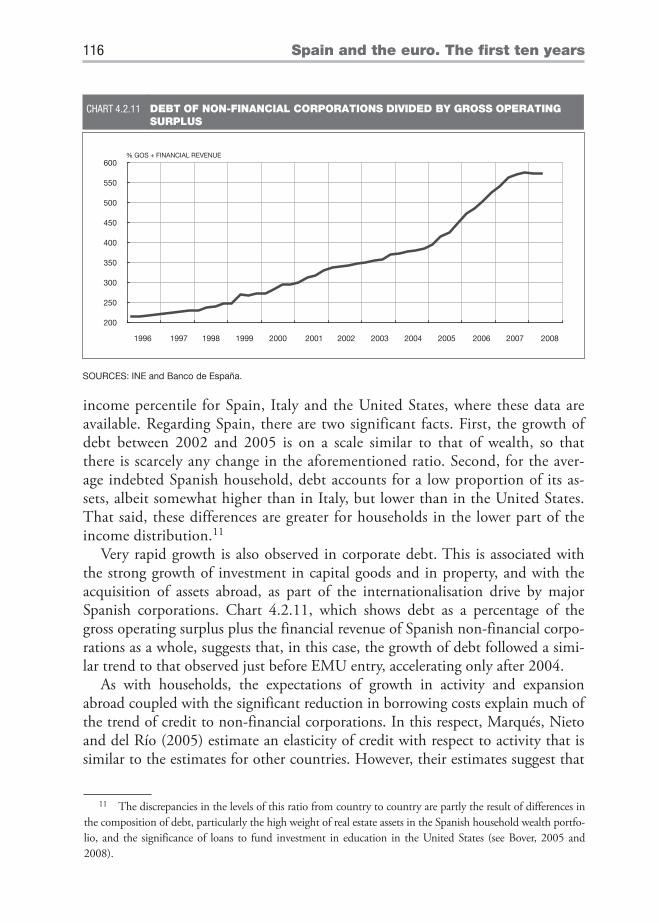
116 Spain and the euro. The fi rst ten years
income percentile for Spain, Italy and the United States, where these data are available. Regarding Spain, there are two significant facts. First, the growth of debt between 2002 and 2005 is on a scale similar to that of wealth, so that there is scarcely any change in the aforementioned ratio. Second, for the aver-age indebted Spanish household, debt accounts for a low proportion of its as-sets, albeit somewhat higher than in Italy, but lower than in the United States. That said, these differences are greater for households in the lower part of the income distribution.11
Very rapid growth is also observed in corporate debt. This is associated with the strong growth of investment in capital goods and in property, and with the acquisition of assets abroad, as part of the internationalisation drive by major Spanish corporations. Chart 4.2.11, which shows debt as a percentage of the gross operating surplus plus the financial revenue of Spanish non-financial corpo-rations as a whole, suggests that, in this case, the growth of debt followed a simi-lar trend to that observed just before EMU entry, accelerating only after 2004.
As with households, the expectations of growth in activity and expansion abroad coupled with the significant reduction in borrowing costs explain much of the trend of credit to non-financial corporations. In this respect, Marqués, Nieto and del Río (2005) estimate an elasticity of credit with respect to activity that is similar to the estimates for other countries. However, their estimates suggest that
11 The discrepancies in the levels of this ratio from country to country are partly the result of differences in the composition of debt, particularly the high weight of real estate assets in the Spanish household wealth portfo-lio, and the significance of loans to fund investment in education in the United States (see Bover, 2005 and 2008).
200
250
300
350
400
450
500
550
600
1996 1997 1998 1999 2000 2001 2002 2003 2004 2005 2006 2007 2008
% GOS + FINANCIAL REVENUE
SOURCES: INE and Banco de España.
DEBT OF NON-FINANCIAL CORPORATIONS DIVIDED BY GROSS OPERATING SURPLUS
CHART 4.2.11

The performance of the Spanish economy in EMU 117Á. Estrada, J. F. Jim
eno and J. L. Malo de M
olina
the semi-elasticity of non-financial corporations’ credit with respect to the inter-est rate is higher. This finding may be related to the changes brought about in European capital markets by the introduction of the euro, which have led to an increase in the weight of debt issues in the liabilities of European financial institu-tions [see, for example, Hartmann et al. (2003), De Bondt (2002), and Rajan and Zingales (2003)] and, therefore, to the fact that credit is more sensitive to the cost of financing.
5 An assessment of the imbalances: intertemporal substitution
In order to identify the extent to which the growth of the Spanish economy’s indebtedness and the property expansion over the period 1999-2008 ended up generating imbalances that made an adjustment essential, this section presents a simulation based on a model designed for a small open economy. The model used is the literature benchmark for international macroeconomic studies (see, for example, Campa and Gavilán, 2006), in which the economy’s representative agent has access to the international capital market and attempts through its con-sumption and saving decisions to maximise present and future utility, in a setting of uncertainty regarding its future income. As in the classic permanent income model, the agent of this economy uses saving in order to avoid fluctuations in its long-term level of consumption.
Chapter 2 of the 2006 Annual Report of the Banco de España presented an ini-tial analysis of this question that did not take into account the real estate sector. The results indicated that the increase in debt during this period could only be jus-tified, according to this approach, on the basis of very optimistic growth expecta-tions, which assumed that growth would remain at above the Spanish economy’s potential rate. In fact, the expectations on which the spending and debt decisions were based only made sense if real convergence with the income levels of the core euro area countries of the were going to proceed apace. This standard model is now extended to incorporate the real estate sector explicitly. Thus, a two-sector economy is considered, with one sector dedicated to the production of tradeable non-durable consumer goods and the other to the production of real estate properties, which are non-tradeable durable goods. In each sector there is a representative firm that hires labour and takes investment decisions on a competitive basis.
The representative household of the economy obtains utility from consumer goods (C) and housing (H), has access to international capital markets at the ex-ogenous interest rate r and has a unit of time that it supplies inelastically to the labour market, receiving a wage w. Specifically, the agent solves the following in-tertemporal optimisation problem:

118 Spain and the euro. The fi rst ten years
)H,C(UEmax ssts
s-tt
subject to
Cs + Ps Hs+1 Qs+1 = ws + (1 + rs) Qs + ps (1 – H) Hs – Ts s ≥ t
where Qs denotes the financial wealth of the agent at the beginning of periods, T denotes the fixed-sum taxes that it must pay the government and His the rate of depreciation of housing.
For its part, the representative firm operating in the consumer goods sector seeks to maximise the discounted present value of its expected profit flow and, to do so, must invest (I) and hire workers (L). Accordingly, its problem is as follows:
Cs
2
1Cs
CsCCss
2
1Cs
CsCCsCs
ts j
s
1tjt
I1II
21Lw1
LL
21)L,K(F
r11
Emax
subject to
KCs+1 = (1 – KC) KCs + ICs s ≥ t
where KC denotes the rate of depreciation of capital in this sector and C and C provide a measure of the convex adjustment costs faced by the firm when it wishes to adjust its level of employment and investment, respectively.
The representative firm operating in the real estate sector solves a similar prob-lem to the previous one because, apart from employing labour and capital, this firm also acquires on the market land (U) at price pU:
HsUsHs
2
1Hs
HsHHss
2
1Hs
HsHHsHsHs
ts j
s
1tjt
UpI1II
21Lw1
LL
21)U,L,K(F
r11
Emax

The performance of the Spanish economy in EMU 119Á. Estrada, J. F. Jim
eno and J. L. Malo de M
olina
subject to
KHs+1 = (1 – KH) KHs + IHs s ≥ t
The model is closed with market-clearing equations for labour, housing and land.Given future paths for interest rates and productivity in the two sectors of the
economy and households’ preference for house ownership, this model can be used to analyse jointly the behaviour over time of households, in terms of con-sumption and saving, of firms, in terms of employment and investment, of house prices and of the current account balance. This model can thus determine the extent to which the recent expansion in Spain of debt and of the real estate sector can be explained by the impulses and shocks that have arisen since EMU entry.
Table 5.1.1 presents the results of the exercise (the Appendix gives model cali-bration details and the characteristics of the paths assumed for the population and interest rates). As can be seen, the model reproduces the most prominent characteristics of the period of expansion rather well: in response to interest rate developments and demographic growth (see Charts A1 and A2), external debt rises and a real estate expansion occurs: real estate wealth and house prices in-crease, as does also the weight of the construction sector, in terms of both GDP and employment. The model also predicts an increase in rates of investment in both sectors. According to these results the main changes recorded were in the direction that would have been expected in view of the behaviour of the funda-mental determinants.
However, the model’s quantitative predictions regarding the changes in these variables are somewhat smaller than the data actually observed in the Spanish
DATA MODEL
External debt/GDP (2007) -78% -70.1%
Current-account balance/GDP (2007) -9.6% -4.9%
Housing wealth/GDP (Dec 2004) 509% 393%
∆ House prices (Dec 1998-Dec 2007) 105.8% 57.2%
∆ Weight of construction in GDP (1998-2007) 4.3 pp 4.26 pp
∆ (Investment/GDP) (1998-2005)
Construction 0.7 pp 0.41 pp
Rest of the economy 5.47 pp 0.28 pp
∆ Weight of employment in construction (1998-2007) 2.87 pp 1.90 pp
SIMULATIONSTABLE 5.1.1

120 Spain and the euro. The fi rst ten years
economy during the first decade of EMU. Thus, both the stock of external debt and the current account balance reached significantly higher levels in 2007 than those that might be warranted assuming an optimal and rational reaction by do-mestic agents to the new credit and growth conditions arising from entry into the euro area, according to this calibrated version of the model of intertemporal substitution in consumption. External debt has exceeded the level explained by the model, although the deviation is around 10%. In the case of house prices, the calibrated model is capable of explaining only 55% of the price actually observed. Even when the limitations with which a model of these characteristics can ap-proximate asset valuations are taken into account, this indicates the presence of a component of overvaluation not very different from that estimated by another type of model designed specifically to estimate the contribution of the determi-nants of real estate prices. For example, Ayuso and Restoy (2006) estimated at the beginning of the decade a difference between the observed price of housing and its “fundamental value” of around 30%. Finally, as regards the reallocation of productive resources towards the construction sector, the model also enables excessive expansion of the real estate sector to be identified, since it can only ra-tionalise about 60-66% of the increases actually observed in the investment rate and employment in the construction sector.
Subject to the caveats appropriate to a quantitative exercise of this nature, its results suggest that the increase in household and corporate debt and the real es-tate expansion experienced by the Spanish economy during the first few years of EMU are phenomena linked to the new opportunities created by member-ship of a monetary union. In short, as this model indicates, it should come as no surprise that in a setting of more accessible credit, low interest rates and ex-pectations of future income growth, stimulated by a process of intense employ-ment creation, Spanish households and firms should increase their indebtedness. Neither is it strange that part of this debt should be used for the acquisition of real estate assets, given that the formation of new households increased notably and the availability of credit was greater for acquisitions of this type of asset. Ap-parently, however, excessive optimism regarding the future generation of income gave rise, at the same time, to excessive indebtedness and house price growth be-yond, according to the calibration of this model of intertemporal substitution for the Spanish economy, what would have been compatible with the actual paths of interest rates and economic growth. All this, moreover, led to an excessive alloca-tion of productive resources to the construction sector, relative to what could be warranted by this model.
The importance and scale of the excesses identified by this exercise made it inevi-table that the Spanish economy would undergo an adjustment process to steer the behaviour of indebtedness, the dynamic of real estate asset prices and the allocation of resources to this sector towards sustainable paths. There was great uncertainty sur-

The performance of the Spanish economy in EMU 121Á. Estrada, J. F. Jim
eno and J. L. Malo de M
olina
rounding the scope and intensity of this adjustment, given that it had to take place for the first time under the specific restrictions of EMU membership. It was assumed that certain factors arising from the structural transformations made in the Spanish economy during its transition to a regime of macroeconomic stability would help to cushion its possible consequences. However, unfortunately, once the adjustment had begun, at around the beginning of 2007, the international financial crisis substan-tially changed the international economic environment, making the unwinding of the imbalances accumulated during the expansion more difficult and costly.
6 The crisis and the adjustment of the Spanish economy
The strong growth of the Spanish economy in EMU gave way to a sharp slowdown, somewhat more gradual in 2007 and gathering pace in 2008. GDP growth rates turned negative in the second half of 2008 and a global recession commenced in a contractionary international climate dominated by exceptional financial strains. The drastic change on the economic front is partly attributable to the unavoidable correction of imbalances generated during the expansion, but also to the exceptional conditions in which the adjustment is to be made. The origin of the adjustment under way in the Spanish economy is described below, along with the main factors involved.
6.1 The dual origin of the crisis
The crisis has two focal points: the first domestic and related to the excesses accumulated during the expansion; and the second external and due to the effect of the successive international financial shocks dating back to July 2007.
As regards the domestic origin of the crisis, the exercise presented in Section 5 is suitably illustrative. The greater availability of credit due to EMU membership and the excessively optimistic expectations of rapid per capita income growth led Spanish households and firms to take on debt briskly. When, following this in-itial situation, growth expectations became more realistic and credit conditions tightened, consumption and investment decisions had to adjust sharply to correct a debt dynamic which proved to be unsustainable. Given the focus of spending and debt on acquiring real estate assets, which had pushed house prices and resi-dential investment sharply higher, beyond long-term sustainable values, this ad-justment also brought a considerable curtailment of construction activity and the reallocation of substantial productive resources to other sectors.
This correction, in itself sharp enough given the scale of the cumulative im-balances, was magnified by the consequences of the serious international finan-

122 Spain and the euro. The fi rst ten years
cial crises, which led to a widespread rise in financing costs for final borrowers and triggered a deleveraging of financial institutions with the resulting nota-ble global credit shortage. These conditions drastically altered the scenario of world growth, pushing most economies, especially the more developed ones, into deep recession. The Spanish economy, though not directly affected by the shocks and weaknesses which set off this process, could not escape its conse-quences, especially since it coincided with a deep domestic adjustment linked to debt reduction and to over-investment in real estate. Thus, the financial cri-sis acted through various channels to accentuate the slowdown in consumption and investment and led quite swiftly to a recession in the second half of 2008. The worsening of the financial crisis in 2008 Q4 added deep contractionary shocks to consumer and business confidence, and tightened and restrained credit conditions for agents heavily reliant on borrowed funds. Furthermore, the global nature of the recession deprived the Spanish economy of the support of external demand, which under normal conditions could have been relied on to soften the impact that the necessary adjustment of domestic demand will have on growth.
In view of the sharpness of the recession, it is worth analysing the similarities and differences of the current downturn with respect to other episodes in which activity also weakened significantly. For this comparison, two other phases in the last 30 years when GDP fell in various quarters were selected as references (1979-1981 and around 1993). As is customary in this type of study, the accompanying charts compare the annual growth of certain relevant variables over the 20 quar-ters following the quarter in which GDP peaked in each selected phase (1978 Q1, 1990 Q4 and 2006 Q4).
Chart 6.1.1 shows per capita GDP growth in the three periods selected; in this case population is used as a normalisation variable, since it is a basic determinant of an economy’s growth potential. While at the end of the 1970s its rate of in-crease was slightly above 1%, at the beginning of the 1990s it had fallen to just 0.1% and in the last three years considered it recovered to nearly 2%. As can be seen in this chart, the two full recessions considered differed in depth and length. Thus, at the end of the 1970s, per capita GDP fell somewhat more than 1% in only four quarters, which moreover were separated by nearly two years. In con-trast, at the beginning of the 1990s activity fell by nearly 2% in some quarters, but the rise in per capita GDP started to take root only one and a half years after the adjustment began. Until 2008 Q3 the intensity of the recession seemed most similar to that of the early 1990s, although in 2008 Q4 GDP plummeted. Also, certain factors indicate that it may last longer, since many of the factors which enabled activity to resume significant growth rates by 1995 (gains in the com-petitiveness of Spanish exports, world growth and readily available financing) are hardly likely to be seen this time.

The performance of the Spanish economy in EMU 123Á. Estrada, J. F. Jim
eno and J. L. Malo de M
olina
Moving on to the various components of aggregate spending, Charts 6.1.2 and 6.1.3 compare the performance of per capita private consumption and hous-ing investment, also normalised using population. In this case the differences between the various recessions are much sharper. Specifically, the adjustment in private consumption is much sharper in 2007 and 2008; in fact, as early as 2008 Q2, this variable began to fall off in comparison with the same period of the preceding year. This slowdown seems to be a logical consequence of the high household debt built up, of the financial crisis affecting the world economy and
-4
-2
0
2
4
1 2 3 4 5 6 7 8 9 10 11 12 13 14 15 16 17 18 19 20 21
1978 Q1 1990 Q4 2006 Q4%
Quarters after the peak
SOURCES: INE and Banco de España.
PER CAPITA GDP YEAR-ON-YEAR RATE OF CHANGE
CHART 6.1.1
-4
-2
0
2
4
1 2 3 4 5 6 7 8 9 10 11 12 13 14 15 16 17 18 19 20 21
1978 Q1 1990 Q4 2006 Q4%
Quarters after the peak
SOURCES: INE and Banco de España.
PER CAPITA CONSUMPTION YEAR-ON-YEAR RATE OF CHANGE
CHART 6.1.2

124 Spain and the euro. The fi rst ten years
of the financial asset price adjustment, which significantly diminished household wealth. Conversely, in the 1990s the adjustment of private consumption was in line with that of GDP, suggesting it must have been influenced most by the be-haviour of disposable income, and in the late-1970s recession the adjustment of private consumption was delayed until 1981, precisely when the onset of the sec-ond oil price shock significantly eroded agents’ purchasing power.
If these three recessions have anything in common, it is to be found in hous-ing investment, although this is not always preceded by a significant expansion; in fact, in the 1970s, residential investment had been falling since 1975. In the present cycle, this variable initially took longer to react than in the 1990s, al-though it has plummeted to such an extent in the last four quarters that the de-celeration now exceeds that seen in the whole of the previous recession. The ex-planation for this initial higher inertia probably lies in the way this variable is recorded: on the one hand, every house built is considered as sold (i.e. there is no change in inventories), and, on the other, only the part of the house built in that quarter is considered as investment. However, the data for the last four quarters indicate that a large number of unfinished housing developments are be-ing abandoned because so many finished homes remain unsold. This means that this component of household demand will take some time to recover because the finished homes currently held by developers must first be absorbed. But there is evidence that, geographically, they are concentrated in coastal provinces, which are not the areas of future demand for primary residences.
Charts 6.1.4 and 6.1.5 show the rate of investment in capital goods (i.e. the ratio of investment in capital goods to GDP) and the growth of the employment rate (i.e. growth of employment less that of the population, which can be con-
-25
-20
-15
-10
-5
0
5
10
15
1 2 3 4 5 6 7 8 9 10 11 12 13 14 15 16 17 18 19 20 21
1978 Q1 1990 Q4 2006 Q4%
Quarters after the peak
SOURCES: INE and Banco de España.
PER CAPITA HOUSING INVESTMENT YEAR-ON-YEAR RATE OF CHANGE
CHART 6.1.3

The performance of the Spanish economy in EMU 125Á. Estrada, J. F. Jim
eno and J. L. Malo de M
olina
sidered an approximation of the inverse of the unemployment rate). As can be seen, the financing raised in the Spanish economy in the last few years was not used only for building homes, but also for notably stepping up investment in capital goods, which are much more productive. In fact, in comparison with the first half of the 1990s, the rate of investment in capital goods is 2 pp higher, and 4 pp up on the end of the 1970s. Also, capital goods investment seems to have been much more resilient, at least initially. Indeed, in the first nine quarters of economic deceleration, the investment rate even rose slightly, unlike at the be-ginning of the new millennium or in the early 1990s. In any event, the outlook
4
5
6
7
8
9
10
1 2 3 4 5 6 7 8 9 10 11 12 13 14 15 16 17 18 19 20 21
1978 Q1 1990 Q4 2006 Q4%
Quarters after the peak
SOURCES: INE and Banco de España.
RATE OF INVESTMENT IN EQUIPMENT AS A PERCENTAGE OF GDP
CHART 6.1.4
-6
-4
-2
0
2
4
1 2 3 4 5 6 7 8 9 10 11 12 13 14 15 16 17 18 19 20 21
1978 Q1 1990 Q4 2006 Q4%
Quarters after the peak
SOURCES: INE and Banco de España.
EMPLOYMENT RATE YEAR-ON-YEAR RATE OF CHANGE
CHART 6.1.5

126 Spain and the euro. The fi rst ten years
is not favourable since this variable is very sensitive to business expectations and relies heavily on borrowed funds, which is precisely where the global crisis is con-centrated. As for the employment rate, the ongoing loss of dynamism (and even de-cline in the last three quarters) does not seem to be sharper than that in the 1990s, although at the end of 2008 it intensified notably. Comparison with events in the 1970s is much more complex. In that cycle the adjustment of employment began much earlier due to structural changes in the Spanish economy (the definitive exo-dus from the countryside) in combination with higher oil prices, which rendered certain activities obsolete, and the change of political regime, which meant the end of the trade-off between harmonious industrial relations and employment stability.
In any event, the distinguishing feature which best summarises the excesses of the Spanish economy in the most recent phase is apparent in Chart 6.1.6, which plots the trade balance in real terms as a percentage of GDP in the selected periods. It shows that in the first half of the 1990s the trade deficit climbed to 4% of GDP, but following the marked slowdown in activity and the devaluation of the peseta (which unlike other exchange rate adjustments was very successful and permitted notable gains in competitiveness), a situa-tion of external equilibrium was reached which lasted until practically mid-1998. At the end of the 1970s, the trade account was virtually in balance. However, this was the result of the Spanish economy’s serious difficulties in at-tracting external funds, given the problems of confidence raised by the delicate political and economic situation. Evidence of these difficulties is that in spite of this external equilibrium, the peseta had to be devalued in 1982, which resulted in a widening of the trade surplus. By contrast, at the beginning of
-12
-10
-8
-6
-4
-2
0
2
4
1 2 3 4 5 6 7 8 9 10 11 12 13 14 15 16 17 18 19 20 21
1978 Q1 1990 Q4 2006 Q4%
Quarters after the peak
SOURCES: INE and Banco de España.
TRADE BALANCE IN REAL TERMS AS A PERCENTAGE OF GDP
CHART 6.1.6

The performance of the Spanish economy in EMU 127Á. Estrada, J. F. Jim
eno and J. L. Malo de M
olina
the current recession, the external deficit stood at 10% of GDP. Obviously, this reflects the fact that the excess demand of the Spanish economy in these years has been much larger than is reflected in traditional calculations of the output gap (probably due to difficulties in separating the growth of supply in the Spanish economy from that of demand), but it also indicates that there is a problem of competitiveness.
It has become considerably harder to sustain this imbalance, even in the short run, because of the difficulty in financing it on reasonable terms due to the na-ture of the global crisis. The need for a domestic adjustment, in the form of a downward adjustment in relative prices (competitiveness) or in quantities (real income) or a combination of the two, has thus become more pressing. This ad-justment has in fact already been set in train in the last two quarters, sharpening drastically in 2008 Q4 when housing investment plummeted and private con-sumption and capital goods investment could hold up no longer. Although, un-like in the previous two slumps, the devaluation of the currency is not available as a means of reducing this imbalance, there are two factors which will make this adjustment somewhat less painful: first, the significant interest rate cuts world-wide, which will reduce the external debt burden by nearly 2 pp relative to GDP (the Spanish gross external debt is around 80% of GDP), and second, the drop in oil prices, which represents another 2 pp of GDP, since Spain uses this commod-ity intensively. All this does not obviate the need for a lasting improvement in the competitiveness of the economy to lay the foundations for a sustained recovery in activity, since both these cushioning factors will return to higher levels when the international situation improves.
6.2 The nature of the adjustment of the Spanish economy
The scale and intensity of the prevailing contractionary trends reflect the great importance of the adjustment needed by the economy and the role played here by Spanish EMU membership and by the structural conditioning factors derived from the transformations and reforms made. The specific characteristics of the adjust-ment process within a monetary union are well known [see, for example, Blanchard (2001) and Muscatelli et al. (2005)]. When a country belonging to a monetary un-ion grows faster than the other members due to an increase in domestic demand and a positive inflation differential (and hence a real appreciation of the exchange rate and a worsening of the external deficit), the domestic and external balance has to be restored using fiscal policy to control domestic demand growth and through reform of the price- and wage-setting mechanism to limit real exchange rate appreciation.
Spanish fiscal policy during the expansion, although enabling some fiscal con-solidation and budget surpluses, was not sufficiently countercyclical. Chart 6.2.1 shows public debt in terms of GDP in various euro area countries. As can be

128 Spain and the euro. The fi rst ten years
seen, although in Spain it decreased significantly, and in fact more than in oth-er European countries, government saving did not increase enough to offset the sharp rise in the debt of domestic private agents.
It was thus not until mid-2006 and, more visibly, during 2007, that the strong growth of domestic demand began to be corrected. At first the moderation was from the construction sector, where activity levels began to flag as the high price rises dampened demand for housing. However, as earlier analysed, the adjust-ment of domestic demand was soon widespread and rapidly in train due to the linkage of domestic imbalances with the global financial crisis. This meant that the framework defining the possible contribution of fiscal policy to the adjust-ment was drastically altered. The scenario of necessary moderation of domestic demand gave way, in the space of a few months, to one of severe contraction, with a serious deterioration of confidence and widespread curtailment of spend-ing decisions. The overriding consideration in this setting was the contribution that fiscal policy could make to sustaining domestic demand.
In this vein, the approaches proposed to tackle the crisis at the international level include ambitious, coordinated fiscal stimuli, albeit tailored to the condi-tions and leeway existing in each country. Spain, which had recorded some sur-plus in its public finances during the expansion and where public-sector debt had been notably reduced, initially enjoyed some headroom to stimulate con-sumption and investment through increased government spending and tax cuts. In fact, this leeway enabled it to take expansionary fiscal measures fairly early. However, the budgetary effects of these measures have coincided with the emer-gence of a strong impact from the cyclical slowdown and, above all, from the real estate-related fall in tax revenue, which has shown a much higher sensitiv-
30
40
50
60
70
80
90 91 92 93 94 95 96 97 98 99 00 01 02 03 04 05 06 07
GERMANY SPAIN UNITED KINGDOM EURO AREA% of GDP
SOURCES: Eurostat, INE and Banco de España.
PUBLIC DEBTCHART 6.2.1

The performance of the Spanish economy in EMU 129Á. Estrada, J. F. Jim
eno and J. L. Malo de M
olina
ity than commonly assumed [see De Castro et al. (2008)]. The potential margin for manoeuvre initially available for fiscal stimulus seems to have been largely ex-hausted. In any event, any action is constrained by the need to preserve medium-term budgetary stability. Otherwise, a sizeable public deficit could build up and become an additional handicap to negotiating the recession, given the possible impact on confidence and country-risk premiums which may activate Ricardi-an mechanisms leading public expansionary impulses to be offset by the possible crowding-out of private spending.
In any event, the contraction of demand does not change the nature of certain essential aspects of the necessary adjustment of the Spanish economy. In the short run, emerging from the crisis depends essentially on the normalisation of finan-cial markets and on the length and depth of the international economic reces-sion. However, over a longer time horizon, once normality has been restored, the adjustment of the Spanish economy will depend basically on the existence of a competitive position enabling the sustained growth of domestic and external de-mand. In a monetary union where the currency is shared with the other euro area countries, the decisive factors in making this possible will be the future course of productivity growth and the response by production costs to market conditions.
The growth rate of productivity is important for many reasons. First, higher productivity growth enables, for a given growth rate of production costs, firmer containment of inflation and thus an improvement in the real exchange rate and in the contribution of external demand to the generation of value added. This is important not only for the shift needed during the process of adjustment, but also in order to achieve a more balanced growth pattern. Moreover, more vigor-ous productivity is the only way to underpin expectations of higher future in-come for households and firms that will make the existing level of debt assum-able and enable domestic spending to be resumed on a sustainable basis. Finally, an increase in productivity in some sectors may be decisive for creating the jobs needed to accommodate surplus construction workers.
The behaviour of production costs and of the structural and institutional fac-tors involved in their formation will play a major role in absorbing the real ap-preciation, particularly given the slowness with which productivity gains attribut-able to genuine improvements in the economy’s efficiency rather than merely to the results of the employment adjustment may be achieved. Leaving the entire drive to realign relative prices between countries to active or passive productivity improvement, i.e. that achieved by destroying jobs, may turn out to be very slow and costly in both economic and social terms, since it shifts most of the costs to those who lose their jobs or cannot find one. The effective containment of pro-duction costs and of business margins so that they grow more slowly than in the rest of the euro area, reversing at least partially the imbalance that built up dur-ing the expansion, may substantially alleviate the depth and length of the adjust-

130 Spain and the euro. The fi rst ten years
ment, particularly in regard to job destruction, and significantly contribute to the recovery of activity and to the correction of the external deficit.
In principle, an adjustment based largely on improved productivity and on the containment of costs and mark-ups involves considerable difficulties. For-tunately, certain features of the Spanish economy derived from changes during the past decade suggest that such an adjustment may be less costly now than it would have been in the past. First, EMU membership makes it easier to sustain a pattern of macroeconomic stability based on a common monetary policy and on budgetary discipline rules which, though relaxed temporarily to allow a fiscal re-sponse to the current situation, reduce the risk of fiscal measures being taken that jeopardise the sustainability of public finances. Second, the demographic change driven by immigration and the definitive incorporation of women into the labour market not only have consequences for future consumption and investment, but also seem to have made for more flexible behaviour of the labour market. Nev-ertheless, structural problems in the functioning of some markets persist. These derive from regulation which does not sufficiently encourage the required com-petition and flexibility, and will require more ambitious reforms to resolve them.
7 Conclusions
Spain’s participation in EMU has been a major achievement from the stand-point of the historical performance of the macroeconomic determinants of growth. It has set in place the regime of stability needed to modernise the econ-omy and assimilate the patterns of the more advanced European countries. Also, some of the factors which had recurrently stifled economic dynamism have been eliminated. EMU membership has borne fruit in the form of the longest expan-sionary phase in recent economic history and a big step forward in the degree of convergence with the income and welfare levels of the euro area. The experience, however, has not been free from constraints in the form of a build-up of imbal-ances leading to a necessary correction, which has finally come about under the adverse conditions of a serious international crisis.
Most of Spain’s EMU membership experience has been notably influenced by considerably accommodative international monetary and financial conditions, as a result of the perception that the prevailing macroeconomic stability was sustain-able, a view finally shown to have little basis. Also, the global financial imbalances, with large capital flows moving from emerging countries and commodity producers to more developed countries and financial system regulation insufficiently focused on economic cycle stabilisation, led to an international climate of risk undervalu-ation and rapid debt growth which encouraged levels of leverage never previously witnessed. Moreover, in the euro area, interest rates remained predominantly lower

The performance of the Spanish economy in EMU 131Á. Estrada, J. F. Jim
eno and J. L. Malo de M
olina
than at any other time in the past, conditioned by the structural weaknesses of cen-tral European countries which curbed their spending and growth rates.
In the case of the Spanish economy, the effects of the financial laxity were magnified by the low initial level of indebtedness, associated both with the con-siderable corporate and household financial restructuring induced by the early-1990s recession and with the significant risk premiums that had been borne by an economy such as Spain, which had used currency devaluation as a rebalancing tool. Further, the nominal adjustment of the economy and the ever-firmer ex-pectations of joining EMU as a founding member pushed interest rates progres-sively lower from 1995. This shifted the demand for credit to variable-rate debt, which enabled the advantages of economic convergence to be rapidly exploited. Those years saw many opportunities for Spanish firms to expand internationally, since the privatisation of state-owned firms allowed them to undertake numerous highly leveraged acquisitions.
All these factors heightened the risks associated with the surge in debt and gave rise to a spending structure and, consequently, a specialisation of the economy that would prove insufficiently competitive in the medium term. In particular, on the demand side there was a considerable expansion of consumption and residential investment to the detriment of net exports and productive investment. Much of the increase in consumption did not give rise to higher domestic production, but rather to imports from abroad, while domestic productive resources were increas-ingly redirected towards construction. Despite notable expansion of the housing supply, house prices rose sharply, prompting an overvaluation which impacted the balance sheets of all institutional sectors (households, firms and the public sector).
Against this background, immigration probably mitigated to some extent this considerable demand pressure because it expanded supply somewhat, but it also caused other imbalances. First, migrants’ low level of skills and, consequently, low wages added to the Spanish economy’s tendency to over-specialise in construction activities and low-value-added services. In addition, these low wages and the mag-nitude of the migratory flow masked at aggregate level the fact that the more sta-ble core of the labour market was enjoying higher wage growth than was compat-ible with nominal stability of the economy and that, therefore, an adjustment was required. Consequently, the flexibility provided by immigrants may have acted as a substitute for the institutional reforms needed to adjust the labour market to mac-roeconomic shocks, especially through changes in relative labour prices (i.e. real wages), rather than in quantities (unemployment) as has hitherto been the case.
From the standpoint of the public sector, the specialisation in these economic sectors and the asset overvaluation made for a sharp increase in tax revenue which facilitated the budgetary adjustment. Obviously, the fiscal consolidation and the reduction of general government debt made the Spanish economy more resilient; but taking into account the composition of its growth and the dynamic of wid-
132 Spain and the euro. The fi rst ten years
ening domestic and external imbalances, the effort should have been greater. That safety margin is thus rapidly being exhausted. Specifically, local and regional gov-ernments should have posted a positive contribution to the public-sector surplus instead of taking on new spending obligations of a permanent nature to be met from income whose previous growth rate they were unable to maintain.
The intensity and length of the expansionary phase enjoyed by the Spanish economy made other structural reforms in the goods and services markets and in the corporate area less pressing. Before and for a time after Spain joined EMU, the need for reforms gave rise to resolute action which subsequently petered out. This was probably a result of the strong progress towards real convergence, which masked the fact that it rested on temporary foundations (the rise in the employ-ment rate), while productivity remained notably weak. In fact, the policies to im-prove the efficiency of the economy were adopted belatedly.
Although this key determinant of the competitiveness of the economy was not making sufficient headway, the ease with which the growing external imbalance could be financed induced a tolerance of this phenomenon which led to the over-indebtedness of the private sector of the economy.
All these factors combined to delay the impending adjustment in the Span-ish economy until end-2006, and it was only undertaken gradually in 2007. The eruption of the international financial crisis in summer 2008 and the subsequent global recession made it very difficult for Spain to keep financing its external def-icit. This ruled out the possibility of a “soft landing” and precipitated a brusque adjustment which swept the economy into a recession deeper than that seen in the first half of the 1990s.
The seriousness of the financial and contractionary trends led, as in all coun-tries, to emergency measures to alleviate the consequences of the financial tight-ening and prevent a sudden paralysis of spending. They are necessary measures but are per se unlikely to produce a change in trend. The outcome of this com-plex situation depends largely on whether the world economy will be able to emerge from the global recession and restore the intermediation function of the financial system. The Spanish economy, however, faces the challenge of an ad-justment within the euro area in particularly adverse circumstances. The means available to it are its demographic dynamism and the flexibility achieved through certain structural reforms implemented in the past, particularly in the field of privatisation and market liberalisation. But it has yet to undertake other reforms in the area of services and, above all, in the labour market, where the continu-ing basic inefficiency of adjustment is leading to rampant unemployment, as in previous recessions, which propagates and magnifies the contractionary forces. Structural measures are the main instrument the authorities have to prevent the recession turning into a long deviation from the potential growth achievable by the Spanish economy within the EMU regime of stability.

The performance of the Spanish economy in EMU 133Á. Estrada, J. F. Jim
eno and J. L. Malo de M
olina
APPENDIX: A model of intertemporal substitution of consumption calibrated for the Spanish economy (1999-2008)
1 Functional forms
– Utility function 1h
Z1c
h,cU1s
1s
ss
– Production function in C CC 1CsCsCsCsCs LAKL,KF
– Production function in H 1Hs
1HsHsHsHsHsHs ULAKU,L,KF HH
– Investment adjustment costs HC,jI1II
2I,IAC js
2
1js
jsj1jsjs
– Labour adjustment costs HC,jL1LL
2L,LAC js
2
1js
jsj1jsjs
2 Calibration
The model parameters take the following values:
– Discount factor = 1/(1+0.03)
– Risk aversion = = 2
– Weight of housing in utility Z = 0.987
– Weight of capital in production of C C = 0.375
– Weight of capital in production of H H = 0.20
– Weight of land in production of H 1- = 0.10
– Capital depreciation ratio in C KC = 0.05

134 Spain and the euro. The fi rst ten years
– Capital depreciation ratio in H KH = 0.09
– Housing depreciation ratio H = 0.018
– Investment adjustment cost in C C = 70
– Investment adjustment cost in H H = 70
– Labour adjustment cost in C C = 5
– Labour adjustment cost in H H = 70
Rationale behind the values used:
– The value of Z, KC, KH and of the initial foreign bonds is fixed so as to reproduce in the steady state of the economy the following ratios observed in 1998:
1 Real estate wealth/GDP 277% (BdE) 277.7% (model) 2 Sector C investment/GDP 22.4% (BBVA-IVIE) 22.25% (model) 3 Sector H investment/GDP 0.62% (BBVA-IVIE) 0.68% (model) 4 IIP/GDP –29.7% (BdE) –29.6% (model)
– The value of the parameters reflecting investment and labour adjustment costs is set so that there are smooth transitions in these variables in both sec-tors.
– The other parameters are set at standard values from the literature.
In the steady state of this economy, in addition to the values of ratios 1-4, we have:
– Sector H GDP/GDP 6.7% (BdE) 5.0% (model)– Sector H employment/ Employment 10.3% (BdE-EPA) 5.72% (model)– Private consumption/GDP 58.7% (BdE) 53.18% (model)– Government spending/GDP 18% (BdE) 18% (model)– Current account/GDP 0% (BdE) 0% (model)
3 Exercise
Starting from the steady state (calibrated to resemble the Spanish economy in 1998), it is assumed that the economy receives the following shocks:

The performance of the Spanish economy in EMU 135Á. Estrada, J. F. Jim
eno and J. L. Malo de M
olina
1.00
1.10
1.20
1.30
1.40
1.50
98 99 00 01 02 03 04 05 06 07 08 09 10 11 12 13
DATA EXERCISE
EM
PL
OY
ME
NT
YEAR
SOURCE: Banco de España.
EMPLOYMENTCHART A.1
-1
0
1
2
3
4
5
6
7
98 99 00 01 02 03 04 05 06 07 08 09 10 11 12 13 14 15 16 17
OECD POLYNOMIAL EXERCISE
RE
AL IN
TE
RE
ST
RA
TE
S (%
)
YEAR
SOURCE: Banco de España.
INTEREST RATESCHART A.2
1 The dotted line shows employment in Spain between 1998 and 2007 ac-cording to the Spanish Labour Force Survey (1998=1). It is assumed that after 2007 employment remains unchanged at the level reached in 2007. In the exercise a smoothed version of the observed data is used (solid line).
2 Interest rates behave as follows in the data and in the exercise: In 1998 the interest rate was 3% in both the steady state and in the short-
term real interest rates reported by the OECD. From 1998, interest rates be-

136 Spain and the euro. The fi rst ten years
have basically in line with the smoothed data of the OECD until 2008, and rates are considered to return to 3% between 2008 and 2014.
3 From 1998, the amount of land, which is created exogenously in the econ-omy in each period and is used to produce dwellings, falls by 10% per annum until it reaches a new steady state value. This value assumes half of the steady state value in 1998.
4 To reflect the fact that in the period the household structure has changed towards one which demands more dwellings (smaller households, etc.), it is assumed, as a reduced-form representation of this phenomenon, that there is an increase in the parameter governing the weight of housing in utility. Specifically, Z is assumed to rise from 0.987 to 1.25, which means that in the steady state of 1998 the equilibrium housing stock is (approximately) 10% higher. In other words, it is assumed that the changes in the household structure (or in the preference for a second residence) would, on their own, have entailed a rise of 10% in the housing stock.

The performance of the Spanish economy in EMU 137Á. Estrada, J. F. Jim
eno and J. L. Malo de M
olina
References
ANDRES, J., E. ORTEGA and J. VALLÉS (2008). “Competition and inflation differentials in EMU”, Journal of Economic Dynamics and Control, 32 (3), pp. 848-874.
ARCE, O., J. M. CAMPA and Á. GAVILÁN (2008). Asymmetric collateral requirements and output composition, Working Paper No. 0837, Banco de España.
AYUSO, J., and F. RESTOY (2006). “House Prices and Rents: An Equilibrium Asset Pricing Approach”, Journal of Empirical Finance, 13, pp. 371-388.
BENTOLILA, S., and J. F. JIMENO (2006). “Spanish unemployment: the End of the Wild Ride?”, in M. Werding (ed.), Structural Unemployment in Western Europe, Reasons and Remedies, MIT Press.
BENTOLILA, S., J. J. DOLADO and J. F. JIMENO (2009). “Does immigration affect the Phillips curve? Some evidence for Spain”, European Economic Review, forthcoming.
BLANCHARD, O. (2001). “Country Adjustments Within Euroland. Lessons After Two Years”, in Monitoring the European Central Bank, CEPR, Londres.
BOVER, O. (2005). Wealth effects on consumption: microeconometric estimates from the Spanish survey of household finances, Working Paper No. 0522, Banco de España.
— (2008). Wealth inequality and household structure: US vs. Spain, Working Paper No. 0804, Banco de España.
BOVER, O., and J. F. Jimeno (2007). House prices and employment reallocation: international evidence, Working Paper No. 0705, Banco de España.
CAMPA, J. M., and Á. Gavilán (2006). Current accounts in the euro area: an intertemporal approach, Working Paper No. 0638, Banco de España.
DE BONDT (2002). Euro area corporate debt securities market; first empirical evidence, ECB Working Paper No.164.
DE CASTRO, F., Á. ESTRADA, P. HERNÁNDEZ DE COS and F. MARTÍ (2008). “Una aproximación al componente transitorio del saldo público en España”, Boletín Económico, June, Banco de España, pp. 71-81.
DE LA FUENTE, A. (2003). “El impacto de los fondos estructurales: convergencia real y cohesión interna”, Hacienda Pública Española, 165, pp. 122-129.
DOLADO, J., and J. F. JIMENO (1997). “The Causes of Spanish Unemployment: A Struc-tural VAR Approach”, European Economic Review, vol. 41:7, pp. 1281-1307.
ESTRADA, Á. (2008). The mark-ups in the Spanish economy: international comparison and recent evolution, forthcoming as Banco de España Working Paper.
GALÍ, J., M. GERTLER and J. D. LÓPEZSALIDO (2007). “Mark-ups, gaps, and the wel-fare costs of business fluctuations”, The Review of Economics and Statistics, 89 (1), pp. 44-59.
HARTMAN, P., A. MADDALONI and S. MANGANELLI (2003). The euro area financial system: structure, integration and policy initiatives, ECB Working Paper No. 203.
IZQUIERDO, M., and A. V. REGIL (2006). “Actualización de las estimaciones de la tasa de desempleo estructural de la economía española”, Boletín Económico, September, Banco de España, pp. 55-62.
IZQUIERDO, M., A. LACUESTA and S. PUENTE (2008). Los flujos de entrada y salida de inmigrantes en España, mimeo.
MALO DE MOLINA, J. L. (2005). Una larga fase de expansión de la economía española, Oc-casional Paper No. 0505, Banco de España.

138 Spain and the euro. The fi rst ten years
MALO DE MOLINA, J. L. (2007). Los principales rasgos y experiencias de la integración de la economía española en la UEM, Occasional Paper No. 0701, Banco de España.
MARQUÉS, J. M., F. NIETO and A. DEL RÍO (2005). Una aproximación a los determi-nantes de la financiación de las sociedades no financieras en España, Working Paper No. 0535, Banco de España.
MCCONNELL, M., and G. PÉREZQUIRÓS (2000). “Output Fluctuations in the Unit-ed States; What Has Changed Since the Early 1980s?”, American Economic Review, 90-5, December, pp. 1464-1476.
MUSCATELLI, V. A., T. ROPELE and P. TIRELLI (2005). Macroeconomic Adjustment in the Euro-Area: The Role of Fiscal Policy, mimeo.
OFICINA ECONÓMICA DEL PRESIDENTE (2006). Inmigración y Economía Española: 1996-2006, Oficina Económica del Presidente, Publicaciones e Informes.
RAJAN, R., and L. ZINGALES (2003). Banks and markets: the changing character of Europe-an finance, CRSP Working Paper No. 546.
RUMLER, F. (2005). Estimates of the open economy new Keynesian Phillips curve for euro area countries, European Central Bank Working Paper Series, No. 496.
TIMMER, M., M. O’MAHONY and B. VAN ARK (2008). The EU KLEMS Growth and Productivity Accounts: An Overview, University of Groningen & University of Birming-ham, March.

Jordi Galí1
CREI-UPF
Comments on “The performance of the Spanish economy in EMU: the fi rst ten years”
Estrada, Jimeno and Malo de Molina’s paper offers the reader an in-depth analysis of the Spanish economy’s performance over the first ten years of mem-
bership in the Economic and Monetary Union (EMU). According to the authors, developments over the period have been characterised by three main features:
– Continuous expansion of output and employment, up until the advent of the crisis in 2008. This enabled significant progress to be made towards con-vergence with average per capita income in the EMU area, with growth at an average rate of 0.7 percentage points a year. There was also strong growth in employment, which enabled the unemployment rate to be brought down from 18.7% (1998) to 8.3% (2007).
– While this expansion was underway some serious imbalances built up in the Spanish economy. These showed up in a persistent inflation differential vis-à-vis the EMU average, an unsustainable property boom, heavy borrowing by households and businesses, and a growing current account deficit.
– In 2006 an adjustment began, with the first signs of a slackening off of busi-ness activity, property prices, and credit. But hopes of a possible “soft land-ing” were cut short by the international financial crisis, which began in the summer of 2007 and brought with it a sharp loss of business and consumer confidence. It also led to efforts by the financial sector as a whole to delever-age, with the consequent drop in aggregate demand and the economy’s going into recession in 2008.
1 This note has been translated from Spanish by Duncan Gilson.

140 Spain and the euro. The fi rst ten years
As the authors point out, the final outcome of the current complex situation depends to a large extent on external factors over which the Spanish authorities have no control. However, it also depends on their capacity to meet the challeng-es inherent to a country that has now permanently renounced having a monetary policy of its own. As the paper argues, in Spain’s case these challenges include thorough structural reforms in the services sector and the labour market.
I basically agree with both the diagnosis and the solutions proposed by the paper’s authors. My comments offer some views and qualifications on their posi-tion, particularly as regards the interpretation of the inflation differential. I also point to a series of factors which play a key role in generating the imbalances ob-served, and in preventing and correcting them.
1 Two key questions about the Spanish economy and EMU
The experience of the last ten years raises two key questions: What role has Spain’s membership in EMU played in the emergence of the imbalances allud-ed to above? To what extent is it possible to make Spain’s membership in EMU compatible with a balanced economic growth? These questions are not easy to answer. However, it is important to attempt to do so, and what is more, we need to be able to answer the second question positively. Otherwise, we would face the paradoxical situation in which accession to EMU, which is presented by the authors (and by the politicians who sold it to the public!) as the “culmination of lengthy efforts to attain a regime of macroeconomic stability in Spain,” would be no more than a guarantee of continual macroeconomic instability.
-2
-1
0
1
2
3
1994 1995 1996 1997 1998 1999 2000 2001 2002 2003 2004 2005 2006 2007
REAL INTEREST RATES IN SPAIN CHART 1.1
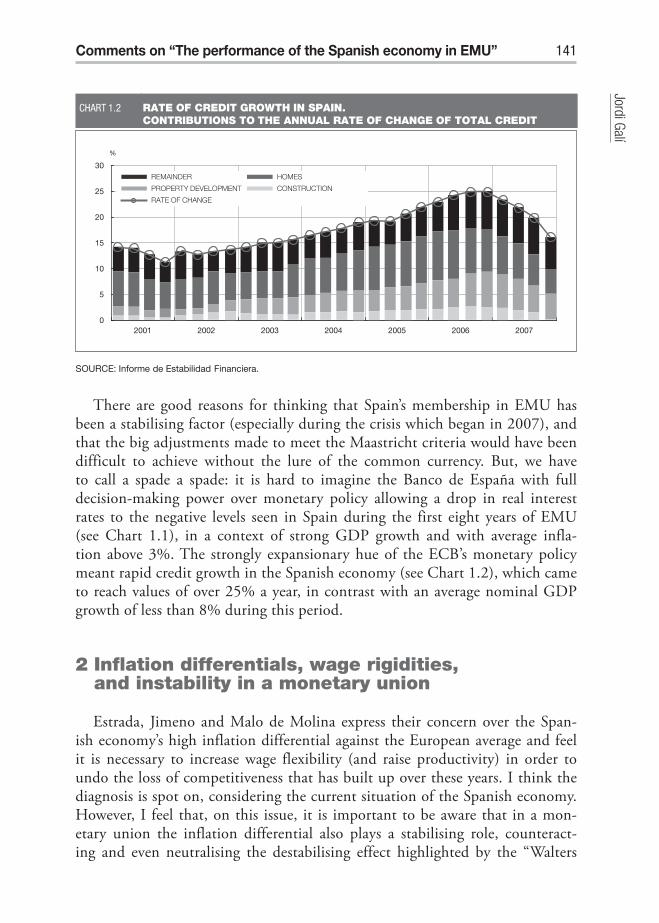
Comments on “The performance of the Spanish economy in EMU” 141Jordi Galí
There are good reasons for thinking that Spain’s membership in EMU has been a stabilising factor (especially during the crisis which began in 2007), and that the big adjustments made to meet the Maastricht criteria would have been difficult to achieve without the lure of the common currency. But, we have to call a spade a spade: it is hard to imagine the Banco de España with full decision-making power over monetary policy allowing a drop in real interest rates to the negative levels seen in Spain during the first eight years of EMU (see Chart 1.1), in a context of strong GDP growth and with average infla-tion above 3%. The strongly expansionary hue of the ECB’s monetary policy meant rapid credit growth in the Spanish economy (see Chart 1.2), which came to reach values of over 25% a year, in contrast with an average nominal GDP growth of less than 8% during this period.
2 Inflation differentials, wage rigidities, and instability in a monetary union
Estrada, Jimeno and Malo de Molina express their concern over the Span-ish economy’s high inflation differential against the European average and feel it is necessary to increase wage flexibility (and raise productivity) in order to undo the loss of competitiveness that has built up over these years. I think the diagnosis is spot on, considering the current situation of the Spanish economy. However, I feel that, on this issue, it is important to be aware that in a mon-etary union the inflation differential also plays a stabilising role, counteract-ing and even neutralising the destabilising effect highlighted by the “Walters
SOURCE: Informe de Estabilidad Financiera.
0
5
10
15
20
25
30
2001 2002 2003 2004 2005 2006 2007
REMAINDER HOMES
PROPERTY DEVELOPMENT CONSTRUCTION
RATE OF CHANGE
%
RATE OF CREDIT GROWTH IN SPAIN. CONTRIBUTIONS TO THE ANNUAL RATE OF CHANGE OF TOTAL CREDIT
CHART 1.2

142 Spain and the euro. The fi rst ten years
critique.”2 In this respect, one could ask to what extent the positive inflation dif-ferential observed over the last decade might not have been “insufficient” and, as a consequence, might have amplified the expansion (and subsequent recession).
To illustrate the preceding point, I will use the macroeconomic model that still constitutes the main reference framework in macroeconomics text books, and which is described by the following equations:
yt = – (i* – pet+1) + (e* – pt) + dt
pt = wt
wt = pt–1 + yt
where yt , pt and wt represent the logarithms of output, price, and wage lev-els, respectively. The constants i* and e* reflect the nominal interest rate and ex-change rate, which a (small) country in a monetary union can take as exogenous (and, which to simplify, I assume are constants). The first equation describes the equality between output and aggregate demand. The latter is inversely related to the real interest rate i*–pe
t+1 , and positively related to the real exchange rate e*–pt (assuming prices outside the country are constant). The variable dt represents a demand shock. The second equation establishes that the level of prices is pro-portional to salaries, abstracting from changes in productivity. The third equation determines wage inflation as a function of past inflation and the level of economic activity, and where the parameter > 0 can be interpreted as a measure of the sensi-tivity of wages to the economic cycle and, therefore, as an index of wage flexibility.
Chart 2.1 shows the responses of inflation Δpt and output yt to an expansionary aggregate demand shock. The first panel shows these responses in a scenario with relatively flexible wages (=1), whereas the second panel corresponds to a scenario with relatively rigid wages (=0.1). The comparison of the effects of the low de-mand shock on the preceding two scenarios shows clearly that greater wage rigid-ity brings with it greater inflation stability, but bigger and more persistent output fluctuations. In other words, wage flexibility permits greater stabilisation of eco-nomic activity, but in exchange for greater inflation volatility. In fact, it is precisely the surge in inflation during the period in which the expansionary demand shock occurred which is the factor mitigating the impact of this shock on the level of out-put. Eliminating the loss of competitiveness resulting from the rise in inflation is achieved through a short recession. This last observation contrasts with the persist-ent drop in the level of economic activity that is necessary in order to re-establish the initial real exchange rate in a scenario characterised by wage rigidity.
2 For a description, see the paper by Charles Wyplosz in this volume.

Comments on “The performance of the Spanish economy in EMU” 143Jordi Galí
-0,4
-0,2
0
0,2
0,4
0,6
0 5 10 15 INFLATION
SIMULATIONS OF THE EFFECT OF A DEMAND SHOCK. FLEXIBLE SALARIES (=1)
CHART 2.1
-0,5
0
0,5
1
0 5 10 15 GDP
The preceding exercise highlights that in a context of expanding demand and strong growth, such as that experienced by the Spanish economy over the years preceding the crisis, a positive inflation differential is not necessarily a factor of instability. Indeed, if wages had been more flexible during the expansion, the in-flation differential would have been greater. The other side of the coin is that once a loss of competitiveness has built up over the course of the expansion, the cost in terms of output and employment of re-establishing the external equilibri-um is much greater in the presence of more rigid wages. Given the significance of this scenario for the Spanish economy, it should come as no surprise that Estrada, Jimeno and Malo de Molina recommend structural reforms aimed at achieving greater wage flexibility. Given that one of the causes of the current downward wage rigidity is the lack of competition among workers protected by permanent contracts with high severance costs, it would be natural to focus these reforms on reducing those costs.

144 Spain and the euro. The fi rst ten years
3 Other possible causes of the imbalances
The absence of a domestic monetary policy is one of the factors potentially explaining the imbalances accumulated by the Spanish economy over the last few years. The lack of strong signals alerting to the danger of over expansion also stands out. And this included – until very recently – the absence of country risk premiums on the price of financial assets issued by Spanish institutions. The rela-tive stability of Spanish inflation, facilitated by the massive influx of immigrant workers3, constitutes another example of a warning light that failed to come on.
Fiscal policy includes elements which are unlikely to have contributed to stability. Thus, public consumption was clearly pro-cyclical, its share of GDP growing from 17.3% in 1998 to 18.3% in 2007, despite strong growth over
3 See the paper by Bentolila, Dolado and Jimeno (2009).
SIMULATIONS OF THE EFFECT OF A DEMAND SHOCK (cont'd). RIGID SALARIES (=0.1)
CHART 2.1
-0,5
0
0,5
1
0 5 10 15 GDP
-0,4
-0,2
0
0,2
0,4
0,6
0 5 10 15 INFLATION

Comments on “The performance of the Spanish economy in EMU” 145Jordi Galí
this period. Moreover, maintaining tax deductions for home purchases in a peri-od characterised by a massive shift in resources towards the property sector may have also been a destabilising factor.
Finally, the paradox may have arisen, in Spain and in other countries, that the very nominal stability and sustained growth that characterised the period begun in the mid-90s sowed the seeds of the current crisis, by generating dis-proportionate expectations as to families’ and businesses’ capacity to invest and spend. These expectations may have been distorted, among other factors, by interest rates whose low levels, although difficult to sustain, might have come to be perceived as permanent. Better economic literacy on the part of the pub-lic and a greater educational effort by those responsible for political economy might have tempered the exuberant expectations that characterised the period.
4 Is membership of EMU compatible with balanced growth?
In my opinion the answer to this question is yes, but not unconditionally. The possibility of maintaining growth without major imbalances or recurrent crises will depend, among other factors, on the following:
– The possibility of implementing a countercyclical fiscal policy which com-pensates for the lack of a domestic monetary policy, and which does not restrict the efficient provision of public goods or the normal operation of automatic stabilisers.4
– Implementing countercyclical financial stabilising policies, which enable variations in instruments such as capital or liquidity ratios, and which are in the hands of an institution which is independent of executive power.
– Greater wage flexibility, achievable with the gradual elimination of the duality of the labour market and the consequent increase in competition. Achieving faster rates of productivity growth (and therefore greater average growth in av-erage salaries) would undoubtedly facilitate acceptance of these changes.
The success or failure of the European monetary project depends on the abil-ity of the Spanish government, and other governments and community institu-tions responsible for economic policy, to put into practice the reforms necessary to implement these stabilising mechanisms.
4 See discussion in Galí and Monacelli (2008).

146 Spain and the euro. The fi rst ten years
References
BENTOLILA, S., J. J. DOLADO and J. F. JIMENO (2009). “Does Immigration affect the Phillips Curve: Some Evidence for Spain”, European Economic Review, 52 (8), pp. 1398-1423.
GALÍ, J., and T. MONACELLI (2008). “Optimal Monetary and Fiscal Policy in a Currency Union”, Journal of International Economics, 76 (1), pp. 116-132.

EMU and financialmarkets


Luis M. Viceira, Harvard Business School and Ricardo Gimeno, Banco de España
The euro as a reserve currency for global investors
1 Introduction
Reserve currencies are traditionally defined as currencies held in signifi-cant quantities by central banks and other major financial institutions as part
of their foreign exchange reserves. Under this definition, the euro has become one of the main reserve currencies in the world since its introduction in 1999, second only to the U.S. dollar. The euro represented 25.9% of worldwide official foreign exchange reserves in the first quarter of 2009, up from 18.3% in the last quarter of 2000. This growth has become mainly at the expense of the U.S. dollar which, although still represented 64.9% of worldwide official foreign exchange reserves in the first quarter of 2009, has seen its share of global reserves decline signifi-cantly from 71% in the last quarter of year 2000.1
The holding of certain currencies in significant quantities by central banks and major financial institutions reflects to a large extent a desire by households and firms to hold them. Accordingly, understanding the factors driving household de-mand for currencies can help explain what makes a currency into a reserve cur-rency. One important driver of currency demand is transactions. Many goods and services traded at a global scale such as oil are typically priced in certain curren-cies, particularly the U.S. dollar. This results in a desire by households and firms to hold those currencies to facilitate their current and future transactions of these goods. This article argues that financial considerations can also be an important driver of the demand for currencies.
As financial assets, currencies are essentially investments in cash instruments. The return to a local investor from holding a foreign currency is equal to the short-term interest rate paid on that currency plus the change in the exchange
1 IMF Statistics Department COFER database and International Financial Statistics.

150 Spain and the euro. The fi rst ten years
rate between that currency and his own local currency. As with any other finan-cial asset, investors demand for foreign currencies must be driven by either specu-lative reasons or hedging – or risk management – reasons.
Speculative demand for specific currencies arises when investors expect high returns on those currencies in excess to the interest paid on their own currency. Speculative reasons are unlikely to be a main driver of stable demand for cur-rencies. The empirical evidence about the long-term returns on the currencies of developed economies suggests that unconditional expected excess currency re-turns are close to zero; this makes them unattractive assets to hold for specula-tive reasons, at least on a long-term basis (Campbell, Serfaty-de Medeiros, and Viceira, 2010). The existing evidence that the currencies of developed econo-mies with high short-term interest rates tend to appreciate, while the currencies of developed economies with low short-term interest rates tend to depreciate,2
provides some basis for holding currencies for speculative reasons, but only on a short-term basis. The currency trading strategy implied by this empirical phe-nomenon known as the “carry trade” calls not for holding stable long positions in certain currencies, but rather for holding actively managed currency portfolios whose long positions vary with interest rates [Burnside, Eichenbaum, and Rebelo (2007), Brunnermeier, Nagel, and Pedersen (2009)]. The recent financial crisis has also provided a painful reminder that this is a risky strategy whose returns can reverse very quickly, causing important losses to investors.
A more promising venue for generating stable long-term demand for curren-cies is risk management. Currencies can help investors manage portfolio risk. First, currencies can help conservative investors seeking to minimize overall port-folio risk or consumption risk. A well-known result in dynamic portfolio choice is that the optimal portfolio that minimizes risk is composed of local-currency inflation-indexed bonds matching the investor’s consumption horizon. Inflation-indexed bonds help investors minimize risk because they help investors hedge real interest rate risk and inflation risk (Campbell and Viceira 2001, 2002; Bren-nan and Xia 2002; Campbell, Chan, and Viceira 2003; Wachter 2003). However local-currency inflation-indexed bonds are not always available to investors. An important question then is which assets best approximate the hedging properties of inflation-indexed bonds.
Nominal bonds denominated in local currency will be effective substitutes of inflation-indexed bonds only to the extent that local real interest rates and ex-pected inflation are stable at the investor’s horizon. Otherwise, they might not be good substitutes, and bonds denominated in foreign currencies might help inves-tors hedge real interest rate risk and inflation. For example, the presence of short-
2 This is known as the “forward premium puzzle” [Hansen and Hodrick (1980), Fama (1984), Hodrick (1987), Engel (1996)].

The euro as a reserve currency for global investors 151Luis M
. Viceira and Ricardo Gimeno
term inflation uncertainty makes short-term nominal bonds risky; in that case Adler and Dumas (1983) argue that portfolios of short-term bonds denominated in foreign currencies can help short-term investors minimize risk. However, this argument for holding foreign currencies is not likely to have significant practi-cal relevance for investors in developed economies, as short-term inflation risk is generally small in these economies.
If real interest rates are not stable, local-currency short-term nominal bonds are risky at long horizons, even if short-term inflation expectations are stable. They are risky because they expose investors to real interest rate risk – or reinvest-ment risk. Local-currency long-term nominal bonds can help investors hedge this risk, because they experiment capital gains when real interests fall. However, these bonds expose investors to long-term inflation risk, which can be significant in practice (Campbell and Viceira 2005). In that case, Campbell, Viceira and White (2003, CVW henceforth) argue that bonds denominated in foreign currencies with stable real interest rates can help long-term investors hedge real interest rate risk and inflation risk.
Second, currencies can also help less conservative investors who optimally hold portfolios of risky assets such as stocks or bonds to manage risk when the excess returns on certain currencies are negatively correlated with the returns on other assets. Campbell, Serfaty-de Medeiros, and Viceira (2010, CSV henceforth) argue that investors can reduce the overall volatility of their portfolios by investing in self-financing currency portfolios that effectively transform the currency exposure implicit in their portfolios of assets into exposure to the currencies whose returns are negatively correlated with the returns on those assets. Of course, if currency returns are largely uncorrelated with the returns on other assets, investors holding internationally diversified portfolios of equities and bonds should optimally avoid investing in foreign currencies by fully hedging the currency exposure implicit in their portfolios (Solnik 1974).
These arguments suggest a definition of a reserve currency from a risk man-agement perspective. A reserve currency is one that investors demand either be-cause it helps them hedge real interest rate risk and inflation risk, or because it helps them reduce the volatility of their portfolios of stocks and bonds because its return is negatively correlated with the returns on those assets. CVW find that empirically the U.S. dollar and the deutschemark and its successor the euro have been reserve currencies in the first sense. Interestingly, CSV find that these two currencies are also reserve currencies in the second sense. The evidence in CVW about the euro is limited because their sample period is mostly dominated by the deutschemark, while the evidence in CSV is more robust, because their sample period includes most of the existence of euro as a currency. This article re-exam-ines the role of the euro as a reserve currency in the sense of CVW by revising and updating their evidence for the most recent period, and reviews the evidence
152 Spain and the euro. The fi rst ten years
in CSV in detail. Of course, this raises the important question of why in equilib-rium certain currencies become reserve currencies in the risk management sense of CVW or CSV, while others do not. Hassan (2008) examines this question, and provides a rationale based on consumption risk. This article also reviews these general equilibrium arguments.
Another area of focus of this article is the exploration of the role of the euro as a currency that promotes the integration of segmented capital markets and thus risk sharing among investors in the countries that have joined the European Monetary Union (EMU). In particular, it explores if stock markets in these coun-tries have ceased to be priced locally, instead becoming priced at the level of the new currency area.
Prior research has already provided some evidence that the adoption of the euro has been conducive to capital market integration. De Santis and Gerard (2006) and Schoenmaker and Bosch (2008) document a strong decline in equity home bias after the introduction of the euro in 1999, and attribute this reduc-tion to the emergence of institutional investors – such as mutual funds, pension funds, and life insurance companies – in Europe, whose assets tripled from 44% of GDP in 1985, to 122% of GDP in 2004. Interestingly, they also document a parallel increase in regional bias, or in the preference for euro stocks in detriment of stocks from other regions in the world. Consistent with this evidence, Ferreira and Ferreira (2006) document an increase in the relative importance of industry factors over country factors in euro markets over the period 1999-2001.
Hardouvelis, Malliaropulos, and Priestley (2006, HMP henceforth) estimate the conditional probability that the expected return on a member country stock market is priced by a euro zone CAPM. They model this probability as a function of for-ward interest rate differentials with Germany. They find evidence that the integra-tion of national stock markets in the Euro zone was already occurring in the second half of the 1990s, as measured by an increase in the conditional probability over time that parallels the reduction in forward rate differentials. Cappiello, Hördahl, Kadareja, and Manganelli (2006, CHKM henceforth) also examine the empirical evidence on capital markets integration using the Dynamic Conditional Correlation-GARCH model of Engle (2002). They find that the cross-sectional average of condi-tional correlations among euro capital markets increased over time during the period 1987-2005. They find strong evidence of integration of government bond markets but, in contrast to HMP, much weaker evidence of stock market integration.
This article also investigates if national stock markets in the euro area have become more integrated after the introduction of the euro. Our analysis adds to the existing evidence about stock market integration in two dimensions. First, we investigate whether stocks in the euro zone have moved from a regime in which national stock markets were priced with discount rates that were predominantly country specific, to a regime in which national stock markets are predominantly

The euro as a reserve currency for global investors 153Luis M
. Viceira and Ricardo Gimeno
priced by a EMU-wide common discount rate. Second, our sample period ex-tends through late 2008; thus we consider almost nine years of existence of a common currency.
If expected stock excess returns are time varying, stock prices will move in re-sponse to either news about cash flows, or news about discount rates (Campbell 1991). As capital markets become integrated, we should expect discount rates to exhibit increased co-movement with a common EMU discount rate, while cash flows may or may not exhibit increased common variation, since they will be sub-ject not only to common aggregate macroeconomic shocks, but also to regional, industry, and company specific shocks. We test this hypothesis by adapting the beta decomposition methodology of Campbell and Vuolteenaho (2004), and Campbell, Polk, and Vuolteenaho (2010) to an examination of capital integration.
This article is structured as follows. Section 2 examines the role of the euro as a reserve currency for conservative global investors. Section 3 examines the role of the euro for global equity investors. Section 4 examines whether the euro has promoted increased capital market integration among EMU members. Finally, Section 5 concludes.
2 The euro as a safe currency
The conventional view on currencies states that holding foreign currencies is a risky investment. This view is rooted in the perception that real exchange rates are volatile and largely uncorrelated with the returns on other assets. In that case, investors should optimally hedge all foreign currency exposure implicit in their internationally diversified portfolios (Solnik, 1974). Indeed, Perold and Schul-man (1988) and others find that full hedging of currency exposure can substan-tially reduce the short-term return volatility of internationally diversified portfo-lios of bonds and equities of US investors. However, recent research in Finance has challenged this view on both empirical and theoretical grounds.
A first challenge to the conventional view on currency hedge comes from ex-amining empirically whether ex-ante real interest rates are constant over time as Fama (1975) famously asserted and, if they are not, whether currencies can play a role in helping investors hedge against unfavorable changes in future real inter-est rates. Recent empirical research has estimated that real interest rates have been subject to persistent shocks since the 1970’s in the U.S., which has resulted in sta-tistically and economically significant real interest rate variation (Campbell and Viceira 2001, Campbell, Sunderan, and Viceira 2009). Inflation-indexed bonds, which several countries around the world have been issuing during the last two decades, provide direct evidence that ex-ante real interest rates move considerably over time (Campbell, Shiller, and Viceira 2009).

154 Spain and the euro. The fi rst ten years
Time variation in real interest rates has important implications about what constitutes the minimum risk asset or portfolio of assets across investment ho-rizons. Real interest rate risk makes investing in default-free short-term govern-ment bonds risky at long horizons, as the future rates of reinvestment of these bonds are uncertain.3 Long-term investors can avoid this risk by investing instead in a portfolio of long-dated inflation-indexed bonds matching the timing and horizon of their consumption plans (Campbell and Viceira 2001, 2002, Brennan and Xia 2002, Campbell, Chan, and Viceira 2003, Wachter 2003).
In the absence of inflation-indexed bonds available for investment, long-term conservative investors will seek to replicate the payoffs on the optimal portfo-lio of inflation-indexed bonds as best as they can out of existing assets available for investment. Campbell, Viceira, and White (2003) argue that currencies with historically low volatile real interest rates might help investors in countries with volatile real interest rates hedge real interest rate risk at home. Of course, this is only possible if real exchange rate risk between the home currency and the for-eign currency does not overwhelm the lower real interest rate volatility of the for-eign currency.
CVW explore this hypothesis using the long-term portfolio choice theory of Campbell, Chan, and Viceira (2003, CCV henceforth). This theory is itself an empirical implementation of Merton’s (1969, 1971, 1973) portfolio choice the-ory with time-varying investment opportunities that assumes that the dynamics of asset returns and the state variables driving variation in risk premia, real inter-est rates, and inflation are described by a first-order vector autoregressive (VAR) structure. Under this assumption, CCV derive the optimal dynamic portfolio and consumption rules of an infinitely-lived investor with Epstein-Zin (1989, 1991) recursive preferences who lives off financial wealth. CCV show that the optimal portfolio rule is linear in the VAR state vector.
Adapting CCV’s model to the case in which risk premia are constant and only the real interest rate varies over time, Campbell and Viceira (2002) show that the optimal portfolio rule takes the follwing form:
1–1–
11– 2
1t1
–11
–12/Ex1
h
[1]
In equation [1] denotes the coefficient of relative risk aversion, xt+1 denotes the vector of log returns in excess of the short-term interest rate, denotes the variance-covariance matrix of excess returns, 2 denotes the vector of excess-re-
3 These bonds can also be risky at short horizons when they are nominal, as it is typically the case. As such they are subject to short-run inflation risk. While this risk is typically very small in developed econo-mies, it can be important in developing economies with highly volatile short-term inflation.

The euro as a reserve currency for global investors 155Luis M
. Viceira and Ricardo Gimeno
turn variances, the main diagonal of , and 1 denotes the vector of covariances of each risky asset’s excess return with the short-term interest rate. The vector h contains the covariances of each excess return with revisions in expectations of future real interest rates:
1jj1t,1
jt1t1th rE–E–,xCov t
[2]
Equation [1] shows that the optimal portfolio rule for the long-term inves-tor has three components. The first two components describe an instantaneously mean-variance efficient portfolio demand, common to both long-term and short-term investors. This demand includes a speculative component based on the ex-pected excess simple return on risky assets (or equivalently, expected excess log returns plus one-half their variance), and a global minimum variance component based on the short-term volatility of the optimal portfolio. Total short-term port-folio demand is a weighted average of these two components, with weights given by 1/ – risk tolerance – and 1-1/.
The third component in [1] is specific to long-term investors. This is Merton’s intertemporal hedging demand, which is proportional to 1-1/. This demand measures to what extent intertemporal considerations lead long-horizon investors to optimally choose portfolios that deviate from the portfolios that are optimal for short-term investors. In this particular case, long-term conservative investors with > 1 optimally tilt their portfolios toward assets whose returns covary posi-tively with declines in revisions of expected future real interest rates.
CVW use the CCV model to explore the role of currencies in helping inves-tors hedge real interest rate risk. They consider four currencies – the US dollar, the British pound, the Japanese yen, and the euro and its predecessor the deut-schemark – for the period going from the first quarter of 1973 through the fourth quarter of 2001. Specifically, they consider the problem of a long-term U.S. in-vestor who is deciding how to allocate his wealth between US dollars and one of the other three currencies – i.e., between U.S. short-term government bonds and government bonds denominated in one of the other three currencies–. For sym-metry, they also consider the problem of a long-term investor in each one of the other three currency areas who is deciding how to allocate his wealth between his domestic currency and US dollars.
For each pairing of the US dollar with the other three currencies, CVW es-timate a VAR system that includes each currency’s ex post real interest rate and the real exchange rate, both of which are assumed to follow stationary processes. The real interest rate is the log three-month nominal short rate, less log realized inflation over the period, measured by the log change in the CPI. The log real

156 Spain and the euro. The fi rst ten years
exchange rate level is the log real foreign currency price of domestic currency, the sum of the log nominal exchange rate and the log domestic CPI, less the log foreign CPI. This system characterizes the dynamics of real interest rates and inflation for each currency pair. The VAR estimates are then used to compute and compare the optimal portfolio of the long-term US investor and the optimal portfolio of the long-term foreign investor.
This section develops an exercise similar to CVW, but taking the euro – and its predecessor the deutschemark – instead of the US dollar as the anchor cur-rency. Thus we estimate three VAR systems, one that includes the US dollar and the euro, a second one that includes the pound and the euro, and a third one that includes the yen and the euro. The euro is always an investment in German short-term government bonds. We also extend CVW’s sample period, bringing our sample period from the first quarter of 1973 through the fourth quarter of 2005.
Table 2.1 reports optimal portfolio allocations to short-term bonds in each currency pair for Epstein-Zin investors with relative risk aversion coefficients of 1, 5, and 2000, and unit elasticity of intertemporal substitution.4 A value of 2000 for the coefficient of relative risk aversion effectively captures the case of an infi-nitely risk averse long-term investor. This investor seeks to minimize long-run risk regardless of expected portfolio return. For comparison, the rightmost column of the table reports the portfolio held by an infinitely risk averse investor with a short-term horizon. This is the portfolio with minimum short-term variance.
The unit relative risk aversion investor allocates 50% of his portfolio to each currency, regardless of his home currency area. This result is not driven by the data, but rather from imposing that the expected log return on the domestic and on the foreign currency are equal.5 We follow CVW in adopting this convention because it allows us to focus on the demand for currencies driven by real interest rate risk hedging considerations. As the investor becomes more risk averse, the optimal allocation starts diverging from the 50-50 allocation towards the curren-cy that the investor perceives to be less risky at his investment horizon.
As risk aversion increases, long-term EMU investors place greater weight on the euro, to the extent that highly risk averse long-term EMU investors are ei-ther fully invested or overinvested in the euro regardless of which other cur-
4 Campbell and Viceira (1999) and Chacko and Viceira (2005) show that the optimal asset allocation is relatively insensitive to the choice of value for the elasticity of intertemporal substitution. We also set the subjective discount rate to 8% at an annual rate. The portfolio solutions are also not highly sensitive to this assumption.
5 The unit relative risk aversion investor is fully invested in the instantaneous speculative portfolio, which maximizes the average log portfolio return. The result that this portfolio places equal weight on do-mestic and foreign currency when their expected log return are identical follows from the relation between log portfolio return and log returns on individual assets. See Campbell and Viceira (2002), equation (2.21).

The euro as a reserve currency for global investors 157Luis M
. Viceira and Ricardo Gimeno
rency they have available for investment. By contrast, long-term US investors, long-term British investors and long-term Japanese investors decrease the al-location to their own currencies as risk aversion increases, and accordingly in-crease their allocation to the euro. Highly risk averse long-term investors all allocate more than 50% of their wealth to the euro regardless of their home currency, with British investors allocating more than 75% of their wealth. Clearly, these investors consider the euro to be a safe currency that helps them hedge real interest risk at home. This is in sharp contrast with the optimal min-imum-risk currency allocations for conservative short-term investors shown in the rightmost column of Table 2.1. This column shows that conservative short-term investors are always fully or almost fully invested in their home currency regardless of their home currency.
Chart 2.1 provides intuition about why short-term conservative investors pre-fer their home currency, but long-term conservative investors optimally allocate a highly significant fraction of their savings to the euro. Each panel in Chart 2.1 shows the annualized standard deviation of the real returns on the short-term bonds included in each of the currency pairs at different horizons, ranging from 1 to 100 quarters. The standard deviations are those implied by our estimated VAR models from the perspective of a non-euro investor.
This figure shows that foreign investors see the euro as exhibiting considerably more volatility than their own domestic currency at short horizons. For example, the US dollar exhibits a 1-quarter standard deviation of about 1% per annum and
CurrencyRelative Risk Aversion
Min ST1 5 2000 Variance
Domestic: USDollar 50.0 41.2 35.1 98.8
Euro 50.0 58.8 64.9 1.2
Domestic: Euro50.0 88.5 111.3 100.6Euro
50.0 11.5 -11.3 -0.6
Domestic: UKPound 50.0 30.0 23.4 97.3
Euro 50.0 70.0 76.6 2.7
Domestic: Euro50.0 95.8 110.9 100.2Euro
50.0 4.2 -10.9 -0.2
Domestic: JapanYen 50.0 49.9 47.5 98.2
50.0 50.1 52.5 1.8
Domestic: Euro50.0 88.3 111.2 101.3
Yen 50.0 11.7 -11.2 -1.3
OPTIMAL CURRENCY ALLOCATIONTABLE 2.1
This table reports optimal portfolio allocations to short -term bonds in each currency pair for Epstein-Zin investors. The allocations are based on VAR estimates for the period 1973.Q1-2005.Q4. The VAR includes the real interest rate for each currency included in the pair, and the real exchange rate between the two currencies. The allocations impose equality of the expected log return on the currencies in the pair.
Dollar
Pound
Euro
Euro
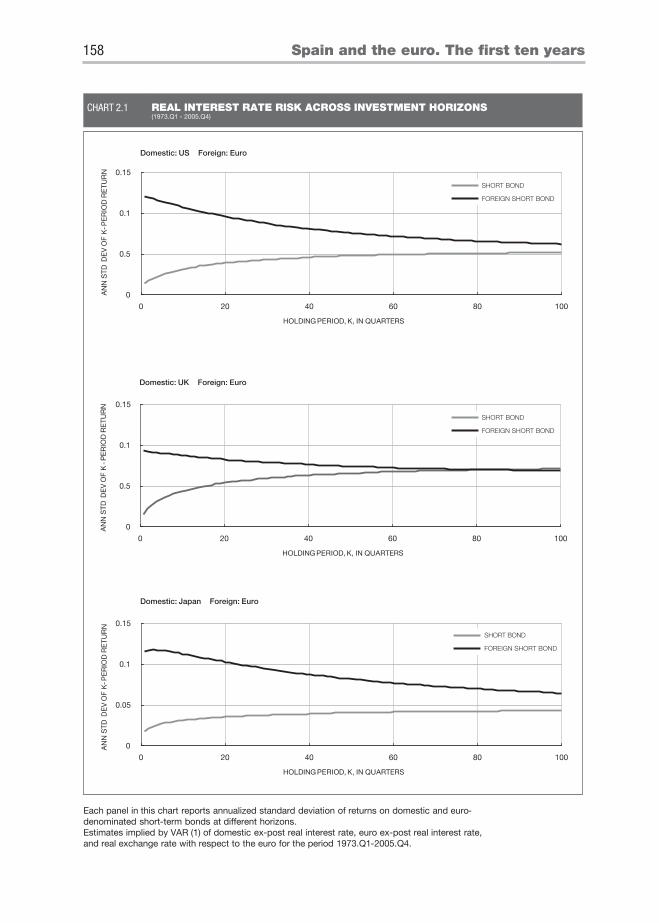
158 Spain and the euro. The fi rst ten years
0
0.5
0.1
0.15
0 20 40 60 80 100
SHORT BOND
FOREIGN SHORT BOND
Domestic: US Foreign: Euro
AN
N S
TD
DE
V O
F K
-P
ER
IOD
RE
TU
RN
HOLDING PERIOD, K, IN QUARTERS
Each panel in this chart reports annualized standard deviation of returns on domestic and euro-denominated short-term bonds at different horizons. Estimates implied by VAR (1) of domestic ex-post real interest rate, euro ex-post real interest rate, and real exchange rate with respect to the euro for the period 1973.Q1-2005.Q4.
0 20 40 60 80 100
Domestic: UK Foreign: Euro
AN
N S
TD
DE
V O
F K
-P
ER
IOD
RE
TU
RN
HOLDING PERIOD, K, IN QUARTERS
REAL INTEREST RATE RISK ACROSS INVESTMENT HORIZONS (1973.Q1 - 2005.Q4)
CHART 2.1
0
0.5
0.1
0.15
SHORT BOND
FOREIGN SHORT BOND
0
0.05
0.1
0.15
0 20 40 60 80 100
SHORT BOND
FOREIGN SHORT BOND
Domestic: Japan Foreign: Euro
AN
N S
TD
PE
RIO
D R
ET
UR
ND
EV
OF
K-
HOLDING PERIOD, K, IN QUARTERS

The euro as a reserve currency for global investors 159Luis M
. Viceira and Ricardo Gimeno
the euro exhibits a standard deviation of 12% p.a. from the perspective of a short-term US investor. Of course, the larger variability of the euro reflects the short-term volatility of the US dollar-euro exchange rate. This helps explain why a short-horizon conservative US investor will choose to invest only in his home currency.
However, as the horizon increases the standard deviation of the euro declines rapidly, while the standard deviation of each of the other currencies increase. In the case of the British investor, the standard deviation of the euro even falls slightly below the standard deviation of the pound at long horizons. At long hori-zons, fluctuations in the real return on a euro investment appear to be as volatile or even less volatile than fluctuations in domestic real interest rates in each of the other currencies, even after accounting for real exchange rate long-run variability. Thus long-horizon conservative investors do not view the euro as being much riskier than their home currency. Instead the few holding short-term bonds de-nominated in euros as not being riskier than holding short-term bonds denomi-nated in their own home currency.
Both Table 2.1 and Chart 2.1 are based on estimates from a sample period that extends far back before the introduction of the euro. To isolate the effect of the introduction of the euro, Chart 2.2 reproduces Chart 2.1 using VAR estimates based on the sample period (1999.Q1-2005.Q4). The plots in this chart show that real interest rate volatility has declined in all currencies in the latter period. However, this reduction has been roughly proportional, making the euro still an attractive currency to hold by US, Japanese, and British long-term conservative investors.
Chart 2.3 helps calibrate the magnitude of the reduction in real interest volatil-ity in the euro period. Similar to Chart 2.1 and Chart 2.2, each panel in Chart 2.3 plots the annualized standard deviation of the real return on German short-term bonds from the perspective of either a US investor, a British investor, or a Japa-nese investor. Each panel in the chart plots the standard deviation generated by a VAR estimated for the full sample period 1973-2005 (solid black line), the pre-euro sample period 1973-1998 (solid grey line), and the post-euro sample period 1999-2005 (dotted line). Chart 2.3 shows that the introduction of the euro has coincided with a period of significant decline in the long-term volatility of real interest rates and exchange rates in euro-denominated short-term bonds, relative to the period that preceded the introduction of the common currency. This de-cline has been most significant from the perspective of British investors, although it is also important from the perspective of US investors.
If the euro has provided investors with a reserve currency in the sense that it provides a vehicle for investors to hedge real interest rate risk around the world, a natural question to ask is whether this has resulted in lower average real inter-est rates in the EMU. In equilibrium, one might expect that investors who have a desire to hold a currency will be willing to receive lower compensation from

160 Spain and the euro. The fi rst ten years
0
0.05
0.1
0.15
0 20 40 60 80 100
SHORT BOND
FOREIGN SHORT BOND
Domestic: US Foreign: Euro
AN
N S
TD
DE
V O
F K
-PE
RIO
D R
ET
UR
N
HOLDING PERIOD, K, IN QUARTERS
Each panel in this chart reports annualized standard deviation of returns on domestic and euro-denominated short-term bonds at different horizons. Estimates implied by VAR (1) of domestic ex-post real interest rate, euro ex-post real interest rate, and real exchange rate with respect to the euro for the period 1999.Q1-2005.Q4.
0 20 40 60 80 100
Domestic: UK Foreign: Euro
AN
N S
TD
DE
V O
F K
-PE
RIO
D R
ET
UR
N
HOLDING PERIOD, K, IN QUARTERS
REAL INTEREST RATE RISK ACROSS INVESTMENT HORIZONS (1999.Q1 - 2005.Q4)
CHART 2.2
SHORT BOND
FOREIGN SHORT BOND
0
0.05
0.1
0.15
0 20 40 60 80 100
Domestic: Japan Foreign: Euro
AN
N S
TD
DE
V O
F K
-PE
RIO
D R
ET
UR
N
HOLDING PERIOD, K, IN QUARTERS
0
0.05
0.1
0.15
SHORT BOND
FOREIGN SHORT BOND

The euro as a reserve currency for global investors 161Luis M
. Viceira and Ricardo Gimeno
0
0.05
0.1
0.15
0 20 40 60 80 100
1973-20051973-19981999-2005
Domestic: US Foreign: Euro
AN
N S
TD
DE
V O
F K
-PE
RIO
D R
ET
UR
N
HOLDING PERIOD, K, IN QUARTERS
Each panel in this chart reports annualized standard deviation of returns on an euro-denominated short-term bonds at different horizons. Estimates implied by VAR (1) of domestic ex-post real interest rate, euro ex-post real interest rate, and real exchange rate with respect to the euro for three different periods.
0 20 40 60 80 100
1973-20051973-19981999-2005
Domestic: Japan Foreign: Euro
AN
N S
TD
DE
V O
F K
-PE
RIO
D R
ET
UR
N
HOLDING PERIOD, K, IN QUARTERS
0
0.05
0.1
0.15
0 20 40 60 80 100
1973-20051973-19981999-2005
Domestic: UK Foreign: Euro
AN
N S
TD
DE
V O
F K
-PE
RIO
D R
ET
UR
N
HOLDING PERIOD, K, IN QUARTERS
REAL INTEREST RATE RISK ACROSS INVESTMENT HORIZONS CHART 2.3
0
0.05
0.1
0.15

162 Spain and the euro. The fi rst ten years
holding it. In recent work, Hassan (2008) explores this question, and finds that excess returns to US investors on EMU member bonds fell by 1.5 percentage points after the introduction of the euro. The magnitude of this reduction is both economically and statistically significant.
Hassan (2008) shows that, more generally, there appears to be a robust neg-ative relation between interest rate differentials with respect to the US and the economic size of a currency area, as measured by its share of total O.E.C.D. out-put. In the period 1980-2007, bonds from a currency with a 10% share of total O.E.C.D. output returned to US investors between 2 and 3 percentage points less than bonds from a currency area with a very small share of total output.
Of course, an interesting question is why in equilibrium larger economic ar-eas enjoy lower interest rates, and currency unions result in further reductions in interest rates for participating countries. Hassan (2008) argues that consumption risk insurance is the mechanism that explains this phenomenon. Larger economic areas represent a larger share of global consumption of both tradable goods and non-tradable goods. This means that adverse shocks to a large economic area are more likely to represent an adverse shock to global consumption, against which risk averse investors around the world want to protect themselves.
But the assets providing the hedge are precisely bonds from this area – as well as stocks representing ownership of production of the area non-tradable goods. The reason is that when the supply of non-tradable goods in a particular area experiments an adverse shock, its currency tends to appreciate, as non-tradable goods become relatively more expensive. This appreciation in turn results in posi-tive returns for the bonds issued in the area, thus making these bonds attractive assets to hold for risk averse investors around the globe.
3 The euro as a reserve currency for aggressive investors
Section 2 has shown empirical evidence suggesting that the euro provides glo-bal investors with a stable currency that helps them hedge real interest rate risk – or reinvestment risk. Equation [1] shows that this is the risk which concerns conservative long-term investors the most, as these investors avoid holding risky assets in their portfolios.
By contrast, equation [1] shows that aggressive and moderately risk averse in-vestors – whose risk tolerance (1/) is non-zero – are willing to hold risky assets such as equities in their portfolios. For example many investors, particularly insti-tutional investors, hold internationally diversified equity portfolios. These inves-tors face the important decision of deciding how much of the currency exposure implied by their portfolio holdings they want to hedge.
The euro as a reserve currency for global investors 163Luis M
. Viceira and Ricardo Gimeno
An unhedged position in international equity corresponds to a long position in foreign currency equal to the equity holding. Investors can alter this position, enhancing it or offsetting it, by taking simultaneous long or short positions in short-term bonds denominated in the foreign currency.6 A fully hedged position corresponds to a zero net position in foreign currency, which the investor achieves by effectively shorting bonds in the foreign currency one-for-one with the cur-rency position implicit in the equity position, and using the proceeds to invest in bonds denominated in the investor’s home currency. This results in pure exposure to stock market risk from the foreign currency area, with zero net exposure to the foreign currency. A fully hedged currency position is equivalent to a zero net de-mand for the currency.
An unhedged foreign equity position is one in which the investor does not take any positions in foreign and domestic bonds to offset the currency exposure implied by the equity position. This is equivalent to having a net demand for the foreign currency equal to the amount invested in the foreign stock. Of course, zero or full hedging are not the only possible choices for investors. They may choose exposures, or net foreign currency demands, along a continuum of values that include overhedging – effectively holding a short net exposure to the cur-rency – and underhedging.
CSV study optimal currency demand – or equivalently, optimal currency hedging – from the perspective of an investor who is already invested in a port-folio of international assets, and chooses the vector of currency exposures that minimizes the short-term volatility of his overall portfolio. They label the result-ing vector of optimal risk-minimizing net currency demands as “risk management net currency demands.”
Formally, CSV estimate the second term –1 1 in equation [1] when the benchmark asset 1 is an internationally diversified portfolio of equities or bonds, and the choice variable is a vector of net currency demands. In that case, –1 1 takes the form
1t
h1t,pt
1–1tt ƒ,xCovƒVar–
[3]
where xhp,t+1 denotes the currency hedged log return on the portfolio of interna-
tional risky assets in excess of the investor’s domestic short-term nominal interest rate, and ƒt+1 denotes the vector of log excess currency returns.7
6 This can be done cheaply and efficiently through appropriate positions in forward currency contracts. 7 Note that the log excess return on currency c is equal to ,i–isƒ d
tt,c1t,c1t,c where sc,t+1 is the change in the log exchange rate, ic, t is the log short-term nominal interest rate in currency c, and idt is the domestic counterpart of the latter.

164 Spain and the euro. The fi rst ten years
Equation [3] shows that the vector of risk management net currency demands is proportional to the negative of the covariance between the returns on the assets held in the portfolio (say, stocks) and exchange rates.
Risk management currency demands are positive when stock returns and exchange rates are negatively correlated. To understand why risk management currency demands are proportional to the negative of the correlation between stock returns and exchange rates, note that a negative correlation implies that the domestic currency tends to depreciate with respect to the foreign curren-cy when stocks fall. Equivalently, the returns from holding foreign tend to be positive when the returns from holding stocks fall. Thus equity investors can reduce portfolio volatility by holding positive net foreign currency positions or, equivalently, by underhedging the currency exposure implied by their foreign equity positions.
If stock returns and exchange rates are uncorrelated, risk management curren-cy demand is zero. In this case holding currency exposure adds volatility to inves-tors portfolios and, unless this volatility is compensated, investors are better off holding no currency exposure at all or, equivalently, by engaging in full currency hedging. If stock returns and exchange rates are positively correlated, investors can reduce portfolio volatility by overhedging, that is, by shorting foreign cur-rency in excess of what would be required to fully hedge the currency exposure implicit in the stock portfolio.
CSV estimate risk management net currency demands for investors hold-ing both an equally-weighted portfolio and a value-weighted portfolio of glo-bal stocks comprising the EMU area (or “Euroland”), plus Australia, Canada, Japan, Switzerland, the UK, and the US. They also consider investors who are fully invested in each of these markets individually. Their estimates consider the 30-year period between July 1975 and December 2005, as well as the sub-samples running from 1975 through 1989 (“Subsample I”), and from 1990 through 2005 (“Subsample II”). They define Euroland as a value-weighted stock basket that includes Germany, France, Italy, and the Netherlands; these are the EMU countries with the longest history of stock returns, interest rates, and exchange rates available. Prior to the introduction of the euro, they con-sider a basket of national currencies. Their results are robust to restricting the study to include only the German stock market and the deustchemark prior to the introduction of the euro.
Table 3.1, which reproduces Table IV in their paper, reports the vector of estimated optimal risk management currency demands generated by the equally-weighted global stock portfolio, for both the full sample and the two subsamples. Panel A considers the case in which investors have access to all seven currencies from the countries included in the portfolio. Panel B ex-cludes Canada and Switzerland from the analysis, as the currency and stock

The euro as a reserve currency for global investors 165Luis M
. Viceira and Ricardo Gimeno
market of each are highly correlated with those in the US and Euroland mar-kets, respectively.8
The estimated optimal currency exposures reported in the table reflect the amounts optimally invested in each currency per euro of exposure to the global equity portfolio. By construction, these exposures add up to zero; that is, the op-timal currency portfolio is a zero net investment portfolio. These exposures can be easily restated in terms of hedging demands by noting that zero net currency demand is equivalent to fully hedging the currency position implied by the stock portfolio, which is invested about 14% in the equities of each currency area.
Panel A shows that the risk management currency portfolio includes statisti-cally and economically significant exposures to the euro and the Swiss franc in
8 CSV show that the vector of optimal currency demands generated by a given global portfolio is the same regardless of the currency base when investors from each currency have access to all other currencies. Accordingly, the table reports only one set of currency demands, which add up to zero.
CurrencyTime period
Euroland Australia Canada Japan Switzerland U.K. U.S.
Panel A: 7 country optimization
Full period 0.32* -0.11 0.61*** 0.17* 0.27* -0.10 0.40**
(0.17) (0.09) (0.16) (0.09) (0.15) -0.11 -0.18
Subperiod I 0.14 -0.05 0.63** -0.20 0.22 -0.09 0.62*
(0.21) (0.12) (0.26) -0.14 (0.18) -0.15 -0.35
Subperiod II 0.44 -0.17 0.65*** -0.08 0.37 -0.12 0.22
(0.28) (0.14) (0.21) (0.10) (0.23) (0.14) (0.19)
Panel B: 5 country optimization
Full period 0.56*** 0.27*** 0.14* -0.09 -0.06
(0.11) (0.10) (0.08) (0.11) (0.14)
Subperiod I 0.35** -0.15 -0.15 -0.10 -0.05
(0.17) (0.11) (0.11) (0.15) (0.20)
Subperiod II 0.79*** 0.47*** -0.06 -0.11 -0.15
(0.13) (0.12) (0.11) (0.13) (0.17)
OPTIMAL CURRENCY EXPOSURE FOR AN EQUALLY WEIGHTED GLOBAL EQUITY PORTFOLIO: MULTIPLE CURRENCY CASE
TABLE 3.1
SOURCE: Campbell, Serfaty-de Medeiros, and Viceira (2010). This table considers an investor holding a portfolio composed of stocks from all countries, with equal weights, who chooses a vector of positions in all available foreign currencies to minimize the variance of his portfolio. In this case, the optimal currency positions do not depend on the investor's base country. Panel A considers a case where all seven currencies are available, whereas Panel B excludes the Canadian dollar and the Swiss franc. Within each panel, rows indicate the time period over which the optimization is computed, columns the currencies used to manage risk. The full period runs from 1975 to 2005, the first subperiod covers the years 1975 through 1989, and the second subperiod covers the rest of the sample. Reported currency positions are the amount of dollars invested in foreign currency per dollar in the portfolio. We run monthly regressions on overlapping three-month returns. Standard errors are corrected for autocorrelation due to overlapping intervals using the Newey-West procedure.
166 Spain and the euro. The fi rst ten years
the full sample, at 32% and 27% respectively. These are the largest long opti-mal risk management net currency demands after the optimal 40% exposure to the US dollar. The 32% exposure to the euro means that, say, a British investor holding the equally weighted global equity portfolio would optimally choose not to hedge his 14% exposure to Euroland stock markets by shorting short-term Euroland government bonds (say, German or French) worth 14 pounds per 100 pounds invested in the equity portfolio; instead, he would buy euro bonds worth 18 pounds, for a total euro exposure of 32 pounds per 100-pound equity investment. Additionally, the investor would also hold long exposures of 27 pounds and 40 pounds to the Swiss franc and the US dollar respectively. He would then finance the long euro, Swiss franc, and US dollar positions with the proceeds from short positions worth 11, 61, 17, and 11 pounds in the Austral-ian dollar, the Canadian dollar, the Japanese yen and the British pound itself. Equivalently, the optimal risk management currency portfolio implies under-hedging the euro, Swiss franc, and US dollar exposures implied by the equally-weighted global equity portfolio, and overhedging the exposures to all other four currencies.
The optimal risk management net currency demand for the euro increas-es dramatically when we exclude the Swiss franc from the menu of currencies. Panel B shows that in that case the net demand for euro increases to 56% and becomes statistically significant at the 1% significance level, suggesting that the euro and the Swiss franc are very close substitutes. Strikingly, Panel B also shows that the demand for the euro becomes even stronger in the second sub-period, when at 79% is at least twice as large as the demand estimated for the first subperiod. Chart 3.1, which reproduces Chart 2.2 in CSV, provides visual intuition of what drives this result. This figure plots the 3-month annualized return of the euro against an equally weighted basket of other currencies, to-gether with the currency-hedged excess global equity return. It shows a mark-edly increase in the negative comovement of the euro with the global equity portfolio in the second subsample.
Panel B in Table 3.1 also shows that the exclusion of the Canadian dollar from the menu of currencies results in a very small and statistically insignifi-cant demand for the US dollar. Thus the optimal exposures to the US dollar and the Canadian dollar are not independent of each other: It is a long-short US dollar-Canadian dollar what helps global equity investors reduce portfolio risk. The subsample analysis in Table 3.1 also suggests a diminishing role of the dollar in the second subperiod as a currency that helps investors hedge adverse movements in global equity markets.
The empirical analysis of risk management currency demands of CSV sug-gests that the euro, together with the Swiss franc, and the US dollar, has become a reserve currency for global equity investors. By holding exposure to the euro,

The euro as a reserve currency for global investors 167Luis M
. Viceira and Ricardo Gimeno
these investors can reduce the volatility of their internationally diversified equity portfolios, because the euro, like its close substitute the Swiss franc, and the US dollar, tend to strengthen when global stock markets fall. CSV show that the re-ductions in portfolio volatility that investors can achieve by following optimal risk management currency exposure policies are important, both in economic and statistical terms, relative to conventional policies of either no hedging or fully hedging currency exposures. These gains are particularly substantial for investors whose domestic currencies are not reserve currencies. Currency movements dur-ing the financial crisis of 2008, when reserve currencies have tended to strengthen against other currencies, have confirmed the attractiveness of holding reserve cur-rencies as hedges for equity investors.
4 The euro and capital market integration in the EMU
Sections 2 and 3 have discussed empirical evidence suggesting that the adop-tion of the euro has resulted in a reserve currency that benefits investors around the world. This section explores whether the creation of the common currency has also resulted in additional benefits for EMU investors, by promoting better risk sharing. Specifically, we look for empirical evidence of an increasing impor-tance of a euro-wide discount factor pricing the national stock markets in the EMU area in the period subsequent to the creation of the euro. If national stock
-150
-100
-50
0
50
1975m 1 1980m 1 1985 m1 1990m 1 1995 m1 2000m 1 2005m 1
EUROWORLD STOCK MARKET
DATE
SOURCE: Campbell, Serfaty-de Medeiros, and Viceira (2010).
EXCESS RETURNS ON THE EURO AND THE HEDGED WORLD STOCK MARKET PORTFOLIO
CHART 3.1

168 Spain and the euro. The fi rst ten years
markets are priced at the EMU level, this would suggest improved integration of the national stock markets in the euro zone.
Our empirical analysis starts from the asset return decomposition of Campbell and Shiller (1988) and Campbell (1991). This decomposition writes unexpected stock returns as a linear combination of revisions in expected future dividends (cash flow news) and returns (discount rate news):
1t,DR1t,CF
j1t0j
jt1tj1t
0j
jt1t1tt1t
N–N
r)E–E(–d)E–E(rE–r
[4]
where rt denotes log (or continuously compounded) stock returns, dt denotes net payouts (or cash flows) on the stock, denotes the first-difference operator, and is a loglinearization constant equal 1/[1+exp (d – p)] , where (d – p) is the aver-age log dividend-price ratio. The stock return decomposition shown in equation [4] says that stock returns respond positively to changes in investors’ expectations of future cash flows, and negatively to changes in required discount rates.
In an integrated capital market, there is no reason to expect that cash flow news will be highly correlated across stocks. Cash flow news reflects changes in dividend policies and earnings, which in turn reflect the economic realities of in-dividual firms and sectors.
However, required returns are set by investors, not firms. An integrated capital market is by definition one in which securities are priced by a common discount factor. In the context of our empirical exercise, one should expect that as national stock markets become more integrated, the returns of national stock markets will exhibit increasing covariation, or beta, with EMU-wide discount rate news.
To test this hypothesis we adapt the CAPM beta decomposition of Campbell and Vuolteenaho (2004) and Campbell, Polk, and Vuolteenaho (2010) to test for capital market integration. The conditional CAPM beta of any asset with respect to the market is given by
1t,Mt
1t,M1t,itM,i
rVar
r,rCov
[5]
Simple substitution of the asset return decomposition [4] for the case r = rM in the numerator of [5] allows us to write the CAPM beta of any asset as
i,M = i,CFM + i,DRM

The euro as a reserve currency for global investors 169Luis M
. Viceira and Ricardo Gimeno
where
1t,Mt
1t,CF,M1t,itCFM,i
rVar
N,rCov
[6]
and
1t,Mt
1t,DR,M1t,itDRM,i
rVar
N–,rCov
[7]
If stock markets have become more integrated with the adoption of the euro, we should expect the discount rate news CAPM beta of national stock markets i,DRM to be larger after the adoption of the euro.
Following this intuition, we estimate sample counterparts of the total CAPM beta [5], the cash flow beta [6] and the discount rate beta [7] for the pre-euro and post-euro periods, and test whether those betas have changed significantly between both periods. We expect discount rate betas [7] to have increased in the post-euro period. Of course, the integration process might have been dynamic, occurring not at a single date but rather during the years surrounding the adop-tion of the euro. In that case, our tests will be biased against finding evidence of increased market integration.
Our estimates of betas are based on time series of monthly unexpected stock returns, cash flow news and discount rates for each national stock market and for a value-weighted basket of stock markets in the EMU area. Of course, the components of stock returns are not directly observable, and must be estimated. Following Campbell (1991) and Campbell and Mei (1993), we estimate a first-order vector autoregressive (VAR) system for each market, and use the estimates to obtain estimates of unexpected stock returns, cash-flow news, and discount rate news.
The VAR system for each market includes the log return on the market in ex-cess of the local short-term interest rate, the log dividend-price ratio on the local market, the local nominal short-term log interest rate, and the log real return on local short-term government bonds – i.e., the ex-post local real interest rate. We estimate a VAR system for each of the countries that joined the EMU, for the EMU-wide stock market,9 and for several non-euro developed markets – specifi-
9 The VAR system for the EMU-wide stock market uses German nomimal interest rates and inflation as proxies for the EMU area nominal interest rates and inflation. The EMU-wide stock market returns are measured in deutschemarks in the pre-euro period.

170 Spain and the euro. The fi rst ten years
cally, Japan, Norway, Sweden, Switzerland, the United Kingdom, and the United States. The source for stock market returns and dividend price ratios is Morgan Stanley Capital International (MSCI). The source for exchange rates, short-term interest rates, and inflation is the International Financial Statistics database pub-lished by the International Monetary Fund. Our sample period extends from July 1975 through November 2008.
Table 4.1 reports the full sample, the pre-euro, and the post-euro estimates of the total CAPM beta [5] of each market with respect to the EMU-wide stock market. The last column in the table also reports the results from test-ing whether the pre- and post-euro betas are statistically significant. The table shows an increase in the average beta for euro-zone markets. However, this change is not uniform and it is not statistically significant in most cases. Some markets like Austria or Belgium have experimented large, statistically signifi-cant increases, but most other markets have experienced only small increases or no increases at all – with one market, Ireland, experimenting a decrease. The average beta for non-euro markets is only slightly larger in the post-euro period, although this average hides large cross-sectional variation in both di-rections.
The results shown in Table 4.1 might lead to conclude that there is little evi-dence that the adoption of the euro is correlated with an increase in stock mar-ket integration across EMU economies. However, we have noted that total beta reflects the covariation of stock returns with both aggregate cash-flow news and discount rate news. It could well be the case that stock market integration has oc-curred simultaneously with offsetting changes in the covariation of stock returns with aggregate cash flow news, perhaps because of increased sector specialization of EMU economies. Accordingly, one might want to isolate the discount rate news component of the aggregate EMU stock market, and test whether national stock markets in the euro area have changed their covariance with respect to ag-gregate discount rate news.
Table 4.2 shows the discount rate beta [7] of national stock markets with re-spect to discount-rate news in the EMU-wide stock market. The results shown in this table are remarkably different from those shown in Table 4.1. Table 4.2 shows that, except for the Greek stock market, all post-euro betas in the euro zone are larger than the pre-euro betas. This differences are economically large in most cases, and statistically significant at the 1% level in five of the euro zone markets – and statistically significant at the 10% level or lower in seven of the euro zone markets. The average discount rate beta has increased from about 0.54 to 0.82.
The betas of non-euro zone markets also show statistically significant chang-es. However, these changes go in all directions. The Swedish stock market has experimented an economically and statistically significant increase in its dis-

The euro as a reserve currency for global investors 171Luis M
. Viceira and Ricardo Gimeno
count rate beta with respect to the EMU stock market, while other markets like the Norwegian stock market and the U.K. stock market have seen their dis-count rate betas decrease substantially. The Swiss market has seen an economi-cally small but statistically significant increase in its discount rate beta. One possible interpretation of these results is that some non-euro markets like the Swedish market have effectively become priced at the euro level even though they are not part of the euro, perhaps through increased economic integration with the euro area, while others have experimented a decline in the importance of euro factors in their pricing.
Table 4.3 furthers this analysis by looking at the covariation of innovations to the log dividend-price ratio of each national market with the innovations to the log dividend-price ratio of the aggregate EMU-wide stock basket. This table uses the innovations to the log dividend-price ratio as a direct measure of discount-rate news. Campbell, Lo, and Mackinlay (1997) note that simple ma-nipulation of the log linear decomposition of log returns [4] implies that
Full Sample Pre € Post € Difference
Euro Zone
Austria 0.861 0.772 1.036 **
Belgium 0.956 0.827 1.200 ***
Finland 1.089 0.869 1.189
France 1.074 1.072 1.085
Germany 0.993 1.005 1.017 ***
Greece 0.730 0.542 0.945
Ireland 0.765 0.870 0.621
Italy 0.901 0.863 0.982
Netherlands 0.843 0.860 0.826 ***
Portugal 0.721 0.629 0.711
Spain 0.916 0.859 1.018
Mean Euro Zone 0.985 0.833 0.967
Japan 0.387 0.472 0.582
Norway 0.949 1.005 0.873
Sweden 1.028 0.833 1.405 ***
Switzerland 0.836 0.913 0.688 ***
United Kingdom 0.993 1.090 0.835 ***
United States 0.578 0.508 0.720 ***
Mean No euro 0.795 0.804 0.851
CAPM BETA WITH RESPECT TO EMU BASKET (1975.07 - 2008.11)
TABLE 4.1
The Difference column provides significance levels of the test of the null hypothesis that the pre-euro and post-euro betas are equal. A single asterisk indicates rejection of the null of equality at the 10% significance level; two asterisks indicate rejection at the 5% significance level; and three asterisks indicate rejection at the 1% significance level.

172 Spain and the euro. The fi rst ten years
Full Sample Pre € Post € Difference
Euro Zone
Austria 0.523 0.386 0.786 ***
Belgium 0.587 0.357 1.022 ***
Finland 0.772 0.510 0.924
France 0.798 0.705 0.985 ***
Germany 0.596 0.516 0.811 ***
Greece 0.866 0.594 1.021
Ireland 0.535 0.607 0.437
Italy 0.717 0.675 0.808 **
Netherlands 0.543 0.492 0.656 ***
Portugal 0.700 0.576 0.728
Spain 0.630 0.507 0.862
Mean Euro Zone 0.661 0.539 0.822
Japan 0.451 0.405 0.546 **
Norway 0.818 0.959 0.570 ***
Sweden 0.743 0.528 1.160 ***
Switzerland 0.520 0.493 0.569 ***
United Kingdom 0.757 0.799 0.699 **
United States 0.593 0.530 0.724 *
Mean No euro 0.647 0.619 0.711
BETA OF RETURNS ON NATIONAL STOCK MARKETS WITH RESPECT TO EMU DISCOUNT RATE NEWS (1975.07 - 2008.11)
TABLE 4.2
The Difference column provides significance levels of the test of the null hypothesis that the pre-euro and post-euro betas are equal. A single asterisk indicates rejection of the null of equality at the 10% significance level; two asterisks indicate rejection at the 5% significance level; and three asterisks indicate rejection at the 1% significance level.
0jj1t
jt
0jj1t
jttt rEdE–
–1k
–p–d
where k –– –log () – (1–) log (1/–1). If expected dividend growth is constant or approximately constant (Cochrane 2007), the dividend-price ratio should be a direct measure of expected future discount rates and its innovations a direct measure of discount-rate news. In fact, the dividend-price ratio has been shown to be the most successful forecasting variable for stock returns (Campbell and Shiller 1988, Fama and French 1988, Campbell and Thompson 2008, Cochrane 2007). In fact, it is the main predictor of stock returns in our estimated VAR systems.
Table 4.3 reports the regression coefficient that obtains from regressing shocks to the log dividend-price ratio of each national stock market onto shocks to the log dividend-price ratio of the EMU-wide stock basket. This table provides strong evidence of an economically large increase in the covariation of national

The euro as a reserve currency for global investors 173Luis M
. Viceira and Ricardo Gimeno
Full Sample Pre € Post € Difference
Euro Zone
Austria 0.356 0.197 0.853 ***
Belgium 1.471 1.257 2.156 ***
Finland 0.913 0.734 1.119 **
France 1.002 0.932 1.243 **
Germany 0.846 0.767 1.299 ***
Greece 0.248 -0.126 0.618
Ireland 0.334 0.010 0.739 ***
Italy 0.747 0.541 1.392 ***
Netherlands 1.177 1.142 1.342
Portugal 0.274 0.065 0.442
Spain 0.827 0.748 1.060
Mean Euro Zone 0.745 0.570 1.115
Japan 0.152 0.166 0.103
Norway 0.724 0.665 0.986 *
Sweden 0.756 0.609 1.237 ***
Switzerland 0.389 0.416 0.308
United Kingdom 1.172 1.255 0.939 ***
United States 0.525 0.558 0.438
Mean No euro 0.620 0.612 0.669
BETA OF DISCOUNT RATE NEWS ON NATIONAL MARKETS WITH RESPECT TO EMU-WIDE DISCOUNT RATE NEWS(PROXIED BY D/P RATIO, 1975.07 - 2008.11)
TABLE 4.3
The Difference column provides significance levels of the test of the null hypothesis that the pre-euro and post-euro betas are equal. A single asterisk indicates rejection of the null of equality at the 10% significance level; two asterisks indicate rejection at the 5% significance level; and three asterisks indicate rejection at the 1% significance level.
discount rate news in the euro area with EMU-wide discount rate news. By con-trast, there is not much evidence of an increase in the covariation of discount rate news in non-euro stock markets with EMU-wide discount rate news, with the ex-ception of Sweden. These findings suggest that the results shown in Table 4.2 are driven by increased covariation of discount rate news in the euro area which has not happened outside the area. As such, they are consistent with an interpretation that there has been increased integration of the national stock markets in the euro area after the adoption of the euro.
5 Concluding remarks
This article has examined whether the adoption of the euro has brought ben-efits to investors around the world. We have provided new empirical evidence and summarized recent empirical findings suggesting that the euro has become

174 Spain and the euro. The fi rst ten years
a reserve currency for global investors, both conservative and risk tolerant. Our extension of the work of Campbell, Viceira and White (2003) suggests that, in the absence of domestic inflation-indexed bonds, the euro can help conservative long-term investors to hedge real interest rate risk. While the optimal portfolios of short-term conservative investors remain heavily biased toward domestic short-term government bonds, the optimal portfolios of long-term conservative inves-tors allocate a significant fraction of holdings to euro-denominated short-term government bonds. Long-term conservative investors optimally invest in euros because their currency returns appear to be negatively correlated with revisions in expected future real interest rates. Essentially, real interest rates appear to be more stable in the euro area. At short-horizons, short-term exchange rate volatil-ity makes currency returns on the euro highly volatile relative to returns on do-mestic short-term government bonds. However, this volatility appears to subside significantly at long horizons, making euro-denominated short-term government bonds attractive assets to long-term conservative investors worldwide.
We have also summarized the recent findings in Campbell, Serfaty-de Me-deiros, and Viceira (2010) about the benefits of holding euros for global equity investors. They show robust empirical evidence that excess currency returns on the euro exhibit a negative correlation with global stock market returns. Global equity investors can achieve statistical and economically significant reductions in the volatility of their portfolios by not hedging their exposure to the euro.
We have also provided new empirical evidence about increased market integra-tion of national stock markets in the EMU. Consistent with the intuition that an integrated capital market is one in which there is a common discount factor pricing securities, we have explored if stocks in the euro area have moved from a regime in which national stock markets were priced with discount rates that were predominantly country-specific, to a regime in which national stock markets are predominantly priced by an euro-wide common discount rate. Our empirical ex-amination of this question builds on the CAPM beta decomposition of Campbell and Vuolteenaho (2004) and Campbell, Polk, and Vuolteenaho (2010). We have provided evidence of increased covariation of unexpected returns and revisions in expectations of discount rates of national stock markets in the euro area with revisions in expectations of EMU-wide discount rates. This evidence suggests im-proved capital market integration in the euro zone, and consequently improved risk sharing among EMU economies.
Therefore, the evidence suggests that the adoption of the euro has benefited investors around the world, by providing them with a reserve currency. Investors in the countries that joined the euro have also benefited from increased capital market integration of their national stock markets, thus improving risk sharing in the euro zone.
The euro as a reserve currency for global investors 175Luis M
. Viceira and Ricardo Gimeno
References
ADLER, M., and B. DUMAS (1983). “International portfolio choice and corporation finance: A synthesis”, Journal of Finance, Vol. 38 (3), pp. 925-984.
BRENNAN, M. J., and Y. XIA (2002). “Dynamic asset allocation under inflation”, Journal of Finance, Vol. 57 (3), pp. 1201-1238.
BRUNNERMEIER, M., S. NAGEL and L. PEDERSEN (2009). “Carry Trades and Currency Crashes”, Macroeconomics Annual, Vol. 23. pp. 313-348.
BURNSIDE, C., M. EICHENBAUM and S. REBELO (2007). “The returns to currency speculation in emerging markets”, The American Economic Review, Vol. 97 (2), pp. 333-338.
CAMPBELL, J. Y. (1991). “A Variance Decomposition for Stock Returns”, The Economic Journal, Vol. 101 (405), pp. 157-179.
CAMPBELL, J. Y., Y. CHAN and L. M. VICEIRA (2003). “A multivariate model of strategic asset allocation”, Journal of Financial Economics, Vol. 67 (1), pp. 41-80.
CAMPBELL, J. Y., A. LO and A. MACKINLAY (1997). The Econometrics of Financial Markets, Princeton University Press, Princeton, NJ.
CAMPBELL, J., and J. MEI (1993). “Where Do Betas Come From? Asset Price Dynamics and the Sources of Systematic Risk”, Review of Financial Studies, Vol. 6 (3), pp. 567-592.
CAMPBELL, J. Y., C. POLK and T. VUOLTEENAHO (2010). “Growth or Glamour? Fundamentals and Systematic Risk in Stock Returns”, Review of Financial Studies, 23, pp. 305-344.
CAMPBELL, J. Y., K. SERFATY-DE MEDEIROS and L. M. VICEIRA (2010). “Global Currency Hedging”, Journal of Finance, Vol. 65 (1), pp. 87-121.
CAMPBELL, J. Y., and R. SHILLER (1988). “Stock Prices, Earnings, and Expected Dividends”, Journal of Finance, Vol. 43 (3), pp. 661-676.
CAMPBELL, J. Y., R. SHILLER and L. M. VICEIRA (2009). “Understanding Inflation-In-dexed Bond Markets”, Brookings Papers on Economic Activity, Spring, pp. 79-120.
CAMPBELL, J. Y., A. SUNDERAN and L. M. VICEIRA (2009). Inflation Bets or Defal-tion Hedges? The Changing Risks of Nominal Bolds, NBER Working Paper No. 14701, February.
CAMPBELL, J. Y., and S. THOMPSON (2008). “Predicting the Equity Premium out of sample: Can Anything Beat the Historical Average?”, Review of Financial Studies, 21, pp. 1509-1531.
CAMPBELL, J. Y., and L. M. VICEIRA (1999). “Consumption and portfolio decisions when expected returns are time varying”, Quarterly Journal of Economics, Vol. 114, pp. 433-495.
— (2001). “Who should buy long-term bonds?”, American Economic Review, Vol. 91, pp. 99-127.
— (2002). Portfolio Choice of Long-Term Investors, Oxford University Press, Oxford.— (2005). “The Term Structure of the Risk: Return Trade-Off”, Financial Analysts Journal,
Vol. 61 (1), pp. 34-44.CAMPBELL, J. Y., L. M. VICEIRA and J. WHITE (2003). “Foreign Currency for Long-Term
Investors”, The Economic Journal, Vol. 113 (486), pp. 1-25.CAMPBELL, J. Y., and T. VUOLTEENAHO (2004). “Bad Beta, Good Beta”, American
Economic Review, Vol. 94 (5), pp. 1249-1275.

176 Spain and the euro. The fi rst ten years
CAPPIELLO, L., P. HÖRDAHL, A. KADAREJA and S. MANGANELLI (2006). The impact of the euro on financial markets, ECB Working Paper No. 598.
CHACKO, G., and L. M. VICEIRA (2005). “Dynamic Consumption and Portfolio Choice with Stochastic Volatility in Incomplete Markets”, Review of Financial Studies, Vol. 18 (4), pp. 1369 1402.
COCHRANE, J. (2007). “The Dog That Did Not Bark: A Defense of Return Predictability”, Review of Financial Studies, Vol. 21 (4), pp. 1533-1575.
DE SANTIS, R., and B. GERARD (2006). Financial Integration, International Portfolio Choice and the European Monetary Union, ECB Working Paper No. 626.
ENGEL, C. (1996). “The Forward Discount Anomaly and the Risk Premium: A Survey of Recent Evidence”, Journal of Empirical Finance, Vol. 3 (2), pp. 123-192.
ENGLE, R. (2002). “Dynamic Conditional Correlation: A Simple Class of Multivariate Generalized Autoregressive Conditional Heteroskedasticity Models”, Journal of Business & Economic Statistics, Vol. 20 (3), pp. 339-350.
EPSTEIN, L., and S. ZIN (1989). “Substitution, risk aversion, and the temporal behavior of consumption and asset returns: a theoretical framework”, Econometrica, Vol. 57, pp. 937-969.
— (1991). “Substitution, risk aversion, and the temporal behavior of consumption and asset returns: an empirical investigation”, Journal of Political Economy, Vol. 99, pp. 263-286.
FAMA, E. (1975). “Short-Term Interest Rates as Predictors of Inflation”, American Economic Review, Vol. 65, pp. 269-282.
— (1984). “The information in the term structure”, Journal of Financial Economics, Vol. 13, pp. 509-528.
FAMA, E., and K. FRENCH (1988). “Dividend Yields and Expected Stock Returns”, Journal of Financial Economics, Vol. 22, pp. 3-25.
FERREIRA, M. A, and M. A. FERREIRA (2006). “The Importance of Industry and Coun-try Effects in the EMU Equity Markets”, European Financial Management, Vol. 12 (3), pp. 341-373.
HANSEN, L., and R. HODRICK (1980). “Forward Exchange Rates as Optimal Predictors of Future Spot Rates: An Econometric Analysis”, Journal of Political Economy, Vol. 88 (5), pp. 829-853.
HARDOUVELIS, G., D. MALLIAROPULOS and R. PRIESTLEY (2006). “EMU and European Stock Market Integration”, Journal of Business, Vol. 79 (1), pp. 365-392.
HASSAN, T. (2008). Country Size, Currency Unions, and International Asset Returns, unpublished manuscript, Harvard University.
HODRICK, R. (1987). The Empirical Evidence on the Efficiency of Forward and Futures Foreign Exchange markets, Harwood Academic Publishers.
MERTON, R. (1969). “Lifetime portfolio selection under uncertainty: the continuous time case”, Review of Economics and Statistics, Vol. 51, pp. 247-257.
— (1971). “Optimum consumption and portfolio rules in a continuous-time model”, Journal of Economic Theory, Vol. 3, pp. 373-413.
— (1973). “An Intertemporal Capital Asset Pricing Model”, Econometrica, Vol. 41, pp. 867 887. PEROLD, A., and E. SCHULMAN (1988). “The free lunch in currency hedging: Implications
for investment policy and performance standards”, Financial Analysts Journal, Vol. 44 (3), pp. 45 50.
The euro as a reserve currency for global investors 177Luis M
. Viceira and Ricardo Gimeno
SCHOENMAKER, D., and T. BOSCH (2008). “Is the Home Bias in Equities and Bonds Declining in Europe?”, Investment Management and Financial Innovations, Vol. 5 (4), pp. 90-102.
SOLNIK, B. (1974), “An equilibrium model of the interantional capital market”, Journal of Economic Theory, Vol. 8, pp. 500-524.
WACHTER, J. (2003). “Risk Aversion and Allocation to Long-Term Bonds”, Journal of Eco-nomic Theory, Vol. 112, pp. 325-333.


Rafael Repullo
CEMFI
Comments on “The euro as a reserve currency for global investors”
1 Introduction
The paper by Luis Viceira and Ricardo Gimeno begins with the traditional definition of reserve currencies, namely “currencies held in significant quan-
tities by central banks as part of their foreign exchange reserves,” and then ar-gues that such holdings may reflect the desire of households and firms to demand them, either for transaction or for investment purposes. The focus of the paper is on the latter. In particular, it provides empirical evidence on whether the euro has become a currency that global investors want to have in their portfolios. In addition, the paper provides evidence on whether European stock markets have become more integrated after the introduction of the euro.
The motivation of the paper in terms of what accounts for central banks’ hold-ings of foreign reserves is somewhat surprising, since in a world of widespread floating exchange rates there is no exchange rate policy, and hence central banks do not need to hold foreign reserves. Also, it should be noted that in terms of the size of their balance sheets, central banks are small players relative to the size of the world capital markets, so it is unclear that the structure of their portfolio makes much of a difference (leaving aside the special case of China, a big country that is actively managing its exchange rate). Therefore, although we may not care very much about the determinants of “reserve currencies,” understanding what private investors do with their portfolios is certainly an important question. And this is what this paper is about.
The paper presents three sets of results. First, it updates and extends the analy-sis in Campbell, Viceira and White (2003) on the role of foreign currency hold-ings for risk-averse long-term investors taking the euro instead of the US dollar as the focus of the analysis. Second, it reports the results in Campbell, Serfaty-de Medeiros and Viceira (2010) on optimal currency hedging from the perspective

180 Spain and the euro. The fi rst ten years
of an investor that holds a global equity portfolio. Finally, it uses the CAPM beta decomposition of Campbell and Vuolteenaho (2004) into a cash flow beta and a discount rate beta to assess the effect of the euro on the integration of European stock markets.
2 Currency exposure as a hedge for real interest rate risk
The first set of results shows optimal portfolio allocations of risk-averse long-term investors that can hold short-term nominal bonds denominated in their domestic currency and in a single foreign currency (looking in particular at the pairs euro-dollar, euro-pound, and euro-yen). In this setup domestic short-term bonds are risky assets for a long-term investor, because future interest rates and inflation rates are uncertain, so it may be optimal to hedge the real interest rate risk by holding short-term foreign bonds. The empirical results show that highly risk-averse long-term in-vestors allocate more than 50% of their wealth to euro bonds, regardless of their home currency, a figure that goes over 100% in the case of euro-based investors.
The immediate question is what accounts for these surprising results. In other words, what is special about the euro (or the Deutsche mark prior to 1999). The authors answer it by computing the variance of the real returns of domestic and foreign short-term bonds at different investment horizons and for each of the currency pairs, showing that as the horizon increases the variance of euro bond returns rapidly declines.
A first comment on these results is that it would be interesting to see what hap-pens when we do not restrict attention to currency pairs, that is when we consider investors that can hold short-term bonds denominated in more than two currencies.
A second comment relates to the proposed explanation for the results: I do not understand the focus on the variance of returns, since hedging is mainly driven by the covariance of returns. The results suggest that there is a negative correlation be-tween the real return of short-term bonds denominated in euro and the real return of short-term bonds denominated in the three other currencies. Is there a way to explain this fact?
3 Currency hedging for global equity investors
The second part of the paper presents an analysis of optimal currency hedg-ing for a risk-averse investor that holds an exogenously given global equity port-folio. Net currency exposures should be positive (negative) when stock returns and currency returns are negatively (positively) correlated. The empirical results

Comments on “The euro as a reserve currency for global investors” 181Rafael Repullo
show that optimal exposures are very large and positive for the euro, reaching up to 79% in the estimation with five currencies for the second part (1990-2005) of the sample period. However, these exposures are estimated with large errors (most of them are not statistically significant) and they are very sensitive to the set of currencies considered in the analysis.
As before, the immediate question is what is special about the euro (or the basket of European currencies prior to 1999). The authors do not provide an ex-planation, which is a bit disappointing, as one would like to understand what is behind these very large optimal exposures.
A first comment on this set of results is that they are derived from a model es-timated for a sample period (1975-2005) in which many things have happened: the second oil shock, the fall in inflation rates, the various crisis in the exchange rate mechanism of the European Monetary System, the Japanese lost decade, the introduction of the euro, etc. Hence the probability distribution of asset and cur-rency returns may have changed. Indeed, the results suggest a structural change between the first and the second part of the sample.
A second comment relates to the fact that the reported results are static expo-sures, while optimal exposures should be dynamic, depending on the conditional distribution of returns for the relevant investment horizon, which may in turn depend on business cycle and monetary policy developments. [But Campbell, Serfati-de Medeiros and Viceira (2010) show that the results are robust to the in-troduction of dynamic exposures based on interest rate differentials.]
A third comment is that it would have been useful to explain why “the vector of optimal currency demands generated by a given global portfolio is the same regardless of the currency base when investors from each currency have access to all other currencies.”
The final comment is on the individual investor perspective. The results in-dicate how an investor holding a given global equity portfolio should structure its optimal currency hedging. But if this investor is, for example, going long on the euro and short on the yen it must be the case that other (irrational?) investors have the opposite trade. Otherwise currency markets would not be in equilib-rium. So in thinking about optimal currency exposures (or, more generally, about optimal portfolio allocations) it is important to embed the individual investor results within a general equilibrium perspective.
4 Capital market integration in the European Monetary Union
The last part of the paper tries to assess to what extent the introduction of the euro has promoted better risk-sharing among investors. The idea is to look

182 Spain and the euro. The fi rst ten years
for evidence of a greater importance of a common euro factor in the pricing of European stocks. The empirical strategy is to compute the CAPM beta for each national stock market relative to a value-weighted basket of European markets before and after the introduction of the euro, and to decompose it into a cash flow beta and a discount rate beta. The results show that the discount rate beta has gone up for (almost) all European markets, which is taken as evidence of in-creased integration of these markets.
This is an interesting set of new results. A first comment is that there is no discussion of whether one can use the CAPM (with the European basket as the market portfolio) to account for national stock returns both before and after the introduction of the euro.
A second comment relates to the fact that the overall beta has not increased in line with the increase in the discount rate beta, which means that for most Euro-pean markets the introduction of the euro has been accompanied by a decrease in the cash flow beta. In particular, the average increase in the overall beta for the euro area has been 0.13 and the average increase in the discount rate beta has been 0.28, so the cash flow beta has decreased by 0.15. Although it is argued that in an integrated capital market cash flow news should reflect “the economic reali-ties of individual firms and sectors,” the empirical analysis is based on returns of national stock markets, which arguably could be more correlated because of com-mon macroeconomic and monetary policy shocks.
5 Concluding remark
The paper by Luis Viceira and Ricardo Gimeno uses recent results on interna-tional asset pricing to assess whether the euro has become a reserve currency from the perspective of individual investors. The paper touches on a number of inter-esting issues and provides a very positive assessment of the euro. Some results are perhaps “too good to be true.” But this means that the paper leaves the door wide open to further research on this area.

Comments on “The euro as a reserve currency for global investors” 183Rafael Repullo
References
CAMPBELL, J. Y., K. SERFATYDE MEDEIROS and L. M. VICEIRA (2010). “Global Currency Hedging”, Journal of Finance, 65, pp. 87-121.
CAMPBELL, J. Y., L. M. VICEIRA and J. WHITE (2003). “Foreign Currency for Long-Term Investors”, Economic Journal, 113, pp. 1-25.
CAMPBELL, J. Y. and T. VUOLTEENAHO (2004). “Bad Beta, Good Beta”, American Economic Review, 94, pp. 1249-1275.


Jaume Ventura
CREI-UPF
Comments on “The euro as a reserve currency for global investors”
Understanding the role of the euro as a global reserve currency is an impor-tant challenge, and this excellent paper by Luis Viceira and Ricardo Gimeno
makes a substantial contribution towards this end. The authors build on two key premises or assumptions. First, the decision of holding specific currencies by central banks and financial institutions reflects to a large extent the underlying demand for currencies by households. Second, the underlying demand for currencies by house-holds reflects to a large extent whether these currencies provide a good hedge against the risks that they are facing. Armed with these assumptions, the paper goes on to showing quite convincingly that the euro is a good hedge against interest rate and equity return shocks. Since these are important risks faced by households, it follows that it is not surprising that the euro has become an important reserve currency.
The first question I have, of course, is whether the use of the expression ‘‘reflects to a large extent’’ in the previous paragraph is justified. When it comes to the deci-sion of central banks and financial institutions to hold specific currencies, I can imagine many considerations that play a role besides the desire to provide house-holds with their preferred currencies. These considerations include the importance of trade flows denominated in the currency, the desire to manage certain bilateral exchange rates, the ease within which domestic financial institutions can transact with foreign ones, and the need to fulfill legal requirements of many sorts. When it comes to the demand for currencies by households, it seems to me that transac-tion motives might play a role that is at least as important as risk management in shaping their demand for specific currencies. The paper does not provide evidence in support of the view that the value of the euro as a hedge against the risks that households face is a quantitatively important determinant of its demand as a re-serve currency. Instead, the paper asks the reader to accept this on faith. I will do so albeit somewhat reluctantly.
Imagine that you are a long term investor, i.e. somebody saving for retirement. Your optimal portfolio would be a long-term bond that matures at retirement

186 Spain and the euro. The fi rst ten years
and riskless. This means that the real return is known as of now. Unfortunate-ly, inflation-indexed long-term bonds are not available. The long-term investor is forced, as a result, to face real interest rate risk. How can this investor hedge against this risk? The answer that the authors give is simple: purchase euro-de-nominated bonds. This is true regardless of which is your home currency. This result is shown in Table 2.1 (p.157). Under the assumption that all bonds deliver the same expected log return, a long-term investor that does not care about hedg-ing real interest rate risk would hold a fully diversified portfolio. As the hedging motive becomes more important, the long-term investor holds a larger fraction of its portfolio in euro denominated bonds. This effect is large, of course, for European investors. But it is also large for UK and US investors, even though it is small for Japanese investors. The bottom line is that the euro is a good hedge against real interest rate shocks in industrialized countries, since it tends to give a high return when real interest rates are low.
Imagine that you are instead a short-term investor that looks for a high return buying a global equity portfolio. This investor is subject to currency risk and it can use portfolios of currencies to hedge part of this risk. In particular, this in-vestor would like to purchase currencies that give a high return when stock re-turns are low. The authors calculate the portfolio of currencies that minimizes the short-term volatility of this portfolio. Table 3.1 (p.165) shows that this portfolio contains a sizable fraction of euro denominated bonds. Once again, this result holds regardless of the home currency of the investor. The bottom line is that the euro is also a good hedge against equity returns shocks in industrialized countries, since it tends to give a high return when equity returns are low.
I find these results convincing and well argued. As an investor, I think I will follow Viceira and Gimeno’s advice! As an academic economist, however, it seems to me that these results are only the starting point for further research. Why is it that the returns to the euro are negatively correlated with changes in real interest rates and global stock returns? The paper does not try to address this question. To be fair to the authors, this was not their objective in the first place. Moreover, a full treatment of this question would require various research papers. Still, I would have enjoyed as a reader a bit of speculative discussion of alternative hy-potheses. Is it size that matters? Is it policy? Is it the sectoral composition of the economy? The results in this paper point towards a fascinating research program that should eventually tell us what macroeconomic factors make the euro such a good hedge against real interest rate and global equity return shocks.
The paper contains a third section that asks whether the euro has contributed to integrate capital markets across Europe. It is common to study this question by examining correlations in returns across markets, i.e. by looking at co-move-ments. The idea is that more integrated markets should co-move more. The au-thors correctly argue that this is not quite right and that simple co-movement

Comments on “The euro as a reserve currency for global investors” 187Jaum
e Ventura
studies cannot provide a clear picture of what is going on. The reason is that these studies cannot disentangle the effects of pricing and cash-flows. In a finan-cially integrated market one would expect only pricing effects on returns to be correlated across markets. But there is no reason for cash-flow effects, which re-flect news about firms’ prospects, to be correlated across markets. To deal with this issue, the authors use the familiar asset return decomposition pioneered by Campbell and Shiller. Overall, the results suggest that European markets are more integrated right now than before the euro.

Challenges for economic policy


Ángel de la Fuente, IAE-CSIC
and Rafael Doménech, BBVA
Ageing and real convergence:challenges and proposals1
1 Introduction
Accession to Economic and Monetary Union (EMU) by the main Europe-an economies led to an acceleration of the rate at which structural reforms were adopted in many member states, including Spain.2 Nevertheless, after ten years of EMU membership, the Spanish economy continues to face a number of difficult medium and long-term challenges which call for new and ambitious economic policy measures. Beyond the immediate problems of the current crisis, two major challenges stand out, with direct repercussions for our living standards over the coming decades. The first is to complete the process of convergence towards our European neighbours’ levels of income and welfare. The second is the rapid ageing of Spain’s population – a trend that will make it increasingly difficult to finance certain essential public services.
Despite the many things that have changed for the better in the Spanish econo-my in recent decades, in terms of relative income per capita within the group of the most advanced countries, Spain is today in exactly the same position it was in back in 1975: i.e. twenty percentage points below the OECD average. The long period of expansion which, with its ups and downs, we have enjoyed since 1985, has done no more than enable us to recover the ground lost during the profound crisis be-tween the two years just mentioned. The outlook for the immediate future is not good, and things are unlikely to improve until we make a decisive effort to tackle some of the structural problems weighing down our growth and competitiveness.
1 This paper has been translated from Spanish by Ducan Gilson.2 Alesina, Ardagna and Galasso (2008) present evidence on the adoption of structural reforms in the EMU
countries. Their findings suggest that in goods and services markets these reforms have been significant, whereas adoption of the euro has scarcely had any impact on the adoption of reforms in the labour market.

192 Spain and the euro. The fi rst ten years
The battle for convergence has to be waged on two fronts: productivity and employment. In the case of productivity, we have been slipping relative to our direct competitors for over twenty years. In the case of employment, our experi-ence from the last few decades is more positive, but two crucial problems persist. Even in the best of times, Spain registers activity and employment rates lower than those in comparable countries. And as recent data show, there is a tendency for employment to collapse when conditions turn sour.
The other big challenge we face is demographic. The crisis of the seventies also marked the start of a process of ageing which, despite the temporary relief brought by the wave of immigration in recent years, looks hard to reverse. Under these circumstances, there is no alternative but to redesign our system of social protection (including healthcare, pensions and care for dependent persons) to en-sure its long-term viability.
In both cases, the necessary therapy will be painful in the short term, and therefore, unpopular in certain circles. In order to tackle these issues with a rea-sonable chance of success, we need to start a process of reflection and debate so as to raise public awareness and build a consensus that should include the main political parties and social actors. This paper is intended as a contribution to this debate.3 To this end, we have set out to identify some of the main economic chal-lenges facing Spanish society today and to make some recommendations about the policies that would be necessary in order to overcome these challenges. Some of the reforms we propose are important not only in the long term, to ensure Spain’s growth and welfare, but also in the short term, to ease the way out of the crisis in which we are immersed. From this perspective, some of these reforms are, perhaps, even more necessary within EMU than outside of it, given that mem-bership of the euro has meant renouncing some of the instruments available in the past, such as the option of devaluing the currency.
This paper is organised as follows. Section 2 analyses the progress of the Span-ish economy over the last half-century, and its current situation in relation to the group of most advanced economies. From this exercise we have extracted a list of the three main economic and social challenges our country needs to address over the next few decades: increasing the growth rate of productivity, improving the functioning of the labour market and ensuring the viability of the social protec-tion system in the context of a rapidly ageing population. Sections 3 to 5 look in more depth at these three topics, each focusing on one aspect of the problem we consider to be crucial. Section 3 is devoted to the education system; section 4
3 The analysis of the Spanish economy’s challenges and the need for structural reforms has been a recur-rent topic over the last few years, as is highlighted, for example, in the Informe Económico del Presidente del Gobierno (Prime Minister’s Economic Report, 2007 and 2008), the Programa Nacional de Reformas (National reform programme 2005) and numerous recommendations from the OECD and the European Commission.

Ageing and real convergence: challenges and proposals 193Ángel de la Fuente and Rafael Dom
énech
to the necessary labour market reforms; and, section 5 the implications of the ageing population for the viability of the pension system. Section 6 offers some conclusion.
2 The Spanish economy: a comparative perspective
This section undertakes a comparative analysis of the current situation of the Spanish economy and how it has developed over the last few decades in terms of some basic economic and demographic indicators. Our reference will be an aggregate which we shall call OECD-21, which comprises the main economies of the OECD. It excludes the most recent members of the organisation and some small economies for which it is sometimes difficult to obtain all the nec-essary data.4
This section is divided into five sub-sections. In the first of these we use a simple decomposition of relative per capita income into three factors linked to productivity, employment and demography to perform an initial diagnosis of the relative performance of the Spanish economy. In the following three sub-sections we look in more detail at each of these factors. The final sub-section summarises our main conclusions and presents the topics which will be covered in the rest of the paper.
2.1 The sources of the income differential with comparable countries
Chart 2.1.1 shows the variation over time of relative per capita income in Spain, the United States and the EU-14 (i.e. the EU-15 minus Luxembourg) between 1955 and 2007. This variable is defined as output per capita in each territory, corrected for purchasing power differences5 and expressed in loga-rithmic differences with the OECD-21 average.
The chart suggests that the period we are analysing can be broken down into three sub-periods according to the behaviour of Spanish per capita in-come: a rapid approach to the average (1955-75), a strong reversal of the trend (1975-85), and a third phase of more gradual convergence (1985-2007) at the end of which Spain was still 20 percentage points below the OECD-21 average, 7 points from the EU-14 average, and 39 points below the United States.
4 Specifically, the members of this aggregate are the countries of the EU-15, with the exception of Lux-embourg, plus the United States, Canada, Australia, New Zealand, Japan, Switzerland and Norway.
5 For more details of the construction and sources of the variables used in this section, see Annex 1.

194 Spain and the euro. The fi rst ten years
In order to investigate what lies behind the process we have just described, we will start out with a simple breakdown of relative per capita income. The output per inhabitant of country i (PCIi) can be expressed in the following form:
PCI QHGDPPOPi POPi
i GDPHOURS P1564i i
ii i LMKTi DEMi* * **== =HOURSi P1564i [1]
where POPi is the total population, P1564 the working age population and HOURS the total number of hours worked. This breaks per capita output down into three components: a demographic component (DEM), which corre-sponds to the fraction of the population of working age, productivity per hour worked (QH), and a third component (LMKT) which incorporates factors linked to the behaviour of the labour market. Dividing all the variables by their averages in the OECD-21 group and taking logarithms of the resulting expres-sion, we obtain:
pci qh + dem + lmktii i i= [2]
where the terms on the right-hand side are the components of relative per capita income. Lower-case letters are used to indicate that all the variables are measured in logarithmic differences with the sample average (which is approximately equal to the percetage difference between these two quantities, provided that this dif-ference is not too large).
Table 2.1.1 and Chart 2.1.2 summarise the results of the breakdown of Span-ish relative income per capita into the factors just mentioned. Chart 2.1.2 shows the time course of the main components of this variable while Table 2.1.1 gives the values in a selection of years between 1960 and 2007.
-60%
-40%
-20%
0%
20%
40%
60%
1955 1960 1965 1970 1975 1980 1985 1990 1995 2000 2005
SPAIN USA EU-14
RELATIVE PER CAPITA INCOME RELATIVE TO OECD-21 CHART 2.1.1

Ageing and real convergence: challenges and proposals 195Ángel de la Fuente and Rafael Dom
énech
The main source of the differential in income between Spain and the OECD is currently the low level of productivity per hour worked, followed by a below-average utilisation rate of human resources. The first of these factors contrib-utes more than 13 percentage points to the income differential with respect to the OECD average, while the contribution of the second factor is 8 percentage points. The only mildly positive factor is demography, which reduces the gap in per capita income by six tenths of a point.
Looking back, things have changed significantly over the last half century. The demographic component of per capita income was negative until just a few years ago, and has followed a U-shaped curve, with a minimum value of –8.1 points in 1980. Also, the productivity differential fell by 29 points between 1960 and 2007, while the labour market component registered a slight deterioration be-tween the start and the end of the period.
The last two components of relative income experienced significant fluctua-tions over the course of the last half century, moving in opposite directions for much of it. Between 1960 and 1985, Spain’s relative productivity improved spec-
1960 1975 1985 1995 2007
Per capita income -51.4% -20.1% -35.0% -28.2% -20.4%
Demography (share of the population of working age) -2.1% -6.8% -6.5% -1.9% 0.6%
Labour market (hours per person aged 15-64) -7.3% 2.2% -33.0% -27.2% -7.9%
Productivity (output per hour worked) -42.1% -15.5% 4.5% 0.9% -13.1%
Memo:
Income per person of working age -49.4% -13.3% -28.5% -26.3% -21.1%
RELATIVE PER CAPITA INCOME IN SPAIN AND ITS COMPONENTS TABLE 2.1.1
-50%
-40%
-30%
-20%
-10%
0%
10%
1960 1965 1970 1975 1980 1985 1990 1995 2000 2005
PRODUCTIVITY LABOUR MARKET DEMOGRAPHY
MAIN COMPONENTS OF SPAIN'S RELATIVE PER CAPITA INCOME CHART 2.1.2

196 Spain and the euro. The fi rst ten years
tacularly (almost 47 points in 25 years), reaching a peak 4.5 points above the OECD-21 average in 1985. Since then, however, the trend has been reversed. Between 1985 and 2007 Spain lost almost 18 points in relative productivity per hour worked, thus returning to its 1977 position.
The behaviour of the labour market component of income per capita is very different. Between 1960 and 1975 there was a slight improvement (9.5 points), which put Spain slightly above the average. Between 1975 and 1985, however, the deterioration in the labour market subtracted 35 points from relative income. Two thirds of the ground lost during this dramatic fall was gradually recovered over the last two decades.
2.1.1 The challenge of real convergenceThe data reviewed above point to two clear grounds for concern about the
current state of the Spanish economy and its relative performance over the last half century. The first is the evolution of productivity. In 2007 output per hour worked in Spain was 13% below the OECD average and had fallen by almost 18 points over the two previous decades. The second is the poor functioning of Spain’s labour market. Despite the fact that in 2007 the Spanish economy was in the most favourable position it had been in for almost three decades in terms of employment, the labour market component of our relative income continued to be almost eight points below the average for the reference sample. Adding both factors together, the gap in per capita income between Spain and the OECD av-erage slightly exceeded 20 percentage points in 2007, almost exactly the same value as registered in 1975, more than 30 years ago. The short-term prospects are, moreover, clearly negative and point towards the likelihood of Spain’s process of convergence with the group of comparable countries going into reverse.
The first long-term challenge the Spanish economy is facing is therefore that of breaking through this “glass ceiling” situated twenty points below the OECD average. This is a level which has so far represented an impassable barrier to our relative position within the group of the world’s wealthiest economies. In what follows we will try to look in more detail at some of the aspects of the diagnosis sketched out in this section and identify the type of measures that will be neces-sary to complete Spain’s transformation into an economy fully able to compete with the most advanced countries on an equal footing.
2.2 The labour market
The labour market component of relative per capita income can in turn be broken down into three factors linked to labour-force participation and employ-ment rates (LFPR and ER), and the number of hours worked per employed per-son (HW), respectively:

Ageing and real convergence: challenges and proposals 197Ángel de la Fuente and Rafael Dom
énech
LMKT LFPRLFP1564i P1564i
iLFi
i i ER i HWi* * **== =NEPiHOURSi HOURSiNEPi
[3]
where LFi and NEPi refer to the labour force (active population) and the number of employed persons, respectively. Taking logarithmic difference from the aggre-gate average, we obtain:
+ +lmkt i lfpr i er i hw i= [4]
-20%
-15%
-10%
-5%
0%
5%
10%
1960 1965 1970 1975 1980 1985 1990 1995 2000 2005
LABOUR FORCE PARTICIPATION EMPLOYMENT HOURS
LABOUR MARKET COMPONENTS OF SPAIN’S PER CAPITA INCOME RELATIVE TO THE OECD-21
CHART 2.2.1
1960 1975 1985 1995 2007
Labour force participation rate -6.5% -5.5% -16.0% -11.2% -3.2%
Employment rate 0.2% 0.5% -15.1% -15.7% -3.1%
Hours per worker -0.9% 7.1% -1.9% -0.3% -1.6%
TOTAL LABOUR MARKET -7.3% 2.2% -33.0% -27.2% -7.9%
LABOUR MARKET COMPONENTS OF RELATIVE SPANISH PER CAPITA INCOME
TABLE 2.2.1
Chart 2.2.1 shows the variation in the labour market components of relative per capita income. With the notable exception of the period 1991-94, participation and employment rates have always run in parallel. Both indicators display a sharp decline between 1975 and 1985 and a gradual, although somewhat irregular, recov-ery after 1985. At the end of the period in the sample, each of these factors contrib-uted around three points to the income gap with the OECD-21. Finally, the “hours worked” series shows a relatively flat profile after 1983, with a value close to the av-erage. In the first half of the period, however, significant fluctuations occurred, with a peak in the mid-seventies followed by a sharp fall in the subsequent decade.

198 Spain and the euro. The fi rst ten years
A more detailed examination of the comparative progress of some of these in-dicators will allow us to identify some of the specific features of Spain’s experi-ence. Even in the best of times, Spain registers labour-force participation and em-ployment rates lower than the OECD averages. In times of crisis, moreover, both variables tend to drop more rapidly than in other economies. Both phenomena are illustrated in Charts 2.2.2 and 2.2.3, where Spain’s labour force participation and unemployment rates during the period 1960-2007 are compared with the average, maximum and minimum values in our sample. What stands out is that over an uninterrupted period since the mid-seventies, Spain has enjoyed the du-bious honour of having both the highest unemployment rate in the OECD-21 and a below-average labour-force participation rate.
0,55
0,60
0,65
0,70
0,75
0,80
0,85
0,90
1960 1965 1970 1975 1980 1985 1990 1995 2000 2005
AVERAGE MAX MIN SPAIN
LABOUR-FORCE PARTICIPATION RATE CHART 2.2.2
0,75
0,8
0,85
0,9
0,95
1
1960 1965 1970 1975 1980 1985 1990 1995 2000 2005
AVERAGE MAX MIN SPAIN
EMPLOYMENT RATE (NUMBER OF EMPLOYED PERSONS/TOTAL LABOUR FORCE)
CHART 2.2.3
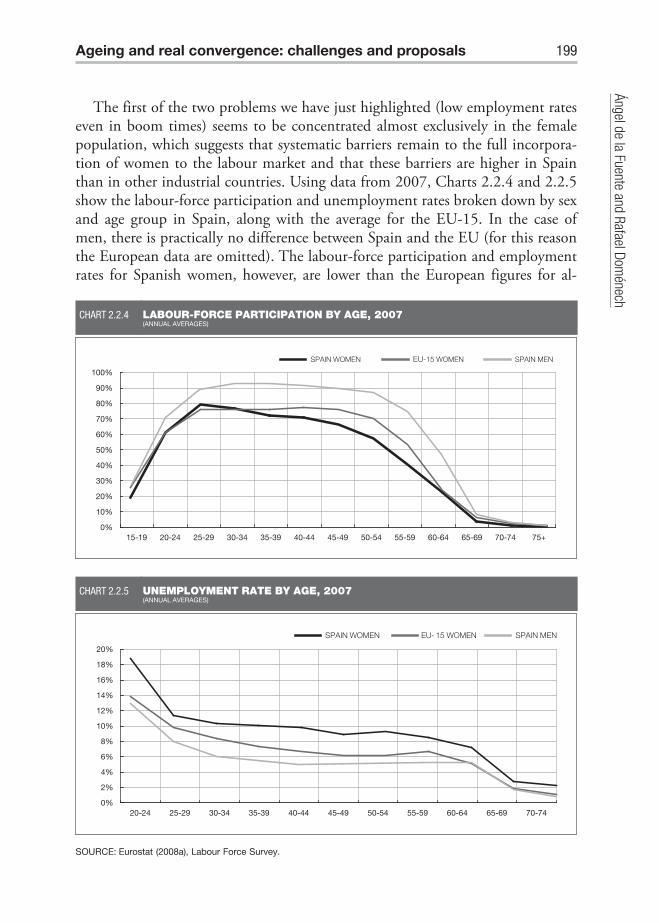
Ageing and real convergence: challenges and proposals 199Ángel de la Fuente and Rafael Dom
énech
The first of the two problems we have just highlighted (low employment rates even in boom times) seems to be concentrated almost exclusively in the female population, which suggests that systematic barriers remain to the full incorpora-tion of women to the labour market and that these barriers are higher in Spain than in other industrial countries. Using data from 2007, Charts 2.2.4 and 2.2.5 show the labour-force participation and unemployment rates broken down by sex and age group in Spain, along with the average for the EU-15. In the case of men, there is practically no difference between Spain and the EU (for this reason the European data are omitted). The labour-force participation and employment rates for Spanish women, however, are lower than the European figures for al-
0%
10%
20%
30%
40%
50%
60%
70%
80%
90%
100%
15-19 20-24 25-29 30-34 35-39 40-44 45-49 50-54 55-59 60-64 65-69 70-74 75+
SPAIN WOMEN EU-15 WOMEN SPAIN MEN
LABOUR-FORCE PARTICIPATION BY AGE, 2007 (ANNUAL AVERAGES)
CHART 2.2.4
0%
2%
4%
6%
8%
10%
12%
14%
16%
18%
20%
20-24 25-29 30-34 35-39 40-44 45-49 50-54 55-59 60-64 65-69 70-74
SOURCE: Eurostat (2008a), Labour Force Survey.
SPAIN WOMEN EU- 15 WOMEN SPAIN MEN
UNEMPLOYMENT RATE BY AGE, 2007 (ANNUAL AVERAGES)
CHART 2.2.5
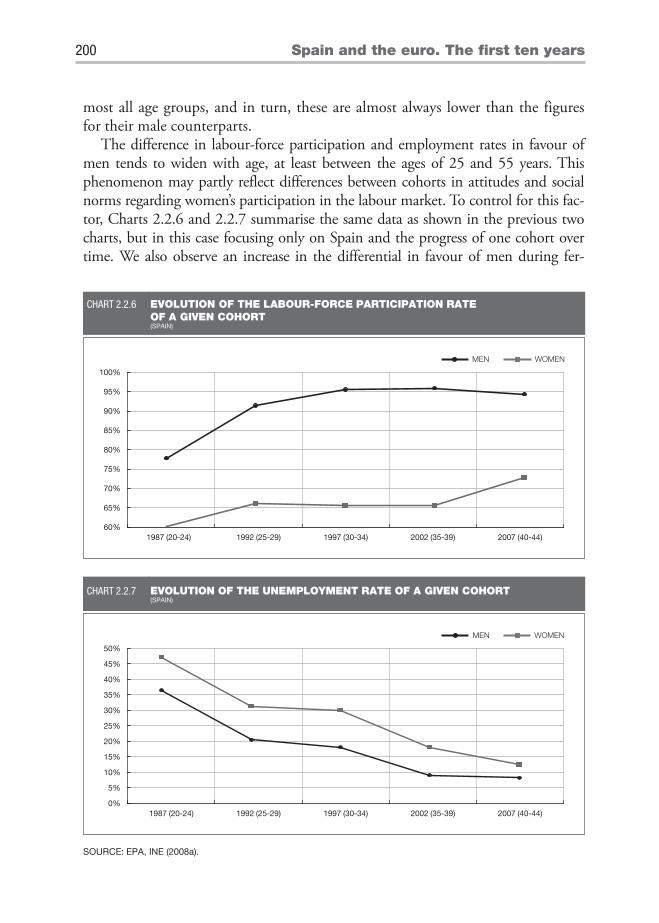
200 Spain and the euro. The fi rst ten years
most all age groups, and in turn, these are almost always lower than the figures for their male counterparts.
The difference in labour-force participation and employment rates in favour of men tends to widen with age, at least between the ages of 25 and 55 years. This phenomenon may partly reflect differences between cohorts in attitudes and social norms regarding women’s participation in the labour market. To control for this fac-tor, Charts 2.2.6 and 2.2.7 summarise the same data as shown in the previous two charts, but in this case focusing only on Spain and the progress of one cohort over time. We also observe an increase in the differential in favour of men during fer-
60%
65%
70%
75%
80%
85%
90%
95%
100%
1987 (20-24) 1992 (25-29) 1997 (30-34) 2002 (35-39) 2007 (40-44)
MEN WOMEN
EVOLUTION OF THE LABOUR-FORCE PARTICIPATION RATE OF A GIVEN COHORT (SPAIN)
CHART 2.2.6
SOURCE: EPA, INE (2008a).
0%
5%
10%
15%
20%
25%
30%
35%
40%
45%
50%
1987 (20-24) 1992 (25-29) 1997 (30-34) 2002 (35-39) 2007 (40-44)
MEN WOMEN
EVOLUTION OF THE UNEMPLOYMENT RATE OF A GIVEN COHORT (SPAIN)
CHART 2.2.7

Ageing and real convergence: challenges and proposals 201Ángel de la Fuente and Rafael Dom
énech
tile years, which tends to be inverted after the age of 35 or 40, however. This pat-tern suggests that the lower labour-force participation and employment rates among women that we observe in the data are fairly closely related to the difficulties exist-ing in Spain for making family responsibilities compatible with work, and that the burden of these responsibilities falls disproportionately on women. Certain factors which may considerably aggravate the problem are the limited flexibility of labour contracts, the incompatibility between work and school hours and holidays, and the shortage of affordable child-care and care for the elderly.
The second peculiarity of Spain’s labour market is its tendency to adjust in terms of quantity rather than prices, which means jobs are destroyed rapidly during a cri-sis. In the decade following the first oil crisis in the seventies, the number of jobs per working age person fell by 23% in Spain, compared with a drop of 3% across the OECD-21, a fall of 8% in the EU-15 and a rise of 2% in the United States. During the recession in the early nineties the story was similar, although less dramatic. In the three years following the start of the crisis, the employment indicator fell by 6.4% in Spain, 3.5% in the EU-15, 2.3% in the United States, and 1.9% in the OECD.
The data from the last quarters of 2008 also point in the same direction. Chart 2.2.8 shows the increase in the employment rate recorded between the third quarter of 2007 and the third quarter of 2008. Spain is, by a wide margin, the EU country in which this indicator has been most adverse, with the unem-ployment rate rising by more than 2.5 points (from 8.7% to 11.4%), compared with an average of just a tenth of a point for the EU-15 as a whole (from 6.9% to 7%). According to the Spanish Labour Force Survey (Encuesta de Población
SOURCE: Eurostat (2008a), Labour Force Survey. Population 15-64. KEY: ES=Spain: UK=United Kingdom; BE=Belgium; DK=Denmark; SE=Sweeden; PT=Portugal; AT=Austria; FR=France; NL=Netherlands; IT=Italy; FI=Finland; GR=Greece; DE=Germany.
-1.5
-1.0
-0.5
0.0
0.5
1.0
1.5
2.0
2.5
3.0
ES UK BE DK SE EU-15 PT AT FR NL IT FI GR DE
INCREASE IN THE UNEMPLOYMENT RATE BETWEEN THE THIRD QUARTER OF 2007 AND THE THIRD QUARTER OF 2008 (PERCENTAGE POINTS)
CHART 2.2.8

202 Spain and the euro. The fi rst ten years
Activa, EPA), the number people out of work rose during the fourth quarter of 2008 by more than 600,000, adding 2.6 points to the unemployment rate in the third quarter. This has undoubtedly widened our differential with the Eu-ropean average even further.
2.3 The evolution of productivity
The productivity component of relative per capita income (qh) can be broken down into various factors using an aggregate production function. We shall assume that this is of the Cobb-Douglas type, with constant returns to scale in labour and capital for a given average level of training of the labour force. Under these as-sumptions, the production function can be expressed in intensive form, as a func-tion relating output per hour worked to the stock of capital per hour worked (k), average educational attainment (edu) and total factor productivity (tfp):
+qh i tfp i k edui ieduk= + [5]
As before, all the variables are measured in relative terms, that is to say, in loga-rithmic deviations from the weighted sample average. The coefficients k and edu are the elasticities of output with respect to the various factors of production and measure the percentage increase in output that would be produced by an increase of 1% in the stock of each factor considered, while keeping the other factors constant.
The data on capital we have used in order to apply equation [5] correspond to the stock of non-residential private capital, while the level of educational at-tainment is measured in terms of the adult population’s average number of years of schooling.6 The values assigned to the elasticities shown in equation [5] (k = 0.345 and edu= 0.394) come from de la Fuente and Doménech (2002), who es-timated an aggregate production function using OECD-21 data that are similar (but not identical) to those used here.
Using equation [5] we can break down Spain’s relative productivity into the con-tributions of physical and human capital and total factor productivity. Table 2.3.1 and Chart 2.3.1 summarise the results.
One very surprising aspect of these results is that the estimated level of Span-ish TFP is higher than the average for the OECD-21 throughout the period ana-lysed. This indicator reached a peak of 25% above the average (15% above the United States) in the mid-eighties. This result is rather implausible, suggesting the possible existence of measurement problems that could be biasing the esti-mate of Spanish TFP upwards (it should be remembered that TFP is obtained as a residual, by subtracting the contributions of the various factors of production
6 See Annex 1.

Ageing and real convergence: challenges and proposals 203Ángel de la Fuente and Rafael Dom
énech
from relative productivity). One possible reason for this would be a systematic undervaluation of the average hours worked, as this would lead to an overvalu-ation of the relative productivity and the contribution of the capital stock (per hour). Another factor suggesting that these results should be interpreted with ex-treme caution is that the levels of TFP are sensitive to the sectoral structure of prices in the base year used to construct the real output series (Dabán, Doménech and Molinas, 1997).
It would therefore seem advisable to focus more on the way TFP varies over time than on its absolute values. From this viewpoint, the most noteworthy fea-ture of Chart 2.3.1 is the rapid loss of relative efficiency suffered by the Span-ish economy over the last two decades. Indeed, between 1990 and 2007 Spanish TFP declined in absolute as well as relative terms.
As for the remainder of the components of relative productivity, the contribu-tion of human capital has been on an upward trend since 1970. At the end of the period, however, the level of qualifications of Spain’s population still contributed slightly more than 10 percentage points to the differential between Spain’s in-come and productivity and the average for the reference group of countries, thus
-30%
-20%
-10%
0%
10%
20%
30%
1960 1965 1970 1975 1980 1985 1990 1995 2000 2005
PHYSICAL CAPITAL EDUCATION TFP
COMPONENTS OF SPAIN'S RELATIVE PRODUCTIVITY CHART 2.3.1
1960 1975 1985 1995 2007
Total factor productivity 7.3% 21.4% 25.1% 17.5% 1.8%
Physical capital -26.9% -13.2% 0.2% -0.1% -4.8%
Education -22.5% -23.7% -20.7% -16.6% -10.1%
TOTAL PRODUCTIVITY (output per hour worked) -42.1% -15.5% 4.5% 0.9% -13.1%
PRODUCTIVITY COMPONENTS OF RELATIVE SPANISH PER CAPITA INCOME TABLE 2.3.1

204 Spain and the euro. The fi rst ten years
making it the main direct source of the productivity gap. A clear pattern of con-vergence to the mean is also observable in terms of the stock of physical capital. Convergence in this factor is stronger than that observed in the case of human capital and is concentrated in the first half of the sample period. It should be noted that the approach to the other countries’ average physical capital stock per unit of labour which took place during the period of crisis was largely due to the rapid loss of jobs. Moreover, the doubts and reservations already expressed about the “hours worked” data series lead to uncertainty over the validity of the level of this series which, according to our estimates, would point to a productivity gap between Spain and the OECD-21 of just 5 points in 2007.
2.4 Demography
The second big challenge the Spanish economy faces is the rapid ageing of the country’s population, and all this entails in terms of growing difficulties for funding some of the main social benefits. The problem is not readily apparent in the retrospective breakdown of income we have taken as a starting point, but it becomes obvious as soon as we start looking at how basic demographic indicators have evolved.
As we have already seen, the demographic component of Spain’s relative per capita income has developed favourably over the last three decades. This phenomenon, however, corresponds to the initial period of a process of ageing which began late in Spain, but has been very rapid. In its early stages, this proc-ess translated into an increase in the relative weight of the population of work-ing age, in detriment of younger cohorts. As time goes by, however, the trend is for these two groups to shrink relative to the older population, causing the sign of demographic component to change. This could lead to serious problems for the sustainability of public finances. We will look at some of these issues in more detail below.
Charts 2.4.1 and 2.4.2 show how Spain’s relative situation has evolved in terms of the relative sizes of the various different population segments. Up until the nineties, Spain’s population was relatively young, with the share of the population of school age being above the OECD average and the share of the population aged over 65 below the OECD average. After the nineties, however, the situation reversed: the share of the population of retirement age moved above the average and the share of the youngest population segment became one of the lowest in the sample.
The immediate causes of this phenomenon are shown in Charts 2.4.3 and 2.4.4. These causes are the considerable increase in life expectancy registered dur-ing the period, and in particular, the sharp drop in the Spanish birth rate. This fell by more than 50% between the mid-seventies and mid-eighties leaving Spain with one of the lowest fertility rates in the world.

Ageing and real convergence: challenges and proposals 205Ángel de la Fuente and Rafael Dom
énech
Charts 2.4.1, 2.4.2 and 2.4.4 show a slight trend towards an inversion of the ageing process of the Spanish population during the first few years of the present century. During this period the crude birth rate picked up slightly, while the school-age population as a share of the total stabilised and the population aged over 65 fell slightly. These three phenomena are the result of the rapid inflow of immigrants during the period, as newcomers were characterised by a lower aver-age age and a higher fertility rate than the native population. The quantitative importance of this phenomenon can be seen clearly in Chart 2.4.5. The number of people of foreign origin in Spain rose from 0.6 million in 1998 (1.6% of the
SOURCE: AMECO database. Average is the unweighted average of the OECD-21 countries.
10%
15%
20%
25%
30%
35%
1960 1965 1970 1975 1980 1985 1990 1995 2000 2005
AVERAGE MAX MIN SPAIN
POPULATION AGED 0-14 AS A SHARE OF THE TOTAL CHART 2.4.1
SOURCE: AMECO database.
4%
6%
8%
10%
12%
14%
16%
18%
20%
22%
1960 1965 1970 1975 1980 1985 1990 1995 2000 2005
AVERAGE MAX MIN SPAIN
POPULATION AGED 65+ AS A SHARE OF THE TOTAL CHART 2.4.2

206 Spain and the euro. The fi rst ten years
total) to 5.3 million in 2008 (11.4%). Three quarters of the increase in Spain’s population during the last decade was as a result of immigration.
As we shall see below, the most reliable forecasts suggest that immigration can provide only temporary relief from the ageing process. The high levels of immigra-tion seen in recent years would be difficult to sustain over the long term, and the forecasted flows are insufficient to offset the decline in the population of fertile age, which has already started, or the continuing increase in longevity expected over the coming decades. The demographic outlook, therefore, is for a continuation, and indeed an acceleration, of the process of ageing that has already begun.
SOURCE: INE (2008c).
73
75
77
79
81
83
85
1975 1980 1985 1990 1995 2000 2005
AT BIRTH AT 65 YEARS
LIFE EXPECTANCY IN SPAIN CHART 2.4.3
SOURCE: INE (2008b).
0%
1%
2%
3%
4%
5%
6%
7%
8%
1972 1976 1980 1984 1988 1992 1996 2000 2004 2008
CRUDE FERTILITY RATE OF THE POPULATION AGED 20-40 IN SPAIN (POP. 0/POP 20-40 ONE YEAR EARLIER)
CHART 2.4.4

Ageing and real convergence: challenges and proposals 207Ángel de la Fuente and Rafael Dom
énech
Chart 2.4.6 presents some of the immediate causes of this phenomenon in visual form. The graph shows the distribution of the population resident in Spain according to its date of birth. The population curve clearly reveals the effects of the Civil War, the long baby-boom from 1955 to 1975 and the con-sequences of the fall in birth rates over the last three decades. The vertical lines on the graph divide the population according to three age segments. Shifting the window marking out the working age population towards the right gives us an idea of where we are heading. A large part of these baby-boom cohorts have now left their fertile years behind them and are approaching retirement,
SOURCE: Municipal census, INE (2008b).
38
39
40
41
42
43
44
45
46
47
1998 1999 2000 2001 2002 2003 2004 2005 2006 2007 2008
SPAIN'S TOTAL POPULATION CHART 2.4.5
TOTAL POPULATION SPANIARDS millions
SOURCE: INE (2008b).
0
100
200
300
400
500
600
700
800
900
1905 1910 1915 1920 1925 1930 1935 1940 1945 1950 1955 1960 1965 1970 1975 1980 1985 1990 1995 2000 2005
POPULATION RESIDENT IN SPAIN IN 2008 (DISTRIBUTION BY DATE OF BIRTH)
CHART 2.4.6
18 years40 years65 years
thousands

208 Spain and the euro. The fi rst ten years
while the cohorts joining the working age segment will soon be smaller than those leaving it.
2.5 Summary and plan of the following sections
Over the coming decades, Spanish society will face two big economic challeng-es: The first is to complete the process of real convergence with the countries of the OECD and, the second to adopt the reforms necessary to ensure the viability of the welfare state in an adverse demographic context. Both challenges have multi-ple dimensions and call for actions of various types. To get closer to income levels in the more advanced countries we need to speed up our productivity growth and improve the functioning of our labour market, both in boom times and in crises. The first goal requires that we invest more, and more efficiently, in various types of tangible and intangible assets, but also that we adopt complementary measures to eliminate unnecessary obstacles to economic activity and to increase competitiveness and improve the regulation of our goods and services markets. The second requires a diverse range of legal and institutional changes, together with specific actions to eliminate the obstacles that still remain to the full incor-poration of women to the job market. Finally, the demographic challenge will de-mand changes in many aspects of the social protection system, including health-care, pensions and assistance to dependent persons.
It would be impossible to address all these issues in a single paper. Given the limitations of space and time we face, we have decided to concentrate on three is-sues we feel are crucial to the country’s economic future: the education system, and the necessary labour market and pension system reforms. Each of the following sections focuses on one of these topics. Along with our comparative advantage in understanding some of them, this choice is also justified by the fact that other chal-lenges facing the Spanish economy are highly dependent upon the challenges we examine here. For example, although increasing R&D investment is necessary in Spain in order to get closer to the leading OECD countries, such investment may be hampared by the lack of a sufficiently educated population or by the existence of distortions in markets for labour and goods that may reduce the incentives to invest in R&D. Something similar is also true of Spain’s international competitiveness, in that improving it would require flexible and competitive markets for labour as well as goods and services, and a bigger investment effort in human capital and R&D.
3 The educational challenge
One of the clearest implications of the preceding section is that improving pro-ductivity has to be among the basic priorities of Spain’s economic policy. Of the

Ageing and real convergence: challenges and proposals 209Ángel de la Fuente and Rafael Dom
énech
many factors that could have an impact on this variable, in this paper we will focus on education. This is partly for reasons of space and comparative advantage, and partly because we are convinced that, as a growing body of empirical evidence sug-gests, education is a key long-term determinant of both productivity and employ-ment in a world in which output is increasingly knowledge intensive.7
3.1 The current state of education in Spain
Over the last few decades Spanish society has made a big effort to raise its level of education. Whereas in 1960 10% of the adult population was illiterate and the majority barely had primary education, in 2001 the rate of illiteracy had fallen to below 3% and was concentrated in the elderly, while almost 60% of the popula-tion had completed secondary or university education. As a result of this proc-ess of accumulation of human capital, the average number of years of schooling among the adult population rose by approximately 70% between 1960 and 2000 (4.97 to 8.19 years), with the bulk of the improvement concentrated in the last two decades.
As can be seen in Chart 3.1.1, this effort has served to considerably narrow the educational divide between Spain and the group of comparison countries, but has
7 The literature on the topic is very extensive and this is not the place for anything more than a very brief summary. For an overview, see de la Fuente and Ciccone (2003), de la Fuente (2004) and Doménech (2008).
NOTE: The percentage difference in average years of training in each reference territory and Spain. EU-13 is the unweighted average of the EU-15 excluding Luxembourg and Spain. Data from de la Fuente and Doménech (2006a). For some countries, the series have been extended from 1990 or 1995 up until 2005 using the growth rates for number of years training implicit in Cohen and Soto's series (2001) for the period concerned.
0%
10%
20%
30%
40%
50%
60%
1960 1965 1970 1975 1980 1985 1990 1995 2000 2005
USA EU-13
SPAIN’S EDUCATIONAL GAP WITH RESPECT TO THE USA AND EU-13 CHART 3.1.1

210 Spain and the euro. The fi rst ten years
not eliminated it. Between 1960 and 2005 the distance from the EU-15 average (excluding Luxembourg and Spain) and from the United States in terms of aver-age schooling shrank considerably, dropping from 36 to 19 and from 53 to 31 percentage points, respectively.
Although the improvement in relative average educational attainment in Spain has undoubtedly been considerable, at least three important problems remain. The first is that our average level of training is still a long way from the average in comparable countries. The second is that the educational structure of the popu-lation is still very imbalanced, with a bias towards the extremes. We have a rela-tively high proportion of university graduates, but also a large proportion of the population that has not managed to get beyond compulsory schooling. The third problem is the inadequate quality of our educational system, which is manifest, among other things, in the poor performance of Spain’s pupils in internation-al standardised tests or the weak position of our universities in the international quality rankings.8
The first of these problems appears to be on its way to being solved, at least partly, but not the second or the third. Chart 3.1.2 shows the breakdown of the
8 To these three problems we could add a fourth, which we will not address in this paper. This is the ex-istence of marked differences in education between regions, which do not appear to be diminishing of their own accord. On this topic, see de la Fuente and Doménech (2006b) and de la Fuente (2006a). Fuentes (2009) analyses in detail the situation of the education system in Spain in relation to other OECD countries and the reforms needed to improve its results.
NOTES: Percentage of the population in each age group that has completed each stage of education, standardised by unweighted sample average. The OECD-20 is the OECD-21 minus Japan, for which no data are available for secondary education.
SOURCE: OECD (2008a).
0
25
50
75
100
125
150
175
200
25-64 55-64 45-54 35-44 25-34
1ST STAGE SECONDARY OR LESS 2ND STAGE SECONDARY TERTIARY
SHARE OF THE SPANISH POPULATION WITH DIFFERENT ATTAINMENTLEVELS, BY AGE GROUP. OECD-20 AVERAGE = 100 (2006 DATA)
CHART 3.1.2

Ageing and real convergence: challenges and proposals 211Ángel de la Fuente and Rafael Dom
énech
Spanish population by educational attainment (low, medium and high) across different age groups. The share of the population at each level of educational attainment has been normalised using the OECD-21 average (excluding Japan, for which not all the necessary data are available) in order to highlight Spain’s relative position. The breakdown by age groups makes it possible to analyse how our relative situation has varied over time as we take the younger cohorts into account.
If we focus on the fraction of the population that has finished some form of tertiary education (that is to say, has obtained a university qualification or ad-vanced professional training), the situation is not bad and has improved rapidly over time. Considering the working age population as a whole, Spain is currently only slightly below the OECD average and is above this reference if we consider only the youngest adult cohort (between 25 and 34 years of age).
In the case of the other two groups, the situation is much less satisfactory. The relative size of the least qualified population segment (i.e. persons complet-ing no more than the first stage of secondary education) has remained almost constant in all the cohorts at a level higher than that observed in other ad-vanced countries. The intermediate group (i.e. those who have completed up-per secondary education or basic vocational training) is well below the average in terms of its relative size and, although progress can be seen when comparing the three older cohorts with one another, the situation appears to have stag-nated in the last decade. As shown in Chart 3.1.3 the situation is similar when we compare ourselves with our EU neighbours in terms of school failure rates.
NOTE: Percentage of the population aged 18 to 24 that has not completed the first stage of secondary education and is not in school. SOURCE: Eurostat (2008b).
0
5
10
15
20
25
30
35
40
1995 1996 1997 1998 1999 2000 2001 2002 2003 2004 2005 2006 2007
EU-15 SPAIN
PREMATURE SCHOOL-LEAVING RATE CHART 3.1.3

212 Spain and the euro. The fi rst ten years
A worrying fraction of young Spaniards receive only the education that is legal-ly compulsory. By contrast with what we see in the EU, moreover, this fraction does not show any clear downward trend over time, and has even tended to rise slightly in recent years.
To the quantitative deficits we have just highlighted we also need to add a significant and growing qualitative deficit which shows up, among other places, in the poor performance of our secondary school pupils on standardised interna-tional aptitude tests such as those carried out by the OECD through the PISA project. As can be seen in Chart 3.1.4, Spain has been well below the OECD average in the last two rounds of PISA, both in mathematics and reading com-prehension. Moreover, it shows an extremely worrying backward trend on both scales, particularly the second, in both absolute and relative terms.
Although these indicators need to be interpreted with caution, another wor-rying sign of the unsatisfactory quality of our education (and research) system is the weak position of Spanish universities on international rankings.9 According to the most frequently cited rankings, namely those to the University of Shanghai and the Times World University Ranking, Spain’s top institution is below posi-
9 See http://es.wikipedia.org/wiki/Clasificación_académica_de_universidades and http://www.topuni-versities.com/worlduniversityrankings/.
NOTES: Observation 1 (obs 1) combines the results of the test of reading in 2000 with that of mathematics in 2003, while observation 2 combines the average results of both tests in 2006. All results are standardised using the sample average in each year (which reduces the two tests by 1.1% in the case of reading and 0.5% in the case of mathematics). The sample comprises all the OECD countries that took part in the relevant tests with the exception of Mexico.
SOURCE: OECD (2007a).Key: ES = Spain, Tu = Turkey, Gr = Greece, It = Italy, Po = Portugal, Sk = Slovakia, NZ = New Zealand, Can = Canada, Aus = Australia, Fin = Finland and Ko = Korea.
80
85
90
95
100
105
110
115
85 90 95 100 105 110 115
OBS1 OBS 2 mathematics
reading
RESULTS FOR READING AND MATHEMATICS IN VARIOUS ROUNDS OF PISA BETWEEN 2000 AND 2006(SAMPLE AVERAGE = 100)
CHART 3.1.4
Ko
Fin
CanNz
1
Aus
SkEs
Po
ItGr
Tu

Ageing and real convergence: challenges and proposals 213Ángel de la Fuente and Rafael Dom
énech
tion 150. According to this latter source, of the world’s top 100 universities, 37 were in the US, 17 in Britain, 7 in Australia, 5 in Canada and 5 in China (in-cluding Hong Kong). Japan and the Netherlands each had 4 institutions in the group, Germany and Switzerland 3, France, South Korea, Singapore, Denmark and Sweden 2 and, Belgium, Finland, Israel, Ireland, and New Zealand each had 1. Finally, universities in Austria, Taiwan, India, Thailand, Mexico, Norway, South Africa and Russia are listed in the rankings above the first Spanish institu-tion (the University of Barcelona).
3.2 What education policies? Some lessons from the literature
The economics literature suggests that the stock of human capital is an im-portant determinant of income levels and a strategic competitiveness factor in an increasingly knowledge-based economy. Therefore, correcting the problems out-lined above is a necessary condition for Spain’s desired convergence with the most advanced countries in terms of income and welfare.10
As we have seen, there is considerable room for improvement in our stock of ed-ucational capital in both quantitative and qualitative terms. In relation to the first of these dimensions, there is a long way to go before our upper secondary enroll-ment ratios approach those seen in most industrialised countries. At some point, however, additional increases in the average number of years of schooling will in-evitably lead to rapidly diminishing returns.11 In the long term, therefore, it seems clear that educational quality rather than quantity is the more relevant margin.
Designing policies which help improve student performance is, however, a com-plicated issue for which the aggregate comparative studies prevailing in the litera-ture on education and growth provide little guidance in practice. There is, however, a considerable volume of micro-econometric research on the economics of educa-tion which gives us at least some general indications that may be helpful in setting policy priorities. The main implications can be summarised in two propositions. Firstly, offering the right incentives to all the participants in the educational proc-ess is likely to be more important than increasing the volume of resources, at least in advanced countries where expenditure on schooling is already very significant. And, secondly, higher returns from investments in education are associated with
10 This section is based on de la Fuente (2006b). See also Círculo de Empresarios (2006) for another analysis along similar lines.
11 Econometric estimates of aggregate production functions do not suggest rapidly diminishing rates of return to increases in the average level of schooling around the observed levels of this variable. Even so, the re-turn to education will drop if young people stay in the education system longer because their working lives will be shorter, thus reducing the period over which they enjoy the returns on the investment in their education. Moreover, the appearance of sharply diminishing returns is inevitable at some point. It does not seem likely, for example, that the whole population has the necessary ability to be able to benefit from higher education.

214 Spain and the euro. The fi rst ten years
early interventions, particularly when these are focused on children from disadvan-taged families.
3.2.1 Determinants of the quality of educationEconomists tend to think about education as a standard production proc-
ess in which various types of input (pupils’, parents’ and teachers’ time, school facilities, textbooks and other teaching materials, etc.) are combined to pro-duce an educational output that we could identify with the acquisition of use-ful knowledge and skills. When we look at things in this way, it is tempting to think that any desired increase in students’ academic performance can be obtained by injecting sufficient resources into the education system. In fact, many discussions on education policy implicitly take this approach and focus on the need to increase expenditure in order to reduce the number of students per classroom, buy more computers, cut tuition fees or increase the number of scholarships.
Unfortunately, the problem is rather more complicated. A considerable number of papers in the recent literature suggest that increasing inputs does not necessarily yield better academic performance. Despite the sharp rise in spending per pupil and the continuous drop in the number of students per classroom, school per-formance does not appear to have been on an upward trend over the last few decades in most OECD countries and in fact has declined significantly in many of them (Hanushek, 2003, Hanushek and Woessmann, 2008 and Gundlach et al, 2001). Nor is there a clear cross-country correlation between spending lev-els and results on international standardized tests.12 Finally, micro-econometric estimates of educational production functions with very different samples of students yield rather inconclusive results in the best of cases, and a preponder-ance of non-significant coefficients or coefficients with the “wrong” sign (see Hanushek 2003 for a meta-analysis of these papers and Wöessmann 2003 and 2005 for two thorough studies on the topic in which two broad internation-al samples of individual data are used). Although the debate is far from over, as the probable endogeneity of the allocation of resources within and between schools makes it difficult to isolate the causal impact of classroom sizes and other input indicators on educational performance13, Heckman (2000) main-tains that, even if we accept the most optimistic estimates found in the litera-ture on the effects of teacher/pupil ratios on the future income of the pupils,
12 Hanushek (2003) and Hanushek and Kimko (H&K 2000) conclude that the usual indicators on the use of resources in the education system do not have a perceptible effect on the quality of education, meas-ured by standard performance tests. Lee and Barro (2001), however, find a positive correlation between some of the expenditure variables and the results on these tests.
13 The arguments and findings in the literature are contradictory. See, inter alia, Hanushek (1986 and 2003), Card and Krueger (1996) and Krueger (2002).

Ageing and real convergence: challenges and proposals 215Ángel de la Fuente and Rafael Dom
énech
reducing the number of students per teacher would be an inefficient policy with negative expected returns.
Overall, therefore, it looks unlikely that indiscriminate increases in spend-ing would contribute significantly to improving academic performance among pupils in Spain or in other European countries.14 Some of the leading experts in this field maintain that a more promising alternative would be to focus on providing appropriate incentives for students, teachers and school managers, broadening the possibilities of choice for parents and increasing competition between educational establishments. One measure that seems to have a sub-stantial positive effect on the incentives of agents in the education system is the introduction of standardised curriculum-based tests as a requirement for ob-taining educational credentials, together with the publication of average results and indicators of value added for each school. Bishop (1997) has found that centralised examinations have a significant positive effect on pupils’ academic performance both across countries and across Canadian provinces. Hanushek and Raymond (2003) also find positive results in relation to the introduction of accountability systems by schools in various states in the US. Wöessmann (2003) has confirmed these findings using a larger sample including data from 39 countries. This last author also concludes that greater school autonomy in certain areas (but not in others) has a positive effect on academic performance – particularly in countries where there are centralized examinations. According to these findings, greater autonomy regarding staff and internal organisation, together with greater freedom for teachers to choose their own teaching meth-ods, contribute to improving school performance because they allow schools to use their direct knowledge of the circumstances and needs of their pupils. However, Wöessmann also concludes that control over budgetary issues and the curriculum should be kept relatively centralised in order to avoid possible op-portunistic behaviours whereby individuals seek to reduce workloads or obtain financial gain.
Other measures that also seem to have positive effects, presumably through improved incentives, include introducing incentive schemes in teachers’ pay, the existence of competition from privately managed (although not necessar-ily privately financed) schools, and increased parental choice through school vouchers and other similar systems (see Hanushek 2003, Heckman, 2000, Wöessmann and Schütz, 2006, and the references given in these papers). On the other hand, some authors warn that it is not easy to design incentive sys-
14 A form of exception to this pattern in results is related to the quality of teachers. Hanushek (2003) and Wöessman and Schütz (2006) review a number of empirical findings that suggest that this factor has an important effect on pupils’ academic performance. These same authors also observe that it is extraordinarily difficult to link teachers’ performance to ex ante observable characteristics, such as their level of education or experience.

216 Spain and the euro. The fi rst ten years
tems correctly, and that the use of badly designed schemes can have adverse effects on performance (see Hanushek 2003 and Ladd and Walsh, 2002, for example).
3.2.2 Learning over the course of the life cycleAcquiring knowledge and cognitive and non-cognitive skills is a continual
process in which the competencies acquired at each stage are a crucial input to the next, enabling the individual to continue progressing. In a series of papers Heckman and various co-authors (see, among others, Cunha et al., 2005, and Heckman, 2000), develop a life-cycle model of competency acquisition which incorporates the available evidence from the literature in economics and other disciplines on the characteristics of the learning process and on the returns to investments in human capital during various stages of life for people in dif-ferent socio-economic strata. These authors highlight that the learning proc-ess starts very early in life and is decisively influenced by family environment, that there are critical periods for the acquisition of certain basic skills and that some of them crystallise very early and are very difficult to improve later.
Heckman’s model, together with his review of the existing empirical evidence, provides some useful suggestions on the efficient assignment of resources to dif-ferent age and income groups. One important prediction of the model that ap-pears to be borne out by empirical studies is that the return on investment in human capital declines with age in a way that varies systematically across socio-economic strata. Returns fall with age in all cases because learning at an early age enables additional knowledge to be acquired and because the time during which the investment generates additional income flows grows shorter as the individual ages. Returns to investment at early stages tend to be highest for children from disadvantaged families, because intensive intervention can compensate, at least partly, for the effects of an adverse family environment at a critical age for the ac-quisition of very basic skills.15 In the absence of these interventions, however, the return to additional investments in disadvantaged individuals drops off rapidly with age as skill deficits accumulate, and tend to fall below the return on invest-ment in individuals from higher income families at a relatively early age. There is consequently a clear trade-off between equity and efficiency at more advanced ages, but not for very young children.
Heckman and his co-authors build a convincing case in favour of a strategy of active intervention at early ages focusing on the more disadvantaged popu-lation groups as a way of promoting both efficiency and effective equality of
15 There is substantial evidence that early and intensive interventions have substantial and long-lasting ef-fects. In addition to Cunha and the references cited therein, see, for example Barnett (1990 and 1995) and Goodman and Sianesi (2005).

Ageing and real convergence: challenges and proposals 217Ángel de la Fuente and Rafael Dom
énech
opportunity.16 The evidence presented by these authors also suggests that at-tempts to remedy educational deficits at later ages are of limited effectiveness and very costly, and that these deficits, rather than the possible existence of financial constraints, are the main obstacle to many young people from low in-come families obtaining advanced education.
This all suggests that an important goal of education policy must be to seek to integrate children from disadvantaged families early on an academically oriented preschool system in order to prevent from early skills deficits that may have long-lasting adverse consequences. By contrast, some of the measures frequently advo-cated as a means for facilitating lower income groups’ access to post-compulsory education, such a highly subsidised university fees, may have only a limited effect.
3.3 Some further reflections
A peculiar feature of Spanish society is the lack of a basic educational consen-sus. Different sectors of society and the political parties that represent them hold opposing views on important aspects of the educational model. To a large extent, the conflict has focused on the schools’ role in the transmission of values, as has been highlighted by the bitter disputes between left and right over subjects such as religious education and citizenship education, but it also extends to other areas and reveals important differences in views regarding the basic mission of the edu-cational system and the philosophy that should inspire its design.
The result of this disagreement has been a high degree of legislative instabili-ty. Ever since the transition to democracy, each time the ruling party has changed, there has been a reform of the basic legislation on education. A major education reform approved by the socialist government in 1990 (the Organic Law on the Ed-ucational System or LOGSE) was followed by a counter-reform passed during the People’s Party second legislature (with the LOCE or Organic Law for the Quality of Education). A new socialist government suspended the application of this law immediately after winning the 2004 election, and replaced it two years later with a new law (the LOE or Organic Law for Education) which to a large extent marked the return to the LOGSE model.
Almost everyone agrees that such swings are not good for the educational sys-tem. Building on such a fragile foundation, it may be advisable to try to forge a
16 Schuetz et al (2005) reach the same conclusion in an interesting study in which they built an index of (in)equality of opportunities for over 50 countries based on the estimated influence of family socio-eco-nomic status on students’ academic performance. The authors explore the determinants of this index and conclude that countries with high rates of participation in long stages of pre-school education tend to pro-duce greater equality of opportunity. They also conclude that systems in which there is an early separation of students into different types of centre according to their performance have a negative impact on equality of opportunity.

218 Spain and the euro. The fi rst ten years
minimum consensus that may give the system the stability it needs to function properly. To make progress in this direction, it may be necessary to leave out the more ideologically charged aspects of the problem (such as the status of religious education) in order to concentrate on the academic core of the problem. To be able to advance in this direction, we need to find ways to advance simultaneously in the pursuit of educational quality and equality of opportunity. While these ob-jectives are in principle shared by everybody, in practice, the two sensitivities in dispute tend to focus on one of them almost to the point of excluding the other one.
Since LOGSE was passed, equality of opportunity has undoubtedly been the dominant goal of Spanish education policy. LOGSE raised the school leaving age from 14 to 16, and established a “comprehensive” school model with a single track for all pupils up to the end of the first cycle of secondary education. The law undoubtedly had a number of very positive aspects, such as making second-ary education universal, thus bringing about a marked rise in the average level of education in Spain, and thereby contributing to social cohesion. However, the model it created did not manage to significantly reduce premature school-leaving and educational failure rates and has not prevented a gradual deterioration in the academic performance of Spanish students.
There is a wide variety of opinions regarding the cause of this problem. Many people who defend the LOGSE model attribute its disappointing performance to the failure to fully deploy the support measures envisaged in the law due to a lack of resources. Its detractors, however, point to the difficulties involved in keeping pupils with different levels of performance and motivation, and very different im-mediate aims, together in the same classroom up until the age of 16. Moreover, they maintain that the result has been to make the system less demanding so as to match the pace of the slower or less motivated pupils. Many people also criticise certain teaching approaches and curricular content, and complain of an excessive emphasis on equality at the expense of merit and effort.
The review of some of the aspects of the literature given above suggests that there may be some truth in both of these explanations. It therefore helps to clarify the terms of the trade-off between quality and equality and also suggests certain lines of action that would make it possible to advance in both directions at once. An important conclusion is that corrective measures aimed at reducing the risk of failure among disadvantaged pupils need to be concentrated in the early stages of education. The demand for more resources is no doubt justified if these resources are devoted to extending coverage and improving the quality of the pre-school ed-ucation system and to bolster primary education. At higher levels, however, these measures tend to be very expensive and rather ineffective. It also looks likely that it would be a good idea to abandon the single track through the final years of compulsory secondary education (ESO, in its Spanish initials). It is probably not

Ageing and real convergence: challenges and proposals 219Ángel de la Fuente and Rafael Dom
énech
necessary to separate pupils by school, but it might make sense to put them in dif-ferent classrooms at least part of the day. In this respect there is considerable room for adapting teaching to pupils’ needs, aptitudes and interests by adopting a more flexible curriculum that might include the option of studying a given subject at different levels of difficulty, as happens in some other countries (the “honors level” approach in the US, for example), as well as the establishment of different tracks with varying degrees of academic focus.
Finally, many of the measures that the literature has identified as being desir-able could help raise the performance of all pupil groups and do not, therefore, come into conflict with equity goals. It is worth emphasising here that it is im-portant to think in terms of incentives of all the participants in the system and not just the quantities of inputs. To this end, one possibility that should be added to those discussed above would be that of informing students about the excelent economic reasons that exist for continuing their education. The empirical evi-dence on the positive effects of education on wages and job opportunities is very strong, but many pupils, and even many parents, are unaware of it. It is therefore necessary to transmit the value of education to young people, convince them of the future benefits that making an effort and developing their talents can yield, and encourage them to recognise the incentives that exist to continue learning after they have completed their compulsory schooling.
Another reform that might be desirable, for both equity and incentive reasons would be a considerable increase in university fees, accompanied by an expanded offer of grants and other aid linked both to income and/or academic perform-ance. This would give students greater incentives not to unnecessarily prolong their university studies and help mitigate the regressive nature of a funding sys-tem that transfers resources towards individuals with expected incomes that are well above those of the average taxpayer.
4 Labour market reform
As mentioned in the second section, two features of its labour market set Spain apart from other advanced economies.17 The first is a high unemployment rate, with significant volatility over the course of the economic cycle, which indicates that in both recessions and expansions the Spanish economy has a tendency to ad-
17 The paper by Jimeno (2008) highlights the main changes undergone by the Spanish labour market in recent decades in terms of labour supply and demand and social policies. The rising share of women in the labour force, better educated workers, the ageing of the labour force, immigration, greater international competition and globalisation are some of the changes observed in the Spanish labour market. Bentolila and Jimeno (2006) and the references in their paper are a good starting point for understanding how unemploy-ment rates have varied over time in Spain.

220 Spain and the euro. The fi rst ten years
just in terms of quantities rather than prices. The second characteristic, which is related to the first, is that the temporary employment rate (i.e. the numbers of em-ployees on temporary contracts as a proportion of the total work force) is much higher in Spain than in other European economies.
What explains the high unemployment rate? There is an abundant empiri-cal evidence available suggesting that the institutions regulating the labour mar-ket have a highly significant impact on the level and persistance of employment rates and the extent of temporary work.18 Nickell, Nuziata and Ochel (2005) show that 55 per cent of the increase in the structural unemployment rate in OECD countries between the sixties and the nineties may be explained primari-ly in terms of the changes in the labour market institutions that took place dur-ing that period. The variables which the authors find have a significant effect include job protection, taxes, the type of collective bargaining, the level and du-ration of unemployment benefits and increased union pressure. In a recent pa-per, Gianella et al (2008) mainly confirm these results, finding that the level of regulation in the goods and services market, the levels of unionisation, and em-ployment benefits play an important role in explaining the changes in NAIRU in the majority of OECD countries, including Spain.
Of the set of variables that determine the performance of the job market, in this section we will focus on the characteristics of the Spanish economy that refer to collective bargaining, the two-tier labour market created by the difference in firing costs for temporary and permanent employees, and the regulation of goods and services markets. These are the areas that require the most urgent structural reforms to reduce the structural unemployment rate and the segmentation of the labour market.19
4.1 Reforming collective bargaining
In terms of collective bargaining Spain has a series of characteristics which make it somewhat different from other OECD countries. Firstly, although the degree of unionisation is among the lowest among the countries listed in Table 4.1.1, the share of the labour force covered by agreements determined by collective bargain-ing is among the highest. Indeed, together with France and Greece, Spain has one of the biggest differences between the number of workers who participate actively in the bargaining process (through the unions they belong to) and those who are finally affected by the outcome of these negotiations.
18 See, for example, Blanchard (2006), Nickell (2006), OECD (2006), Blanchard and Wolfers (2000), IMF (2003), and the bibliography they cite for an overview of the determinants of unemployment rates in the OECD countries.
19 An assessment of the effects of taxation on employment in Spain can be found in Boscá, Doménech and Ferri (2009), and the references they cite.

Ageing and real convergence: challenges and proposals 221Ángel de la Fuente and Rafael Dom
énech
Along with the issue of how well the collective bargaining process represents workers, another problem is that, as Estrada and Melguizo (2008) argue, the col-lective bargaining agreements that have been put in place since 1997 have pro-duced a situation in which in most cases wages are negotiated at the sector/prov-ince level rather than at the firm level. This is despite the various labour reforms that the Spanish economy has undergone since the mid-eighties and the recogni-tion of some of the problems brought by extending the scope of collective bar-gaining agreements.
As can be seen in Chart 4.1.1, the percentage of workers whose wages are negotiated at firm level has been on a downward trend since the early eight-
Collective bargaining coverage
0%-25% 26%-50% 51%-75% 76%-100%
0%-25%USA, Japan,
Lithuania Estonia, Hungary,
Poland Germany
Spain, France,Greece
26%-50%Ireland,
United Kingdom Luxembourg,
Czech Republic
Austria, Slovenia,Nethelands, Italy,
Portugal
51%-75%Cyprus,Norway
Belgium,Finland
76%-100%Denmark,Sweeden
Level ofunionisation
COLLECTIVE BARGAINING COVERAGE AGAINST LEVEL OF UNIONISATION, 2006
TABLE 4.1.1
SOURCES: Du Caju et al (2008) and SEE BBVA.
SOURCES: MTIN and SEE BBVA.
0%
5%
10%
15%
20%
25%
1981 1984 1987 1990 1993 1996 1999 2002 2005 2008
PERCENTAGE OF WORKERS WHOSE WAGES ARE NEGOTIATED AT THE FIRM LEVEL. SPAIN, 1981-2008 (AS A PERCENTAGE OF ALL WORKERS COVERED)
CHART 4.1.1

222 Spain and the euro. The fi rst ten years
ies, reaching an average of just over 11 per cent in recent years. In common with Germany, the dominant wage bargaining level in Spain is the sector with-in each region, in contrast with other countries where wage negotiations are either national or firm level (particularly in the US and UK), as can be seen in Table 4.1.2.
These data suggest that Spain has an intermediate degree of centralisation of collective bargaining. Given that, according to Calmfors and Driffil’s (1998) the-oretical results, there is a U-shaped relationship between the degree of centralisa-tion and unemployment, the type of collective bargaining that predominates in Spain is less favourable in terms of job creation and unemployment than that in the Nordic countries (national) or Anglosaxon countries (where, with the excep-tion of Ireland, the firm level predominates). Nevertheless, in empirical terms, using data for the OECD, Thomas (2002) finds that although wages are more sensitive to unemployment in countries with centralised collective bargaining, they are less sensitive to firm-specific factors (such as changes in relative prices and productivity) and this means unemployment rates end up being higher than in those countries where wages are negotiated at the firm level.
Estonia Firm
Firm
Firm
Firm
Firm
Firm
Firm
Firm
Hungary
Lithuania
Luxembourg
Poland
Czech Republic
United Kingdom
USA
France Sector/Firm
Austria Sector-occupational
Sweeden Sector-occupational
Germany Sector-regional
Spain Sector-regional
Belgium Sector
Denmark Sector
Nethelands Sector
Italy Sector
Norway Sector
Portugal Sector
Japan Sector
Slovenia National
Finland National
Ireland National
DOMINANT LEVEL OF WAGE NEGOTIATIONS(YEAR 2006)
TABLE 4.1.2
SOURCES: Du Caju et al (2008) and SEE BBVA.

Ageing and real convergence: challenges and proposals 223Ángel de la Fuente and Rafael Dom
énech
One of the consequences of the fact that the dominant level for wage negotia-tions is not the firm is the smaller correlation between wage growth and produc-tivity growth in Spain as compared with other countries where salaries are more responsive to firms production conditions. Using the results obtained by García (2009), a way of illustrating this implication of wage negotiations is to analyse the distribution of annual growth rates of wages and productivity in Spain, and com-pare them with those of other countries in which wages are mainly negotiated at company level (United Kingdom). Although, ideally, the best way of doing this ex-ercise would be to have information for a sample of firms that is sufficiently repre-sentative of national output, the absence of uniform information across countries means it is only possible to perform this analysis with aggregate sector data. For this purpose data for the period 1996 to 2005 from the EU KLEMS database on 56 productive sectors has been used (see Ark, O’Mahony and Timmer, 2008).
Charts 4.1.2 and 4.1.3 show the estimated density functions for the real pro-ductivity growth rates and wage growth rates (560 observations, corresponding to the 56 sectors and 10 years covered by the sample used). As can be seen, the density function of annual wage growth in Spain is more closely concentrated around the mean (i.e. has a lower variance) than productivity growth. This find-ing contrasts with the evidence seen in the United Kingdom, where the two den-sity functions are practically identical. In fact, when testing if both distributions are the same, the Kolmogorov-Smirnov test rejects the null hypothesis of equality in the case of Spain by a wide margin (the statistic is equal to 0.116 with a sig-nificance level close to zero), while for the United Kingdom it is accepted with a probability of 77.7 per cent (the statistic is 0.038).
SOURCE: SEE BBVA from EU KLEMS.
0
5
10
15
20
25
-2 -1 0 1 2
OUTPUT PER WORKER WAGES PER WORKER
DE
NS
ITY
DENSITY FUNCTIONS OF PRODUCTIVITY AND WAGE GROWTH. SPAIN, 1996-2005 (SPAIN. REAL WAGES AGAINST PRODUCTIVITY PER WORKER SECTOR-SPECIFIC GROWTH 1996-2005; 21 BRANCHES OF ACTIVITY)
CHART 4.1.2

224 Spain and the euro. The fi rst ten years
These results suggest that when the dominant level of wage negotiations is not the firm, as is the case in Spain, there is greater salary compression, such that wage growth presents less variance and less of a correlation with productiv-ity growth, thus confirming the findings of Pagán and Sánchez-Sánchez (2008), who, using the 2002 Structure of Earnings Survey (Encuesta de Estructuras Sal-ariales) data, found that firm-level agreements are those with a higher correlation between productivity and salaries, in line with the evidence given by Card and de la Rica (2006).
According to Thomas’s (2002) findings cited above, one of the implications of these results is that as wages are less sensitive to firm performance, employment is the adjustment variable. This evidence therefore suggests it is necessary to reform collective bargaining in Spain to bring it more in line with that in countries in which unemployment rates are lower and wage growth is more closely related to productivity growth. This reform does not imply renouncing collective bargain-ing on three levels (national, sector, and firm), but appropriately limiting the type of items to be negotiated on each of them.
At the national level it makes sense to agree those aspects which affect all workers and firms equally, regardless of the sector or market they operate in: e.g. agreements to improve the system for training workers, to reduce un-employment rates, avoid the two-tier structure of temporary and permanent workers, to improve and simplify labour legislation, to increase the efficiency of the tax system or to ensure the future sustainability of the pension system. At sector level only those issues that affect all the firms in an industry equally should be negotiated, such as health and safety, or working conditions in the
SOURCE: SEE BBVA from EU KLEMS.
0
2
4
6
8
10
12
-2 -1 0 1 2
OUTPUT PER WORKER WAGES PER WORKER
DE
NS
ITY
DENSITY FUNCTIONS OF PRODUCTIVITY AND WAGE GROWTH. UNITED KINGDOM, 1996-2005 (UNITED KINGDOM. REAL WAGES AGAINST OUTPUT PER WORKER. SECTOR-SPECIFIC GROWTH 1996-2005; 21 BRANCHES OF ACTIVITY)
CHART 4.1.3

Ageing and real convergence: challenges and proposals 225Ángel de la Fuente and Rafael Dom
énech
sector. Finally, salary and organisation issues (such as working hours, func-tional and geographical mobility), which have an impact on the efficiency and competitiveness of each individual firm, should be negotiated at the firm level.
Another important issue that should be taken into account in collective negotiations in Spain is avoiding the general applicability of collective agree-ments. This would prevent the application of agreements to firms and workers that are not formally represented at higher levels of collective bargaining, un-less they voluntarily decide to opt-in to one of the supra-firm level agreements for a specific period. In line with this proposal, the OECD (2008) suggests the more widespread use of opt-out clauses at sub-national levels for negotiation. This would improve the extent to which workers are represented at lower levels and enhance the sensitivity of negotiated components to firm performance.
4.2 High rates of temporary employment
Another of the specific features of the Spanish labour market is that the share of temporary employment is much higher than in other European countries. As Jimeno (2008) argued, labour reforms in Spain (1984, 1992-93, 1994, 1997, 2001 and 2006) have not produced sufficient flexibility or contained the explo-sion in temporary contracts that began in the mid 1960s. As Table 4.2.1 shows, the rate of temporary employment in Spain in 2007 (31.9 per cent) was, by a wide margin, the highest among the OECD countries, more than doubling the OECD average (14.6 percent) or that of the 15 European Union countries (14.8 percent).
Apart from the problems of equity that this produces, the high rate of tem-porary employment that exists in Spain increases the sensitivity of unemploy-ment to the economic cycle. In recessions such as the current one, the jobs that tend to be lost first are the temporary ones, making the temporary em-ployment rate pro-cyclical. The prevalence of temporary contracts also has a negative impact on productivity (Dolado and Stucchi, 2008), as it affects firm’s decisions to provide ongoing training and workers’ decisions to accumu-late physical and human capital, and even on women’s fertility rates (de la Rica and Iza, 2006).
As in many other economic spheres, this split between temporary and per-manent employees is the result of the response to the incentives and restrictions existing in the Spanish labour market. These have made it difficult to reconcile the flexibility firms need to adapt to changing competitive and productive en-vironments with the security that workers demand to ensure their continuity in their jobs. Balancing these opposing forces has given rise to an inefficient system, according to which, in the event of unfair dismissal (which in practice

226 Spain and the euro. The fi rst ten years
covers virtually all redundancies), temporary workers are entitled to a severance pay of just 8 days per year worked, whereas employees on “employment promo-tion” contracts (a special scheme intended to convert temporary contracts into permanent ones) are entitled to 33 days’ pay and those on permanent contracts to 45 days’ pay per year worked (Chart 4.2.1).
To put an end to this two-tier labour market, the reform should bring all new jobs in a single type of contract, such that firing costs are linked to length of service without the current discontinuities. Instead of the intervals that cur-rently exist, the new contract should produce a continuous relationship in which firing costs increase gradually with the time the employee has worked for the firm.20 One way of achieving this relationship between job duration and the cost of dismissal would be to set up a dismissal fund, such as that which exists in Austria, where the firm and the worker contribute part of their wages to a fund,
1990 1995 2000 2005 2006 2007
Spain 29.8 35.0 32.1 33.3 34.4 31.9
Portugal 18.3 10.0 20.4 19.5 20.2 22.2
Netherlands 7.6 10.9 14.0 15.2 16.2 18.0
Sweeden ... ... 15.2 15.8 16.8 17.5
Finland ... ... 16.5 16.6 16.4 16.0
Germany 10.5 10.4 12.7 13.7 14.1 14.2
Japan 10.6 10.5 12.5 14.0 14.3 13.9
France 10.5 12.3 15.5 13.3 13.4 13.7
Italy 5.2 7.2 10.1 12.4 13.0 13.4
Greece 16.6 10.2 13.1 ... ... ...
Switzerland ... 13.1 11.7 13.0 13.6 13.0
Canada ... ... 12.5 13.2 13.0 12.9
Norway ... ... 9.3 9.5 10.1 9.5
Denmark 10.8 12.1 10.2 9.9 9.6 9.1
Ireland 8.5 10.2 4.7 2.6 4.2 9.0
Austria ... 6.0 7.9 9.1 9.0 8.9
Belgium 5.3 5.3 9.0 9.1 8.9 8.8
United Kingdom 5.2 7.0 6.8 5.5 5.6 5.8
USA ... 5.1 ... 4.2 ... ...
EU-15 10.4 11.4 13.5 14.1 14.6 14.8
OECD 10.6 9.9 13.9 10.8 14.3 14.6
TEMPORARY EMPLOYMENT RATE. OECD, 1990-2007 TABLE 4.2.1
SOURCE: OECD, Stat.
20 A contract of this kind, in which severance pay increases gradually and continuously in line with the employee’s length of service, has also been put forward by Bentolila, Dolado and Jimeno (2008). These au-thors show that a contract with 8, 12, 15, 20 and 25 days severance pay for each of the first five years and 36 days as of the sixth year would produce a redundancy payment equivalent to of the current system paid to a worker who has worked for the firm for 10 years.

Ageing and real convergence: challenges and proposals 227Ángel de la Fuente and Rafael Dom
énech
which is used in the case of dismissal, and which workers can take with them if they change job (see OECD, 2006).
4.3 Reforms in the goods and services market
As is well known, the rate of structural employment is simultaneously de-termined by the market power of workers in the labour market and the market power of firms in the goods and services market (see Andrés, 1993 and Layard, Nickell and Jackman, 2005). Recognising this characteristic of the labour market means that in order to reduce unemployment it will be necessary to undertake reforms in the goods and services markets as well as undertake a series of labour market reforms such as those described above.
Recent empirical evidence on the need to undertake reforms to promote employment growth is fairly conclusive. For example, Gianella et al (2008) confirm results previously reported in the literature (see, for example, the work of Blanchard and Giavazzi, 2003, Fonseca, et al, 2001, and the references in OECD, 2006), finding that the OECD indicator that approximates regula-tions restricting competition in seven sectors (gas, electricity, postal services, telecommunications, air transport, rail and road transport) has a statistically significant and economically important effect on structural unemployment rates in the OECD countries.21 Indeed, according to these authors the variable having greatest impact on the reduction of NAIRU in Spain over the period
SOURCES: Eurostat and SEE BBVA.
0
15
30
45
TEMPORARY CONTRACT “EMPLOYMENT PROMOTION” CONTRACT
PERMANENT CONTRACT
REDUNDANCY PAY AND CONTRACT TYPE IN SPAIN CHART 4.2.1
NUMBER OF DAYS PER WORKER ´S YEAR OF SERVICE
8
33
45
21 The construction of this indicator is described in the paper by Conway, De Rosa, Nicoletti and Steiner (2006).

228 Spain and the euro. The fi rst ten years
1992-2003 is precisely the regulation of goods markets, where improvements over this period as a result of greater competition explain slightly more than 50 per cent of the reduction in the structural unemployment rate. Using an alternative method based on specifying and calibrating a general equilibrium model with unemployment and imperfect competition in the goods market, Ebel and Haefke (2008) find that deregulating goods markets can fully explain the drop in structural unemployment in the United States between the eighties and nineties.
Chart 4.3.1 illustrates the correlation that exists between the indicator for regulation in the goods market constructed by the OECD (referring to 2003) and the structural unemployment rate in 2005.22 As can be seen, those coun-tries in which this indicator is highest (least competition in goods markets) have a higher structural unemployment rate (the correlation between the two variables is 0.57).
Chart 4.3.2 examines the correlation between the unemployment rate and the average of the standardised values of the World Bank’s Doing Business variables, which refer to how easy it is to start a business (number of procedures, time and cost), to handle permits and to conduct foreign trade. Again we observe that those countries which impose higher business start-up and running costs have
3.0
4.0
5.0
6.0
7.0
8.0
9.0
10.0
11.0
0.8 0.9
AUS
1.0 1.1 1.2 1.3 1.4 1.5 1.6 1.7 1.8 1.9 2.0
NAIRU AND REGULATION OF PRODUCT MARKETS. 2003-2005 CHART 4.3.1
INDICATOR OF GOODS MARKET REGULATION, OECD, 2003
NAIRU, 2005
GBR
USA DNKNZL
IRE
CAN
SWE
JAP
NLD
AUT
NOR
POR
DEUBEL
FIN
ESP
FRA
ITA
GRE
22 The OECD has recently published the 2008 results for this indicator (see Wölfl et al, 2009), in which there is a clear relative improvement in Spain’s position between 2003 and 2008, above all in the do-mestic economic regulation index and, to a lesser extent, in that of administrative regulation. Despite this, Spain is still a long way behind the countries with the best regulatory environments. Given that no results are available for this indicator in 2008 for some of the countries in the sample, and as the effects of goods-market reforms on the labour market are not immediate, Chart 4.3.1 uses 2003 levels, which are more close-ly correlated to the structural unemployment rate in 2005.

Ageing and real convergence: challenges and proposals 229Ángel de la Fuente and Rafael Dom
énech
higher rates of structural unemployment (the correlation between the two vari-ables is 0.57).23
This evidence highlights the need to simultaneously reform the labour mar-ket and the goods and services market, by making progress towards market liberalisation, increasing competition and improving regulations to promote business activity and reduce administrative costs. The improvements in busi-ness efficiency and goods markets competition will therefore have an impact on reducing unemployment rates. In this regard, an ambitious implementation of the EU’s Services Directive would be a good opportunity to make decisive progress in this direction.
4.4 Other measures
The structural improvements the Spanish economy needs in order to raise employment rates undoubtedly do not end with the measures discussed in the preceding sections. With common regulations and institutions at national level, there is a high degree of heterogeneity in the employment rates across Spain’s re-gions and provinces. It therefore seems evident that it is necessary to eliminate the incentives that set up obstacles to workers’ geographical mobility, and which are preventing the differences in employment rates from disappearing. In this regard, as the empirical evidence shows, the relationship between housing poli-cies, workers’ geographical mobility and how easy it is to rent a home is crucial. For example, Bassanini and Duval (2006) find that a third of the variance of the
3.0
4.0
5.0
6.0
7.0
8.0
9.0
10.0
11.0
0 0.1 0.2 0.3 0.4 0.5 0.6 0.7 0.8 0.9
STRUCTURAL UNEMPLOYMENT AND EASE OF DOING BUSINESS CHART 4.3.2
DOING BUSINESS INDICATOR, 2007
NAIRU, 2005
DNKNOR JAP
NZLAUS
SWEGBR
IREAUT
POR
NLD
BELDEUCAN
FIN FRA
ESP
ITA
GRE
23 The correlation between the goods market regulation indicator constructed by the OECD and the Doing Business indicator is 0.74.

230 Spain and the euro. The fi rst ten years
fixed effects estimated using a standard regression of the unemployment rate for a panel of OECD countries between 1982 and 2003 seems to be explained by the average percentage of homeownership (Spain has the second highest percentage rate of home ownership in the OECD). Therefore, in order to increase the mo-bility of the labour factor and reduce the huge disparities in unemployment rates between provinces, it would seem timely to encourage rented property, not with more tax incentives, but by strengthening the legal position of landlords, so as to create genuine incentives for the large numbers of unoccupied properties that currently exist to be offered on the rented property market.
Another aspect which is linked to regulations that hinder business activity (and also create a disincentive to foreign investment) is that of the administrative costs they have to face due to the lack of a true internal market and the complex-ity of the tangle of regulations, which differs from one Autonomous Community to another. Re-establishing a genuine internal market does not require that the Autonomous Communities renounce their competencies over trade, but does re-quire that they coordinate them in a national commission bringing together all the actors and institutions involved, in order to simplify the current dispersed and heterogeneous legislation into a single, simplified regulatory framework.
5 The pensions system and the aging challenge
Pensions currently constitute one of the biggest public spending items in most advanced countries. For obvious reasons, it is also one of the elements of the welfare state that is most sensitive to ageing. The problem is particularly seri-ous in those countries which, like Spain, have an unfunded system with defined benefits, in which pensions are financed by current contributions from workers (“pay-as-you-go”) and their levels are set in advance without reference to actuarial sustainability criteria.
The topic has received considerable attention in Spain. Going back over a dec-ade, a number of studies have approached the problem from different perspec-tives. Practically all of them, however, agree on the seriousness of the challenge and on the need for urgent reforms in the field.24
24 The literature on the sustainability of the Spanish pensions system is extensive. There was an ini-tial wave of studies on the topic in the second half of the nineties, including among others, MTSS (1995), Barea et al (1995, 1996 and 1997), Herce et al (1996), Boldrin et al (1999), Jimeno and Lisandro (1999), Jimeno (2000), Herce and Alonso (2000) and Montero (2000). Later works include Alonso and Herce (2003), da Rocha and Lores (2005), Díaz Saavedra (2005), Ahn et al (2005), Balmaseda et al (2006), Díaz Giménez and Díaz Saavedra (2006 and 2008), Conde and Alonso (2006), EPC (2006), Gil et al (2007), Jimeno, Rojas and Puente (2008), MTIN (2008), Doménech and Melguizo (2008) and Moral-Arce et al (2008).

Ageing and real convergence: challenges and proposals 231Ángel de la Fuente and Rafael Dom
énech
Drawing upon this literature, this section will insist on the same message once again. After reviewing the evolution of pension spending over the last few dec-ades, we project the future path of this variable over the next half century starting out from the most recent demographic scenarios and using a simple model of pension expenditure. Finally, this model is also used to obtain a tentative estimate of the possible impact of various reforms that will serve as the basis for our policy recommendations.
5.1. Evolution of the revenues and expenditures of the contributory pension system, 1981-2007
This section analyses the evolution of the revenues and expenditures of Spain’s public pension system over the last three decades. The data we have used correspond to spending on contributory Social Security pensions. We have obtained data on the number of pensions paid each month between 1981 and 2007 and on their average amount from the Ministry of Labour (MITIN, 2008a) website. These data are broken down by pension type (retirement, dis-ability, and survivors’ pensions). For 1998-2007 they come from the Labour Statistics Bulletin (Boletín de Estadísticas Laborales, MITIN, 2008b), while for previous years average amounts are taken from the 2000 and 2007 editions of the INSS Statistics Report (Informe Estadístico, various years).
Total pension expenditure is estimated by multiplying the average number of pensions due each year by their average value (obtained by multiplying the monthly amount by fourteen).25 The calculation is performed separately for each type of pension and the results aggregated. We also checked that the total ob-tained in this way approximately matches the figure given in the General State Budget for this item.
In Spain, ordinary social-security contributions cover a series of contingen-cies apart from retirement, making it theoretically impossible to isolate a specific contribution to the pension system. Based on an internal report by the Span-ish government cited by Doménech and Melguizo (2008), we estimate that 95% of social-security contributions are allocated to the pension system.26 In recent years, social security contributions have been supplemented by a growing contri-bution by the State, which has gradually taken on the financing of the so-called “minimum complements”, which bring the lowest contributory pensions up to
25 The total number of current pensions is greater than the number of pensioner because a given individu-al may receive more than one pension. Pension payments are doubled in the months of July and December.
26 According to the report cited by Doménech and Melguizo (2008), income from social-security con-tributions paid in to the pension system came to 8.6% of GDP in 2006. We have calculated the ratio be-tween this amount and the total social-security contributions for ordinary risks (including those correspond-ing to the unemployed), which in this year came to 8.98% of GDP.
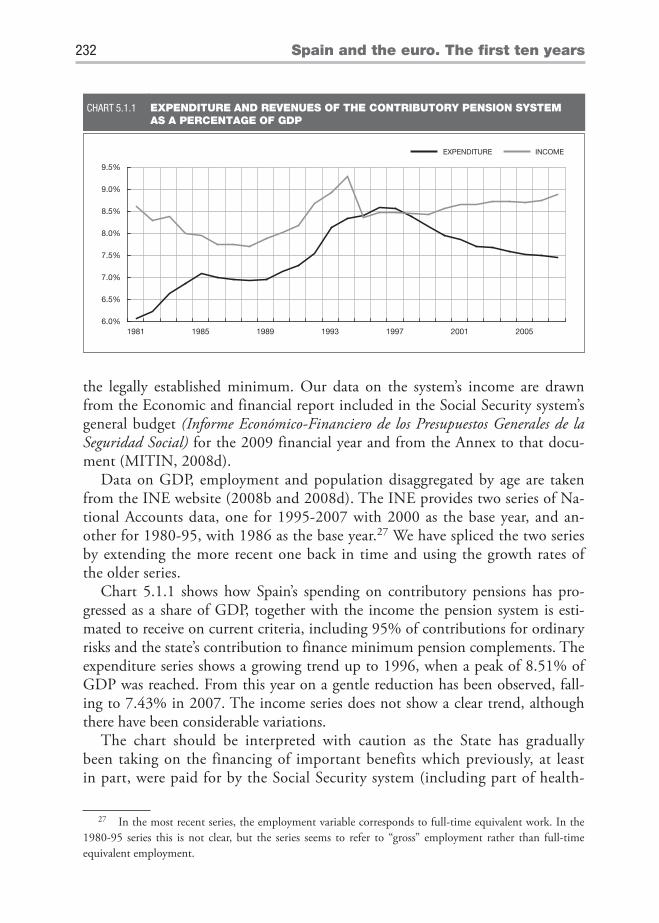
232 Spain and the euro. The fi rst ten years
the legally established minimum. Our data on the system’s income are drawn from the Economic and financial report included in the Social Security system’s general budget (Informe Económico-Financiero de los Presupuestos Generales de la Seguridad Social) for the 2009 financial year and from the Annex to that docu-ment (MITIN, 2008d).
Data on GDP, employment and population disaggregated by age are taken from the INE website (2008b and 2008d). The INE provides two series of Na-tional Accounts data, one for 1995-2007 with 2000 as the base year, and an-other for 1980-95, with 1986 as the base year.27 We have spliced the two series by extending the more recent one back in time and using the growth rates of the older series.
Chart 5.1.1 shows how Spain’s spending on contributory pensions has pro-gressed as a share of GDP, together with the income the pension system is esti-mated to receive on current criteria, including 95% of contributions for ordinary risks and the state’s contribution to finance minimum pension complements. The expenditure series shows a growing trend up to 1996, when a peak of 8.51% of GDP was reached. From this year on a gentle reduction has been observed, fall-ing to 7.43% in 2007. The income series does not show a clear trend, although there have been considerable variations.
The chart should be interpreted with caution as the State has gradually been taking on the financing of important benefits which previously, at least in part, were paid for by the Social Security system (including part of health-
6.0%
6.5%
7.0%
7.5%
8.0%
8.5%
9.0%
9.5%
1981 1985 1989 1993 1997 2001 2005
EXPENDITURE INCOME
EXPENDITURE AND REVENUES OF THE CONTRIBUTORY PENSION SYSTEM AS A PERCENTAGE OF GDP
CHART 5.1.1
27 In the most recent series, the employment variable corresponds to full-time equivalent work. In the 1980-95 series this is not clear, but the series seems to refer to “gross” employment rather than full-time equivalent employment.

Ageing and real convergence: challenges and proposals 233Ángel de la Fuente and Rafael Dom
énech
care and non-contributory pensions). Strictly speaking, therefore, the vertical distance between the two series can only be interpreted as the surplus or defi-cit of the public pension system in very recent years. However, in any case, it gives us an idea of the way in which its financial situation has evolved. In the mid-nineties the system was approximately in equilibrium. In recent years, however, a reduction in spending has made it possible to build up a reserve fund which had accumulated 45,716 million euros (4.35% of GDP) by the end of 2007.
5.1.1 The evolution of spendingIn order to analyse the dynamics of pension spending as a share of GDP,
it is useful to break this indicator down into a series of factors that capture the influence of demographics, employment and the generosity of the pension system.28
Let PEXP be total pension expenditure. The ratio between this variable and GDP can be expressed in the following way:
NPENSEP GENNPENSL
LGDP *= =NPENS
GDPPEXP
PEXP=
LNPENS
QAVPENS [6]
where NPENS is the number of pensions being drawn and L is total employ-ment. Therefore, pension expenditure as a share of GDP is equal to the product of the number of pensions per employed person (NPENSEP) and an indicator (GEN) of the “generosity” of average labour pension, measured by the ratio be-tween this variable (AVPENS) and average labour productivity (Q). It is conven-ient to rewrite the first term of the decomposition as follows:
COV DEP EMPL L * *= =NPENSNPENSEP =
N65+ N1864N65+NPENS N1864 [7]
where N65+ and N1864 refer to the population aged over 64 and the popula-tion between 18 and 64 respectively. Therefore, the number of pensioners per worker can be expressed as the product of these three factors: the pension cov-erage ratio (COV = number of pensions per person of retirement age), old age dependency ratio (DEP = number of people over 64 for each person of working
28 This type of decomposition has often been used in the literature. See, for example, Jimeno, Rojas and Puente (2008) and Doménech and Melguizo (2008).
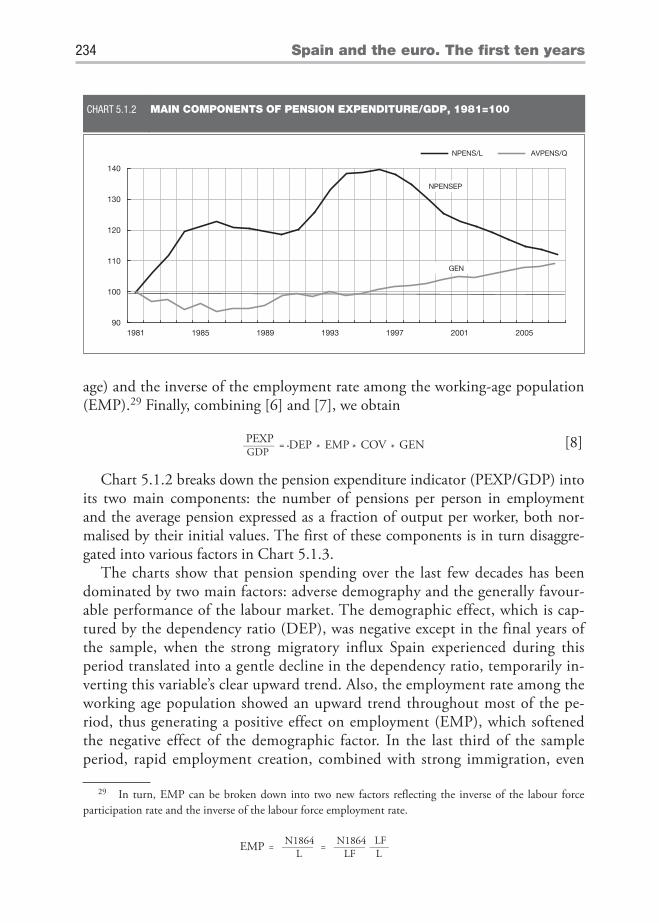
234 Spain and the euro. The fi rst ten years
age) and the inverse of the employment rate among the working-age population (EMP).29 Finally, combining [6] and [7], we obtain
DEP EMP COVGDP * *PEXP = * GEN [8]
Chart 5.1.2 breaks down the pension expenditure indicator (PEXP/GDP) into its two main components: the number of pensions per person in employment and the average pension expressed as a fraction of output per worker, both nor-malised by their initial values. The first of these components is in turn disaggre-gated into various factors in Chart 5.1.3.
The charts show that pension spending over the last few decades has been dominated by two main factors: adverse demography and the generally favour-able performance of the labour market. The demographic effect, which is cap-tured by the dependency ratio (DEP), was negative except in the final years of the sample, when the strong migratory influx Spain experienced during this period translated into a gentle decline in the dependency ratio, temporarily in-verting this variable’s clear upward trend. Also, the employment rate among the working age population showed an upward trend throughout most of the pe-riod, thus generating a positive effect on employment (EMP), which softened the negative effect of the demographic factor. In the last third of the sample period, rapid employment creation, combined with strong immigration, even
29 In turn, EMP can be broken down into two new factors reflecting the inverse of the labour force participation rate and the inverse of the labour force employment rate.
EMP
L L= N1864
LFLF= N1864
90
100
110
120
130
140
1981 1985 1989 1993 1997 2001 2005
NPENS/L AVPENS/Q
MAIN COMPONENTS OF PENSION EXPENDITURE/GDP, 1981=100 CHART 5.1.2
GEN
NPENSEP

Ageing and real convergence: challenges and proposals 235Ángel de la Fuente and Rafael Dom
énech
allowed a noticeable reduction in expenditure as a share of GDP. As we shall see, however, all the signs suggest that this was just a short-lived respite within a continuing upward trend in expenditure which will be irreversible unless sig-nificant changes are made to the design of the pension system.
As regards the rest of the components of pension expenditure, we see a gentle increase in the indicator of the generosity of average pensions (GEN), while the coverage ratio (COV) has tended to remain fairly constant, with no clear trend or large oscillations.
5.2 Demographic and employment scenarios for 2007-60
The data we have just reviewed suggest that population ageing is already hav-ing a substantial effect on pension expenditure and that the acceleration of this process over the coming decades could jeopardise the viability of the system.
In order to try to get an idea of the potential magnitude of the problem which we are likely to have to face in the future, we will forecast pension spend-ing over the period 2008-2060 under the assumption that there are no signifi-cant changes to the system’s current structure. As our starting point, in this section we will construct a variety of scenarios for the demographic and employ-ment components of pension expenditure. In each case we will prepare three forecasts: a baseline scenario, an “optimistic” (minimum expenditure) scenario and a “pessimistic” scenario.
5.2.1 Demographic scenariosOur starting point in this analysis is the demographic scenario recently con-
structed by Eurostat for Spain (Europop, 2008). Eurostat’s baseline scenario for
80
90
100
110
120
130
140
1981 1985 1989 1993 1997 2001 2005
NPENS/N65 N65+/N1864 N1864/L
COMPONENTS OF THE NUMBER OF PENSIONS PER WORKER, 1981=100 CHART 5.1.3
COV
DEP
EMP

236 Spain and the euro. The fi rst ten years
Spain envisages a gradual decline in net immigration (down from more than 600,000 people a year in 2008 to less than 150,000 from 2040), a slight recovery in the fertility rate (from 1.39 children per woman in 2008 to 1.56 in 2060) and a rapid increase in life expectancy (by 7.5 years for men and 5.7 years for women over the same period). The result is a rapid process of ageing. On this hypothesis, the old age dependency ratio (defined as the ratio of the population aged 65+ to the population aged 18-64) will increase rapidly over the next five decades, from 0.25 in 2008 to 0.62 in 2060.
In addition to Eurostat’s central scenario, we will also consider two alterna-tive scenarios with a view to delimiting the range of possibilities. The first (with-out immigration or pessimistic), also prepared by Eurostat, is identical to the base-line scenario except that here it is assumed that the flow of immigrants is zero throughout the period. The result is a sharp acceleration in the ageing process, with an additional increase of 15 percentage points in the estimated dependency ratio at the end of the period, which reaches a value of 0.77 in 2060.
The third (optimistic) scenario modifies two of the hypotheses of Eurostat’s base-line scenario in the opposite direction to the second scenario. Firstly, the net flow of immigrants is increased by 50% in each of the years in the sample, assuming that the new entrants are uniformly distributed over the 20 to 29 year age range. Sec-ondly, we have increased the gross fertility rate implicit in the baseline scenario30 by 10%. With these changes the dependency ratio in 2060 would be 0.54.31
30 The construction of this scenario is described in more detail in Annex 2, section 1.31 INE has recently published (January 2009) a projection of the Spanish population over the next ten
years. This scenario is similar to Eurostat’s baseline scenario, although somewhat more pessimistic regarding the future evolution of immigration.
30
35
40
45
50
55
60
65
70
2008 2013 2018 2023 2028 2033 2038 2043 2048 2053 2058
BASELINE WITHOUT IMMIGRATION OPTIMISTIC
PROJECTIONS OF SPAIN’S TOTAL POPULATION CHART 5.2.1

Ageing and real convergence: challenges and proposals 237Ángel de la Fuente and Rafael Dom
énech
Charts 5.2.1 and 5.2.2 show the expected variation in the total Spanish population and the old-age dependency ratio (population aged 65+/18-64) in each of the three scenarios, with the second variable normalised using its value in 2008 (0.252). The baseline scenario implies the virtual stagnation of Spain’s population after 2020, whereas a complete halt to immigration would imply that this variable would start to decline immediately. As we have seen, the de-pendency ratio would be doubled in the best case and could be tripled over the next half century.
5.2.2 Employment scenariosThe share of GDP taken up by pension expenditure is also very sensitive to vari-
ations in the employment rate. In this section we project the value of this variable over the period of interest, starting from the (full-time equivalent) employment se-ries given above, which have been constructed by linking the two CNE series. We will therefore work with the employment rate of the working-age population de-fined as the ratio of total equivalent employment to the population aged 18-64.
Employment is a more difficult variable to predict than population as it does not have the latter’s inertia. Therefore, the exercise undertaken here is much riskier than the one in the previous section. Given our aims, however, it is not essential that the employment forecast be very precise. Basically, we will settle for a reasonable bound on the degree to which favourable developments on employment front can mitigate the adverse effects of ageing on the public pension system. Our basic hypothesis will therefore be rather optimistic: we will assume that the aggregate employment rate continues on the positive trend it has displayed over the last two decades and tends to gradually converge on the male employment rate in 2007 (a good year) in Spain or
SOURCES: Eurostat. Population projections, Europop 2008 and author’s own calculations.
75
100
125
150
175
200
225
250
275
300
325
350
2008 2013 2018 2023 2028 2033 2038 2043 2048 2053 2058
BASELINE WITHOUT IMMIGRATION OPTIMISTIC
OLD-AGE DEPENDENCY RATIO (POP. 65+/POP. 18-64) (PROJECTIONS FOR SPAIN, 2008 = 100)
CHART 5.2.2

238 Spain and the euro. The fi rst ten years
some other country with more favourable ratios than ours. We will also try, however, to take into account the possible effects of the current crisis on the coming years.
We will therefore start out with the employment rate observed in 2007 (65.16%) and project it in to the future using the procedure described below.
The employment rate forecasts for the population in the 18-64 age range for 2008-10 have been obtained by combining the employment forecasts in the recently updated Stability Plan (Plan de Estabilidad para España; MEH, 2009) with the baseline demographic scenario. That is to say, the employment rate in each year is obtained by dividing the employment envisaged in MEH (2009) by the 18-64 population envisaged in Eurostat’s central demographic scenario. The value of the employment rate estimated in this way is used in the three employment scenarios for the years 2008-10. (What changes from one scenario to the next, once they have been combined with the correspond-ing demographic scenario, is the change in population, so that by maintaining the employment rate constant, we will be varying the total volume of employ-ment).
For 2011 onwards, we have proceeded as follows: On the baseline scenario the employment rate recovers its 2007 level in 5 years (in 2015) with uniform annual increments. After 2015 the employment rate converges at an annual rate of 4% towards the employment rate for Spanish males aged between 16 and 64 in 2007 (which was 77.4%), a similar level to that currently seen in the population as a whole in Japan, the Nordic countries, Canada and the US.
To this central scenario we have added an “optimistic” and a “pessimistic” sce-nario. In the first case, we assume that the recovery in employment in the wake of the current crisis takes four years (rather than five) and that, starting in 2014, the employment rate converges on its long-term level at a rate of 4% a year, but now
90
95
100
105
110
115
120
125
2007 2012 2017 2022 2027 2032 2037 2042 2047 2052 2057
BASELINE PESSIMISTIC OPTIMISTIC
EMPLOYMENT RATE PROJECTIONS (EMPLOYED PERSONS/POPULATION 18-64)
CHART 5.2.3

Ageing and real convergence: challenges and proposals 239Ángel de la Fuente and Rafael Dom
énech
taking the employment rate among Dutch males in 2007 (82.3%), the highest in the EU that year, as the reference. Finally, in the pessimistic scenario, we assume that after an initial drop, the employment rate remains constant in 2011 (at the 2010 level) and that the recovery of the 2007 level now takes six years from 2011. In this case, the long-term reference is again the employment rate for Spanish males, but the rate of convergence is reduced by half (to 2% a year).
Chart 5.2.3 summarises the results of the exercise. On the baseline scenario, the employment rate increases by 16% between 2007 and 2060. This increase shrinks to 11% in the more pessimistic scenario and rises to 22% in the most optimistic scenario.
5.2.3 The combined effects of demography and employmentBy combining the results of the preceding two sections, it is possible to con-
struct a sort of confidence interval for the number of people of retirement age per employed person. Firstly, we have combined both baseline scenarios. To construct the interval around this central projection we have combined the two pessimistic scenarios in one case and the two optimistic ones in the other.
Chart 5.2.4 shows the results. Combining the demographic and employment factors (but keeping the unit cost or generosity element constant), our baseline forecast suggests that pension expenditure as a share of GDP will more than dou-ble between 2007 and 2060. In the most optimistic scenario, the increase in this expenditure item will fall to 74%, while in the most pessimistic scenario pension expenditure will almost triple.
Table 5.2.3 summarises the results of the last three sections. On the base-line scenario, ceteris paribus, the ageing of the population will translate into an increase in pension spending as a share of GDP of 146.3% between 2007 and
75
100
125
150
175
200
225
250
275
300
2007 2012 2017 2022 2027 2032 2037 2042 2047 2052 2057
BASELINE PESSIMISTIC OPTIMISTIC
PROJECTION OF NUMBER OF OLD PEOPLE PER EMPLOYED PERSON (2007 = 100)
CHART 5.2.4
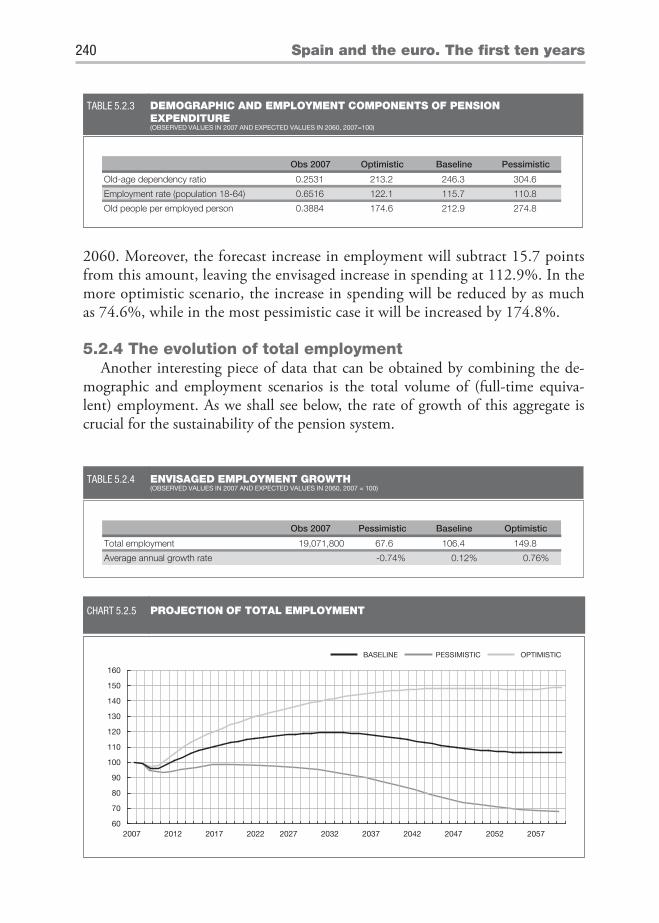
240 Spain and the euro. The fi rst ten years
2060. Moreover, the forecast increase in employment will subtract 15.7 points from this amount, leaving the envisaged increase in spending at 112.9%. In the more optimistic scenario, the increase in spending will be reduced by as much as 74.6%, while in the most pessimistic case it will be increased by 174.8%.
5.2.4 The evolution of total employmentAnother interesting piece of data that can be obtained by combining the de-
mographic and employment scenarios is the total volume of (full-time equiva-lent) employment. As we shall see below, the rate of growth of this aggregate is crucial for the sustainability of the pension system.
Obs 2007 Optimistic Baseline Pessimistic
Old-age dependency ratio 0.2531 213.2 246.3 304.6
Employment rate (population 18-64) 0.6516 122.1 115.7 110.8
Old people per employed person 0.3884 174.6 212.9 274.8
DEMOGRAPHIC AND EMPLOYMENT COMPONENTS OF PENSION EXPENDITURE (OBSERVED VALUES IN 2007 AND EXPECTED VALUES IN 2060, 2007=100)
TABLE 5.2.3
Obs 2007 Pessimistic Baseline Optimistic
Total employment 19,071,800 67.6 106.4 149.8
Average annual growth rate -0.74% 0.12% 0.76%
ENVISAGED EMPLOYMENT GROWTH (OBSERVED VALUES IN 2007 AND EXPECTED VALUES IN 2060, 2007 = 100)
TABLE 5.2.4
60
70
80
90
100
110
120
130
140
150
160
2007 2012 2017 2022 2027 2032 2037 2042 2047 2052 2057
BASELINE PESSIMISTIC OPTIMISTIC
PROJECTION OF TOTAL EMPLOYMENT CHART 5.2.5

Ageing and real convergence: challenges and proposals 241Ángel de la Fuente and Rafael Dom
énech
Chart 5.2.5 shows the envisaged course of employment between 2007 and 2060 in each of the scenarios. Table 5.2.4 summarises the initial and final values and also shows the average rate of growth of equivalent employment in each case for the period as a whole.
5.3 A simple model of pension spending
Section 2 of Annex 2 sketches a simple accounting model of pension spending in an economy in which salary growth is exogenous. The model uses highly simplified assumptions, including lifetimes with non-stochastic durations and constant rates of employment and productivity growth, it ignores agents’ heterogeneity and the en-dogeneity of decisions to enter or exit the labour market and does not take into ac-count some important characteristics of the Spanish system, including the existence of ceilings and floors on the base for pension contributions. It is not, therefore, a detailed or realistic model that tries to capture all the relevant variables when pro-jecting pension spending or analysing the impact of possible reforms of the system. Nevertheless, we believe that it is a useful complement to the aggregate accounting model that we are using because it introduces a degree of discipline when projecting into the future the generosity component of pension expenditure (i.e. the ratio be-tween the average pension and labour productivity). Used with care, the model can also be used to construct a first estimate of the impact of various possible reforms on the long-term sustainability of the system.
The model assumes that the pension calculation period (N), the number of years over which contributions are paid (C) and the period during which a re-tirement or surviving spouse’s pension is drawn (X and X2) remain constant over time. It also assumes constant rates of employment and population growth (n) and average wage growth (g), a wage premium for experience that grows exponentially with the number of years worked (also at a constant rate, ) and a constant rate of contributions (). For the given values of these parameters, and applying the rules for pension calculations defined in the current Span-ish legislation (see section 3 of Annex 2), the model enables us to calculate the ratio between the average pension and average wages, the IRR (internal rate of return) of the contributory pension system, the total income and expenses of the system, and therefore its financial balance. Finally, the model offers a simple characterisation of the financial sustainability of the pension system: it is sustainable in the long term if and only if its IRR does not exceed the rate of growth of aggregate wages (g+n).
5.3.1 Parameterising the modelWhen applying this model in combination with our demographic and em-
ployment scenarios, we have to take into account the fact that it is basically a

242 Spain and the euro. The fi rst ten years
steady-state model and is unable to reflect the dynamics induced by changes in the values of these parameters. Consequently, what we will do is set the values of the parameters of the model by taking as a reference the average values of the variables of interest during the period 2007-60 in each of the scenarios we are considering and over the period 1981-2007.
Table 5.3.1.1 summarises the main data. For 1980-2007, g and n are set equal to the average rates of productivity growth per (full-time equivalent) employed person and total employment, according to the CNE data referred to above. Both rates have been calculated by regressing the logarithm of the corresponding vari-able on a linear trend. In the case of productivity, our base assumption for 2007-60 is that the average rate of growth observed from 1980-2007 will remain con-stant into the future. The value of g in the optimistic and pessimistic scenario is set equal to the average rate of productivity growth (calculated by the same pro-cedure) over the periods from 1980-95 and 1995-2007, respectively. In the case of employment, the value of n for 2007-60 in each scenario s is set equal to the average growth rate of employment envisaged in it. This variable is not estimated, rather it is calculated directly from current employment and that envisaged at the end of the period, using
n 53
ss s
= ln L – ln L2060 2007
where Lst is the employment forecast in period t under scenario s.
The average number of years over which pensioners have paid contributions is estimated as the product of the average employment rate among the popula-tion aged 18-64 in the relevant scenario (calculated as the average of their annu-al values) and the theoretical maximum duration of the individual’s working life,
2007-2060
Baseline Optimistic Pessimistic
Growth in output per worker (g) 1.13% 1.13% 1.70% 0.39%
Total employment growth (n) 1.90% 0.12% 0.76% -0.74%
Average employment rate 18-64 56.03% 70.33% 72.87% 67.90%
Average years contributions (C) 26.34 33.05 34.25 31.91
Life expectancy
Population as a whole 76.66 85.9 85.9 85.9
Men 73.37 83.5 83.5 83.5
Women 79.93 88.3 88.3 88.3
X = years drawing retirement pension 11.66 20.90 20.90 20.90
X2= additional years surviving spouse's pension 6.02 5.15 5.15 5.15
1980-2007
PARAMETERISATION OF THE MODEL ON VARIOUS SCENARIOS TABLE 5.3.1

Ageing and real convergence: challenges and proposals 243Ángel de la Fuente and Rafael Dom
énech
65 – 18 = 47 years. The period during which a pension is drawn is calculat-ed as the difference between the average life expectancy of the population as a whole (taking its average value during the relevant period) and the retirement age (which is set to be equal to the legal retirement age of 65 years). The pe-riod during which a surviving spouse’s pension is drawn is estimated as being the difference between the life expectancy of women and the population as a whole, incremented by 2.75 years, which is the average difference in age be-tween men and women at the time of marriage according to the INE’s marriage statistics (2008c). For the period 1980-2007, the average value of life expect-ancy at birth between 1975 and 2005 has been taken. For the period 2007-60 we have taken the average of the values of this variable for 2005 and 2060. The latter is estimated by adding to the value observed in 2005 the increase in life expectancy forecast by Eurostat in its population scenario (which is our base-line scenario). The probability () that a retiree is survived by a spouse entitled to a survivor’s pension is set at ½.
The experience premium ( = 1.26%) is set so that the model reproduces the ratio between the initial retirement pension (under the general social security sys-tem) and the average salary observed in 2007. The average salary is taken from the EES (Encuesta de Estructura Salarial) for 2006 and increased by 5% to take it to 2007. Finally, the social security contribution rate is assumed to be equal to 95% of the contribution rate for ordinary contingencies under the general so-cial security system, calculated as the sum of the rates applicable to the company (23.6%) and the worker (4.7%).
5.4 Projection of total pension expenditure as a share of GDP
In the model sketched out in the previous section and in Annex 2 the ratio be-tween the average pension (retirement and survivors) and aggregate average wages is given by
(t) (C)b(N)e = =P(t) C–nC
W(t)n –
g + n –
1–e–(n–)C1–e
–(g+n– )1– (1– )e – e–nX –n(X+X2)1– (1– )e – e
X –(g+n– ) (X+X2)
[9]
where
b(N) =(g+)N
1–e–(g+)N [10]
is the base for the pension calculation (expressed as a fraction of the worker’s salary at the time of retirement), (C) is the percentage of the base which will correspond to a pensioner who has paid contributions for C years and is the rate at which pen-sions grow in real terms once their initial amount has been set (which will be zero in the case of Spain, as they are updated in line with the CPI).

244 Spain and the euro. The fi rst ten years
Using this expression and the values of the parameters that appear in Table 5.3.1.1 we have calculated the steady-state values of the ratio P/W predicted by the model (see Table 5.4.1). The value of the ratio P/W observed in 2007 for retirement pen-sions (under the general regime) is 0.51, well below the model’s prediction. If the model is correct, this would indicate that we are still a long way from the steady state and that the upward tendency of P/W we have observed during recent dec-ades will persist into the future, even if all the parameters of the system keep the values observed in the period 1980-2007 indefinitely. Moreover, the value of the ratio P/W predicted by the model is higher for the period 2007-13 than for 1980-2007 in all three scenarios. As explained in Annex 2, this seems to be due to the increase in the average number of years during which contributions will be paid that we are expecting to see over the coming decades, under our relatively opti-mistic assumptions about the evolution of the employment rate.
In an attempt to be conservative, we will not use the model’s prediction direct-ly for the steady state of the ratio P/W. Instead, we will assume that this ratio will increase gradually between 2007 and 2060 by the same proportion as the mod-el’s prediction for 2007-60 increases in relation to the prediction for 1980-2007. That is to say, in each scenario, the value of P/W in 2060 has been estimated by multiplying the value of the ratio observed in 2007 by the index which appears in the second column of Table 5.4.1. We will also assume that this increment takes place at a uniform rate over the period. Finally, we will assume that wages remain constant over time as a share of national income. We therefore arrive at the pro-jection of the ratio between the average pension and the output per employed person that is shown in Chart 5.4.1.
Combining this projection with the relevant demographic and employment sce-narios, and assuming that the system’s coverage ratio (number of pensions per person of retirement age) remains constant, we finally obtain the projection of total pension expenditure as a fraction of GDP shown in Chart 5.4.2. As previously, all the opti-mistic and pessimistic scenarios are combined to construct the “confidence interval” around the baseline scenario.
Chart 5.4.2 also shows the system’s expected income, which we hold constant over time at the value observed in 2007 (8.81% of GDP). With this assump-
Estimated value Index
1980-2007 0.704 100.0
2007-2060, baseline 0.829 117.7
2007-2060, optimistic 0.787 111.9
2007-2060, pessimistic 0.902 128.2
ESTIMATED STATIONARY VALUES OF RATIO P/W TABLE 5.4.1

Ageing and real convergence: challenges and proposals 245Ángel de la Fuente and Rafael Dom
énech
tion, the system would go into deficit in 2023 in the baseline scenario, 2031 in the optimistic scenario and in 2014 in the pessimistic scenario. If we assume that the system’s surplus during the initial years of the period is devoted to the reserve fund and that this fund generates a 2% real return, the accumulated resources in
0.15
0.17
0.19
0.21
0.23
2007 2012 2017 2022 2027 2032 2037 2042 2047 2052 2057
BASELINE PESSIMISTIC OPTIMISTIC
PROJECTION OF RATIO OF AVERAGE PENSION TO GDP PER EMPLOYED PERSON
CHART 5.4.1
5%
10%
15%
20%
25%
30%
2007 2012 2017 2022 2027 2032 2037 2042 2047 2052 2057
BASELINE PESSIMISTIC OPTIMISTIC INCOME
PROJECTION OF CONTRIBUTORY PENSION EXPENDITURE AS A PERCENTAGE OF GDP
CHART 5.4.2
Obs 2007 Pessimistic Baseline Optimistic
Expenditure/GDP 7.43% 26.17% 18.62% 14.51%
Index, 2007=100 100.0 352.3 250.7 195.3
GROWTH OF PENSION EXPENDITURE/GDP (OBSERVED VALUES IN 2007 AND EXPECTED VALUES IN 2060, 2007 = 100)
TABLE 5.4.2

246 Spain and the euro. The fi rst ten years
the fund would cover the current deficit of the system up until 2032 in the base-line scenario, 2044 in the optimistic scenario and 2024 in the pessimistic sce-nario. These results are similar to those obtained by Doménech and Melguizo (2008). Once the reserve fund has been exhausted, the system’s debt (also accru-ing at a rate of 2% a year in real terms) would skyrocket, to reach 234% of GDP in 2060 in the baseline scenario (74% in the optimistic scenario and 585% in the pessimistic scenario), as Chart 5.4.3 shows.
5.4.1 Comparison with the results of other studiesIn general terms, our results are consistent with those of previous studies.
Table 5.4.1 compares our projections of pension spending for 2050 with those of other authors, and insofar as it is possible, it identifies the source of the dif-ferences between baseline scenarios in terms of the main components of the ex-penditure indicator.
All the studies foresee a substantial increase in pension spending over the next few decades, primarily as a result of the sharp increase in the dependency rate pre-dicted by the INE and Eurostat’s demographic scenarios, which all authors take as their starting point. The employment scenarios are also fairly similar, and point towards an increase in employment rates (from initial values around 62) which, however, will be unable to compensate for the effects of ageing. The biggest dis-crepancies have to do with the behaviour of the ratio of the average pension to output per employee. Whereas some studies estimate that this ratio will remain constant or even fall slightly over the coming decades, others predict an increase of as much as 100%. The origin of these differences is not easy to ascertain. In some cases this component of spending is projected only approximately. However, there does not seem to be a consensus on this issue even among the studies that
-250%
-225%
-200%
-175%
-150%
-125%
-100%
-75%
-50%
-25%
0%
25%
2007 2012 2017 2022 2027 2032 2037 2042 2047 2052 2057
BASELINE PESSIMISTIC OPTIMISTIC
PROJECTION OF RESERVE FUND/DEBT OF PENSION SYSTEM AS A PERCENTAGE OF GDP
CHART 5.4.3

Ageing and real convergence: challenges and proposals 247Ángel de la Fuente and Rafael Dom
énech
use more detailed data on employment histories and transitions, in order to in-corporate the heterogeneity of the population and the peculiarities of the pension calculation in a realistic way when forecasting this expense component.
5.5 Reforms necessary to ensure the viability of the pension system: a first approximation
In this section we will use the pensions model sketched out above to analyse the impact of possible reforms of the pension system on its sustainability over the next half century. Our approach is similar to that taken in the previous section: taking the average values of the relevant variables in 1980-2007 and 2007-60 (for each of the scenarios) as a reference for setting the values of the parameters of the model, we will analyse the long-term sustainability of the current system and the impact possible reforms might have on it.
As indicated in Annex 2, the model tells us that the pensions system will be in financial equilibrium (income = expenses) provided the following condition is met:
= n–
(C,N)e –1(g–)C 1–(1– –)e e–(g+n– )X –(g+n– )(X+X2)
g+n– [11]
where (C,N)=(CBN) is the system’s initial replacement rate, defined as the ratio between the initial pension and salary at the time of retirement. If we take
Expenditure/GDP Values on baseline scenario
Baseline Min MaxEmployment
rateDependency
ratio
Average pension/
productivity
This study 18.1 13.1 26.1 71.4 59.1 19.6
Jimeno (2000) 19 26.6 71.4 30
EPC (2006) 15.7 71.3 65.4 17.1
MITIN (2008) 15.3
Gil et al (2007) 15 12 16 67 19.2
Balmaseda, Melguizo and Taguas (2006) 18.7 13.5 24 75.1 54 21
Díaz Saavedra and Díaz Gimenez (2006) 18.2
da Rocha and Lores (2006) 25.5 68.8 56.2 35.1
Ahn et al (2005) 20
Jimeno, Rojas and Puente (2006) 19.6 16 70 56 22.6
Moral-Arce et al (2006) 15.5 14.4 71.4 65.6 16
Average 18.2 13.8 23.2 71.4 60.5 22.6
PROJECTIONS OF CONTRIBUTORY PENSION EXPENDITURE IN 2050(PERCENTAGES)
TABLE 5.4.1
NOTE: In this study, the employment rate and dependency ratio are usually calculated taking the population aged 18-64 as the reference. To facilitate comparisons with other studies, the table shows the values both ratios take when calculated using the population aged 15-64 as the reference, which is that generally used in the literature.

248 Spain and the euro. The fi rst ten years
as given the rate of contribution to the social security system, , we can use this condition to calculate the sustainable initial replacement rate, ~, (i.e. the rate that would balance income and expenditure in the steady state). Alternatively, taking as given the initial replacement rate produced by the system, we can calculate the sustainable contribution rate, ~ . Finally, the model also tells us that the system is in long-term equilibrium if and only if its IRR is not greater than the sum of the rates of growth of employment and productivity, g+n.
Table 5.5.1 shows the three sustainability indicators just mentioned. The cur-rent system would be sustainable over the long term with the demographic and growth parameters observed on average from 1980-2007. Under these circum-stances, it might even be possible to reduce the contribution rate slightly or in-crease the replacement rate by almost two points without jeopardising the long-term equilibrium between income and expenditure. Given our demographic and employment scenarios, however, the situation going forward is very different. The current system will not be sustainable even on most optimistic scenario of the three we have considered.
The problem is basically demographic. All the forecasts suggest a very much reduced rate of growth of the working age population, accompanied by a sig-nificant lengthening of life expectancy. Even on the basis of highly favourable as-sumptions about labour market performance, the rate of growth of the system’s income will slow markedly, thus reducing its sustainable IRR, while the lengthen-ing of the period over which pensions are drawn tends to raise their real IRR. In order to re-establish the balance, it would be necessary to increase contribution rates significantly (by between 16 and 54 percentage points), which would be highly unwise, or reduce the replacement rate by between 30 and 56 points.
As we shall see, a third option is to delay retirement. Before examining this possibility, let us consider the effects on the sustainability of the system of three reforms that have often been suggested: extending the pension calculation pe-
2007-2060
Baseline Optimistic Pessimistic
Observed contribution rate (employer + employee) 26.89% 26.89% 26.89% 26.89%
Sustainable contribution rate 26.23% 56.92% 43.20% 81.84%
Necessary increase -0.66% 30.04% 16.31% 54.60%
Replacement rate produced by the system 69.47% 80.76% 79.54% 83.08%
Sustainable replacement rate 71.20% 38.14% 49.51% 27.41%
Necessary reduction -1.74% 42.61% 30.04% 55.67%
Estimated IRR of current system 2.91% 4.04% 4.20% 3.84%
Sustainable IRR 3.03% 1.25% 2.46% -0.35%
Necessary reduction -0.12% 2.79% 1.74% 4.18%
1980-2007
INDICATORS OF SUSTAINABILITY OF THE CURRENT SYSTEM ON VARIOUS SCENARIOS
TABLE 5.5.1

Ageing and real convergence: challenges and proposals 249Ángel de la Fuente and Rafael Dom
énech
riod, increasing the number of years needed to be entitled to a “full pension” (i.e. to 100% of the pension base) and updating pensions at less than the rate of inflation.
Chart 5.5.1 shows the impact of increasing the number of years of a work-er’s wage history that are used to calculate his pension on the system’s initial replacement rate under the parameters of our baseline scenario for 2007-60. Starting out from the current situation, extending the calculation period would reduce the replacement rate on an approximately linear basis but at a relative-ly modest rate. Making the calculation period equal to the number of years of contributions by the representative pensioner (33 in the baseline scenario) would reduce the replacement rate by just 14 points, leaving it still 28 points above its sustainable value.32
The second option we explore is extending the period necessary to obtain a “full pension.” In order to parameterise this reform appropriately, we first as-sume that a “linear system” is adopted, with a constant accrual rate for pension calculations – that is to say, a system in which the pension entitlement, meas-ured as a % of the “full pension”, increases linearly with time at a rate of 1/A points per year, where A is the number of years necessary to reach 100% of the pension base. Chart 5.5.2 shows the sensitivity of the replacement rate to A, starting out from the current replacement rate for the average pensioner.33 As in the previous case, the effect of the measure is significant but insufficient to
0%
10%
20%
30%
40%
50%
60%
70%
80%
90%
15 16 17 18 19 20 21 22 23 24 25 26 27 28 29 30 31 32 33
REPLACEMENT RATE SUSTAINABLE VALUE
SENSITIVITY OF REPLACEMENT RATE TO PERIOD OVER WHICH PENSIONS ARE CALCULATED
(BASELINE SCENARIO 2007-60)
CHART 5.5.1
32 And assuming that the measure does not translate into an increase in early retirement, a danger pointed out by Díaz Giménez and Díaz Saavedra (2008).
33 That is to say, we take as our starting point the value of A (= 34.4) which would give the same as the current system to our hypothetical representative pensioner (on the baseline scenario).

250 Spain and the euro. The fi rst ten years
guarantee the long-term viability of the system. Increasing the period required to reach 100% of the pension base to 50 years would reduce the replacement rate by 25 points, leaving it 18 points above its sustainable value.
A third possibility would be to update pensions, once granted, at a rate below the CPI. Chart 5.5.3 illustrates the consequences of indexing pensions at a rate equal to CPI – , where the variable is shown on the horizontal axis. In this case, the system’s initial replacement rate does not change, as the initial pension would continue to be calculated in the same way as at present, but the lower expenditure growth rate would translate into an increase in the initial sustain-able replacement rate. The graph shows that the impact of this measure would
0%
10%
20%
30%
40%
50%
60%
70%
80%
90%
34 35 36 37 38 39 40 41 42 43 44 45 46 47 48 49 50
REPLACEMENT RATE SUSTAINABLE VALUE
SENSITIVITY OF THE REPLACEMENT RATE TO THE PERIOD REQUIRED TO REACH 100% OF THE CALCULATION BASIS WITH A LINEAR SYSTEM (BASELINE SCENARIO 2007-60)
CHART 5.5.2
0%
10%
20%
30%
40%
50%
60%
70%
80%
90%
0.0% 0.2% 0.4% 0.6% 0.8% 1.0% 1.2% 1.4% 1.6% 1.8% 2.0%
REPLACEMENT RATE SUSTAINABLE VALUE
SENSITIVITY OF THE SUSTAINABLE REPLACEMENT RATE TO THE RATE OF REDUCTION OF PENSIONS IN REAL TERMS (BASELINE SCENARIO 2007-60)
CHART 5.5.3

Ageing and real convergence: challenges and proposals 251Ángel de la Fuente and Rafael Dom
énech
be very modest: updating pensions two points below inflation would only buy an increase in the sustainable replacement rate of 8.7 points.
The combination of the three measures just considered would still not be suf-ficient to ensure sustainability under the baseline scenario, although it would just do the trick under the most optimistic scenario. Table 5.5.2 summarises the incidence of each of these measures and various combinations of them on the system’s IRR and initial replacement rate34 in each of our scenarios. Adopting all three proposed measures simultaneously would still leave us half a point above the sustainable IRR of the system (and 5.5 points above the sustainable replacement rate) in the base sce-nario. It should be kept in mind that the figures in the table will tend to overestimate the impact of both reforms in the short term. What the model shows are long-term or steady-state effects, but these will take time to become fully effective because the introduction of the measures envisaged (with the exception of the change in the pen-sion indexing rate) will only affect new pensioners and not existing ones. It is also foreseeable that measures of this type will be introduced only gradually, which would lengthen the transition period yet further. As a result, it seems reasonable to conclude that changes in the way in which pensions are calculated do not, by themselves, pro-vide a sufficient margin for action to ensure the sustainability of the system.
Looked at from a different angle, the results we have just summarised imply that the switch to a defined contribution system, with benefits based on actuarial criteria to guarantee the sustainability of the system, would result in a drastic cut in pensions from their current levels. This all points towards raising the retire-
34 It should be borne in mind that modifying the index used to update pensions does not affect the ini-tial replacement rate but does affect the sustainable value of this indicator. In this case, therefore, only the ef-fect on IRR is shown.
Baseline scenario Optimistic scenario
IRRReplacement
rateIRR
Replacementrate
Current system 4.04% 80.76% 4.20% 79.54%
Sustainable values 1.25% 38.14% 2.46% 49.51%
After reforms
1 Calculation period = contribution period 3.33% 66.42% 3.29% 61.92%2 Linear system + 50 years for 100%of calculation basis
2.67% 55.55% 2.87% 55.32%
3 Pensions indexed to CPI – 0.5% 3.87% 4.03%
1 and 2 simultaneously 1.93% 45.69% 1.94% 43.06%
1, 2 and 3 simultaneously 1.74% 1.74%
EFFECT OF CHANGES IN THE CALCULATION PROCEDURE TABLE 5.5.2

252 Spain and the euro. The fi rst ten years
ment age as the most effective alternative and, no doubt, the most desirable way of ensuring the sustainability of the system while minimising the necessary cut in the value of pensions.
5.5.1 Implications of delaying retirementAnalysing the effects of raising the retirement age is more complex than ana-
lysing those of the previous measures because a reform of this kind would also af-fect many of the parameters of the model, including the average number of years of contributions, the evolution of employment and the length of time over which pensions are drawn. This in turn affects the IRR and the initial replacement rate of the system and its sustainable values.
Firstly, therefore, it is necessary to rerun our employment scenarios in the light of the new policy and re-parameterise the model. Let us assume that, starting in 2008 the retirement age is raised by two months a year until it reaches 70 years, and that the employment rate among individuals who have to postpone their re-tirement remains the same as seen in 2007 for the population aged 60 to 64, according to the EPA (33%). Using these assumptions, we have recalculated the variation in total employment, the employment rate, the average contribution pe-riod and the average number of years during which a pension is drawn with the results summarised in Table 5.5.1 and Chart 5.5.1 This exercise has been carried out using both the baseline and the optimistic scenarios. In order to calculate the average period during which the pension is drawn, we have subtracted an average retirement age of 68.6 years from the average life expectancy over the period.
Table 5.5.2 shows the long-term effects of delaying the average retirement to 68.6 years, maintaining other features of the current system unchanged. In the
Baseline Optimistic
Retirement65
Delayedretirement
Retirement65
Delayedretirement
Output growth per worker (g) 1.13% 1.13% 1.70% 1.70%
Total employment growth (n) 0.12% 0.21% 0.76% 0.85%
Average employment rate 18-64 70.33% 73.21% 72.87% 75.49%
Average years of contributions (C) 33.05 34.41 34.25 35.48
Life expectancy
Population as a whole 85.9 85.9 85.9 85.9
Men 83.5 83.5 83.5 83.5
Women 88.3 88.3 88.3 88.3
X = years drawing retirement pension 20.90 17.27 20.90 17.27
X2= additional years surviving spouse's pension 5.15 5.15 5.15 5.15
Retirement age (average) 65 68.63 65 68.63
PARAMETERISATION OF THE MODEL ON DIFFERENT SCENARIOS(2007-60)
TABLE 5.5.1
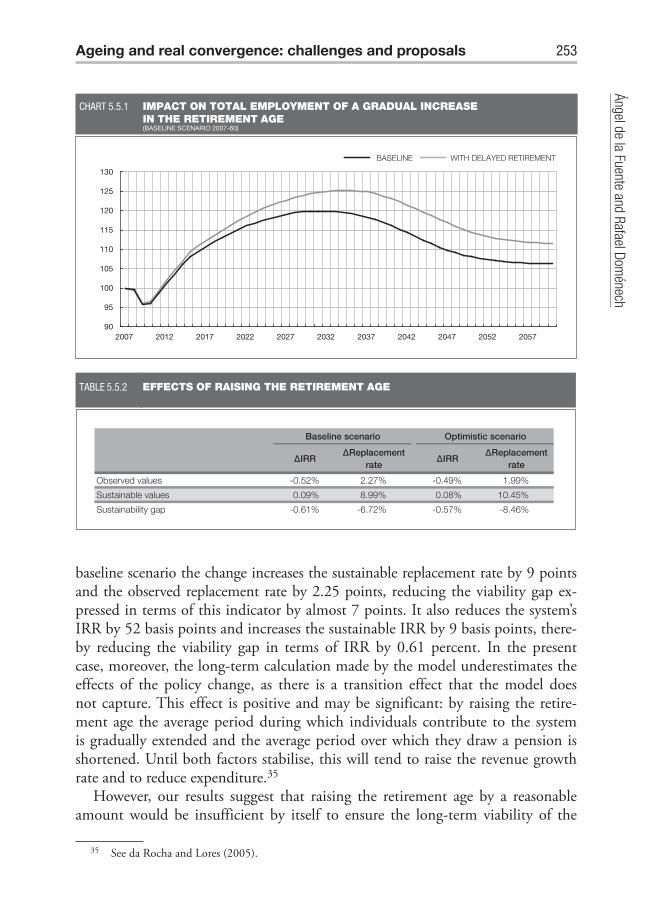
Ageing and real convergence: challenges and proposals 253Ángel de la Fuente and Rafael Dom
énech
baseline scenario the change increases the sustainable replacement rate by 9 points and the observed replacement rate by 2.25 points, reducing the viability gap ex-pressed in terms of this indicator by almost 7 points. It also reduces the system’s IRR by 52 basis points and increases the sustainable IRR by 9 basis points, there-by reducing the viability gap in terms of IRR by 0.61 percent. In the present case, moreover, the long-term calculation made by the model underestimates the effects of the policy change, as there is a transition effect that the model does not capture. This effect is positive and may be significant: by raising the retire-ment age the average period during which individuals contribute to the system is gradually extended and the average period over which they draw a pension is shortened. Until both factors stabilise, this will tend to raise the revenue growth rate and to reduce expenditure.35
However, our results suggest that raising the retirement age by a reasonable amount would be insufficient by itself to ensure the long-term viability of the
35 See da Rocha and Lores (2005).
Baseline scenario Optimistic scenario
∆IRR∆Replacement
rate∆IRR
∆Replacementrate
Observed values -0.52% 2.27% -0.49% 1.99%
Sustainable values 0.09% 8.99% 0.08% 10.45%
Sustainability gap -0.61% -6.72% -0.57% -8.46%
EFFECTS OF RAISING THE RETIREMENT AGE TABLE 5.5.2
90
95
100
105
110
115
120
125
130
2007 2012 2017 2022 2027 2032 2037 2042 2047 2052 2057
BASELINE WITH DELAYED RETIREMENT
IMPACT ON TOTAL EMPLOYMENT OF A GRADUAL INCREASE IN THE RETIREMENT AGE
(BASELINE SCENARIO 2007-60)
CHART 5.5.1

254 Spain and the euro. The fi rst ten years
system in the baseline scenario. In order to achieve this it would also be neces-sary to modify the procedure for calculating pensions in line with the suggestions made above. Table 5.5.3 shows the additional effects that the adoption of these measures would have in combination with raising the retirement age. On the baseline scenario, adopting the first two reforms proposed in the previous section would situate us precisely on the threshold of viability (extending the pension calculation period and the number of years necessary to reach 100% of the pen-sion base). In the case of the optimistic scenario, it would be sufficient to adopt either of these two measures to achieve the same objective.
5.6 Conclusion and recommendations
On current demographic forecasts the Spanish contributory pension system is unsustainable over the long term, even if we make optimistic assumptions about the future evolution of employment rates, productivity growth and im-migration. If the recovery from the current crisis is reasonably quick, produc-tivity grows at a rate above 1%, the female employment rate approaches the male employment rate, and immigration falls only gradually, it is possible that the system will take as long as a decade to go into deficit and that the reserve fund accumulated during the period will allow us to continue paying pensions without problems for eight or nine more years. However, once we have reached this point, the debt necessary to maintain the current system will explode, ris-ing to levels above 100% of GDP in just a few years. Given the system’s huge inertia, the only way to avoid reaching an unsustainable situation would be to start adopting a series of measures immediately. These should go beyond the minor tinkering that has been considered until now within the Pacto de Toledo – the framework agreement on pensions reached by the main political parties and social actors in the mid-nineties.
Baseline scenario Optimistic scenario
IRRReplacement
rateIRR
Replacementrate
Current system (with retirement at 67.25 years) 3.52% 83.03% 3.71% 81.53%
Sustainable values 1.33% 47.14% 2.54% 59.96%
After reforms
Calculation period = contribution period 2.73% 67.34% 2.70% 62.51%
Linear system + 50 years for 100%
of calculation basis2.14% 57.82% 2.37% 57.31%
Both measures 1.31% 46.90% 1.32% 43.94%
EFFECT OF CHANGES IN CALCULATION PROCEDURE WITH GRADUAL RAISING OF RETIREMENT AGE
TABLE 5.5.3

Ageing and real convergence: challenges and proposals 255Ángel de la Fuente and Rafael Dom
énech
Given that it does not seem reasonable to embark on a spiral of rapidly in-creasing taxes and/or social security contributions which would end up suffo-cating the economy, the only feasible option is to reduce the generosity and/or duration of pensions to sustainable levels, extending the period over which pensions are calculated, increasing the number of years needed to reach 100% of the pension base and gradually raising the retirement age, as other OECD countries have done.36 The necessary cut in the replacement rate may be made by means of a formal change to a defined contribution system in which pen-sions are not set in advance but calculated on the basis of actuarial criteria at the time of retirement, or by modifying the parameters of the existing system to obtain an equivalent result. In any event, our calculations suggest that it would be necessary to start to act immediately. Some of the measures we have examined may have adverse effects on lower income individuals’ retirement de-cisions and other important transition effects that our model does not capture. Both factors could modify our results somewhat and require adjustments to the details of some of our recommendations, but they are unlikely to change the essence of the diagnosis or the general lines of the necessary treatment. In the demographic circumstances envisaged over the coming decades, the level of in-come that we will be able to guarantee our old people is, in relative terms, sig-nificantly less than at present, especially if we are not willing to accept a delay of a few years in the retirement age.
6 Concluding remarks
The central thesis of this chapter is that Spain urgently needs to undertake a series of profound structural reforms. In particular, these need to include:
– Reaching a minimum consensus among the various political parties to give the educational system the stability it needs to function properly.
– Stepping up corrective measures to reduce the risk of educational fail-ure among least favoured pupils, concentrating efforts in this regard on the early stages of education. Eliminating the single track through the last stage of compulsory secondary education, or at least relaxing it so as
36 Over the last decade a large number of OECD member countries have reformed their public pension systems. Many of them have extended the period over which pensions are calculated so as to bring them closer to the individual’s total working life. Some of them have also raised retirement ages to over 65, linking the retirement age in some case to variations in life expectancy and/or introducing various mechanisms to al-low the value of pensions to be adapted to demographic circumstances. The most ambitious reforms have been undertaken in Italy, Portugal and Sweden. For more details, see Alonso and Conde (2007) and OECD (2007b).

256 Spain and the euro. The fi rst ten years
to allow for the introduction of more flexible curricula. Strengthening the incentives to promote academic excellence so that students continue their education and training after they have finished their compulsory schooling.
– Reforming collective bargaining by defining the type of elements that should be set in each of the three spheres of negotiation (national, sector-specific and corporate) and establishing more flexible opt-out clauses, with the aim that wage negotiations adequately reflect the economic conditions in each firm and reduce the current system’s tendency to make adjustments almost exclusively through employment levels.
– Creation of a single type of job contract with severance pay linked to length of service, without any type of discontinuities relating to contract duration, so that the cost of dismissal for new employees rises gradually with their length of service.
– Speeding up the adoption of reforms to intensify competition in goods and services markets, to bring down administrative costs and to make it easier to start up new businesses (in terms of the number of administrative steps, time and cost).
– Setting up a national commission bringing together all the regional institu-tions and other actors involved to simplify and unify legislation on the do-mestic market in a common regulatory framework.
– Improving the geographical mobility of the labour force by increasing the supply of rental housing by strengthening landlords’ legal position rather than by creating additional tax incentives.
– Reducing the generosity and/or duration of pensions to sustainable levels, by extending the pension calculation period and the number of years it takes to reach a 100% pension and gradually raising the retirement age, as has been happening in other European countries.
As readers will have noticed, neither our recommendations nor the analy-sis on which they are based are particularly new. In recent years the academic community, international organisations and other private commentators and have produced a huge amount of work on the challenges faced by the Spanish economy and the policies that would be necessary in order to overcome them. To a large extent, our work has limited itself to summarising and reiterating what numerous experts have been saying for a long time about these issues in the hope that repetition will help the message sink in.
The Spanish government is fully aware of the problems we have discussed here. The National Reform Programme (Programa Nacional de Reformas de Es-paña, PNR) adopted in 2005, as part of the European effort to re-launch the Lis-bon Strategy, is subtitled “convergence and employment.” The document begins

Ageing and real convergence: challenges and proposals 257Ángel de la Fuente and Rafael Dom
énech
with an analysis of the evolution of the Spanish economy and its structural weak-nesses, which has a lot in common with that in section 2 of this paper, and which identifies two of the objectives we proposed above as the priorities for Spanish economic policy: full income convergence with our European neighbours and raising the employment rate, while also emphasising the challenge the current process of ageing represents.
In order to achieve these objectives, the PNR establishes a series of axes of ac-tion, which include investment in human capital (axis 3), improving the labour market (axis 6) and adopting measures that guarantee the future equilibrium of the pension system (included in axes 1 and 6). Within these axes of action, the PNR sets out a host of concrete measures, including in particular the following. On the subject of pensions (p. 62) it proposes advancing towards a “greater match between the contributions and benefits when determining retirement pensions” and establishing “new limitations on the recognition of minimum pensions,” al-though it also proposes increasing these at a rate above inflation. On the subject of education (pp. 79-81), one of the priorities is to bolster pre-primary schooling by expanding the number of public slots for children aged 0 to 3 years at a rate of 2% a year until demand is met, and to guarantee free schooling for all children in the second stage of this phase (3 to 6 years). It also proposes bolstering the sup-port measures for pupils with difficulties in primary and secondary education, placing the emphasis on early detection and correction of learning difficulties and encouraging the integration of pupils from immigrant families. Finally, as regards the labour market (pp. 126-31) establishing or enhancing incentives for hiring women and young people on permanent contracts, modernising public employ-ment services and reviewing the contractual basis of temporary work and the cost of temporary and permanent hiring and maintaining the main lines of the inter-confederation agreement on collective bargaining (Acuerdo Interconfederal para la Negociación colectiva), which is perceived as a useful instrument in maintaining salary moderation.
The progress made towards implementing the measures put forward in the PNR is described in the 2006-2008 annual reports on the plan’s progress (MP, various years). On the subject of pensions, the reports emphasize the successive contributions to the reserve fund (which had accumulated a total of 56,000 mil-lion euros by 2008), the extension to fifteen years of the effective minimum con-tribution period required for access to a contributory pension (as compared with 12.6 years previously), and the generalisation of incentives to voluntarily extend working life beyond 65 years by establishing pension top-ups for each additional year worked. In relation to the labour market, partial waivers on employer con-tributions and other incentives for permanent contracts have been extended. As regards education, significant progress has been made in schooling rates for chil-dren under three. Another highlight is the passing and gradual implementation of

258 Spain and the euro. The fi rst ten years
the new Organic Law on Education (Ley Orgánica de Educación, LOE), which is accompanied by an additional budgetary allocation of several billion euros which will basically be devoted to measures designed to lower school failure rates and bolster equal opportunity. The law also includes some significant steps forward, such as the introduction of diagnostic evaluations of basic competencies in the fourth year of primary education and the second year of secondary education.
While most of these measures point in the right direction, they do not go far enough. They are, by and large, minor modifications which do not alter the basic structure of education or pension systems or the model of labour relations. For example, there is no mention whatsoever, of changes to the retirement age or of reforms to the collective bargaining process. Moreover, the government has made an explicit commitment not to undertake any reform of the pension system or of the labour market without the explicit support of the social agents. To some extent, this may be reasonable, given that the cooperation of the trade unions and employers is virtually a sine qua non for any reform in this area to be feasible. However, the government and the main political parties cannot abdicate their re-sponsibilities: they must openly recognize the existence of problems, offer solu-tions for them, even if they are painful for certain groups in the short term, and actively seek the support necessary to implement them. The long-term benefits for Spanish society as a whole undoubtedly more than compensate the effort we need to make today.

Ageing and real convergence: challenges and proposals 259Ángel de la Fuente and Rafael Dom
énech
Annex 1: Definitions and sources of the data used in section 2
– GDP at purchasing power parity. In some countries it has been necessary to re-scale GDP slightly to enable relative per capita income comparisons with data available in Eurostat in August 2008.
Sources: Economic Outlook, OECD, and National Accounts, OECD, vari-ous years. PWT 6.2 for the period 1950-59, growth rates used for back-ward extrapolation.
– Population, working age population, labour force and unemployment rate. Sources: Economic Outlook, OECD, and National Accounts and Employ-
ment Outlook, OECD, various years. PWT 6.2 for the period 1950-59, growth rates used for backward extrapolation. The working age population refers to the population between 15-64 years and 16-64 for Norway, Spain, Sweden, the United Kingdom and the United States. The employed popu-lation is consistent with national accounts, so may not be the same as that stated in the OECD Labour Force Survey.
– Hours worked: Number of hours worked per employee per year across the economy as a whole.
Sources: Economic Outlook, OECD, 2008(1). Austria 2004-2007, Employ-ment Outlook, OECD, 2008. The data for Greece in 2007 refer to 2006. For years previous to those available from the OECD, the hours estimated by Groningen Growth and Development Centre, having been extrapolated backward using their growth rates.
– Private productive capital stock. The same methodology as for the perma-nent inventory method in de la Fuente and Doménech (2006a) has been used to calculate the initial capital stock in 1950, but distinguishing be-tween the private productive capital series, and residential investment and public capital. The depreciation rates are those published by Kamps (2006).
Sources: Economic Outlook, OECD, and National Accounts, OECD, vari-ous years. PWT 6.2 for the period 1950-59, growth rates used for back-ward extrapolation.
– Years of schooling among the population aged over 25 years. Source: de la Fuente and Domenech (2006). Data for the most recent
years have been estimated by applying growth rates from Cohen and Soto (2007), available up to 2010.
– R&D expenditure as a percentage of GDP. Source: Main Science and Technology Indicators, OECD.– Cost of regulations affecting economic activity. Corresponds to the average
of the standardised values for the 21 OECD countries in 2006 of the cost of setting up and closing down a company, red tape, regulations on hiring

260 Spain and the euro. The fi rst ten years
employees, the cost of registering ownership and accessing credit, investor protection and contract protection (both variables with a negative sign), the tax burden and ease of foreign trade (also with a negative sign).
Source: Doing Business 2007, World Bank.– Inflation. Rate of growth of the private consumption deflator. Source: Economic Outlook, OECD.– Structural unemployment rate. NAIRU estimated by the OECD. Source: Economic Outlook, OECD.– Public Deficit. Source: Economic Outlook, OECD.– Index of macroeconomic instability. Average of the standardised inflation se-
ries, structural unemployment rate and public deficit. – PISA results for 2006. Source: Education at a Glance (2008), OECD.

Ageing and real convergence: challenges and proposals 261Ángel de la Fuente and Rafael Dom
énech
Annex 2
1 Construction of the third (“optimistic”) demographic scenario
Let P et be the population of age e on 1 January of year t according to the base-line scenario. First of all, we calculate the gross survival rate for each age group between years t–1 and t, and the “gross fertility” of the population between 20 and 40 years, defined as:
=eS P / tet P e–1
t–1 and =e P / t0t P 20–40
t–1
The projected population under the new scenario eP t is constructed recursively
from the population in 2008 on the baseline scenario, applying the survival rates from the baseline scenario defined above for each age group, incrementing the gross fertility rate by 10% and adding the additional influx of immigrants (I), such that:
=eP P +te–1t–1s et I e–1
t–1 for t>0 and = 1.1 P 20–40t–1ƒ tP 0t *
It should be noted that for the purposes of the calculations the population aged 80+ has been added as a single group (unlike other ages, which are broken down year by year). In this case we obtain:
=80+s P /t80+t P 79+
t–1 and = P 79+t–1P 80+
t80+s t
Note that in this approach we take the average birth-rate and mortality as-sumptions from the baseline scenario, at least approximately, and we also ap-ply them to the new entrants, with the relevant modifications. Given that the gross survival rate we have calculated also takes immigration into account, we are implicitly increasing the rate of immigration by somewhat more than the initial 50%.
2 A simple model of pension expenditure
This section briefly summarises the pension expenditure model developed in de la Fuente (2009).

262 Spain and the euro. The fi rst ten years
2.1 Demography and wage growth
Let us suppose that the number of births increases over time at a constant rate, n, such that the number of individuals born at time s is given by:
L(s)=e ns [1]
An individual born at time s joins the labour market (and starts to work im-mediately) at time s+E, retires at s+J, dies at s+Z, and has a probability of being survived by a widowed spouse who survives until s+Z2.
Let us suppose that wages are exogenous and increase over time and with the individual’s experience. In particular, the real salary at time t h[s+E, s+J] of an in-dividual born at time s is given by:
W(s,t) = Ate[t–(s+E)] = Aoe gte (t–s–E) [2]
where At reflects the effects of technical progress and the accumulation of capital on aggregate wage levels and the term e(t–s–E) is the premium on the individual’s experience. To simplify the calculations, we have assumed that the experience pre-mium grows at a constant rate, , and that it does not present the hump-shape that is normally found in the data.
2.1.1 Calculating the pensionThe model reflects, in simplified form, the approach used in Spain to calculate
the value of contributory pensions. The initial pension an individual born at time s receives on retirement at s+J is calculated as:
P (s,s+J,C,N) = (C)B(s,s+J,N) [3]
where is a percentage dependent on the number of years of contributions, and
C = J–E [4]
as specified in the current legislation (see section 3 of this Annex) and B() is the pension base, defined as the worker’s average wages over the last N years prior to retirement. We refer to N as the calculation period for the pension.
In order to work out the pension base, wages from previous years are up-dated using the CPI (except for those in the last two years, which we ignore in order to simplify the calculations). Given that we are working directly with real wages, the updating is implicit, and we obtain:

Ageing and real convergence: challenges and proposals 263Ángel de la Fuente and Rafael Dom
énech
= ==
(g+)N1–e –(g+)N s+J
s+J–NW (s,t)dt W (s,s+J) b(N)W(s,s+J)B(s,s+J,N) = 1
N
[5]
The pension base is, therefore, a fraction of the worker’s wages at the time of retirement. It is easy to confirm that this fraction is a decreasing function of the length of the period over which the pension is calculated (N) and the growth rate of the individual’s wages (g+).
The initial pension can therefore be written as follows:
P(s,s+J,C,N) = (C)b(N)W(s,s+J) = (C,N)W(s,s+J) [6]
where () = ()b() is the ratio of the salary at the time of retirement to the initial pension. We will refer to this variable as the individual’s initial replacement rate.
The model allows pensions to be updated using an index other than the CPI. If we call the real pension growth rate , the pension (P), in real terms, a pen-sioner retiring in year s+J would receive in year t is given by:
P(s,t,C,N) = P(s,s + J,C,N)e[t–(s+J)]= (C,N)W(s,s+J)ete–(s+J) for t h [s+J, s+Z] [7]
When the worker dies, if he or she leaves a spouse, this spouse will draw a sur-viving spouse’s pension (PV) for the rest of his or her life, the value of which, in constant prices, will be equal to:
PV(s,t,C,N) = P(s,t,C,N) = (C,N)W(s,s+J)et e–(s+J) for t h [s+Z, s+Z2] [8]
where = 0.52 in the general case.
2.1.2 The IRR of the pension systemFrom the worker’s point of view, the public contributory pension system can
be considered an investment vehicle allowing him or her to ensure a life-long in-come after retirement in exchange for a flow of contributions during his or her working life. It can be shown that the internal rate of return (IRR) on this invest-ment is the value of r which solves the following equation:
=
r–g–v(C,N)e –1(r–g–)C
1– (1– –)e e–(r– )X –(r– )(X+X2)
r– [9]
where
X=Z–J [10]

264 Spain and the euro. The fi rst ten years
is the length of time over which the retirement pension is drawn.
X2 = Z2–Z [11]
is the length of time over which the surviving spouse’s pension is drawn (which is paid out with a probability of ) and is the rate of social security contributions related to the pension system (including both the employee and employer contri-butions).
2.1.3 Aggregate magnitudesBy integrating over the date of birth, s, it is straightforward to calculate the in-
come and expenses of the pension system at any moment in time and for a given average salary and pension. As shown in de la Fuente (2009), the ratio between the average pension and average salary is given by
(t) (C,N)e = =P(t) C
W(t)n –
g + n –
1–e
1– e –(n–)C
–nC –(g+n– )1– (1– )e – e–nX –n(X+X2)1– (1– )e – e
X –(g+n– ) (X+X2)
[12]
Moreover, it can be checked that the expenditure of the system each year will be less than its revenues provided that the following inequality is fulfilled
>_
n–(C,N)e –1(n–)C
1– (1– –)e e–(g+n– )X –(g+n– )(X+X2)
g+n– [13]
Working with this expression as an equality, the sustainable replacement rate can be calculated for a given contribution rate which is the contribution rate necessary to maintain the financial equilibrium of the system given the values of its parameters. Finally, it is possible to show that the condition for sustainability given in [13] is fulfilled if and only if the IRR of the system is not greater than the rate of growth of aggregate wages, i.e., if and only if
r<_ g+n [14]
2.1.4 What does the ratio P/W depend on?Charts A2.2.1 and A2.2.2 show the sensitivity of the steady-state value of
the ratio P/W to increments in the rate of growth of productivity and total employment and to increases in the contribution period and length of time for which pensions are drawn. The starting point is a typical pensioner in the pe-riod 1980-2007.

Ageing and real convergence: challenges and proposals 265Ángel de la Fuente and Rafael Dom
énech
The steady-state value of the ratio of average pensions to average wages is neg-ativelly affected by the average productivity growth rate, g, but much less than proportionally, and increases with the average number of years of contributions, C. This ratio is relatively insensitive to the employment growth rate, n, and life expectancy after retirement, X.
This result is counterintuitive and is due to the existence of widows and wid-owers pensions. If we consider only retirement pensions, when we extend life ex-pectancy a little, the marginal pensioner, who formerly exited from the sample and now lives more years, has a pension below the average. Therefore, by increas-ing X the average pension should drop. And, given that average wages do not vary, the P/W ratio should also decrease. However, given that we include widows
80
85
90
95
100
105
110
0.0% 0.1% 0.2% 0.3% 0.4% 0.5% 0.6% 0.7% 0.8% 0.9% 1.0%
g n
SENSITIVITY OF P/W TO INCREMENTS IN g AND n CHART A2.2.1
90
95
100
105
110
115
120
0 0.5 1 1.5 2 2.5 3 3.5 4 4.5 5
C X
SENSITIVITY OF P/W TO INCREASES IN C AND X CHART A2.2.2

266 Spain and the euro. The fi rst ten years
and widowers in the average pension calculation, the marginal pensioner could be close to the total average pension and his or her remaining in the sample will have a minimal effect on the average.
3 Determining contributory and survivor pensions in Spain
This section briefly describes the current rules on determining the initial value of the contributory and survivor pensions provided by the social security system in Spain and how this varies over the long term. It looks at the general case, ig-noring the special regimes that exist.
In order to be entitled to a contributory pension it is necessary to have con-tributed to the social security system for at least 15 years, and with a few excep-tions we will come on to later, have reached the age of 65. The initial amount of the pension is determined as a percentage () of the pension base.
Initial pension = * pension base
The pension base is an average of the gross salary received by the worker over the last 15 years of contributions.37
In order to calculate this average, salaries are updated with the consumer price index up to two years before the retirement date. Those corresponding to the last two years are not updated but calculated at their nominal value. The value of the percentage is proportional to the years of contributions accrued by the worker. Those who have contributed over the required minimum of 15 years will be en-titled to 50% of the pension base. This percentage rises by 3 points per year of contributions up to 25 years and by 2 points for each year between 25 and 35 years, thus reaching 100% of the pension base after 35 years of contributions. As we have said, the legal retirement age is 65. In some cases, however, this age is lowered in view of the special demands of certain occupations. The possibility of early retirement also exists, but with severe restrictions. The main exception in this regard affects workers aged 61 or over who have lost their jobs involuntar-ily and it implies a reduction in the pension of between 7 and 8% (depend-ing on the number of years of contributions accrued) for each year by which retirement is brought forward. Moreover, retirement at 65 is not compulsory.
37 The calculation is performed in monthly terms, using the last 180 months of contributions. The amount discounted from monthly salaries over this period is divided by 210 in order to calculate the month-ly pension base. However, pensioners receive 14 annual payments (including the two extra payments), so the above operation compensates for the extra payments and therefore is equivalent to making the payment in annual terms.

Ageing and real convergence: challenges and proposals 267Ángel de la Fuente and Rafael Dom
énech
Workers who continue working beyond this age are exempt from social security payments and continue increasing their pension. Workers who have accumulated 35 years of contributions can increase the percentage of their pension base above 100% at a rate of 2 percentage points per extra year worked, until they reach the maximum pension set by law.
Survivor pensions are set, in the general case, at 52% of the calculation basis of the deceased spouse, updated according to the revaluations applied to survi-vor pensions as of the date on which the original pension arose. Given that both survivor pensions and retirement pensions are updated in line with the CPI, this is equivalent to linking survivor pensions to the pension received by the de-ceased spouse at the time of death, with the possible exception of maximum and minimum pensions, which the model in the previous section does not take into account.
Once the initial value has been set, pensions are generally updated in line with the CPI. The annual pension increase is set based on the inflation forecast. If ac-tual inflation is higher than that forecast, pensioners receive a compensating pay-ment in the last month of the year, which is consolidated for future increments.
The system is financed out of social security contributions, which represent a fixed percentage of workers’ gross income between a floor and a ceiling. The contribution rate for “ordinary risks” is 23.6% for the employer and 4.7% for the employee. As mentioned in the text, this income also finances other benefits as well as pensions, so it is necessary to consider what share is allocated to pensions in order to estimate the system’s income.

268 Spain and the euro. The fi rst ten years
References
AHN, N., J. ALONSO and J. R. GARCÍA (2005). A projection of the Spanish pension system under demographic uncertainty, Documento de Trabajo No. 2005-20, FEDEA, Madrid.
ALESINA, A., S. ARDAGNA and V. GALASSO (2008). The Euro and Structural Reforms, NBER Working Paper No. 14479.
ALONSO, J., and J. I. CONDE-RUIZ (2007). “Reforma de las pensiones: la experiencia in-ternacional”, Información Comercial Española. Revista de Economía, 837, pp. 179-193.
ALONSO, J., and J. A. HERCE (2003). Balance del sistema de pensiones y boom migratorio en España. Proyecciones del modelo MODPENS de FEDEA, Documento de Trabajo No. 2003-02, FEDEA, Madrid.
ANDRÉS, J. (1993). “La Persistencia del Desempleo Agregado: una Panorámica”, Moneda y Crédito, 197, pp. 91-127.
BALMASEDA, M., A. MELGUIZO and D. TAGUAS (2006). “Las reformas necesarias en el sistema de pensiones contributivas en España”, Moneda y Crédito, 222, pp. 313-340.
BAREA, J. et al. (1995). El sistema de pensiones en España: análisis y propuestas para su viabili-dad, Círculo de Empresarios, Madrid.
BAREA, J., M. CARPIO, E. DOMINGO et al. (1996). Escenarios de evolución del gasto pú-blico en pensiones y desempleo en el horizonte 2020, Documento de Trabajo, Fundación BBV.
BAREA, J., J. M. GONZÁLEZ-PÁRAMO and J. VELARDE (1997). Pensiones y prestaciones por desempleo, 2nd edition, Fundación BBV, Bilbao.
BARNETT, S. (1990). “Benefits of compensatory preschool education”, Journal of Human Resources, XXVII (2), pp. 279-312.
— (1995). “Long-term effects of early childhood programs on cognitive and school out-comes”, The Future of Children, 5 (3), pp. 25-50.
BASSANINI, A., and R. DUVAL (2006). “The Determinants of Unemployment across OECD Countries: Reassessing The Role of Policies and Institutions”, OECD Economic Studies, 42 (1), pp. 7-86.
BENTOLILA, S., J. J. DOLADO and J. F. JIMENO (2008). “Two-tier employment Protec-tion Reforms: The Spanish Experience”, CESIfo Dice Report 4/2008.
BENTOLILA, S., and J. F. JIMENO (2006). “Spanish Unemployment: The End of the Wild Ride?”, in M. Werding (ed.), Structural Unemployment in Western Europe: Reasons and Remedies, MIT Press.
BISHOP, J. (1997). “The effect of national standards and curriculum-based exams on achievement”, American Economic Review, 87 (2), Papers and Proceedings, pp. 260-264.
BLANCHARD, O. (2006). “European Unemployment: the Evolution of Facts and Ideas”, Economic Policy, January, pp. 5-59.
BLANCHARD, O., and F. GIAVAZZI (2003). “Macroeconomic Effects of Regulation and Deregulation”, Quarterly Journal of Economics, 118, pp. 879-907.
BLANCHARD, O., and J. WOLFERS (2000). “The Role of Shocks and Institutions in the Rise of European Unemployment: The Aggregate Evidence”, The Economic Journal, Vol. 110, No. 462.
BOISSIERE, M., J. KNIGHT and R. SABOT (1985). “Earnings, schooling, ability and cog-nitive skills”, American Economic Review, 75 (5), pp. 1016-1030.

Ageing and real convergence: challenges and proposals 269Ángel de la Fuente and Rafael Dom
énech
BOLDRIN, M., J. J. DOLADO, J. F. JIMENO and F. PERACCHI (1999). “The future of pension systems in Europe”, Economic Policy, 29.
BOSCÁ, J. E., R. DOMÉNECH and J. FERRI (2009). “Tax Reforms and Labour-market Performance: An Evaluation for Spain using REMS”, Moneda y Crédito, 228, pp. 145-196.
CARD, D., and A. KRUEGER (1996). “School resources and student outcomes: an over-view of the literature and new evidence from North and South Carolina”, Journal of Eco-nomic Perspectives, 10 (4), pp. 31-50.
CARD, D., and S. DE LA RICA (2006). “The Effect of Firm-Level Contracts on the Struc-ture of Wages: Evidence from Matched Employer-Employee Data”, Industrial & Labor Relations Review, 59 (4), Article 3.
CÍRCULO DE EMPRESARIOS (2006). Hacia un nuevo sistema educativo. Bases para la me-jora de la enseñanza obligatoria, Madrid.
CONDE-RUIZ, J. I., and J. ALONSO (2006). “El sistema de pensiones en España ante el reto del envejecimiento”, Presupuesto y Gasto Público, 44, pp. 51-73.
CONWAY, P., D. DE ROSA, G. NICOLETTI and F. STEINER (2006). Regulation, compe-tition, and productivity convergence, OECD Economics Department Working Paper No. 509.
CUNHA, F., J. HECKMAN, L. LOCHNER and D. MASTEROV (2005). Interpreting the evidence on lifecycle skill formation, NBER Working Paper No. 11331.
DA ROCHA, J. M., and F. X. LORES (2005). ¿Es urgente reformar la Seguridad Social?, mimeo, Universidad de Vigo.
DABÁN, T., R. DOMÉNECH and C. MOLINAS (1997). “International and intertemporal comparsisons of real product in OECD countries”, Review of Income and Wealth, 43 (1), pp. 33 48.
DE LA FUENTE, A. (2004). “Educación y crecimiento: un panorama”, Revista Asturiana de Economía, 31, pp. 7-49.
— (2006a). “La educación en las regiones españolas: algunas cifras preocupantes”, Presupuesto y Gasto Público, 44 (3), pp. 7-49.
— (2006b). “Education and economic growth: a quick review of the evidence and some pol-icy guidelines”, in Globalisation challenges for Europe, Prime Minister of Finland’s Office Publications 18/2006, Helsinki, pp. 195-212.
— (2009). A simple model for rough pension calculations, mimeo, Instituto de Análisis Económico (CSIC), Barcelona.
DE LA FUENTE, A., and A. CICCONE (2003). Human capital in a global and knowledge-based economy, DG for Employment and Social Affairs, Office for official publications of the European Communities, European Commission, Luxembourg.
DE LA FUENTE, A., and R. DOMÉNECH (2002). Human capital in growth regressions: how much difference does data quality make? An update and further results, CEPR Discus-sion Paper No. 3587.
— (2006a). “Human capital in growth regressions: how much difference does data quality make?”, Journal of the European Economic Association, 4 (1), pp. 1-36.
— (2006b). “Capital humano, crecimiento y desigualdad en las regiones españolas”, Moneda y Crédito, 222, pp. 13-56.
DE LA RICA, S., and A. IZA (2006). “Career Planning in Spain: Do Fix-term Contracts De-lay Marriage and Parenthood?”, in S. Gustafsson y A. Kalwij (eds.), Education and Postpone-ment of Maternity: Economic Analysis for Industrialized Countries, Springer-Verlag.
270 Spain and the euro. The fi rst ten years
DÍAZ GIMÉNEZ, J., and J. DÍAZ SAAVEDRA (2006). “The demografic and educational transitions and the sustainability of the Spanish public pension system”, Moneda y Crédito, 222, pp. 225-270.
— (2008). The Spanish public pension system: sustainability and reforms, mimeo, IESE Busi-ness School, Madrid.
DÍAZ SAAVEDRA, J. (2005). A parametric reform of the Spanish public pension system, mimeo, Universidad Carlos III.
DOLADO, J. J., and R. STUCCHI (2008). Do Temporary Contracts Affect Total Factor Produc-tivity?: Evidence from Spanish Manufacturing Firms, mimeo, Universidad Carlos III, Madrid.
DOMÉNECH, R. (2008). La evolución de la productividad en España y el capital humano, Documento de Trabajo No. 141/2008, Fundación Alternativas, Madrid.
DOMÉNECH, R., and A. MELGUIZO (2008). “Projecting pension expenditures in Spain: on uncertainty, communication and transparency”, forthcoming in D. Franco (ed.), Fiscal Sustainability: Analytical Developments and Emerging Policy Issues, Banca d’Italia, Rome.
EBELL, M., and CH. HAEFKE (2008). Product Market Deregulation and the U.S. Employ-ment Miracle, Economics Series 23, Institute for Advanced Studies, Vienna.
ECONOMIC POLICY COMMITTEE (2006). “The impact of aging on public expendi-ture projections for the EU25 Member States on pensions, health care, long-term care, education and unemployment transfers (2004-2050)”, European Economy, Special Report No. 1/2006.
— (2007). “Pension schemes and projection models in the EU-25 member states”, European Economy; Occasional Papers, No. 35.
ESTRADA, Á., and A. MELGUIZO (2008). Propuestas para la Reforma de la Negociación Colectiva, mimeo, Oficina Económica del Presidente del Gobierno.
EUROPEAN COMMISSION (2008). Annual macro-economic (AMECO) database, DG for Economic and Financial Affairs, http://ec.europa.eu/economy_finance/db_indicators/db_indicators8646_en.htm.
EUROSTAT (2008a). Eurostat database. Population and social conditions. Labour market. La-bour Force Survey, http://epp.eurostat.ec.europa.eu/portal/page?_pageid=1996,45323734&_dad=portal&_schema=PORTAL&screen=welcomeref&open=/data/popul/labour/employ/lfsq/lfsq_act&language=en&product=EU_MAIN_TREE&root=EU_MAIN_TREE&scrollto=400.
— (2008b). Eurostat database. Population and social conditions. Education and training, http://epp.eurostat.ec.europa.eu/portal/page?_pageid=1996,45323734&_dad=portal&_sch
ema=PORTAL&screen=welcomeref&open=/data/popul/edtr&language=en&product=EU_MAIN_TREE&root=EU_MAIN_TREE&scrollto=400.
FONSECA, R., P. LÓPEZ-GARCIA and C. PISSARIDES (2001). “Entrepreneurship, Start-up Costs and Unemployment”, European Economic Review, 45, pp. 692-705.
FUENTES, A. (2009). Raising Education Outcomes In Spain, Economics Department Work-ing Paper No. 666, OECD, Paris.
GARCÍA, J. R. (2009). Comparativa internacional del mecanismo de determinación salarial desde una perspectiva sectorial: ¿Importa el grado de centralización de la negociación colectiva?, mimeo, Servicio de Estudios, BBVA.
GIANELLA, CH., I. KOSKE, E. RUSTICELLI and O. CHATAL (2008). What Drives the NAIRU? Evidence from a Panel of OECD Countries, Economics Department Working Pa-pers, No. 649, OECD.

Ageing and real convergence: challenges and proposals 271Ángel de la Fuente and Rafael Dom
énech
GIL, J., M. A. LÓPEZ, J. ONRUBIA, C. PATXOT and G. SOUTO (2007). “A projec-tion model of the contributory pension expenditure of the Spanish Social Security sys-tem: 2004-2050”, Hacienda Pública Española/Revista de Economía Pública, 182 (3), pp. 75-114.
GOODMAN, A., and B. SIANESI (2005). “Early education and children’s outcomes: how long do the impacts last?”, Fiscal Studies 26 (4), pp. 513-548.
GUNDLACH, E., L. WÖESSMANN and J. GMELIN (2001). “The decline of schooling productivity in OECD countries”, Economic Journal, 111, pp. C135-147.
HANUSHEK, E. (1986). “The economics of schooling: production and efficiency in public schools”, Journal of Economic Literature, Vol. XXIV, pp. 1141-1177.
— (2003). “The failure of input-based schooling policies”, Economic Journal, 113, pp. F64-F98.
HANUSHEK, E., and M. RAYMOND (2003). “The effect of school accountability systems on the level and distribution of student achievement”, Journal of the European Economic Association, forthcoming.
HANUSHEK, E. A., and L. WOESSMANN (2008). “The Role of Cognitive Skills in Eco-nomic Development”, Journal of Economic Literature, 46 (3), pp. 607-668.
HECKMAN, J. (2000). “Policies to foster human capital”, Research in Economics, 54, pp. 3-56.
HERCE, J. A., and J. ALONSO (2000). La reforma de las pensiones ante la revisión del Pacto de Toledo, Colección Estudios Económicos, 19, Servicio de Estudios, La Caixa, Barcelona.
HERCE, J. A., V. PÉREZ DÍAZ et al. (1996). La reforma del sistema público de pensiones en España, Servicio de Estudios, La Caixa, Barcelona.
IMF (2003). “Unemployment and Labour Market Institutions: why Reforms Pay Off”, Chap. IV, World Economic Outlook.
INSTITUTO NACIONAL DE ESTADÍSTICA (2008a). Encuesta de Población Activa. En Base de datos electrónica INEbase. Sociedad. Mercado laboral. Madrid, http://www.ine.es/inebmenu/mnu_mercalab.htm.
— (2008b). Cifras de población y censos demográficos. En Base de datos electrónica INEbase. Demografía y población. Madrid, http://www.ine.es/inebmenu/mnu_cifraspob.htm.
— (2008c). Indicadores demográficos básicos. En Base de datos electrónica INEbase. Demografía y población. Análisis y estudios demográficos. Madrid, http://www.ine.es/inebmenu/mnu_analisis.htm.
— (2008d). Contabilidad Nacional de España. En Base de datos electrónica INEbase. Economía: Cuentas Económicas. Madrid, http://www.ine.es/inebmenu/mnu_cuentas.htm.
INSTITUTO NACIONAL DE LA SEGURIDAD SOCIAL (varios años). Informe Estadís-tico del INSS, http://www.seg-social.es/Internet_1/Estadistica/Documentacion/Memori-as/index.htm.
JIMENO, J. F. (2000). El sistema de pensiones contributivas en España: cuestiones básicas y per-spectivas en el medio plazo, CREI, Barcelona.
— (2008). “Mercado de Trabajo”, in Juan Velarde and J. M. Serrano (eds.), La Economía, Vol. 3, in the collection España Siglo XXI, edited by Salustiano del Campo and José Felix Tezanos.
JIMENO, J. F., and O. LICANDRO (1999). “La tasa interna de rentabilidad y el equilibrio financiero del sistema español de pensiones de jubilación”, Investigaciones Económicas, Vol. XXIII (1), pp. 129 143.

272 Spain and the euro. The fi rst ten years
JIMENO, J. F., J. A. ROJAS and S. PUENTE (2008). “Modelling the impact of aging on social security expenditures”, Economic Modelling, 25, pp. 201 224.
KRUEGER, A. (2002). “Understanding the magnitude and effects of class size on student achievement”, in L. Mishel and R. Rothstein (eds.), The Class Size Debate, Economic Policy Institute, Washington DC, pp. 7-35.
LADD, H., and R. WALSH (2002). “Implementing value-added measures of school effec-tiveness: getting the incentives right”, Economics of Education Review, 21, pp. 1 17.
LAYARD, R., S. NICKELL and R. JACKMAN (2005). Unemployment: Macroeconomic Per-formance and the Labour Market, 2nd edition, Oxford University Press.
MCINTOSH, S., and A. VIGNOLES (2001). “Measuring and assessing the impact of basic skills on labour market outcomes”, Oxford Economic Papers, 3, pp. 453-481.
MINISTERIO DE LA PRESIDENCIA (2005). Convergencia y empleo. Programa Nacional de Reformas de España, Secretaría General Técnica, Madrid.
— (varios años). Programa Nacional de Reformas de España. Informe Anual de Progreso (años 2006 a 2008), Secretaría General Técnica, Madrid.
MINISTERIO DE TRABAJO E INMIGRACIÓN (2008a). MTIN website: Estadísticas: Principales Series. Pensiones contributivas del sistema de la Seguridad Social. Pensiones en vigor por clase de pensión, http://www.mtin.es/simbad/Simbad.
— (2008b). Boletín de Estadísticas Laborales. Protección Social: Pensiones contributivas del Sistema de la Seguridad Social: Pensiones e importe medio según clase, http://www.mtin.es/estadisticas/bel/index.htm.
— (2008c). Estrategia nacional de pensiones, Madrid.— (2008d). Proyecto de Presupuestos de la Seguridad Social, ejercicio 2009. Informe
Económico Financiero y Anexo al Informe Económico-Financiero, Secretaría de Estado de la Seguridad Social, Madrid, http://www.seg-social.es/Internet_1/Estadistica/Presupuesto-syEstudi47977/ Presupuestos/PresupuestosdelaSeguridadSocial2009/Informacioncomple-mentaria/index.htm.
MINISTERIO DE TRABAJO Y SEGURIDAD SOCIAL (1995). La Seguridad Social en el umbral del siglo XXI, Madrid.
MONTERO, M. (2000). “Estructura demográfica y sistemas de pensiones. Un análisis de equilibrio general aplicado a la economía española”, Investigaciones Económicas, 24 (2).
MORAL-ARCE, I., C. PATXOT and G. SOUTO (2008). “La sostenibilidad del sistema de pensiones. Una aproximación a partir de la MCVL”, Revista de Economía Aplicada, XVI (E1), pp. 29-66.
NICKELL, S. (2006). “Work and Taxes”, in J. Agell and P. B. Sorensen (eds.), Tax Policy and Labour Market Performance, MIT Press.
NICKELL, S., L. NUNZIATA and W. OCHEL (2005). “Unemployment in the OECD since the 1960s. What do we know?”, The Economic Journal, 115, pp. 1-27.
OECD (2006). “Boosting Jobs and Incomes”, Special Issue, OECD Employment Outlook, Paris.
— (2007a). Pisa 2006: Science Competencies for Tomorrow’s World, Paris.— (2007b). Pensions at a Glance. Public policies across OECD countries, Paris.— (2008a). Education at a Glance 2008. OECD indicators, Paris.— (2008b). Going for Growth, Paris.PAGÁN, R., and N. SÁNCHEZ-SÁNCHEZ (2008). “Diferencias Salariales y Presencia Sin-
dical en la Empresa Española”, Estadística Española, 50 (168), pp. 361-391.

Ageing and real convergence: challenges and proposals 273Ángel de la Fuente and Rafael Dom
énech
ROJAS, J. (1999). “El sistema de pensiones y las proyecciones de población: una evaluación cuantitativa”, Cuadernos Económicos de ICE, 65, pp. 117-132.
SCHUETZ, G., H. URSPRUNG and L. WÖESSMANN (2005). Education policy and equality of opportunity, CESIfo Working Paper No. 1518.
SOUTO, G., and C. PATXOT (2007). Proyección del gasto en pensiones a partir de la MCVL: Una primera aproximación, mimeo.
THOMAS, A. (2002). The costs and benefits of various wage bargaining structures: an empiri-cal exploration, IMF Working Paper WP/02/71, Washington DC.
WÖESSMANN, L. (2003). “Schooling resources, educational institutions and student per-formance: the international evidence”, Oxford Bulletin of Economics and Statistics, 65 (2), pp. 117-170.
— (2005). “Educational production in Europe”, Economic Policy, July, pp. 447-504.WÖESSMANN, L., and G. SCHÜTZ (2006). Efficiency and equity in European education
and training systems, mimeo, CESIfo, Munich.WÖLFL, A., I. WANNER, T. KOZLUK and G. NICOLETTI (2009). Product Market Reg-
ulation in OECD Countries 1998-2008, forthcoming as OECD Economics Department Working Paper, Paris.


Juan J. Dolado1
Universidad Carlos III & CEPR
Comments on “Ageing and real convergence: challenges and proposals”
The excellent quality of the paper by Angel de la Fuente and Rafael Doménech is as to be expected given their high international academic stand-
ing. Using precise analytical tools to interpret the socio-economic evidence accu-mulated since Spain’s return to democracy, the authors offer an accurate diagnosis of the pending problems of the Spanish economy – deepened by the current eco-nomic and financial crisis – and put forward a series of reform proposals aimed at overcoming these difficulties.
The core of the paper analyses how the developments of the components of four basic economic identities can help explain the differential between the val-ues of certain key macro magnitudes in the case of Spain and the average for the OECD’s more developed countries. These variables are: (i) per capita income, as a variable approximating welfare levels; (ii) the employment rate, as an indicator of the development of the labour market; (iii) labour productivity, as a decisive factor in medium and long-term economic growth; and, (iv) pension expenditure as a share of GDP, as a factor underlying the sustainability of our system of intergen-erational transfers.
Denoting as %x the percentage differential of the level of variable x with respect to the average level of this variable in the developed countries, in case (i), the fol-lowing breakdown of per capita income is proposed:
PopWAP
%WAPNh
%NhY
%PopY
%
where Y = GDP, Pop = total population, N = employment, h = hours of work, and WAP = the working age population. The key finding of this breakdown is that,
1 This note has been translated from Spanish by Ducan Gilson.

276 Spain and the euro. The fi rst ten years
starting from a differential of -20 percentage points (p.p.) in 1975, worsening to -35 p.p. in 1985 in the wake of the oil crisis and the subsequent process of reindustrialisation, the long phase of strong growth experienced since the mid-nineties, right up until 2007, only enabled the Spanish economy to return to the starting point of -20 p.p. The improvements in terms of the better functioning of the labour market, captured by the employment rate (%Nh/WAP), and more favourable demography (%Nh/Pop), have been offset by very poor progress on productivity (%Y/Nh).
In case (ii), the employment rate is broken down as follows:
h%LN
%WAP
L%
WAPNh
%
where L = the active population. The key result is that the success of the long employment-creation phase running from the end of the nineties was not suf-ficient to compensate for the destruction of employment caused by the reces-sions in the eighties and early nineties (differentials of -33 p.p. and -27 p.p., respectively). Thus, the negative differential in the employment rate in 2007 (-8 p.p.) was worse than in 1975 (2 p.p.). This is due to the fact that both the activity rate (L/WAP), employment rate (N/L) and variation in the number of hours worked (h) have not yet reached the level existing in the group of refer-ence countries.
As regards (iii), labour productivity can be broken down as follows:
NhH
%NhK
%A%NhY
% HK
where A = Total Factor Productivity (TFP), K/Nh = per capita physical capital, H/Nh = per capita human capital, k = share of physical capital in income, and h = share of human capital in income. Again, the differential in productivity per hour worked varied between 1975 (-15 p.p.) and 2007 (-13 p.p.). The reason this time is that the poor progress of TFP has offset the substantial progress made in investments in both types of capital between 1985 and 2007. The substan-tial relative fall in TFP is a reflection of the strong specialisation of the Spanish economy, since the mid-nineties, in sectors with limited value added (residential construction and services) as a consequence of the relative abundance of poorly qualified human capital, resulting from an inefficient educational system, and the sharp increase in immigration, in response to the rigidities in Spain’s domestic labour market.

Comments on “Ageing and real convergence” 277Juan J. Dolado
Finally, in the case of (iv), expenditure on pensions as a share of GDP (this time in absolute terms, i.e. without comparing with the reference countries) can be expressed as follows:
PETN
%PET
Pop%
N/Yp
%Pop
P%
YpP
% 65
65
where p = average pension, P = number of pensioners, Pop>65 = population aged over 65. Using long-term projections of the coverage ratio (P/Pop>65), the gener-osity of the pension system [p/(Y/N)], the dependency ratio (Pop>65/WAP) and the employment rate (N/WAP). The basic finding is that the current pension sys-tem (unfunded) will go into deficit between 2024 and 2044, depending on the degree of optimism or pessimism of the scenarios envisaged in these projections and the size of the accumulated reserve fund during this period.
In short, the authors perform an excellent diagnosis of the challenges facing the Spanish economy, while listing a series of proposed reforms to the labour market, and education and pension systems. It is in this section where perhaps the sole weakness of the work resides, as although the nature of the changes nec-essary is crystal clear, the lessons to be drawn from economic policy about how to implement these reforms in practice are ignored. Indeed, the paper ends by stating “...neither our recommendations nor the analysis on which they are based are particularly new... the hope is that, by dint of constant repetition the message sinks in ... and encourages the adoption of the necessary measures.” In my view, the gen-eral proposals made represent too weak a strategy to bring them to a successful conclusion. Instead of the usual mantra (“structural reform”, “flexibility”, “effi-ciency”, “a new productive model”, etc.), which often emanates from institutions which themselves have extremely rigid employment regulations (such as the WB, IMF, central banks, and even universities, whose professors, such as myself, enjoy civil servant status), we need more specific proposals that are accompanied by a careful analysis of their political feasibility. This requires the identification of the groups that will be the winners and losers of the reforms, and the design of pro-cedures whereby the winners compensate the losers. If this is not done, reforms which would benefit society as a whole will be blocked by those in favour of the status quo.
To give an example of how political economy is extremely important to the credibility of the reforms, I will conclude by mentioning three specific illustrations which concern the reform of labour, education and goods and services markets:
– Any attempt to end the persistent duality of our labour market, which divides workers into those who are protected (i.e. have an indefinite con-

278 Spain and the euro. The fi rst ten years
tract) and those whose jobs are insecure (i.e. are on temporary contracts), needs to bear in mind the trade unions’ potential electorate. Let’s sup-pose that this electorate is made up of both all those in employment and the unemployed. Specific reforms, such as those recently proposed by a group of one hundred academic economists (Propuesta para la Reacti-vación Laboral en España),2 which advocates replacing the tangle of ex-isting contracts with a single contract (that narrows the gap in severance pay between those on permanent contracts and those on temporary ones, while maintaining the current average level of protection) run counter to the interests of workers entitled to redundancy pay of 45 days salary per year of service, as they are the only ones who, in the short term, would lose out from the new contract. The rest of the potential electorate – i.e. employees on permanent contracts with 33 days redundancy pay per year of service, workers on temporary contracts and the unemployed – ought to be in favour. With a single contract, their protection against the risk of dismissal would improve and the likelihood of their obtaining a sta-ble job with occupational training and consequently, improvements in productivity, would increase. Therefore, according the latest EPA figures (2009 Q3), the number of employees on permanent contracts stands at 11.60 million, of whom 90% (10.44 million) have contracts giving them 45 days severance pay per year of service. Given that temporary workers and the unemployed account for 4.05 and 4.12 m, respectively, this means that collectively the negatively affected workers account for 52.8% of the electorate, so the average voter would be against this type of reform. On the other hand, if the number of the unemployed rises to 4.4 million in 2010 and the number of employees drops to 15.2 million, it would be enough for the rate of temporary jobs to exceed 28% for the percentage resisting the re-form to drop below 50%. This phenomenon occurred in the mid-nineties, giving rise to the reform in 1997 whereby, for the first time, the unions endorsed a cut in the cost of redundancy for those on permanent contracts, although restricting elegibility only for certain groups. This simple calcula-tion suggests that it is likely that sensible reform of employment protection will not take long in being accepted by social actors.
– Education reform, as the authors suggest, needs to involve a transfer of funds from our inefficient and oversized higher education system (Spain has as many university students as countries with a much larger population, such as Germany or France) to the public secondary education and voca-tional training system, a stage of education in which Spain has a significant deficit with respect to more developed countries, as a result of an unsus-
2 http://www.crisis09.es/economialaboral.

Comments on “Ageing and real convergence” 279Juan J. Dolado
tainable educational dropout rate (30%). With a funding system that places more weight (between 70% and 80%) on teaching than research, the ra-tional incentives for Spanish universities are to have lots of students study-ing for as long as possible (consequently the penalty for repeating a year is minimal and the percentage of students who give up their studies several years after starting is high). A good indicator of this is the fact that of the 49 countries that have signed the Bologna agreement on the standardisation of university degrees, Spain is one of the few that have kept the duration of the new degrees at 4 years rather than 3 (typical of the Anglo-American sys-tem) opted for by the majority of the signatories. Until the funding system changes to allow universities greater freedom to set fees according to their prestige, the number of universities is reduced by merging them, the system of governance is changed, and university lecturers no longer hold civil serv-ant status, the quality of the education system will remain one of the main obstacles to achieving healthy and sustainable growth in the future. This type of reform, which might look like a pipedream, has recently happened in Finland,3 a country which has gone from being a producer of wood pulp to one of the world’s leaders in the development of new technologies (ICTs) through substantial changes in the quality of its educational system, borne out by its sustained leadership in international comparisons such as PISA and TIMMS.
– A lot has been said about labour market reforms, but relatively little about reforms to increase the competitiveness of the market for goods and serv-ices. However, elementary reasoning in political economy would tell us that this reform should come before labour reform in order to achieve greater support for both.4 Indeed, greater competitiveness would reduce price/cost margins, boosting workers’ purchasing power by increasing real sala-ries. Given that the working class makes up the lion’s share of the political electorate, this reform would meet with relatively little resistance. Greater competitiveness would require greater capacity for occupational/functional/geographic reallocation of workers, but workers would offer less resistance if they had seen their real salaries grow beforehand. By contrast, putting la-bour reform first will probably entail downward wage adjustments in the short term, which will tend to block its implementation.
3 http://www.minedu.fi/OPM/Tiedotteet/2009/06/Yliopistolaki.html?lang=en.4 See, Blanchard, O. and F. Giavazzi (2003), “The Macroeconomic Effects of Regulation and Deregula-tion in Goods and Labor Markets”, Quarterly Journal of Economics, 118, 879-909.


Ángel Ubide1
Tudor Investment
Comments on “Ageing and real convergence: challenges and proposals”
First of all I would like to thank the organisers for their invitation to take part in this interesting event to commemorate the tenth anniversary of the
creation of the euro. This excellent paper offers a critical diagnosis, indeed an au-dit, of the growth of the Spanish economy, which is of interest not just from the academic point of view, but as its calculations include quantitative measures read-ily comprehensible to the average citizen and the political class, it should become an essential part of the debate on Spain’s economic future. For a variety of reasons Spain lacks the volume and quality of independent economic debate enjoyed by other OECD countries, and this lack of debate, or tendency for the debate to rapidly turn political, is an obstacle to an objective and dispassionate analysis of Spain’s problems. This paper is an excellent contribution to progress towards this sought-after analysis.
The credit crisis of 2007-2009 has shown that even the apparently improbable is possible. So, from the point of view of economic policy we have to hope for the best, but prepare ourselves for the worst. Spain’s economic development over the last decade has been extraordinary, with a rapid increase in growth and employ-ment which has facilitated swift convergence towards the European average. Im-portantly, however, this paper draws attention to the pattern of growth in Spain, looking beyond the stereotypical view of the excessive weight of the property sec-tor in that growth.
Indeed, the main message of this paper is that, “in terms of its level of income per capita within the group of most advanced economies, Spain is today in exactly the same position as it was in 1975: twenty percentage points below the OECD average. The long period of expansion, which, with its ups and downs, we have enjoyed since 1985, has done no more than recover the ground lost during the
1 This note has been translated from Spanish by Ducan Gilson.

282 Spain and the euro. The fi rst ten years
profound crisis between the years cited.” The paper points to improving produc-tivity, reforming the labour market and resolving the problems associated with the difficult Spanish demographic profile (pensions, health, dependency) as the priority areas for action.
More specifically, the paper recommends a series of urgent reforms: improv-ing the stability of the education system; reducing the high educational failure rate; reforming collective bargaining; speeding up progress towards the crea-tion of a single employment contract with a view to ameliorating the Spanish economy’s serious problem of labour-market insiders and outsiders; boosting competition in product and services markets; improving the internal market; making geographical mobility more flexible; and reducing the generosity and duration of pensions. It is a direct and blunt message which, unfortunately, has to a large extent been said before: it is basically the same message that econo-mists, whether working for bodies such as the IMF or OECD, or independ-ently, have been transmitting to successive Spanish governments for over a dec-ade, which leads us to wonder whether Spain might not have a fundamental economic-policy problem which prevents it from undertaking the necessary reforms.
In the remainder of this short discussion we will draw on some of the paper’s results to highlight and emphasise some of the pending issues facing the Spanish economy.
1 A serious structural problem
Spain is a country of records. On the positive side, it has sustained very high growth and job-creation rates for over a decade. On the negative side, Spain presents various features that are worrying from a structural point of view:
1 For over twenty years it has gradually been losing relative productivity, and is currently running the world’s biggest current account deficit (in dollar terms) after the US.
2 Despite (or because of ) the employment boom in recent decades, Spain is suffering extreme distortions in its labour market and a serious insider-outsider problem. The degree of rigidity of real wages is the greatest in the euro zone, the rate of temporary work is by far the highest in the OECD, and the rigidity of the labour market institutions is less only than that of those in Portugal.
3 The performance of the educational system is also somewhat disappoint-ing, as was highlighted by the recent PISA report. Moreover, Spain has the OECD’s highest percentage of pupils who repeat a year.

Comments on “Ageing and real convergence” 283Ángel Ubide
What is the message we can derive from this minimalist collection of generic facts? A reasonable hypothesis would be that Spain’s rapid growth over the last few decades was based on a highly unstable structure, masked by rapid credit growth enabled by real interest rates that were zero or even negative, leveraged by a banking system that enjoyed abundant finance from abroad. An expansion in credit at rates of 25 per cent a year, combined with the increasing popularity of homes as an investment asset, permitting their use as collateral, generated a rapid positive financial accelerator. The behaviour of certain Spanish economic actors in recent years, using urban collateral to obtain leverage and grow on the basis of business takeovers, gives plausibility to this hypothesis.
One of the paper’s conclusions is that, examining the progress of relative per capita income and its components, Spain’s economy is in a similar situation to that of 1975 (see Box 1 of the paper). Spain’s per capita income in 2007 was twenty percent lower than the OECD average, itself an improvement on 1985 levels, when it was 35 percent lower. However, the “quality” of the components was probably worse than in 1975, as whereas in 2007 the demographic differen-tial had improved (due to a rapid but unsustainable migratory flow), the labour market component (hours worked per person) had deteriorated significantly. Strikingly, the productivity component was similar to that in 1975, but had de-teriorated rapidly since 1995. It is not, therefore, clear that the situation was the same as that in 1975. It could be argued that it was qualitatively worse – for example, Box 1 shows that the income per person of working age was 21 per-cent lower than the OECD average, compared with 13 percent in 1975. In other words, Spain enjoyed a probably unrepeatable period of favourable conditions for economic growth (zero real interest rates, integration with Europe, a positive technology shock from the technologies, and globalisation) which has only served to return it, with some reservations, to the relative position it held in 1975.
2 One remedy for two problems?
The paper highlights two of the Spanish economy’s fundamental problems:
1 The absolute need to increase female employment as the key to increasing occupation – as male employment in Spain is already at levels similar to or above those of the OECD.
2 The absolute need to improve the performance of the education system (which is very negative in comparative terms according to the latest PISA report, which places Spain in 43rd place in reading and 40th in mathemat-ics). In both cases, one of the actions recommended by the authors, and which we would like to emphasise in this discussion, is reinforcing teach-

284 Spain and the euro. The fi rst ten years
ing at early ages. Expanding the number of public child-care places is one of the most efficient ways of assigning public expenditure on education, as it offers the best relative returns and in many cases is self-financing over the long term [see the analysis in Dickens and Baschnagel (2008)]. Moreo-ver, it makes it easier for women to join the workforce. It is therefore to be applauded that it is one of the priorities of the National Reform Plan (PNR in its Spanish initials).
As well as an increase in public investment in pre-school child-care there needs to be an increase in the total amount of teaching. From both the abso-lute and relative point of view, the empirical evidence shows that success or failure at school does not depend only on what is learned at school but also on what is “unlearned” during the long holiday periods. Using standardised tests before and after the holidays, Alexander, Entwisle and Olson (2001) have pro-duced evidence that pupils from higher socio-economic strata continue to learn outside the classroom whereas those from lower strata do not. This difference in school performance may either be because of the level of educational attain-ment of the pupils’ families or the extent to which their purchasing power al-lows them to pay for out-of-school activities. A recent study [Dobbie and Fryer (2009)] on schools in the Harlem district of New York shows a significant re-duction in the interracial differential in schools in the Harlem Children’s Zone system, where as a part of an experimental programme pupils have up to twice the normal number of lessons a week. These are important factors to consider in a country like Spain, with rapid migratory flows concentrated in the segrega-tion-prone lower socio-economic strata of the population. Therefore, expand-ing out-of-school educational offerings and extending the teaching year (which in Spain totals just 175 days, compared with 240 days in Japan, for instance), would be measures that improve educational performance and facilitate wom-en’s inclusion in the workforce.
3 Dialectic between economic growth and regional development
Although the authors did not set out to highlight this as a problem, at several points in the paper Spain’s regional structure emerges as a factor in explaining some of its economy’s structural difficulties. One of the most significant aspects is the impact of regional development on the creation of a single market for goods. In fact, the development of the regions has represented an obstacle to the crea-tion of a single market and has taken Spain in the opposite direction to Europe. According to a study by the Spanish Competition Court, the majority of regions

Comments on “Ageing and real convergence” 285Ángel Ubide
did not have barriers to trade in 1996, but 14 out of the 17 have implemented them since then (Tribunal de Defensa de la Competencia, 2003). Hoffmaister’s econometric results (2006) suggest that this raising of barriers to trade would ex-plain 4/5 of Spain’s inflation since 1996. In a context in which Spain is rapidly losing international competitiveness due to its high relative rate of inflation, this is a finding that needs to be looked at in more detail.
It is not difficult to continue with this line of argument and uncover other areas in which the development of Spain’s autonomous regions represents a struc-tural obstacle to growth. For example:
1 It creates a significant obstacle to geographical mobility through the rais-ing of the linguistic barriers in certain regions, contributing to NAIRU’s resistance to downward pressure.
2 Linguistic diversity compartmentalises education excessively, preventing, for example, the implementation of a programme of standard tests with which to compare results and assign resources on the basis of efficiency – and it perhaps explains the very low scores for reading obtained in the PISA test.
3 It makes efficient consolidation of the banking system difficult – for exam-ple through savings-bank mergers – and it raises widespread doubts about the governance of some of these institutions.
4 With 75 percent of public spending at regional level, it may make the fis-cal retrenchment necessary in the wake of the crisis more difficult.
This list of arguments suggests that it will be necessary to prepare an economic study of the economic costs of the model of development of the autonomous regions in Spain. Federalism is not negative per se, in fact, if well designed, it can contribute to experimentation and to improving economic policies – that is, for example, the approach used in China, where certain regions experiment with different policies and then those that are most successful are applied nationally. Spain’s problem seems to arise from a system of incentives that encourages dupli-cation, the inefficient allocation of public spending, and regional protectionism.
4 What is the potential impact of the crisis overthe long term?
One of the enigmas of how Spain’s economy has evolved is the definition of its potential growth. With an average growth rate over the last decade of close to 3 per cent, it is tempting to assume that this is the trend rate. But the diagnosis the paper gives of the structural problems, in particular productivity and labour-

286 Spain and the euro. The fi rst ten years
market problems, together with the rapid economic deterioration over the last year, make a much less positive outlook more likely.
The drastic deterioration of the tax situation implies that it will be difficult to adopt reforms which, although necessary, require an initial fiscal cost, such as, for example, taking steps towards establishing a flexi-security system. Moreover, the rapid rise in unemployment in a context in which the labour market is still rigid should sound alarm bells about the possible return of hysteresis, which would convert a large share of cyclical unemployment into structural unemployment, thereby prolonging the effects of the crisis. In conjunction with a possible re-turn to the demographic trends prevailing prior to the property bubble – and therefore to slower population growth – this makes Spain’s growth prospects look much less positive. From the cyclical point of view, the model of the last decade, based on the leveraging of companies and families, will be difficult to replicate, above all due to the expected toughening of financial regulation and supervision. In this context, we need to think about what the growth profile of the Spanish economy would be with a global financial system whose leveraging is limited to a factor of 20, which is what the intention of the international supervisory com-munity seems to be. Following the crisis of the 1970s in Spain, it took longer than a decade to recover the rate of growth and robust job creation. In view of the structural problems highlighted in the paper, it is necessary to consider the consequences of a repetition of this scenario.
The prospect of a “lost decade” could put in doubt the capacity of the Spanish economy to undertake the necessary structural reforms. In this case the underly-ing scenario used by the authors to simulate the different pension system scenar-ios would be optimistic, as it assumes that the employment rate of the Spanish labour force will converge with the male employment rate. However, this con-vergence would require reforms that were not undertaken when the economic scenario was more buoyant. It cannot, therefore, be considered sufficiently cer-tain that they will be achieved in the present climate for them to form part of the baseline scenario. This hypothesis would further underscore the absolute need to redefine the parameters of the Spanish pension system without delay in order to guarantee its long-term solvency.
5 Conclusion
To conclude, this is an important paper which quantifies the multiple struc-tural problems of the Spanish economy. The paper demonstrates the need to raise awareness among the general public, politicians and social actors as to the ur-gent need to undertake profound reforms. It is therefore absolutely necessary that the debate be depoliticised and that it move into the public arena. Only in this

Comments on “Ageing and real convergence” 287Ángel Ubide
way, by explaining the structural weaknesses of the Spanish economy, will it be possible to start to give priority to intergenerational justice – social actors over-represent insiders and under-represent outsiders (the young), thus perpetuating the rigidities. As the authors say, the government’s current policy of only under-taking reforms that are backed by the social actors is an error and the necessary reforms need to be carried out even without their agreement. We should not for-get that some of the biggest mistakes in economic policy have their origins in putting politics before policy (for example, the “lost decade” in Japan, where the political needs of the governing party dictated the successive fiscal packages and delayed decisive intervention in the financial sector; or the property expansion in the US encouraged by the growth of Fannie Mae and Freddie Mac, with political support from both parties). The conclusion is therefore, that Spain should leave its myopic short-term political cycle behind and prepare for a possible repetition of the 1970-80s by creating, if necessary, an independent bipartisan commission on economic reform.

288 Spain and the euro. The fi rst ten years
References
ALEXANDER K. J., R. ENTWISLE and L. OLSON (2001). “Schools, achievement, and inequality: a seasonal perspective”, Educational Evaluation and Policy Analysis, 23 (2), pp. 171-191.
DICKENS, W., and CH. BASCHNAGEL (2008). Dynamic Estimates of the Fiscal Effects of Investing in High-Quality Pre-Kindergarten Programs, mimeo, University of Maryland and the Brookings Institution.
DOBBIE, W., and R. FRYER (2009). Are high quality schools enough to close the achievement gap? Evidence from a bold social experiment in Harlem, mimeo, Harvard University.
HOFFMAISTER, A. (2006). “Barriers to Retail Competition and Prices: Evidence from Spain”, IMF WP 06/231.
TRIBUNAL DE DEFENSA DE LA COMPETENCIA (2003). “Informe Sobre las Condi-ciones de Competencia en el Sector de la Distribución Comercial”, I 100/02, TDC, Madrid.