Space Weather - University of California, Berkeley
44
i space weather National Aeronautics and Space Administration Space Weather grades 9-14
Transcript of Space Weather - University of California, Berkeley

ispace weather
National Aeronautics and Space Administration
Spa
ce W
eath
ergr
ades
9-1
4


iiispace weather
This teacher’s guide is designed to support a multi-year investigation of Earth’s mag-netic field using the magnetometer network and resources of NASA’s THEMIS (Time History of Events and Macroscale Interactions during Substorms) satel-lite mission education program. The education program’s web site can be found at http://ds9.ssl.berkeley.edu/themis/. One particular THEMIS education program, the Geomag-netic Event Observation Network by Students (GEONS), aims to bring magnetometer data to high school classrooms. These guides support that effort.
The activities were designed in partnership with the IMAGE (Imager for Magnetopause-to- Aurora Global Exploration) satellite’s education program (http://image.gsfc.nasa.gov/poetry) and the many activities developed for that mission in the exploration of the magnetosphere. The FAST (Fast Auroral Snapshot) education program also contributed to this effort (http://cse.ssl.berkeley.edu/fast_epo).
Authors:
Dr. Sten Odenwald - THEMIS E/PO (education and public outreach) Specialist at Astronomy Café
Dr. Laura Peticolas - Co-Director, THEMIS E/PO
Dr. Nahide Craig - Director, THEMIS E/PO
Teacher input and testing:
Laura Barber, Cris DeWolf, Wendy Esch, Sean Estill, Wendell Gehman, Keith Little, Terry Parent, Victor Trautman, and Holly Wyllie
Scientist/Engineer input and testing:
Dr. Vassilis Angelopoulos - THEMIS Principal Investigator (PI)
Dr. Chris Russell - E/PO Science Advisor
Editorial/Layout assistance:
Karin Hauck

ivspace weather
Contents
National Science Education Standards ........................................................................................v
National Math Education Standards ........................................................................................ vii
Introduction ............................................................................................................................. viii
Activity 9: The Magnetosphere ....................................................................................................1
Students search for the basic terms, locations, and properties of Earth’s magnetic field in space.
Activity 10: The Sun-Earth Connection ......................................................................................5
A lecture and student reading to learn about the ways in which the Sun affects Earth’s magnetic field and how the terms in Activity 9 are related.
Activity 11: A Review of Time Zone Mathematics .....................................................................9 Students learn about time zones.
Activity 12: Universal Time .......................................................................................................13
Students learn about Universal Time in the context of observing solar flares.
Activity 13: The Aurora: A Critical Look at Phenomenology ...................................................18
Students will study aurora pictures and learn the correct scientific terms for their various forms, and the physical basis for their evolution
Activity 14: Magnetic Storms .....................................................................................................28 The strength of Earth’s magnetic field can suddenly change over the course of minutes and hours. These “magnetic storms” were discovered in 1741, and have been studied by scientists ever since.
Web Resources Related to Space Weather ..................................................................................34

National Science Education StandardsStandards Key
M - major emphasism - minor emphasisi - indirect; i.e., not directly tied to standard, but important background information.
The letters A-G represent various areas in the National Science Education Standards, as follows: A - Science as Inquiry B - Physical Science: Motion and Forces C - Life Science D - Earth and Space Science
Activity A B D E F G Emphasis9 - The Sun Earth Con-nection
m M
M
M
m M M m
M
A: Identify questions and concepts that guide scientific investigations. B: (Structure of Atoms). Matter is made of minute particles called atoms, and atoms are composed of even smaller components.These components have measurable properties, such as mass and electri-cal charge. Each atom has a positively charged nucleus surrounded by negatively charged electrons. B: (Forces and Motion). Electricity and magnetism are two aspects of a single electromagnetic force. Moving electric charges produce magnetic forces, and moving magnets produce electric forces. B: (Interactions of Energy and Matter). Electromagnetic waves include radio waves (the longest wavelength), microwaves, infrared radiation (radiant heat), visible light, ultraviolet radiation, x-rays, and gamma rays. D: Stars produce energy from nuclear reactions, primarily the fusion of hydrogen to form helium. E: (Understanding About Science and Technology). Science often advances with the introduction of new technologies. Solv-ing technological problems often results in new scientific knowledge. New technologies often extend the current levels of scientific understanding and introduce new areas of research. F: (Natural and human-induced hazards). Natural and human-induced hazards present the need for humans to assess potential danger and risk. G: (Science as a Human Endeavor) Individu-als and teams have contributed and will continue to contribute to the scientific enterprise. G: (Nature of Scientific Knowledge) Because all scientific ideas depend on experimental and observational confirmation, all scientific knowledge is, in principle, subject to change as new evidence becomes available.
10 - The Mag-neto-sphere
M
M
m
m M m
M
B: (Structure of Atoms). Matter is made of minute particles called atoms, and atoms are com-posed of even smaller components. These components have measurable properties, such as mass and electrical charge. Each atom has a positively charged nucleus surrounded by nega-tively charged electrons. B: (Forces and Motion). Electricity and magnetism are two aspects of a single electromagnetic force. Moving electric charges produce magnetic forces, and moving magnets produce electric forces. B: (Interactions of Energy and Matter). Each kind of atom or molecule can gain or lose energy only in particular discrete amounts and thus can absorb and emit light only at wavelengths corresponding to these amounts. These wavelengths can be used to identify the substance. D: Stars produce energy from nuclear reactions, primarily the fusion of hydrogen to form helium. E: (Understanding About Science and Technology). Science often advances with the introduction of new technologies. Solving technological problems often results in new scientific knowledge. New technologies often extend the current levels of scien-tific understanding and introduce new areas of research. G: (Science as a Human Endeavor) Individuals and teams have contributed and will continue to contribute to the scientific enter-prise. G: (Nature of Scientific Knowledge) Because all scientific ideas depend on experimental and observational confirmation, all scientific knowledge is, in principle, subject to change as new evidence becomes available.
E - Science and Technology F - Science in Personal and Social Perspectives G - History and Nature of Science
continued on next page

Activity A B D E F G Emphasis
12 - Univ.Time
i m G: (Science as a Human Endeavor) Individuals and teams have contributed and will continue to contribute to the scientific enterprise.
13 - The Aurora
m M
M
M
i m m A: Identify questions and concepts that guide scientific investigations. B: (Structure of Atoms). Matter is made of minute particles called atoms, and atoms are composed of even smaller components. These components have measurable properties, such as mass and electri-cal charge. Each atom has a positively charged nucleus surrounded by negatively charged electrons. B: (Forces and Motion). Electricity and magnetism are two aspects of a single electromagnetic force. Moving electric charges produce magnetic forces, and moving magnets produce electric forces. B: (Interactions of Energy and Matter). Each kind of atom or molecule can gain or lose energy only in particular discrete amounts and thus can absorb and emit light only at wavelengths corresponding to these amounts. These wavelengths can be used to iden-tify the substance. E: (Understanding About Science and Technology). Science often advances with the introduction of new technologies. Solving technological problems often results in new scientific knowledge. New technologies often extend the current levels of scientific under-standing and introduce new areas of research. G: (Historical Perspectives) In history, diverse cultures have contributed scientific knowledge and technologic inventions.
14 - Mag-netic Storms
M m i M m A: Design and conduct scientific investigation; Use technology and mathematics to improve investigations and communications. B: (Forces and Motion). Electricity and magnetism are two aspects of a single electromagnetic force. Moving electric charges produce magnetic forces, and moving magnets produce electric forces. E: (Understanding About Science and Technol-ogy). Science often advances with the introduction of new technologies. Solving technological problems often results in new scientific knowledge. New technologies often extend the current levels of scientific understanding and introduce new areas of research. G: (Nature of Scientific Knowledge) Because all scientific ideas depend on experimental and observational confirma-tion, all scientific knowledge is, in principle, subject to change as new evidence becomes available.
National Science Education StandardsStandards Key
M - major emphasism - minor emphasisi - indirect; i.e., not directly tied to standard, but important background information.
The letters A-G represent various areas in the National Science Education Standards, as follows: A - Science as Inquiry B - Physical Science: Motion and Forces C - Life Science D - Earth and Space Science E - Science and Technology F - Science in Personal and Social Perspectives G - History and Nature of Science
continued from previous page
viispace weather
Activity NM-NUM. 9-12.3
NM- ALG. 9-12.3
NM- GEO. 9-12.2
NM-GEO. 9-12.4
NM- MEA. 9-12.1
NM- MEA. 9-12.2
NM-DATA. 9-12.1
NM-DATA. 9-12.2
NM- DATA. 9-12.3
NM-DATA. 9-12.4
NM- PROB.CONN. PK-12.3
11 - Time Zone Math m m M m
12 - Universal Time m m M m
13 - The Aurora m m M M M m
14 - Magnetic Storms m M M m M M m
National Math Standards
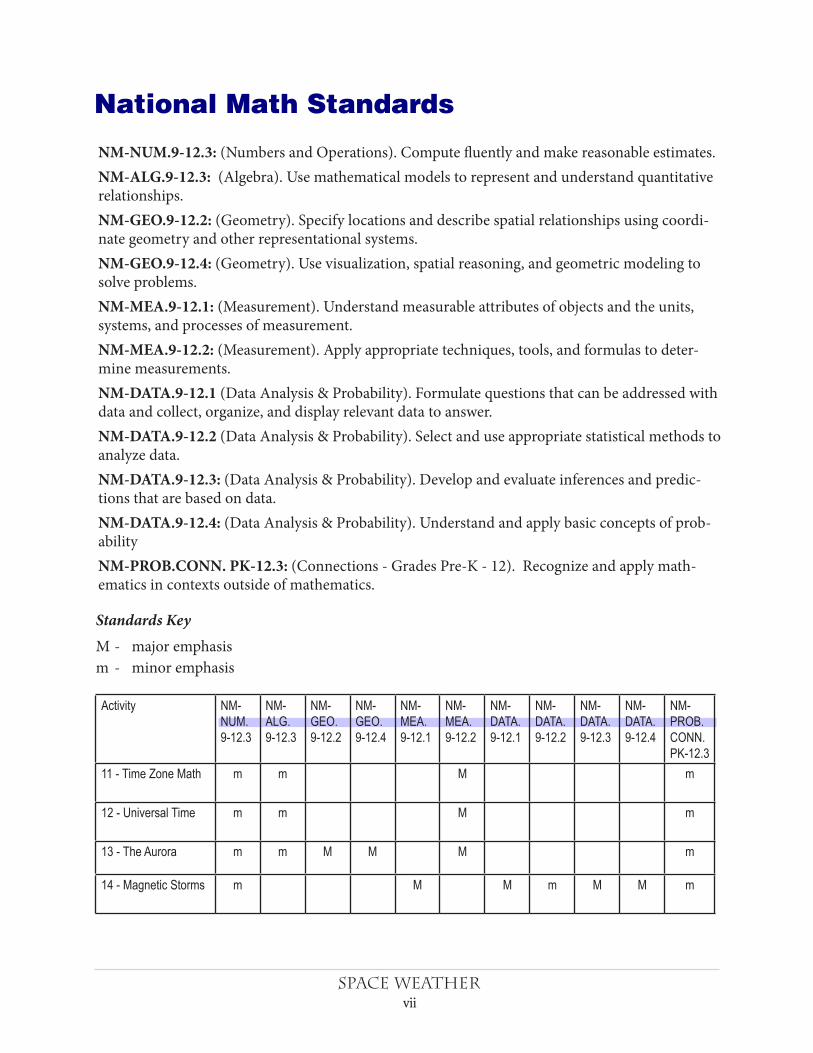
NM-NUM.9-12.3: (Numbers and Operations). Compute fluently and make reasonable estimates. NM-ALG.9-12.3: (Algebra). Use mathematical models to represent and understand quantitative relationships.NM-GEO.9-12.2: (Geometry). Specify locations and describe spatial relationships using coordi-nate geometry and other representational systems. NM-GEO.9-12.4: (Geometry). Use visualization, spatial reasoning, and geometric modeling to solve problems. NM-MEA.9-12.1: (Measurement). Understand measurable attributes of objects and the units, systems, and processes of measurement. NM-MEA.9-12.2: (Measurement). Apply appropriate techniques, tools, and formulas to deter-mine measurements. NM-DATA.9-12.1 (Data Analysis & Probability). Formulate questions that can be addressed with data and collect, organize, and display relevant data to answer.NM-DATA.9-12.2 (Data Analysis & Probability). Select and use appropriate statistical methods to analyze data.NM-DATA.9-12.3: (Data Analysis & Probability). Develop and evaluate inferences and predic-tions that are based on data.NM-DATA.9-12.4: (Data Analysis & Probability). Understand and apply basic concepts of prob-abilityNM-PROB.CONN. PK-12.3: (Connections - Grades Pre-K - 12). Recognize and apply math-ematics in contexts outside of mathematics.
Standards Key
M - major emphasism - minor emphasis
National Science Education StandardsStandards Key
M - major emphasism - minor emphasisi - indirect; i.e., not directly tied to standard, but important background information.
The letters A-G represent various areas in the National Science Education Standards, as follows: A - Science as Inquiry B - Physical Science: Motion and Forces C - Life Science D - Earth and Space Science E - Science and Technology F - Science in Personal and Social Perspectives G - History and Nature of Science

viiispace weather
IntroductionThis magnetism teacher’s guide is one of four activity guides—plus a background guide for teachers —that provide students with the opportunity to build on science concepts related to Earth’s magne-tism and its changes, as detected by THEMIS magnetometers located in schools across the U.S. The four activity guides have been used in different types of classes, from physical science and physics classes, to geology classes and astronomy classes. The excitement of actually participating in the THEMIS project helps motivate the students to learn challenging physical science concepts.
The background guide for teachers, the THEMIS GEONS Users Guide describes the important role that terrestrial magnetism plays in shaping a number of important Earth systems. It also ex-plains the basic operating principles behind magnetometers—particularly the system you are now in the process of using to investigate magnetic storms at your school.
Magnetism and Electromagnetism is the first of the four activity guides. It contains a review of basic magnetism similar to what is encountered in most grade-level physical science texts. Students are introduced to magnets, the concepts of polarity and magnetic lines of force, and electromagne-tism (generators and Lenz’s law). These materials are generally used by teachers presenting Earth and Physical Science courses in grades 6-9, and occasionally presented as a lab at the end of high school physics classes. These activities, while not directly tied in to NASA space science, are a pre-requisite to understanding magnetism on Earth and in space.
Exploring Magnetism on Earth is the second activity guide. It is intended to help students ex-plore Earth’s magnetic field through a variety of hands-on activities. This guide contains problems focusing on Earth’s changing magnetic field in time and space, and how these changes can im-pact navigation on Earth’s surface. Students use basic math skills to interpret graphical information showing polar wander and magnetic changes, and answer questions about quantitative aspects of these changes. These activities have been classroom-tested with students of many different levels of proficiency in math and science. The lessons have been used in geology and astronomy classes.
Space Weather is the third guide in this sequence. It introduces students to Earth’s magnetic field and aurora within the context of the Sun and space weather. The guide covers the Earth’s magne-tosphere, time zones and Universal Time, the evolution of auroras, and space weather forecast-ing using geomagnetic indices. These activities have also been classroom-tested in classrooms with students of many different levels of proficiency in math and science. The lessons have been used in physics and astronomy classes as well.
Earth’s Magnetic Personality is the fourth and final guide, which was developed with the goal that students can work directly with the THEMIS magnetometer data. The guide covers vectors, the x-y-z magnetometer plots, creating a prediction for aurora using the magnetometer data, calculating the total magnetic field strength and observing it over months, and the waves in Earth’s magnetic field excited by large magnetic storms.

1space weather
Activity 9 - The Magnetosphere
Teacher’s Guide
In order to discuss Earth’s magnetic field and its changes, we need a common vocabulary. Scien-tists recognize over two dozen distinct regions and processes occurring within the magnetosphere. Some are nearly permanent features, while others appear and disappear within minutes or hours. In this activity, students will visit a website and learn the main features of the magnetosphere and the functioning of the Sun-Earth system. Students should start a lab book in which to keep notes about Earth’s magnetosphere, space weather, and magnetometer data.
Goals
1) Students will learn about the basic elements of the Sun-Earth system.
2) Students will appreciate that the magnetosphere has many different re-gions.
Procedure
• Studentswill identify thedefinitions foreach termby reading thediscoverypages fromthe IMAGE satellite education program.
• Byreadingeach“discoverypage,”studentswilllearnaboutrecentadvancementsandseehowthe terms relate to each other. In all cases, the definitions are provided at the bottom of each page.
The collection of pages at: http://image.gsfc.nasa.gov/poetry/IMAGEdisc.html will provide sum-maries of each discovery, and definitions of the terms. Also, see the web resources at the end of this guide for additional sources. Students may also use GoogleTMor“WIKIPEDIA”tofindrelevant,brief definitions. This provides a great opportunity for students to compare definitions, and for the teacher to discuss the credibility of the various resources used in student web research.
The accompanying Teacher Answer Key indicates where on the NASA-IMAGE website the defini-tions can be found.

2space weather
Teacher Answer Key
Magnetosphere - Answer at the link 2001- Discovery 14
Bow Shock - Answer at the link 2001 – Discovery 4
Magnetopause - Answer at the link 2003 – Discovery 3
Magnetotail - Answer at the link 2001 – Discovery 1
Polar Cusp – Answer at the link 2000 – Discovery 2
Plasma Sheet - Answer at the link 2001 – Discovery 8
Auroral Oval - Answer at the link 2001 – Discovery 7
Ring Current – Answer at the link 2001 – Discovery 10
Solar Wind - Answer at link 2003 – Discovery 8
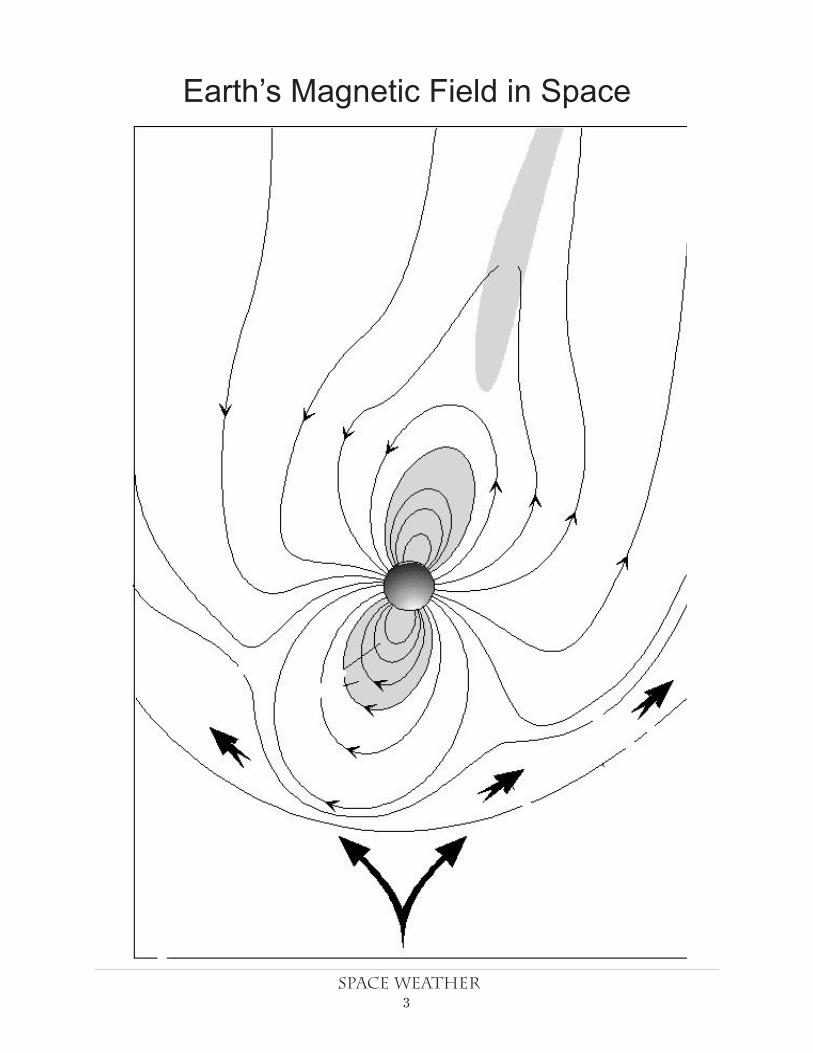
A GoogleTMimagesearch(clickon“images”undertheGoogleTM page header) using the key word”magnetosphere”willcallupmanydiagramsthat looklikethefigurebelow.Note, theplasmasphere and ring current, as well as the inner Van Allen Belts, are situated in the same spatial locations, but differ significantly in the energy (in electron volts, or eV) of the particles involved. Plasmasphere (~1 eV), Ring Current (10,000 - 200,000 eV), Van Allen Belts (1 mil-lion to 50 million Volts). Note that 1 Joule = 1 kg m2/s2 = 107 ergs = 6.242 x 10¹⁸ eV, which is equivalent to to the energy of lifting a lemon 1 meter.
3space weather
Earth’s Magnetic Field in Space

4space weather
Student Name _________________________ Date _______
The goal of this activity is for you to become familiar with the main terms that scientists use to discuss Earth’s magnetic field. Review the information at the following website, which contains dis-coveries made by the IMAGE satellite, and the definitions for magnetospheric terms:
http://image.gsfc.nasa.gov/poetry/IMAGEdisc.html
Start a lab book. In your lab book, provide definitions to the following terms, and locate them on the accompanying figure. You will be referring back to the entries in this book as your main source of basic information in the weeks to come.
Magnetosphere
Bow Shock
Magnetopause
Magnetotail
Polar Cusp
Plasma Sheet
Auroral Oval
Ring Current
Solar Wind
Inquiry Problem - Pick one of the terms and write a short essay in your own words about why scientists are trying to learn about it.
The Magnetosphere

5space weather
Activity 10 - The Sun-Earth Connection
Teacher’s Guide
CME photo. Courtesy SOHO satellite
Goals
1. Students will know that the Sun is a dy-namic and magnetic star.
2. Students will know that coronal mass ejections (CMEs) are large structures of magnetized plasma that are ejected at high speeds from the Sun’s corona.
3. Students will know that the solar wind comes from the Sun and travels out past the planets in the solar system.
4. Students will know that Earth has a magnetic shield called the “magneto-sphere.”
5. Students will know that auroras are connected with Earth’s magnetosphere.
6. Students will know that CMEs interact with Earth’s magnetosphere and auro-ras are enhanced accordingly.
7. Students will know that the high-ener-gy particles from CMEs can be danger-ous to astronauts and can damage satel-lites.
MaterialsEither• PDForPowerPoint presentation from
Website above• PDFofscriptforthepresentation• Computer• LCDprojectorOr• Overheadtransparenciesfromtheblack
and white PDF from website above• PDFofscriptforthepresentation• Overheadprojector
This activity is a presentation for students about the Sun and its effects on Earth’s magnetosphere and NASA’s satellite mission to understand auroral substorms, THEMIS (Time History of Events and Macroscale Interactions during Substorms). This presentation and a script for the presenta-tion is available as 1) a black and white Acrobat Reader PDF document in order to make overhead transparencies, 2) an Acrobat Reader PDF presentation, and 3) a Microsoft PowerPoint presenta-tion. The script is available in the PowerPoint presentation in the notes section or you can down-load a PDF of the script. These are all found on the web at:
http://cse.ssl.berkeley.edu/exploringmagnetism/space_weather/presentation.html

6space weather
Procedure
1. Give the presentation using the desired slide formats.
2. Follow the script if you would like.
3. Handoutthe“IMPACT”story,andforhomeworkhavethestudentswriteaboutoneaspectofthe Sun-Earth Connection they learned from the talk and the story.
Notes: Click once on the movies to make them play in the PowerPoint presentation. Click twice on the movies to make them play in the PDF presentation.

7space weather
The Sun-Earth ConnectionThe Sun is a fiery ball of gas that gets so hot that gas flies out from the Sun at very high speeds. Many of the electrons in the Sun’s atoms have enough energy to actually leave the atoms. These new particles are called ions. These ions and electrons are flowing outward from the Sun, and together they are known as the solar wind. The ions and electrons dance in the Sun’s magnetic field. Scientists discovered that the solar wind and its magnetic field flow together out past Mercury, past Earth, and continue out past Pluto. Because the magnetic field is threaded throughout the solar system, we call it the interplanetary magnetic field—that is, the magnetic field found between (inter) the planets (planetary).
When the solar wind travels with the interplanetary magnetic field, or IMF for short, the charged particles and magnetic fields interact with Earth’s magnetic field. Earth’s magnetic field, as it stretch-es out in space, is known as its magnetosphere. The solar wind pushes on the side of the magneto-sphere facing the Sun and pulls it out on the side facing away from the Sun. The pulling forms a long tail away from the Sun, and thus the magnetosphere looks like a wind-sock blowing in the wind. Electrical currents flow in the magnetosphere and generate the lights in the sky known as the Northern and Southern Lights. Together these lights are known as aurora.
Scientists have also noticed that the Sun goes through some pretty different cycles—just like moody people who are calm and quiet some days, but on other days explode with anger. But rather than emotions driving the changes, physical principles—such as magnetic and electric forces—power the Sun’s cycles. During the Sun’s active cycle, parts of it will explode, sending out even more solar wind and magnetic fields than usual.
What happens to the solar wind and magnetic fields that the explosions send flying out into space? Sometimes the explosive solar wind will flow by Earth, where we all could be potentially vulner-able. Luckily Earth has a magnetic field and a thick layer of atmosphere which protects all living creatures on Earth from the particles and radiation that can come from such solar explosions. But when astronauts are out in space, sometimes the magnetic field isn’t strong enough to protect them. If they are outside their space vehicles, such as the space station, they need to hurriedly float back to its protection when conditions are possibly hazardous.
Scientists have named these explosions coronal mass ejections, or CMEs for short. When a CME interacts with Earth’s magnetosphere, the electrical currents in the magnetosphere grow stronger and the aurora glows brighter. Because currents create magnetic fields, the changes in these electri-cal currents cause changes in magnetic data on Earth’s surface. There are a number of important currents that cause magnetic changes observed on the ground as changes in Earth’s magnetic field. Three specific currents are:
1) Electrical currents flow in the day-lit side of the upper atmosphere called the ionosphere at 100 km (60 miles) above Earth’s surface. In this region the Sun’s light breaks apart the gas in the upper atmosphere into ions and electrons and these charged particles flow in different directions, creat-

8space weather
Alfvén Waves on magnetic field lines rendered as ’snakes’ at the Basic Plasma Science Facility at UCLA (http://128.97.43.7/bapsf/pages/gallery.html) which uses computer modeling to investigate laboratory plasmas in con-trolled fusion research.Who says scientists don’t have a sense of humor?
ing a current above Earth’s surface during the day. Aurora also causes an enhanced ionosphere at night in an oval around Earth’s magnetic poles. Enhanced currents are also found in these regions of aurora above Earth’s surface during the night.
2) There is also electrical current flowing in a large belt-like region around Earth’s equator but far from Earth’s surface, around 30,000 km above it. This current is called the ring current, because it makes a ring around Earth.
3) And there are also electrical currents at midnight above Earth’s surface near the equator but even farther than the ring current at over 60,000 km altitude. These currents are called the substorm current wedge. CMEs interacting with Earth’s magnetosphere can influence all these currents. Be-cause electrical currents create magnetic fields, the currents can be observed on the ground using devices that measure magnetic fields, called magnetometers. When a CME interacts with Earth’s magnetic field, there are rapid changes in these current systems. Currents that change rapidly, within seconds, are usually carried by a wave known by the name of the man who discovered them through equations. These magnetic waves are called Alfvén waves. The picture below is a computer simulation of these waves.
9space weather
Activity 11 - A Review of Time Zone Mathematics
Teacher’s Guide
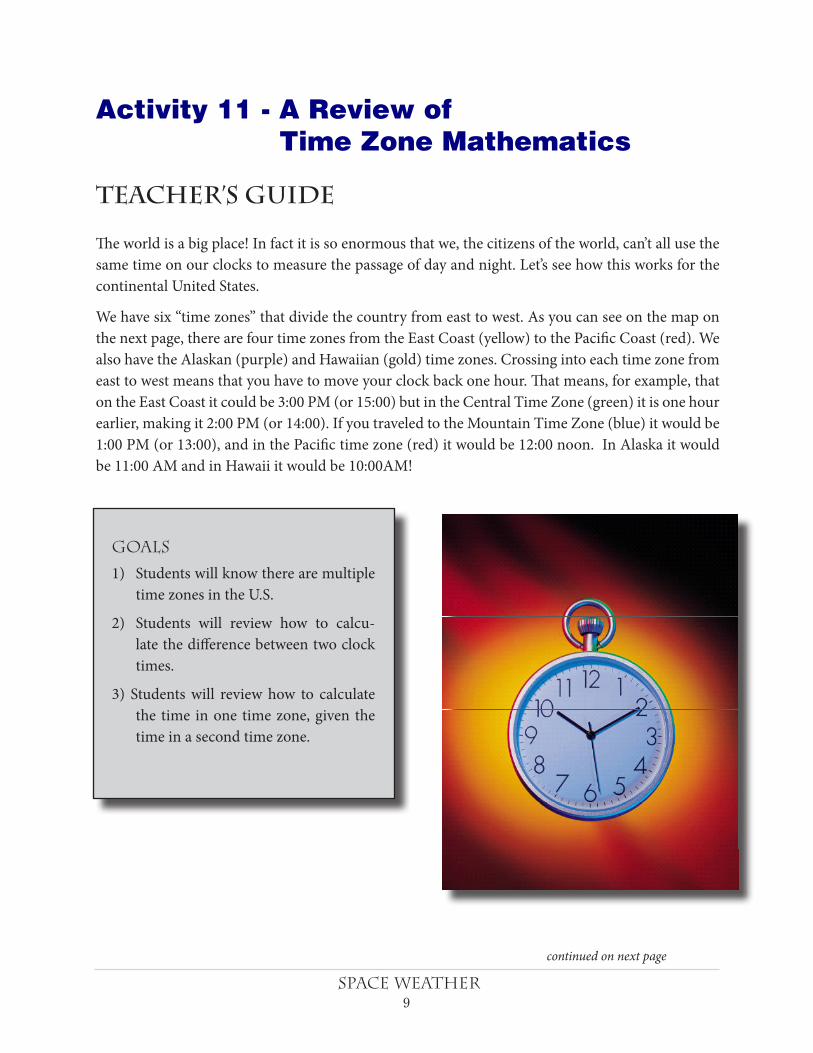
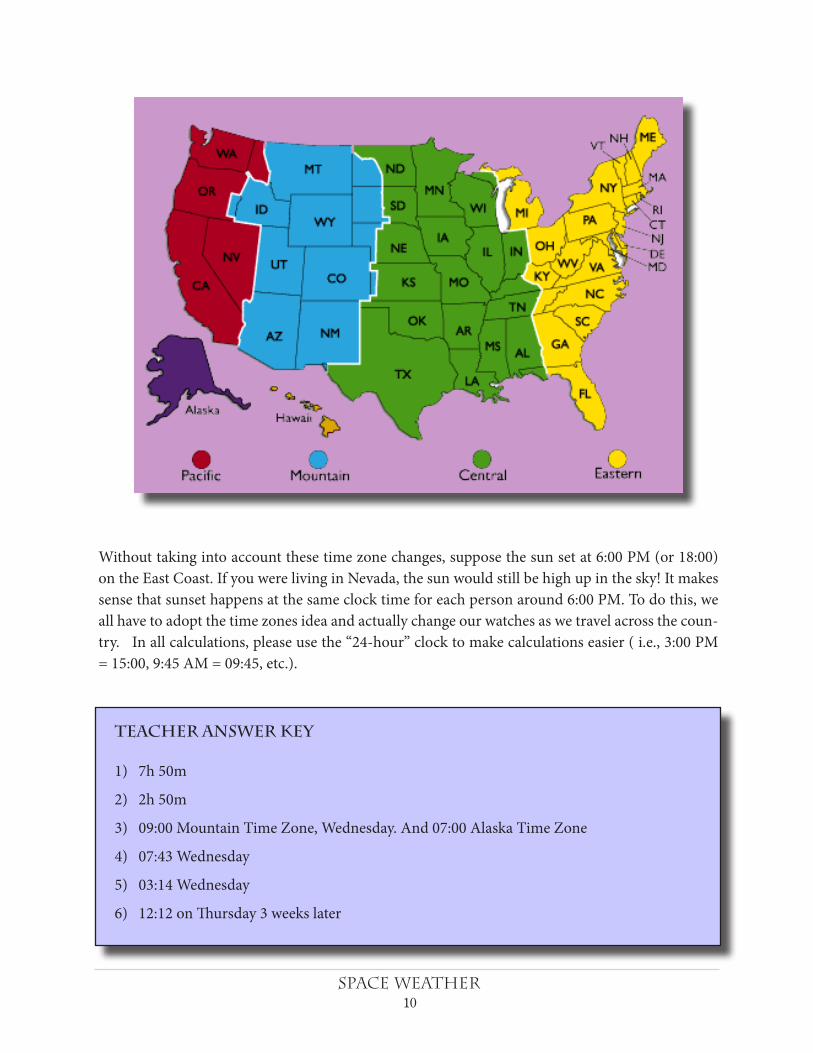
The world is a big place! In fact it is so enormous that we, the citizens of the world, can’t all use the same time on our clocks to measure the passage of day and night. Let’s see how this works for the continental United States.
Wehavesix“timezones”thatdividethecountryfromeasttowest.Asyoucanseeonthemaponthe next page, there are four time zones from the East Coast (yellow) to the Pacific Coast (red). We also have the Alaskan (purple) and Hawaiian (gold) time zones. Crossing into each time zone from east to west means that you have to move your clock back one hour. That means, for example, that on the East Coast it could be 3:00 PM (or 15:00) but in the Central Time Zone (green) it is one hour earlier, making it 2:00 PM (or 14:00). If you traveled to the Mountain Time Zone (blue) it would be 1:00 PM (or 13:00), and in the Pacific time zone (red) it would be 12:00 noon. In Alaska it would be 11:00 AM and in Hawaii it would be 10:00AM!
continued on next page
Goals
1) Students will know there are multiple time zones in the U.S.
2) Students will review how to calcu-late the difference between two clock times.
3) Students will review how to calculate the time in one time zone, given the time in a second time zone.
10space weather
Teacher Answer Key
1) 7h 50m
2) 2h 50m
3) 09:00 Mountain Time Zone, Wednesday. And 07:00 Alaska Time Zone
4) 07:43 Wednesday
5) 03:14 Wednesday
6) 12:12 on Thursday 3 weeks later
Without taking into account these time zone changes, suppose the sun set at 6:00 PM (or 18:00) on the East Coast. If you were living in Nevada, the sun would still be high up in the sky! It makes sense that sunset happens at the same clock time for each person around 6:00 PM. To do this, we all have to adopt the time zones idea and actually change our watches as we travel across the coun-try.Inallcalculations,pleaseusethe“24-hour”clocktomakecalculationseasier(i.e.,3:00PM= 15:00, 9:45 AM = 09:45, etc.).

11space weather
Calculating time changesHere are some solved problems with time arithmetic.
23:25 23 hrs – 21hrs = 2 hours
- 21:15 25min – 15min = 10 minutes_____________
2 hours 10 minutes - This is the difference in time between the two clock readings
21:15 This problem asks you to add 4 hours to the clock time 21:15
+ 4 hours
____________
01: 15 the next day
02:00 Eastern Time This problem asks you to calculate what clock time it is
- 3 hours in the Pacific Time Zone 3 hours earlier.
____________
23:00 Pacific Time the previous day.
15:15 Subtract 1 hour 55 minutes from 15:15 (or 3:15 PM)
- 1hour 55 minutes because 15 is less than 55, borrow 1 hour from 15:00 and add
____________ 60 + 15 to get 75. Then the problem becomes:
13:20 14 75
- 1 55
--------------
13: 20
12space weather
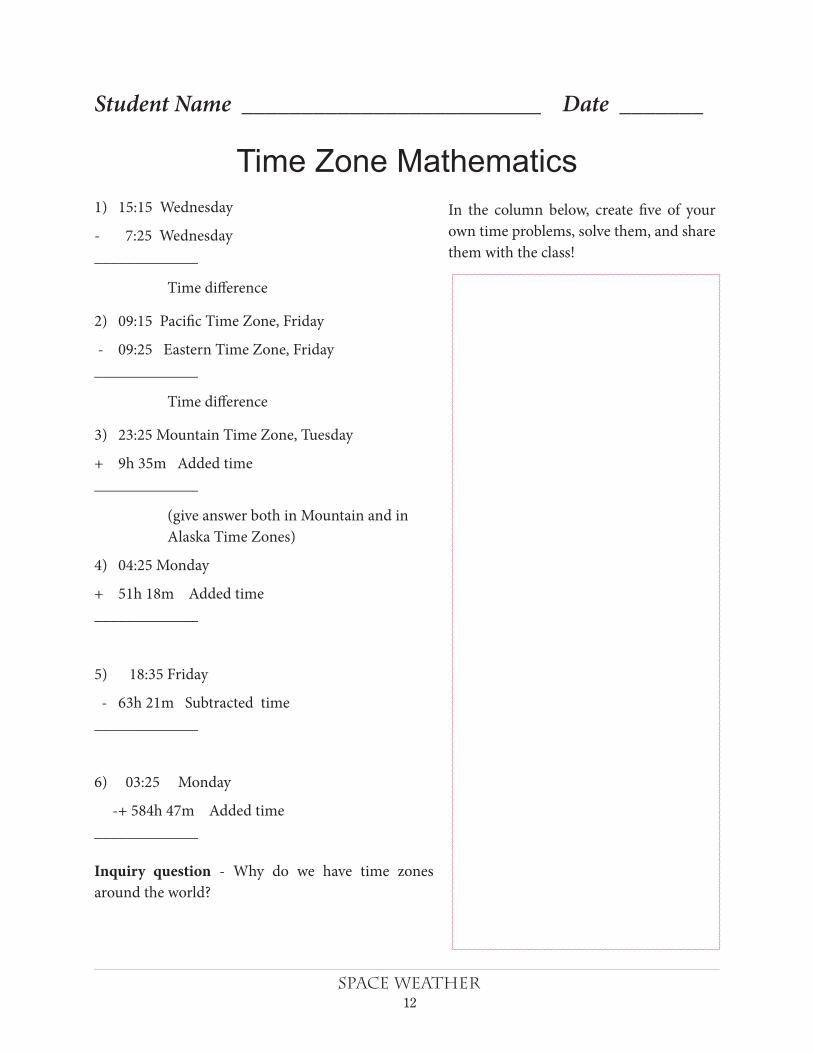
1) 15:15 Wednesday
- 7:25 Wednesday_____________
Time difference
2) 09:15 Pacific Time Zone, Friday
- 09:25 Eastern Time Zone, Friday_____________
Time difference
3) 23:25 Mountain Time Zone, Tuesday
+ 9h 35m Added time_____________
(give answer both in Mountain and in Alaska Time Zones)
4) 04:25 Monday
+ 51h 18m Added time_____________
5) 18:35 Friday
- 63h 21m Subtracted time_____________
6) 03:25 Monday
-+ 584h 47m Added time_____________
Inquiry question - Why do we have time zones around the world?
Student Name _________________________ Date _______
Time Zone MathematicsIn the column below, create five of your own time problems, solve them, and share them with the class!
13space weather
Activity 12 - Universal Time
Teacher’s Guide
Goals
1. Students will translate their local time to times in other zones around the world.
2. Students will work with the concept of Universal Time.
Procedure
Review with your students that Earth rotates from west to east. Show them a globe, and then have a student hold a small ball (ping pong ball) a few meters from the globe. Explore the relationship
One of the most common tasks that astronomers have to perform involves calculating times in dif-ferent time zones. When one astronomer observes a phenomenon from a particular place on Earth, it is often important to be able to communicate when exactly that phenomenon occurred to another astronomer located somewhere else on Earth. To make this as easy as possible, we adopt the time of the phenomenon as it would have been observed in Greenwich England – called Greenwich Mean Time (GMT) or Universal Time (UT). This requires converting the astronomer’s local time to UT.
Note to Teachers: Time zone math is a challenge for most people, including seasoned travelers, because intuitively it makes no sense why times are earlier or later than what the clock on your wall indicate, depending on which direction east to west you travel.
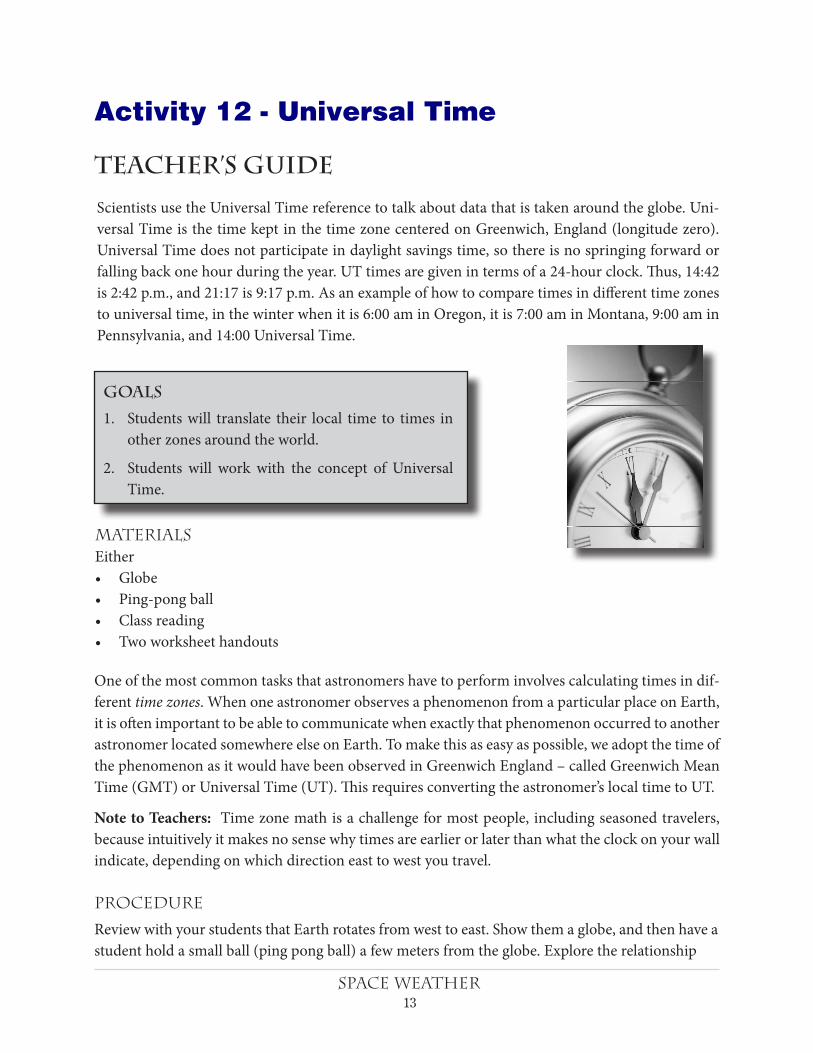
Scientists use the Universal Time reference to talk about data that is taken around the globe. Uni-versal Time is the time kept in the time zone centered on Greenwich, England (longitude zero). Universal Time does not participate in daylight savings time, so there is no springing forward or falling back one hour during the year. UT times are given in terms of a 24-hour clock. Thus, 14:42 is 2:42 p.m., and 21:17 is 9:17 p.m. As an example of how to compare times in different time zones to universal time, in the winter when it is 6:00 am in Oregon, it is 7:00 am in Montana, 9:00 am in Pennsylvania, and 14:00 Universal Time.
picture?
MaterialsEither• Globe• Ping-pongball• Classreading• Twoworksheethandouts

14space weather
between sun angle and local time by exploring the following questions:
1. Where on Earth is the sun-ball directly overhead?
2. What time it would be on Earth from where the sun-ball is directly overhead? (12 noon).
3 . Without moving the ball, ask the students where in the sky the sun-ball would be when viewed fromcountrieslocatedtotheeastoftheabove“noon”longitude.Answer: The ball would be lower in the western sky. That means that the sun is setting and that local times are LATER than noon as you travel eastward. The reverse is true for a traveler moving westward from the ‘noon’ longitude of the sun-ball.
Make sure your students have done Activity 11 before continuing with the following activity.
Working with the Concept of Universal Time Next have your students imagine that a Coronal Mass Ejection (CME) has launched from the Sun today at 12:00pm Noon Local Time (LT). The CME is heading toward Earth and is predicted to hit Earth’s magnetosphere 2 days and 3 hours after it left the Sun. Have the students work in teams to come up with developing a general way of communicating the time of this solar storm’s departure from the Sun and its arrival at Earth’s magnetosphere with other students around the world. Have them think about these questions as they approach this problem:
• WhattimewouldyouusetotellsomeoneinChinaaboutthisevent?
• WhowouldbeawakewhentheCMEarrivedanddoesthismatter intermsofwhat timetouse?
• IfmanymoreCMEswerelaunchedoverthecourseofweeks,whatgeneraltimewouldyouusewith other students around the world to communicate the timing of these CMEs?
Have the students share their ideas with each other in a class discussion. Then introduce the idea of Universal Time using the information at the beginning of this activity. Work a couple examples of converting local time to UT during daylight savings time and during standard time. Then have the students fill out the student worksheet to determine if they have understood how Universal Time works.
1. Students will read the material provided on their work sheet and note the local times for the solar flare, and the geographic locations of the observers.
2. They will identify in which time zone each observer is located.
3. They will read the diagram to determine the number of hours to add (+) or subtract (-) to de-termine the Universal Time (UT) of the solar flare.
4. They will answer questions about another event and whether it was observed by a scientist who was on a break from working.
15space weather
Student Name _________________________ Date _______
Universal Time
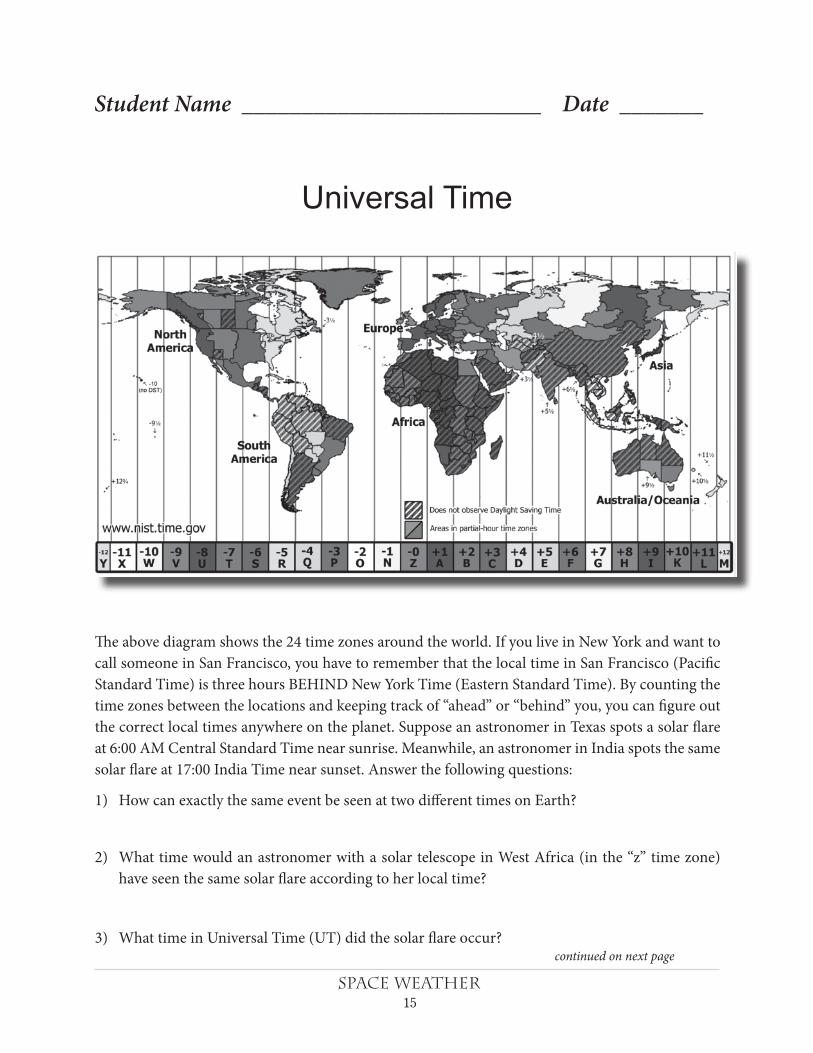
The above diagram shows the 24 time zones around the world. If you live in New York and want to call someone in San Francisco, you have to remember that the local time in San Francisco (Pacific Standard Time) is three hours BEHIND New York Time (Eastern Standard Time). By counting the timezonesbetweenthelocationsandkeepingtrackof“ahead”or“behind”you,youcanfigureoutthe correct local times anywhere on the planet. Suppose an astronomer in Texas spots a solar flare at 6:00 AM Central Standard Time near sunrise. Meanwhile, an astronomer in India spots the same solar flare at 17:00 India Time near sunset. Answer the following questions:
1) How can exactly the same event be seen at two different times on Earth?
2) WhattimewouldanastronomerwithasolartelescopeinWestAfrica(inthe“z”timezone)have seen the same solar flare according to her local time?
3) What time in Universal Time (UT) did the solar flare occur?continued on next page

16space weather
4) Would an astronomer with a solar telescope in Central Australia have seen the flare? How about an astronomer in Alaska?
5) Suppose a solar flare happened at 10:31 UT. What time would the event have happened in Cali-fornia according to Pacific Standard Time?
6) A satellite registers a major solar explosion that lasts from 15:15 to 16:26 UT. A solar scientist monitoring the satellite data decided to go grab a cup of coffee between 7:00 AM and 7:45 AM Pacific Standard Time.
a) How long did the explosion last?
b) Did the scientist know about the flare before he or she left for coffee?
c) How much of the flare event did the scientist get to see in the satellite data as it happened?
d) Should the scientist have gone for coffee?

17space weather
teacher Answer Key
1) How can exactly the same event be seen at two different times on Earth?Answer: Because the surface of Earth has different time zones.
2) What time would an astronomer with a solar telescope in West Africa have seen the same solar flare according to her local time? Answer: From the diagram and the location of West Africa, the local time would be 11:00 AM.
3) What time in Universal time did the solar flare occur? Answer: Knowing that Universal TimeisGreenwichMeanTimeatthe“PrimeMeridian,”theflareoccurredat12:00UT.
4) Would an astronomer with a solar telescope in Central Australia have seen the flare? How about an astronomer in Alaska? Answer: Neither would have seen it because the sun had al-ready set (Australia) or had not yet risen (Alaska).
5) Suppose a solar flare happened at 10:31 UT. What time would the event have happened in California according to Pacific Standard Time? Answer: By the diagram, PST is 8 hours behind UT so 10:31 UT – 8hrs = 2:31 AM PST. This is well before sunrise, so it wouldn’t have been seen.
6) A satellite registers a major solar explosion that lasts from 15:15 to 16:26 UT. A solar sci-entist monitoring the satellite data decided to go for a coffee between 7:00 AM and 7:45 AM Pacific Standard Time.
a) How long did the explosion last? Answer: 16:26 – 15:15 UT = 1hour and 11 minutes.
b) Did the scientist know about the flare before she left for coffee? Answer: He or she left for coffee at 7:00 AM PST which is 7:00 + 8hrs = 15:00 UT so she didn’t know about the solar explosion, which happened 15 minutes after she left.
c) How much of the flare event did the scientist get to see in the satellite data as it hap-pened? Answer: When she returned to the satellite station, the time was 7:45 AM PST + 8hrs = 15:45 UT. The explosion ended at 16:26 UT, so the scientist got to see 16:26 PM – 15:45 PM = 41 minutes of the last part of the explosion.
d) Should the scientist have gone for coffee? Answer: Yes, of course! Because if he or she had been smart, she would have made sure that her data was being recorded for playback, just the way you program your VHS or DVD-recorder to record favorite programs you have to miss at regular broadcast time. Also, no scientist using satellite data ever relies on on-the-spot analysis. Scientists always record the satellite data so they can study it in detail later. Still, we can guess that after a long night at the satellite terminal,thisscientistwouldhavelovedtohavebeentheretoseeithappenin“real-time”!!
18space weather
Activity 13 - The Aurora: A Critical Look at PhenomenologyTeacher’s Guide
Goals
1) Students will learn the names of the basic auroral forms.
2) Students will learn that auroral shapes evolve over time and some-times follow a more-or-less well -or-ganized pattern of changes known as an auroral substorm.
3) Students will apply their knowledge of auroral forms and substorms by sorting a collection of images online into a sequence of changes.
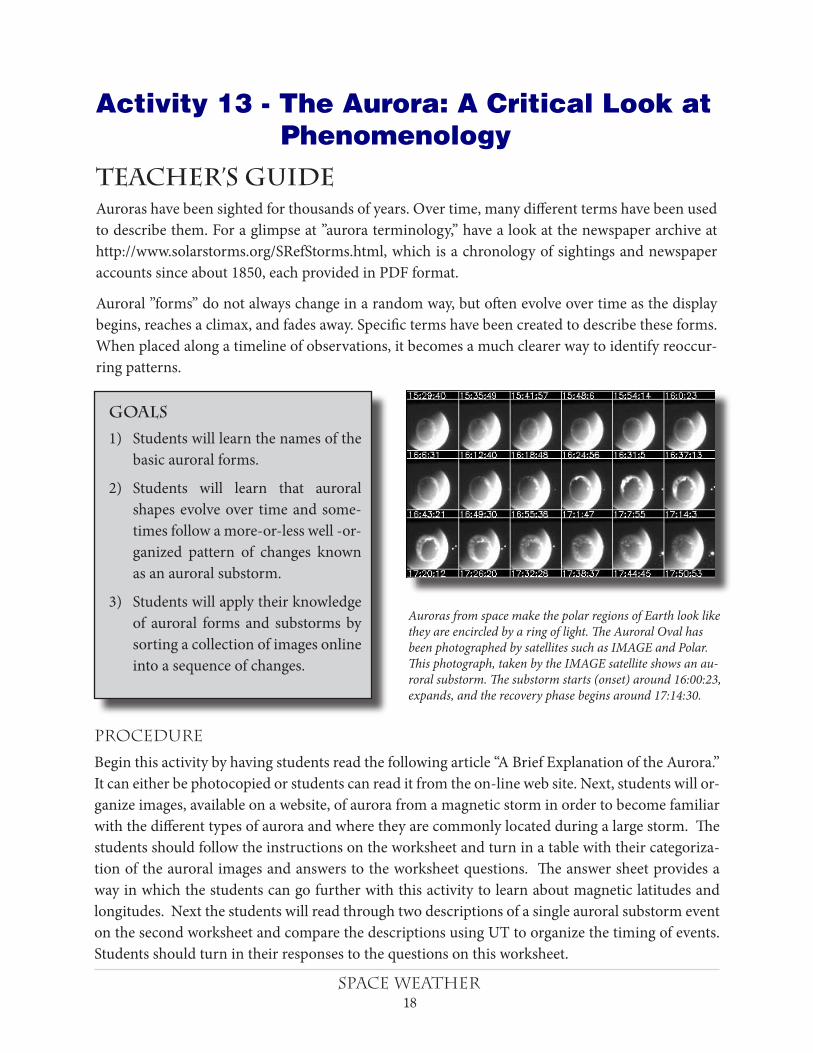
Auroras from space make the polar regions of Earth look like they are encircled by a ring of light. The Auroral Oval has been photographed by satellites such as IMAGE and Polar. This photograph, taken by the IMAGE satellite shows an au-roral substorm. The substorm starts (onset) around 16:00:23, expands, and the recovery phase begins around 17:14:30.
Auroras have been sighted for thousands of years. Over time, many different terms have been used todescribethem.Foraglimpseat”auroraterminology,”havealookatthenewspaperarchiveathttp://www.solarstorms.org/SRefStorms.html, which is a chronology of sightings and newspaper accounts since about 1850, each provided in PDF format.
Auroral”forms”donotalwayschangeinarandomway,butoftenevolveovertimeasthedisplaybegins, reaches a climax, and fades away. Specific terms have been created to describe these forms. When placed along a timeline of observations, it becomes a much clearer way to identify reoccur-ring patterns.
PROCEDURE
Beginthisactivitybyhavingstudentsreadthefollowingarticle“ABriefExplanationoftheAurora.”It can either be photocopied or students can read it from the on-line web site. Next, students will or-ganize images, available on a website, of aurora from a magnetic storm in order to become familiar with the different types of aurora and where they are commonly located during a large storm. The students should follow the instructions on the worksheet and turn in a table with their categoriza-tion of the auroral images and answers to the worksheet questions. The answer sheet provides a way in which the students can go further with this activity to learn about magnetic latitudes and longitudes. Next the students will read through two descriptions of a single auroral substorm event on the second worksheet and compare the descriptions using UT to organize the timing of events. Students should turn in their responses to the questions on this worksheet.

19space weather
A Brief Explanation of the AuroraNote: Because it’s important to see these pictures in color, this article can also be found online at http://ds9.ssl.berkeley.edu/themis/mission_auroraexplain.html.
About 90% of the time, the light from the aurora comes from an altitude of 100-250 km. Electrons from space follow Earth’s magnetic field lines down to Earth’s upper atmosphere near the magnetic poles. These electrons are sped up by electrical forces and move very fast. When the electrons col-lide with the gas in the upper atmosphere, mostly N2, O2, and O, they excite the gas. When the gas relaxes, it gives off light. This is the light of the aurora we can see. This light is found in an oval band around Earth’s magnetic poles. Sometimes this oval moves and changes shape in a specific pattern, known as an auroral substorm.
Aurora and city lights were pho-tographed by the US Air Force DMSP satellite on November 6, 2003, with a map drawn over the image in yellow. Note the sharp southern edge, defining the equa-torward edge of the auroral oval as it passes over Montana, the Great Lakes, and New England. Observers as far south as Georgia saw a spectacular display looking north to the aurora, located at an elevation of 100 km.
The space shuttle crew photo-graphed aurora from above Earth. The height of the aurora reaching above 100 km in altitude is plainly seen in this oblique view with the stars shining above Earth’s sur-face. Also note the color changes from green at lower altitudes, to reddish at highest altitudes.
20space weather
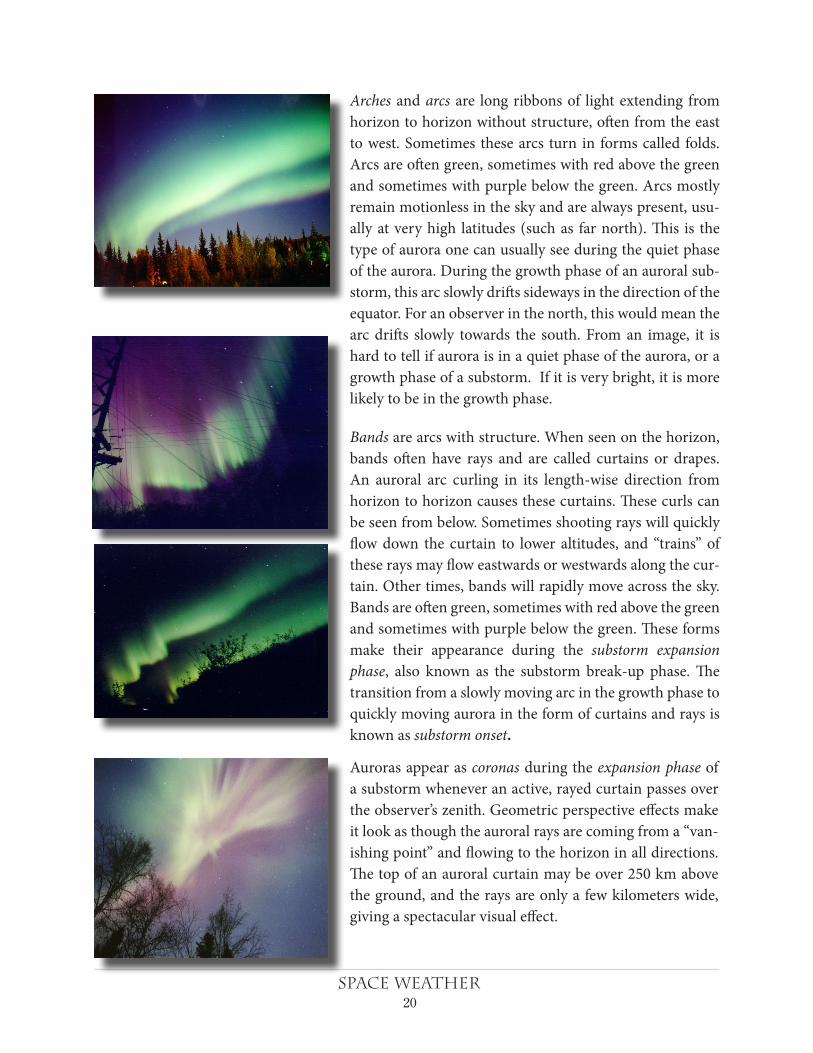
Arches and arcs are long ribbons of light extending from horizon to horizon without structure, often from the east to west. Sometimes these arcs turn in forms called folds. Arcs are often green, sometimes with red above the green and sometimes with purple below the green. Arcs mostly remain motionless in the sky and are always present, usu-ally at very high latitudes (such as far north). This is the type of aurora one can usually see during the quiet phase of the aurora. During the growth phase of an auroral sub-storm, this arc slowly drifts sideways in the direction of the equator. For an observer in the north, this would mean the arc drifts slowly towards the south. From an image, it is hard to tell if aurora is in a quiet phase of the aurora, or a growth phase of a substorm. If it is very bright, it is more likely to be in the growth phase.
Bands are arcs with structure. When seen on the horizon, bands often have rays and are called curtains or drapes. An auroral arc curling in its length-wise direction from horizon to horizon causes these curtains. These curls can be seen from below. Sometimes shooting rays will quickly flowdown the curtain to lower altitudes, and “trains”ofthese rays may flow eastwards or westwards along the cur-tain. Other times, bands will rapidly move across the sky. Bands are often green, sometimes with red above the green and sometimes with purple below the green. These forms make their appearance during the substorm expansion phase, also known as the substorm break-up phase. The transition from a slowly moving arc in the growth phase to quickly moving aurora in the form of curtains and rays is known as substorm onset.
Auroras appear as coronas during the expansion phase of a substorm whenever an active, rayed curtain passes over the observer’s zenith. Geometric perspective effects make itlookasthoughtheauroralraysarecomingfroma“van-ishingpoint”andflowingtothehorizoninalldirections.The top of an auroral curtain may be over 250 km above the ground, and the rays are only a few kilometers wide, giving a spectacular visual effect.

21space weather
Diffuse glows are the most common at the end of an auroral display, during the substorm recovery phase. At high lati-tudes, the displays are usually greenish. At lower latitudes during intense storms, red diffuse aurora are common. Diffuse auroras are often hard to observe with one’s eyes because they are very faint.
Above images courtesy Jan Curtis (http://climate.gi.alaska.edu/Curtis/aurora/aurora.html)
Evolution
For Northern Hemisphere observers, an auroral substorm display begins with the appearance of an auroral arc above the northern horizon or in the zenith. Over the course of 30 minutes during substorm growth phase, this arc will grow in brightness exceeding that of the full moon, with a white or pale green color. It will also drift across the sky towards the zenith or towards the equator. The au-roral arc often will resolve itself into folds of light extending from the eastern horizon to the western horizon in the northern sky. From the ground, the substorm onset begins suddenly within seconds.
This is followed by the substorm expansion phase (also known as the break-up phase). In the expan-sion phase, the auroral arcs or bands break into many moving bands, which dance wildly across the sky both to the north and south. Within minutes, rays of light will start streaming down the devel-oping curtains, which often surge westwards. From space, the expansion or break-up phase is seen as a thickening of the auroral oval along its north-south extent. The auroral oval’s substorm bright-ening region begins to expand westward, dissolving into numerous individual structures, which we see from the ground as individual curtains. As a curtain passes directly overhead, the rays flowing down the curtain create an auroral corona, which from a central point look like a meteor shower raining down the sky – an effect of perspective.
Within 30 minutes, the activity begins to slow and fade, and retreat northwards during the recov-ery phase. From space, the recovery phase is seen as a thick oval, often with two bright regions to the north and south. From the ground, pulsating aurora will be visible, which are large patches of diffuse aurora that brighten and fade with periods of seconds. The aurora slowly becomes a diffuse glow. An uninterrupted recovery phase lasts several hours. At any time during this sequence, the aurora may erupt into another auroral display if a new magnetic substorm event is triggered by dis-turbances in Earth’s magnetotail region.
Sounds
Observers from many countries claim, rather steadfastly, that they sometimes hear sounds from aurora, such as crackling or swooshing. This subject is an interesting one for students to explore. Are people simply imagining the sound because auroras LOOK so much like fires in the sky? For decades, scientists have looked into this subject, but have not been able to capture any sound on tape.

22space weather
One thing we do know is that direct observations show that auroras never occur closer than about 70 km above the ground, where the air is nearly a vacuum. There is no gas to carry pressure waves thatcouldmakeourearssensesound.Thishascausedsomescientiststolookintoindirect“sym-pathetic”causes.Someofthesearepsychological.Othersmayinvolvepowerfulelectricalcurrentsflowinginthegroundthatcauseelectric“crackling”dischargesonsharpobjectsneartheobserver(pine needles, etc). These currents are well-known to exist at the latitudes where sounds are re-ported.
23space weather
The Aurora: October 29-30th, 2003In this exercise, you will examine a number of aurora photographs taken around the world by amateur photographers on October 29th and 30th, 2003. These observers were locat-ed at a number of different locations and latitudes. We will use photographs assembled from the photographs at the October, 2003 spaceweather.com aurora gallery and located at: http://ds9.ssl.berkeley.edu/themis/gallery_auroras.html
Wewillbestudyingthemajor“GreatAurora”thatwasviewedonOctober29-30,2003.
1. Create a table with 15 rows, and four columns.
2. Label the columns as follows: location, latitude, description, substorm phase.
3. Visit the above website and fill in the information in Columns 1 (location) and 3 (description) from the information provided in each picture’s caption. For example, in Row 1, use the aurora photographedbyLionelBernardi.InColumn1,enter“Tromsø,Norway.”InColumn3enteradescription of the aurora, including color. Use the standard terms described in the photo gal-leryprovidedbyyourteacher.Forexample,thisfirstrowauroracouldbedescribedas“purple,white,andyellowcorona.”
4. From your descriptions in Column 3, assume the aurora was part of an auroral substorm and estimate the phase of the auroral substorm. Write this in Column 4 (substorm phase) using the descriptions provided by your teacher (quiet, growth, expansion, recovery phases). For ex-ample, Row 1 would be an expansion phase aurora.
5. When you are finished with the web gallery for pictures taken on October 29 and October 30, in Column 2 enter the latitudes of the locations given in Column 1 by using a map. Or, use a web page that gives the latitudes for a given location. Latitude degrees need only be integers, notdecimals.Forexample,insteadofwriting“35.47degrees”justrounditto“35degrees.”ForthisfirstaurorainRow1,youwouldwrite69degreessinceTromsø,Norwayislocatedat69degrees.
6. When complete, answer the following questions:
Question 1 – Geographically, for which latitudes were the most diffuse aurora seen by observers?
Question 2 – What was the lowest latitude from which observers reported aurora?
Question 3 – What was the lowest latitude from which expansion-phase aurora were seen?
Question 4 – What were the most common expansion phase features that were seen?
Question 5 – Where would you have to live in the USA to see expansion phase features?
Student Name _________________________ Date _______

24space weather
TEACHER Answer Key
Question 1: Geographically, for which latitudes were the most diffuse aurora seen by ob-servers? Answer: Missouri, Ohio, West Virginia, Indiana, and Colorado all saw diffuse aurora. The latitudes vary from 39 to 41 degrees north.
Question 2: What was the lowest latitude from which observers reported aurora?Answer: Elkins, West Virginia, at a latitude of 39 degrees north.
Question 3: What was the lowest latitude from which expansion phase aurora were seen? Answer: For this storm, the lowest latitude where discrete auroral features were observed were from La Otto, Indiana at 41 degrees north. Expansion-phase auroras were seen from 41 degrees north to 69 degrees north.
Question 4: What were the most common expansion phase features that were seen?Answer: Bands with rays.
Question 5: Where would you have to live in the USA to see expansion phase features? Answer: From this activity, it seems it would be necessary to live above about 41 degrees north. However, since the magnetic pole is not located at the geographic pole, it would be more accurate to find the magnetic latitudes of all of these types of aurora and answer the questions.
Going Further
Have your students find the geographic longitude of all the locations, as well as the geo-graphic latitudes. Then have them use a converter to obtain the magnetic latitudes for all of these locations using the geographic latitude, longitude to magnetic latitude, longitude converter on the webpage:
http://swdcwww.kugi.kyoto-u.ac.jp/igrf/gggm/
Have them then answer the same questions using magnetic latitude instead of geographic latitude and discuss any differences they find.

25space weather
Magnetic Substorm of 1859On August 28, 1859, a major solar storm caused spectacular aurora seen all over the globe. It was reported in all the major newspapers, poems were written about it, and famous artists painted its shapes and forms. It also caused severe problems with telegraph networks at the time, which lasted for many hours worldwide. Although scientists gave detailed reports of the changing forms of this vivid display, many ordinary citizens offered their own impressions of this event too. Two of these descriptions, as seen from two different locations, are written below. Read these descriptions and respond to the following questions and instructions.
Galveston, Texas:
“August28asearlyastwilightclosed,thenorth-ern sky was reddish, and at times lighter than other portions of the heavens. At 7:30 PM a few streamers showed themselves. Soon the whole sky from Ursa Major to the zodiac in the east was occupied by the streams or spiral columns that rose from the horizon. Spread over the same extent was an exquisite roseate tint which faded and returned. Stately columns of light reaching up about 45 degrees above the horizon moved westward. There were frequent flashes of lightning along the whole extent of the aurora. At 9:00 PM the whole of the streaking had faded leaving only a sort of twilight over the northern sky.”
London, England.
“At0:15AMonAugust28th theauroral lightin the north assumed the form of a luminous arch, similar to daybreak, and in the southwest there was an intense glare of red covering a very large extent of the sky. At 00:20 AM streamers appeared; at 00:25 AM the streamers rose to the zenith and were tinged with crimson at their summits. At 00:45 AM frequent coruscations appeared in the aurora. At 01:20 AM the arch which had partially faded began to reform and the body of the light was very strong but not bright enough to read newspaper print. At 1:30 AM the light had begun to fade. By 2:00 AM the aurorawasveryindistinct.”
Student Name _________________________ Date _______
When organizing observations from different places around the world, a common problem scientists face is that observers tend to note when things happened by their local time. Scien-tists simplify these accounts by converting them into Universal Time, which is the local time in Greenwich, England, also called Greenwich Mean Time (GMT). To make time calculations easier, UT is expressed in the 24-hour clock format —so that 11:00 AM is written as 11:00 UT— but times after noon such as 1:00 PM are written as 13:00 UT. 10:00 PM is written as 22:00 UT. Since London is very close to Greenwich, the times mentioned in the London account above are already in Universal Time and only need to be converted to the 24-hour format. For Galveston, Texas, the time is 5 hours behind UT so to get the equivalent UT for Galveston, first convert the Galveston times to the 24-hour format, then add 5 hours. See Activity 11 for more details.
continued on next page

26space weather
Questions and Instructions:
1) From the two descriptions, extract the specific points of each narrative. Change the times to Universal Time while you do that. What are the stories’ similarities?
2) From the sequences of events in each description, create a storyline for the aurora display that fits the most details.
3) Rewrite the timeline using the auroral substorm phases. Would you call this an auroral substorm?
4) Why was the aurora observed to reach closer to zenith in London than in Galveston?
Student Name _________________________ Date _______
Magnetic Substorm of 1859
continued from previous page

27space weather
Teacher Answer Key1) From these two descriptions, extract the specific points of each narrative. Change the times to
Universal time while doing this. What are the stories’ similarities? Answer: Here are the main points in each story with the similarities highlighted.
Story 1: 1. Display began at end of twilight with faint reddish light in north.2. 7:30 PM (00:30 UT) streamers began to appear3. Streamers of spiral columns filled eastern sky4. Faint rose-colored light covered same eastern sky, fading and returning5. Columns of light reached 45 degrees to zenith, and moved westwards6. Frequent flashes of light along the whole aurora7. 9:00 PM (02:00 UT), the aurora faded and left a twilight glow in north.Story 2:1. 00:15 AM (00:15 UT) - Luminous arch appeared in northern sky2. 00:16 AM (00:16 UT) - Intense glare of red in southwest3. 00:20 AM (00:20 UT) - Streamers appeared4. 00:25 AM (00:25 UT) - Streamers reached zenith and were crimson at highest points5. 00:45 AM (00:45 UT) - Frequent coruscations appeared in aurora6. 01:20 AM (01:20 UT) - Arch begins to fade and reform7. 01:30 AM (01:30 UT) - Aurora begins to fade.8. 02:00 AM (02:00 UT) - Aurora very indistinct.Similarities: Auroral light appeared in northern sky. Streamers appeared soon afterwards. The streamers expanded in the sky until they were nearly overhead from Galveston, and overhead in London. The aurora shapes showed activity in the form of flashes and movement (coruscations). Soon after this active phase, the aurora faded. The auroral display started and ended at about the same Universal Time at each location.2) From the sequences of events in each description, create a storyline for the aurora display that
fits the most details. Answer: Each student might group the events differently because the eye-witness accounts are not detailed enough. Because this aurora is seen in the Northern Hemi-sphere, it is properly called the Aurora Borealis. Here is one way to organize the timeline:
“Theauroraborealisstartedwithafaintwashofreddishlightinthenorth.Abrilliantarchoflight formed. Five minutes later, streamers began to appear which were crimson at their highest points above the horizon. Then, coruscations (waves) began to appear in the brightening red glow of the aurora with the streamers filling the entire eastern sky. The columns of light and streamers began to move westwards, and frequent flashes of light were seen along the aurora as the luminous arch of began to fade and reform. After an hour and fifteen minutes, the aurora begantofadeaway,leavingbehindatwilightglowthatpersistedforanotherhalf-hour.”
3) Rewrite the timeline using the auroral substorm phases. Would you call this an auroral sub-storm? Answer: Yes, this could be called a substorm.
The growth phase began with a brilliant arch of light. Substorm onset occurred at 00:20 UT with streamers and active aurora as the expansion phase started. Recovery phase started with the arch fading and reforming.
4) Why was the aurora observed to reach closer to zenith in London than in Galveston? Answer: because the aurora is a polar phenomenon and London is at a higher latitude than Galveston. That means that the aurora will be seen higher in the northern sky from London than from Galveston.
28space weather
Activity 14 – Magnetic Storms
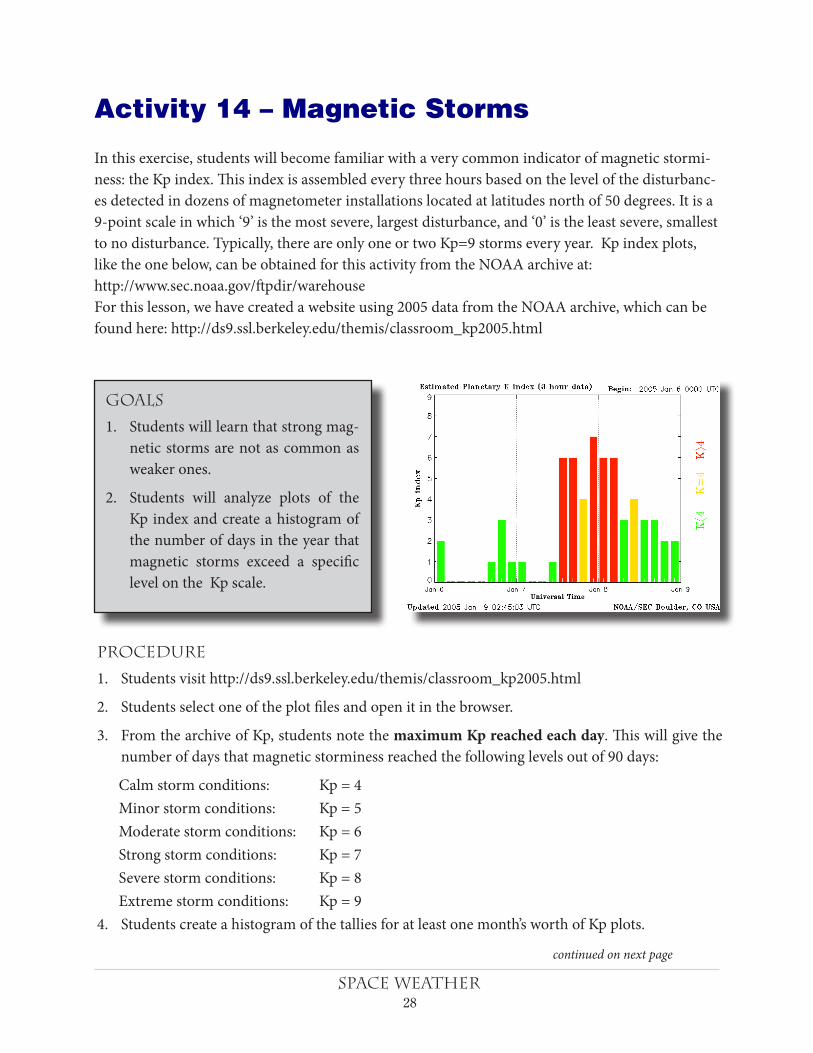
In this exercise, students will become familiar with a very common indicator of magnetic stormi-ness: the Kp index. This index is assembled every three hours based on the level of the disturbanc-es detected in dozens of magnetometer installations located at latitudes north of 50 degrees. It is a 9-point scale in which ‘9’ is the most severe, largest disturbance, and ‘0’ is the least severe, smallest to no disturbance. Typically, there are only one or two Kp=9 storms every year. Kp index plots, like the one below, can be obtained for this activity from the NOAA archive at: http://www.sec.noaa.gov/ftpdir/warehouse For this lesson, we have created a website using 2005 data from the NOAA archive, which can be found here: http://ds9.ssl.berkeley.edu/themis/classroom_kp2005.html
Goals
1. Students will learn that strong mag-netic storms are not as common as weaker ones.
2. Students will analyze plots of the Kp index and create a histogram of the number of days in the year that magnetic storms exceed a specific level on the Kp scale.
Procedure
1. Students visit http://ds9.ssl.berkeley.edu/themis/classroom_kp2005.html
2. Students select one of the plot files and open it in the browser.
3. From the archive of Kp, students note the maximum Kp reached each day. This will give the number of days that magnetic storminess reached the following levels out of 90 days:
Calm storm conditions: Kp = 4 Minor storm conditions: Kp = 5 Moderate storm conditions: Kp = 6 Strong storm conditions: Kp = 7 Severe storm conditions: Kp = 8 Extreme storm conditions: Kp = 94. Students create a histogram of the tallies for at least one month’s worth of Kp plots.
continued on next page

29space weather
5. At the conclusion of the assignment, consult the NOAA Space Weather site to compare. http://www.sec.noaa.gov/NOAAscales/#GeomagneticStorms
Going Further
• Have thestudentsenter thedata intoacomputerdatasheet so theycanperformadditionalcalculations on the data and plot the data using the computer program.
• Every3daysprintoutthemostrecentKpindexfromNOAA’swebsitehttp://www.sec.noaa.gov/rt_plots/kp_3d.html and post it on the wall in the classroom. Post other relevant space-weather data from NASA’s Student Observation Network, http://son.nasa.gov/tass/ such as sunspot, radio wave data, or magnetometer data, underneath the Kp data. Have students com-pare datasets to notice the connection between the Sun and Earth’s Magnetosphere.
continued from previous page
30space weather
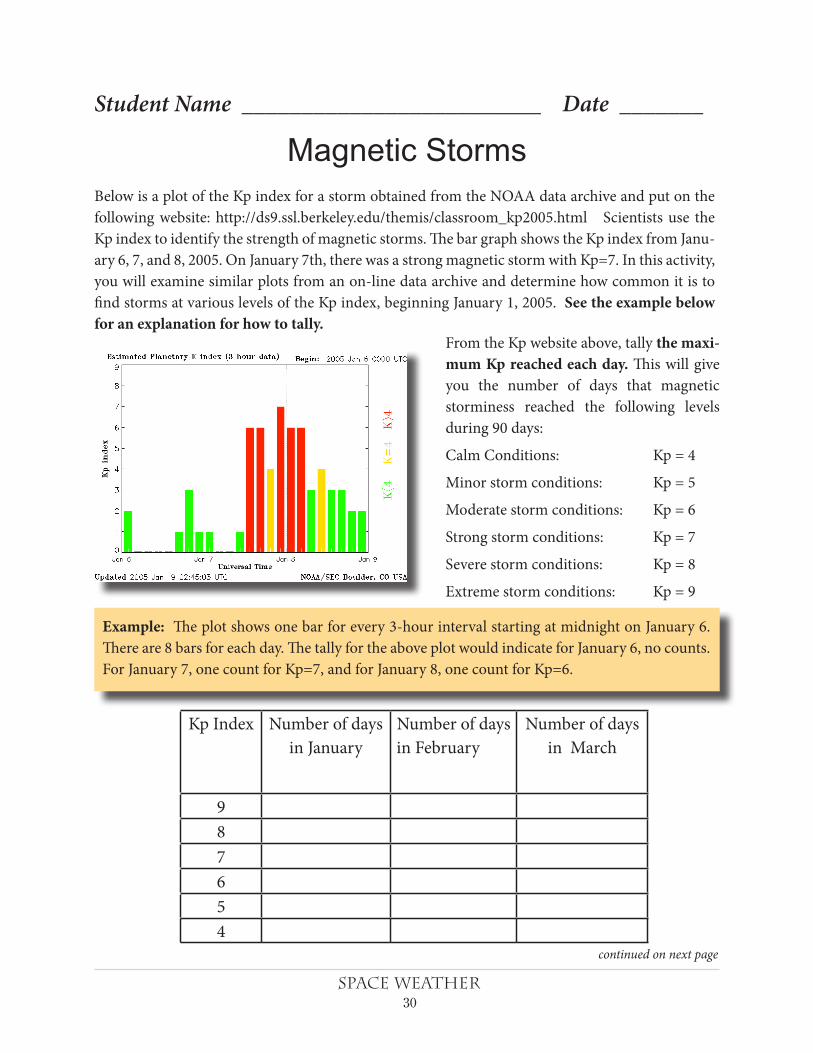
Below is a plot of the Kp index for a storm obtained from the NOAA data archive and put on the following website: http://ds9.ssl.berkeley.edu/themis/classroom_kp2005.html Scientists use the Kp index to identify the strength of magnetic storms. The bar graph shows the Kp index from Janu-ary 6, 7, and 8, 2005. On January 7th, there was a strong magnetic storm with Kp=7. In this activity, you will examine similar plots from an on-line data archive and determine how common it is to find storms at various levels of the Kp index, beginning January 1, 2005. See the example below for an explanation for how to tally.
From the Kp website above, tally the maxi-mum Kp reached each day. This will give you the number of days that magnetic storminess reached the following levels during 90 days:
Calm Conditions: Kp = 4
Minor storm conditions: Kp = 5
Moderate storm conditions: Kp = 6
Strong storm conditions: Kp = 7
Severe storm conditions: Kp = 8
Extreme storm conditions: Kp = 9
Example: The plot shows one bar for every 3-hour interval starting at midnight on January 6. There are 8 bars for each day. The tally for the above plot would indicate for January 6, no counts. For January 7, one count for Kp=7, and for January 8, one count for Kp=6.
Student Name _________________________ Date _______
Magnetic Storms
continued on next page
Kp Index Number of days in January
Number of days in February
Number of days in March
987654

31space weather
Question 1: From your 90-day sample, what percentage of days had either Severe or Extreme mag-netic storm conditions?
Question 2: From your answer to Question 1, what is the chance (in percent) that your magnetom-eter will see at least a moderate magnetic storm tomorrow?
Question 3:Whatpercentageofdaysareconsidered“stormy”duringthisperiod?
Inquiry Problem - 2005 was near sunspot minimum.
1. Find a year of sunspot maximum.
2. Repeat your tabulations of stormy days in a new chart, using the data from http://www.sec.noaa.gov/ftpdir/warehouse.
3. Compare your answers during sunspot maximum and sunspot minimum.
continued from previous page
Student Name _________________________ Date _______
Magnetic Storms

32space weather
Kp Index Number of days in January
Number of days in February
Number of days in March
98 |7 |||6 ||| | |5 |||||| ||| |||||4 |||||||||| |||||| ||||||||
Teacher Answer Key
Question 1: From your 90-day sample, what percentage of days had either Severe or Ex-treme magnetic storm conditions?
Answer: There was only one day (in January) that reached at least Kp= 8 ‘Severe Storm’, so the percentage is (1/90) x 100% = 1% of the time.
Question 2: From your answer to Question 1, what is the chance (in percent) that your mag-netometer will see at least a moderate magnetic storm tomorrow?
Answer: There were 10 days where Kp was at 6 or higher, so the chance is (10/90) x 100% = 11%.
Question 3: What percentage of days are considered ‘stormy’ during this period?
Answer: Stormy days are days where Kp exceeds 4. There were 24 days in January, 10 in Feb-ruary, and 14 in March for a total of 48 days, so the percentage of days is (48/90) x 100% = 53%. During this period of time, about every other day had stormy conditions.
Note: To simplify the calculations, only tally the maximum Kp reached in a given day. For example, in the Kp plot above, we count one day with Kp=7, which occurred on January 7, and one day with Kp=4 on January 8.
33space weather
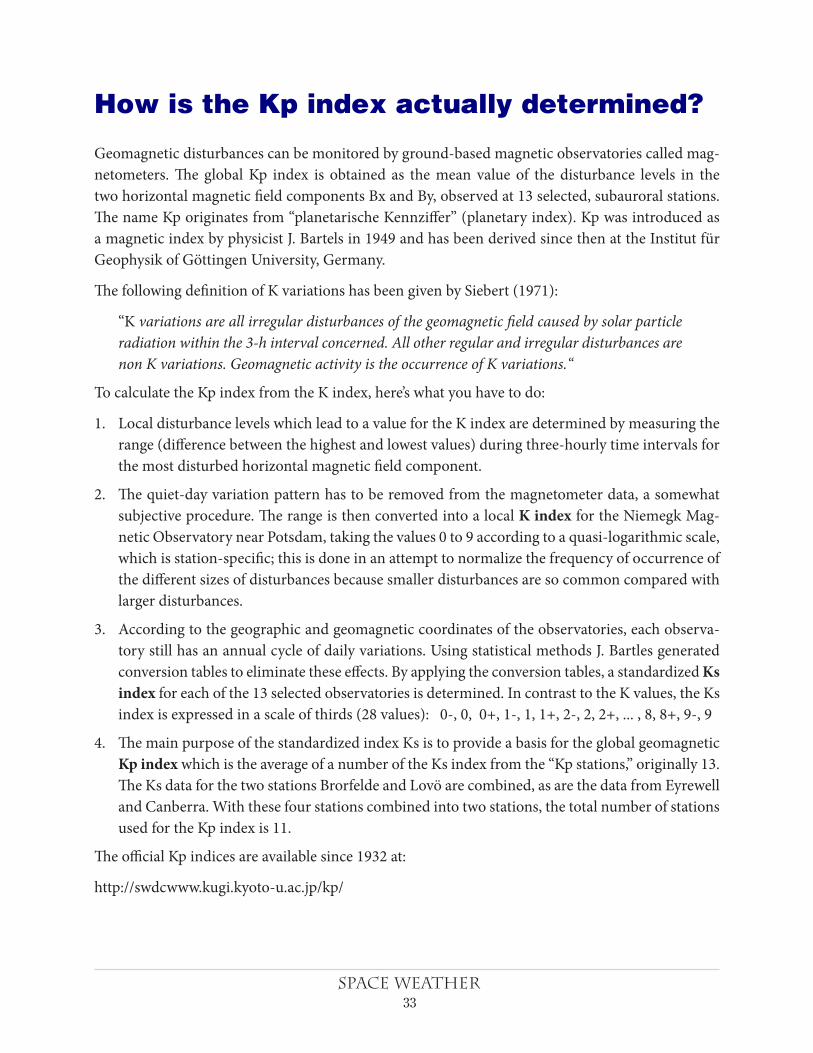
How is the Kp index actually determined?
Geomagnetic disturbances can be monitored by ground-based magnetic observatories called mag-netometers. The global Kp index is obtained as the mean value of the disturbance levels in the two horizontal magnetic field components Bx and By, observed at 13 selected, subauroral stations. ThenameKporiginatesfrom“planetarischeKennziffer”(planetaryindex).Kpwasintroducedasa magnetic index by physicist J. Bartels in 1949 and has been derived since then at the Institut für Geophysik of Göttingen University, Germany.
The following definition of K variations has been given by Siebert (1971):
“Kvariations are all irregular disturbances of the geomagnetic field caused by solar particle radiation within the 3-h interval concerned. All other regular and irregular disturbances are non K variations. Geomagnetic activity is the occurrence of K variations.“
To calculate the Kp index from the K index, here’s what you have to do:
1. Local disturbance levels which lead to a value for the K index are determined by measuring the range (difference between the highest and lowest values) during three-hourly time intervals for the most disturbed horizontal magnetic field component.
2. The quiet-day variation pattern has to be removed from the magnetometer data, a somewhat subjective procedure. The range is then converted into a local K index for the Niemegk Mag-netic Observatory near Potsdam, taking the values 0 to 9 according to a quasi-logarithmic scale, which is station-specific; this is done in an attempt to normalize the frequency of occurrence of the different sizes of disturbances because smaller disturbances are so common compared with larger disturbances.
3. According to the geographic and geomagnetic coordinates of the observatories, each observa-tory still has an annual cycle of daily variations. Using statistical methods J. Bartles generated conversion tables to eliminate these effects. By applying the conversion tables, a standardized Ks index for each of the 13 selected observatories is determined. In contrast to the K values, the Ks index is expressed in a scale of thirds (28 values): 0-, 0, 0+, 1-, 1, 1+, 2-, 2, 2+, ... , 8, 8+, 9-, 9
4. The main purpose of the standardized index Ks is to provide a basis for the global geomagnetic Kp indexwhichistheaverageofanumberoftheKsindexfromthe“Kpstations,”originally13.The Ks data for the two stations Brorfelde and Lovö are combined, as are the data from Eyrewell and Canberra. With these four stations combined into two stations, the total number of stations used for the Kp index is 11.
The official Kp indices are available since 1932 at:
http://swdcwww.kugi.kyoto-u.ac.jp/kp/
34space weather
Additional Web Resources
Space Weather terms
• SolarTerrestrialDictionary-http://stp.gsfc.nasa.gov/stp_program/stp_dictionary.htm
• SpacePhysicsTextbook-http://www.oulu.fi/~spaceweb/textbook/
Space Weather primers
• NASA-IMAGE-http://sunearth.gsfc.nasa.gov/sechtml/tut.html
Space Weather websites
• NOAA-SpaceEnvironmentCenter-http://www.noaa.sec.gov/SWN
• Spaceweather.com-http://www.spaceweather.com
• TheHumanImpactsofSpaceWeather-http://www.solarstorms.org
Space Weather books
• The 23rd Cycle - Learning to Live with a Stormy Star by Sten Odenwald, (Columbia University Press, 2001)
• Sentinels of the Sun: Forecasting Space Weather by Barbara Poppe and Kristen Jordan (Johnson Books, 2006)
Space Weather magazine and newspaper articles
• “SolarStorms”StenOdenwald(Washington Post March 10, 1999) http://solar.physics.montana.edu/press/WashPost/Horizon/196l-031099-idx.html
• “SolarStorms:TheSilentMenace”StenOdenwald(Sky and Telescope, March 2000)
• “StormWatch”C.ReneeJames(Sky and Telescope, July 2007)

35space weather

National Aeronautics and Space Administration
The Center for Science Education Space Sciences Laboratory University of California, Berkeley 7 Gauss Way, MC 7450 Berkeley, CA 94720-7450 http://cse.ssl.berkeley.edu
www.nasa.gov