
Space Surveillance Application Potential of Schottky ...
38
ESD-TR-86-142 Technical Report 772 Space Surveillance Application Potential of Schottky Barrier IR Sensors M.J. Cantella 9 April 1987 Lincoln Laboratory MASSACHUSETTS INSTITUTE OF TECHNOLOGY LEXINGTON, MASSACHUSETTS Prepared for the Department of the Air Foree under Electronir Systems Division Contract F19628-85-C.-0002. Approved for public release: distribution unlimited. Al£D«^
Transcript of Space Surveillance Application Potential of Schottky ...

ESD-TR-86-142
Technical Report 772
Space Surveillance Application Potential of Schottky Barrier IR Sensors
M.J. Cantella
9 April 1987
Lincoln Laboratory MASSACHUSETTS INSTITUTE OF TECHNOLOGY
LEXINGTON, MASSACHUSETTS
Prepared for the Department of the Air Foree under Electronir Systems Division Contract F19628-85-C.-0002.
Approved for public release: distribution unlimited.
Al£D«^

The work reported in this document was performed at Lincoln Laboratory, a center for research operated by Massachusetts Institute of Technology, with the support of the Department of the Air Force under Contract F19628-85-C-0002.
This report may be reproduced to satisfy needs of U.S. Government agencies.
The views and conclusions contained in this document are those of the contractor and should not be interpreted as necessarily representing the official policies, either expressed or implied, of the United States Government.
The ESD Public Affairs Office has reviewed this report, and it is releasable to the National Technical Information Service, where it will be available to the general public, including foreign nationals.
This technical report has been reviewed and is approved for publication.
FOR THE COMMANDER
/Lrv. §A^" Thomas J. Alpert, Major, USAF Chief, ESD Lincoln Laboratory Project Office
Non-Lincoln Recipients
PLEASE DO NOT RETURN
Permission is given to destroy this document when it is no longer needed.
MASSACHUSETTS INSTITUTE OF TECHNOLOGY LINCOLN LABORATORY
SPACE SURVEILLANCE APPLICATION POTENTIAL OF SCHOTTKY BARRIER IR SENSORS
M.J. CANTELLA Group 94
TECHNICAL REPORT 772
9 APRIL 1987
Approved for public release; distribution unlimited.
LEXINGTON MASSACHUSETTS

ABSTRACT
Schottky Barrier IR detection is based on the principle of internal photoemission at the surface between a Si substrate and a deposited metal. In a multi-element focal plane array (FPA), this phenomenon provides very high pixel-to-pixel uniformity, so the requirement for corrective signal processing is minimal. The use of standard silicon design and fabrication techniques simplifies detector readout and multiplexing functions and permits practical realization of sensors that contain very large staring focal planes. This report summarizes the status of FPA and camera development and includes typical imagery. For surveillance applications, the high sensitivity obtainable with these large staring arrays offers both signature and background phenomenology opportunities in the medium wavelength (MWIR) band which could not be exploited previously with scanning-type sensors. Examples of predicted surveillance sensor performance include (1) a near-term ground-based system for Day/Night detection of low-altitude space objects and (2) a future space-borne system for space missions. It is concluded that significant potential exists for future application of this technology.
in

TABLE OF CONTENTS
Abstract iii List of Illustrations vii List of Tables ix
1. SCHOTTKY BARRIER FOCAL PLANE ARRAY TECHNOLOGY 1
1.1 Attributes 1 1.2 Schottky Barrier Detection Principles and FPA Structures 2 1.3 Schottky Barrier FPA Spectral Responsivity 3 1.4 Thermal Imagery 4
2. SPACE SURVEILLANCE SENSOR REQUIREMENTS 7
3. SPACE SURVEILLANCE PERFORMANCE PREDICTION 9
3.1 Sensor Design Methodology 9 3.2 Phenomenology of the Space Surveillance Environment 10 3.3 Quantum and Photon-Collection Efficiency 12 3.4 Surveillance Sensor Range Performance 15
3.4.1 Sensitivity Analysis 15 3.4.2 Ground-Based MWIR Sensor Performance 16 3.4.3 Space-Borne MWIR Sensor Performance 17
4. SUMMARY 19
5. REFERENCES 21
APPENDIX A. RANGE PERFORMANCE COMPUTATION 23
A. 1 Range Equation 23
A. 1.1 Object and Background Exposure Components 23 A. 1.2 Noise Components 24 A. 1.3 SNR and Range Performance 25
A.2 Sensor Design and Performance Data 25

LIST OF ILLUSTRATIONS
Figure No. Page
1 Schottky Barrier Detection Principles 2
2 FPA Signal Integration and Readout 3
3 Schottky Barrier FPA Responsivity 4
4 Thermal Image of Woman's Face 5
5 Electro-Optical Space Surveillance 7
6 Sensor Design Criteria 9
7 Phenomenology Opportunities 10
8 Object and Background Radiance 11
9 Ground-to-Space Atmosphere 12
10 Detector Quantum Efficiency 13
11 Sensor Photon-Collection Efficiency 14
12 IR Sensor Sensitivity Analysis 15
13 Ground-Based MWIR Sensor Performance 16
14 Space-Borne MWIR Sensor Performance 17
VII

LIST OF TABLES
Table No. Page
1 Attributes of Schottky Barrier FPA Technology 1
2 Schottky Barrier Imaging Camera Specifications 4
3 Surveillance Sensor Performance Issues 8
4 Summary of Surveillance Sensor Potential 19
5 Ground-Based Sensor Performance Parameters 27 a. Geometry and Coverage Rates 27 b. Exposure and Noise 29
5 Space-Borne Sensor Performance Parameters 31 a. Geometry and Coverage Rates 31 b. Exposure and Noise 33
IX
SPACE SURVEILLANCE APPLICATION POTENTIAL OF SCHOTTKY BARRIER IR SENSORS
1. SCHOTTKY BARRIER FOCAL PLANE ARRAY TECHNOLOGY
1.1 ATTRIBUTES
Schottky barrier focal plane arrays (FPAs) have been under development since the early 1970s12'3, and they represent a promising alternative for implementation of an advanced space surveillance sensor. Currently available forms of these sensors cover the short and mid IR (SWIR and MWIR) bands to permit detection of both sunlight and thermal signatures. Advanced materials are currently under development to permit extension of operation to the long (LWIR) band for enhanced thermal response.
A list of attributes pertaining to these arrays is presented in Table 1. The monolithic silicon construction permits practical realization of very large arrays operating in a staring mode.
TABLE 1
Attributes of Schottky Barrier FPA Technology
Monolithic Silicon Construction
— Standard IC Materials and Processing
— FPAs Similar to Advanced Visible CCD Designs
Large Staring Sensors Feasible
— High Resolution
— High Uniformity for Simplified Signal Processing
— Multispectral/Multifunction Capability
— Low Refrigeration Load
Advanced techniques developed for multiplexing and readout of visible and other FPAs can be incorporated readily into Schottky Barrier FPA designs. Operation in a staring mode is made practical by the extremely high uniformity (rms non-uniformity < l%) exhibited by this technology. The realization of large staring FPAs makes possible the design of a mosaic of taskable sensor segments of high resolution, high sensitivity, and high traffic handling capability.
1.2 SCHOTTKY BARRIER DETECTION PRINCIPLES AND FPA STRUCTURES
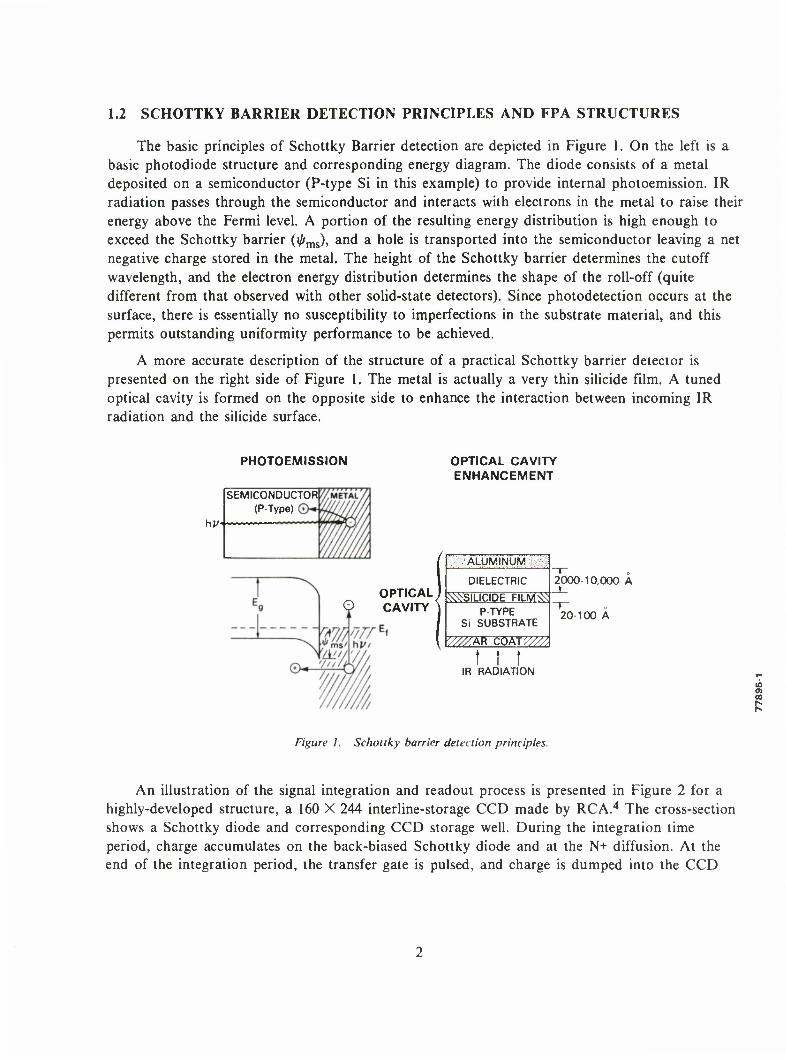
The basic principles of Schottky Barrier detection are depicted in Figure 1. On the left is a basic photodiode structure and corresponding energy diagram. The diode consists of a metal deposited on a semiconductor (P-type Si in this example) to provide internal photoemission. IR radiation passes through the semiconductor and interacts with electrons in the metal to raise their energy above the Fermi level. A portion of the resulting energy distribution is high enough to exceed the Schottky barrier (i/rms), and a hole is transported into the semiconductor leaving a net negative charge stored in the metal. The height of the Schottky barrier determines the cutoff wavelength, and the electron energy distribution determines the shape of the roll-off (quite different from that observed with other solid-state detectors). Since photodetection occurs at the surface, there is essentially no susceptibility to imperfections in the substrate material, and this permits outstanding uniformity performance to be achieved.
A more accurate description of the structure of a practical Schottky barrier detector is presented on the right side of Figure 1. The metal is actually a very thin silicide film. A tuned optical cavity is formed on the opposite side to enhance the interaction between incoming IR radiation and the silicide surface.
PHOTOEMISSION
SEMICONDUCTOR (P-Type)
OPTICAL CAVITY ENHANCEMENT
OPTICAL Q CAVITY
ALUMINUM
DIELECTRIC
^SILICIDE FILMS^ P-TYPE
Si SUBSTRATE
'////<** COAT^
2000-10,000 A
20-100 A
f t f IR RADIATION
Figure 1. Schottky barrier detection principles.
An illustration of the signal integration and readout process is presented in Figure 2 for a highly-developed structure, a 160 X 244 interline-storage CCD made by RCA.4 The cross-section shows a Schottky diode and corresponding CCD storage well. During the integration time period, charge accumulates on the back-biased Schottky diode and at the N+ diffusion. At the end of the integration period, the transfer gate is pulsed, and charge is dumped into the CCD

INTERLINE STORAGE CCD (RCA)
ALUMINUM
CCD TRANSFER
GATE
P" CHANNEL STOP-
;2v \ ptst j £
\ y; ACTIVE [V ^~^-:•••••'
-/ j j t ft t N- BCCI
244 GUARD jjr_ RING
IR RADIATION BCCD IMPLANT
P" SUBSTRATE
DETECTOR CCD \*— WELL-H |-*-WELL-*-
RECENTLY DEMONSTRATED CONFIGURATIONS • 128 x 128 HYBRID (Hughes) • 128 X 128 CHARGE-INJECTION CCD (RCA)
Figure 2. FPA signal integration and readout.
storage register. Serial readout is accomplished by charge transfer, first line-by-line into a serial storage register and then to the output amplifier. A fill-factor of 0.39 has been achieved with this architecture.
Other forms of Schottky barrier staring FPAs have been demonstrated recently. Hughes has constructed and tested a 128 X 128 hybrid array.5 In this structure, an In-bump bond is used to connect each Schottky barrier diode to a busing structure used for readout. A fill-factor of 0.85 has been attained.
Another structure, successfully demonstrated by RCA, has the Schottky silicide formed as a continuous surface on the IR-radiation side of the structure.6 The Si substrate is thinned to approximately 25 /xm to provide a drift region for emitted electrons to journey to the CCD wells on the opposite side. A field gradient is maintained across the substrate to prevent lateral spread of charge. This structure provides a fill-factor of 1.0 and represents a straightforward approach for adaptation of Schottky barrier IR response to almost any type of Si multiplexing structure (visible frame-storage CCD, etc.).
1.3 SCHOTTKY BARRIER FPA SPECTRAL RESPONSIVITY
Typical responsivity characteristics are presented in Figure 3. The Pd2Si surface covers the SWIR bands and operates at a temperature of approximately 140 K. Both frame-storage and line-scan devices have been operated successfully. The PtSi surface covers both SWIR and MWIR bands, and requires cooling to approximately 80 K. This device has been applied principally in the frame-storage mode, and extremely good thermal sensitivity has been demonstrated.

*••—I l—T 5 s <
t 10- > to z o Q. CO UJ tr
10''
10 ,-3
i—i—i—i—i—i—i—i—r
PtSi
i i i i i
IrSi '\ (Projected)
\ \
\ I l l V
0 2 4 6 8 10 12 14 16 WAVELENGTH (jum)
Figure 3. Schottky barrier FPA responsivity.
There is a need to extend the thermal sensitivity of Schottky barrier FPAs even further for future low-background, space-borne surveillance applications. Various approaches are being pursued, and the projected responsivity for an IrSi surface is also presented in Figure 3. This surface is expected to have a cut-off wavelength of 16 /urn and require cooling to approximately 40 K. The extended thermal response combined with staring-mode operation would provide significant improvement in range performance.
1.4 THERMAL IMAGERY
Thermal images have been obtained with a 160 X 244 element Schottky barrier FPA camera whose principal specifications are presented in Table 2. Note that the excellent thermal sensitivity of 0.03° C has been achieved with a nonsophisticated, 12-bit, linear-offset signal processor.
TABLE 2
Schottky Barrier Imaging Camera Specifications
Optics: 100 mm, f/1.8
FPA: 160 H X 244 V Pixels, Interlaced
Video Format: 30 FPS, Std TV Raster
Fixed Pattern Noise Correction: 12-Bit Additive
Sensitivity: NEAT = 0.03°C
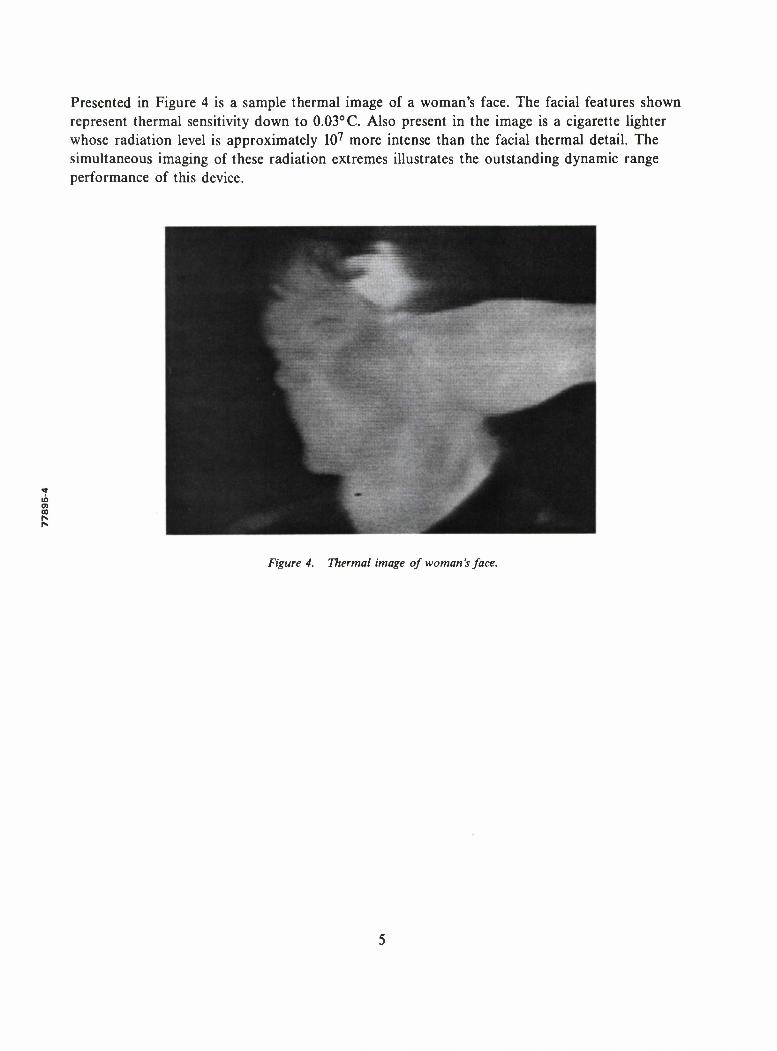
Presented in Figure 4 is a sample thermal image of a woman's face. The facial features shown represent thermal sensitivity down to 0.03° C. Also present in the image is a cigarette lighter whose radiation level is approximately 107 more intense than the facial thermal detail. The simultaneous imaging of these radiation extremes illustrates the outstanding dynamic range performance of this device.
Figure 4. Thermal image of woman's face.

2. SPACE SURVEILLANCE SENSOR REQUIREMENTS
With the rapid increase in number of orbiting space objects, there is a need to upgrade current electro-optical (E/O) space surveillance capability. A network of sensors, located on the ground and/or in space, could contribute significantly to operational capability. A list of possible missions and the basic geometry of space surveillance are presented in Figure 5.
in
O -i z
POST-LAUNCH ACQUISITION/TRACK
CATALOG MAINTENANCE MANEUVER DETECTION
OVERFLIGHT WARNING
SAT ATTACK WARNING ASAT SUPPORT
BM SEARCH/TRACK (SDI)
SIGNATURE DATA
VISIBLE
Figure 5. Electro-optical space surveillance.
The population of space objects occupies a huge volume, with a concentration at low altitude (100 km to 1400 km), and with a significant total number in deep space (to approximately 80,000 km). Requirements for timeliness of coverage of this volume can vary between approximately 10 s and several days, depending on specific mission requirements.
Today's E/O sensor capability is represented by visible-spectrum sensors, located on the ground in the earth-shadow region (night), with excellent capability for acquisition and track of deep space objects illuminated by sunlight. These sensors can also handle low-altitude objects located in the twilight regions, but objects in the shadow region are not detectable. Capability for engaging low-altitude objects from ground-based sensors located on the sun-illuminated (day) side
of the earth has been demonstrated with developmental instrumentation, but capability is restricted by the high level of sunlight background scattered by the atmosphere.
Atmospheric scattering could be avoided in future space-borne visible spectrum sensors. However, coverage would be limited to above the bright earth limb, and optics of sophisticated design would be needed to provide adequate rejection of this limb radiation. These visible sensors would not be capable of detecting objects in the earth shadow either.
The infrared (IR) spectrum offers an opportunity for significant extension of surveillance capability. The earth shadow region as well as the sunlit region could be covered by use of object thermal emission signatures. However,, the earth's atmosphere emits in the IR spectral regions and produces background that must be accommodated. In addition, ground-based systems must cope with losses in atmospheric transmission.
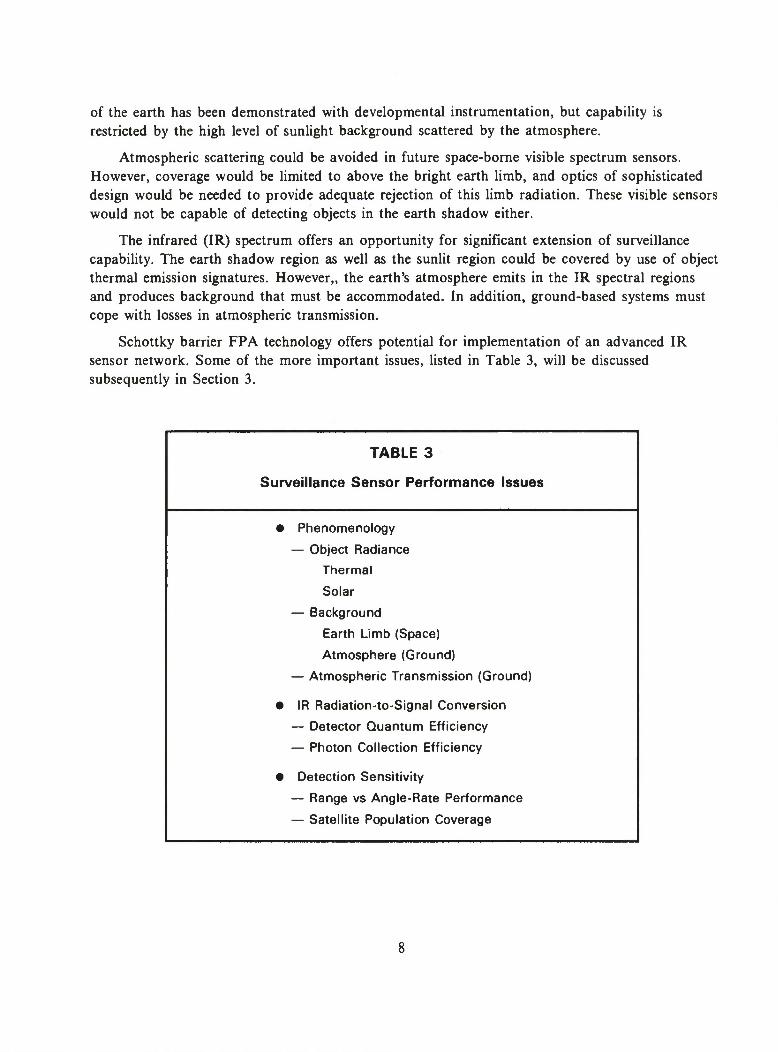
Schottky barrier FPA technology offers potential for implementation of an advanced IR sensor network. Some of the more important issues, listed in Table 3, will be discussed subsequently in Section 3.
TABLE 3
Surveillance Sensor Performance Issues
• Phenomenology
— Object Radiance
Thermal
Solar
— Background
Earth Limb (Space)
Atmosphere (Ground)
— Atmospheric Transmission (Ground)
• IR Radiation-to-Signal Conversion
— Detector Quantum Efficiency
— Photon Collection Efficiency
• Detection Sensitivity
— Range vs Angle-Rate Performance
— Satellite Population Coverage
3. SPACE SURVEILLANCE PERFORMANCE PREDICTION
3.1 SENSOR DESIGN METHODOLOGY
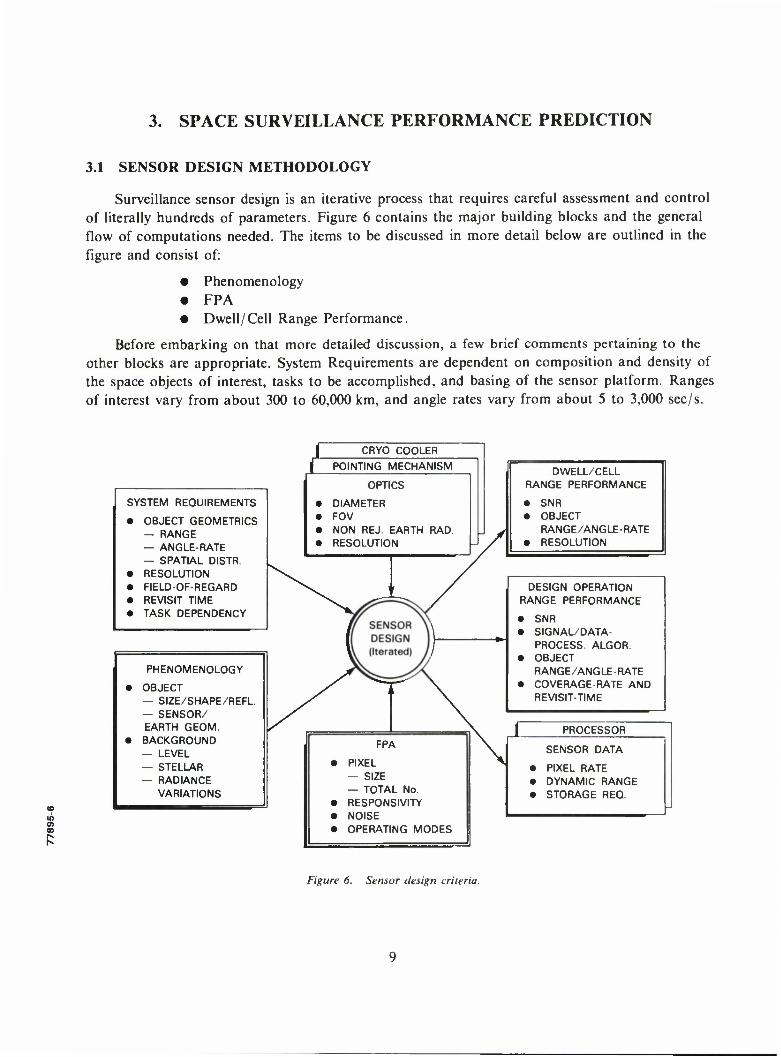
Surveillance sensor design is an iterative process that requires careful assessment and control of literally hundreds of parameters. Figure 6 contains the major building blocks and the general flow of computations needed. The items to be discussed in more detail below are outlined in the figure and consist of:
• Phenomenology • FPA • Dwell/Cell Range Performance.
Before embarking on that more detailed discussion, a few brief comments pertaining to the other blocks are appropriate. System Requirements are dependent on composition and density of the space objects of interest, tasks to be accomplished, and basing of the sensor platform. Ranges of interest vary from about 300 to 60,000 km, and angle rates vary from about 5 to 3,000 sec/s.
CRYO COOLER
SYSTEM REQUIREMENTS
• OBJECT GEOMETRICS — RANGE — ANGLE RATE — SPATIAL DISTR.
• RESOLUTION • FIELD-OF-REGARD • REVISIT TIME • TASK DEPENDENCY
PHENOMENOLOGY
OBJECT — SIZE/SHAPE/REFL. — SENSOR/ EARTH GEOM. BACKGROUND — LEVEL — STELLAR — RADIANCE
VARIATIONS
m
ao
POINTING MECHANISM
OPTICS
• DIAMETER • FOV • NON REJ. EARTH RAD. • RESOLUTION
DWELL/CELL RANGE PERFORMANCE
• SNR • OBJECT
RANGE/ANGLE-RATE • RESOLUTION
1 \
FPA
• PIXEL — SIZE — TOTAL No.
• RESPONSIVITY • NOISE • OPERATING MODES
DESIGN OPERATION RANGE PERFORMANCE
• SNR • SIGNAL/DATA-
PROCESS. ALGOR • OBJECT
RANGE/ANGLE-RATE • COVERAGE-RATE AND
REVISIT-TIME
1 PROCESSOR
SENSOR DATA
• PIXEL RATE • DYNAMIC RANGE • STORAGE REQ
Figure 6. Sensor design criteria.

Revisit times can vary from a few seconds to days. The urgency of surveillance data combined with the resolution requirement has a strong influence on the design and performance needed from the sensor and data-processor subsystems.
The optics design requirements for a space surveillance sensor are of considerable importance. Especially for a space-borne configuration, the need for earth-limb radiation shields and for cryogenic cooling can create a significant size and weight burden.
Two variants of Sensor Range Performance as a function of Object Angle-rate are shown in Figure 6. In Dwell-in-Cell performance, it is assumed that sensor integration time is adjusted for each value of angle-rate so that the object moves just one resolution element. This represents nearly optimum performance for a simple threshold-detection processor and provides good first- order assessment of any design candidate. This type of performance will be discussed in more detail below. Design-Operation Range Performance pertains to a particular design operating in a particular mode and can be above or below the Dwell-in-Cell limit, depending on the sophistication of the Signal and Data Processors and on the system coverage rate requirements.
3.2 PHENOMENOLOGY OF THE SPACE SURVEILLANCE ENVIRONMENT
Presented in Figure 7 are alternative spectral-band opportunities for passive and active surveillance sensors. Those pertaining to Schottky barrier FPA technology are the SWIR and MWIR bands. This technology offers a natural match between FPA responsivity and the radiation available from plume and laser signatures. A less obvious capability pertains to cold- body signature detection based on thermal emission and solar reflection, both supplemented by earthshine. Therefore, this discussion will concentrate on operation with passive, cold-body signatures.
SCHOTTKY BARRIER SWIR/MWIR SPECTRAL BANDS
SPECTRAL REGION
OBJECT SIGNATURES
EMISSION REFLECTION
THERMAL PBV
PLUME* SOLAR EARTHSHINE LASER*
UV 'W9i mm VISIBLE 7WA wm SWIR ftzWxfo. MWIR X X X
LWIR /W%% Hi 'PROVIDES BELOW HORIZON COVERAGE ALSO X EMPHASIS FOR PRESENTATION
O)
Figure 7. Phenomenology opportunities.
10

Figure 8 presents typical Spectral Radiance data for a space-borne surveillance sensor. Historically, deep-space optical surveillance systems have operated at night in the Visible spectrum where sunlight is very bright and earth and earth-limb backgrounds can be avoided. More recently, LWIR systems have been under development to take advantage of the high level of thermal radiation available beyond approximately 8 /xm. The LWIR band also contains a high level of earth-limb background which is difficult to reject.
TYPICAL OBJECT TYPICAL ATH BACKGROUND (Space-Borne Sensor)
E 10 2
3. E =1
1
, REFLECTED SOLAR FLUX 80 km TANGENT HEIGHT
s jr~t LAMBERTIAN REFLECTOR • • ,SOLAR AURORAL
f \ P = 01 IN E
10 2- / SCATTERING / ENHANCEMENT
A. 4,/N » M\ THERMAL E Q / \ 300 K GRAY BODY
0
5 io-3 / \ J -e = 0.9 5 104 — * ll' 1 rEMISSI0N
** UJ UJ O IO8- #* V u z >l 'y \ z < ~ 1 ~/ > < 5 10-8- '*- ^ § 104 < v/ \ — 1 DC V \
K J 10"10_ NONEQUILIBRIUM _j < EMISSION < K CE 1-
O 10"12- O UJ
tf 105 i , a. 10 14 a. IU IU i (0 1 01 1 10 1( )2
10"1 1 10 1C
WAVELENGTH (/im) WAVELENGTH (/Urn)
Figure 8. Object and background radiance.
The MWIR band is characterized as containing less thermal and solar radiation than either Visible or LWIR bands, but the earth-limb background is also significantly less. On the basis of background-noise-limited performance, the MWIR band should permit achievement of sensitivity performance levels comparable with that of the LWIR band with the inherent advantage of improved diffraction-limited resolution. The MWIR band has not been exploited in the past because sensors of adequate sensitivity have not been available. Schottky barrier FPAs offer this opportunity. A discussion on methods for achievement of adequate sensitivity will be presented in Sections 3.3 and 3.4.
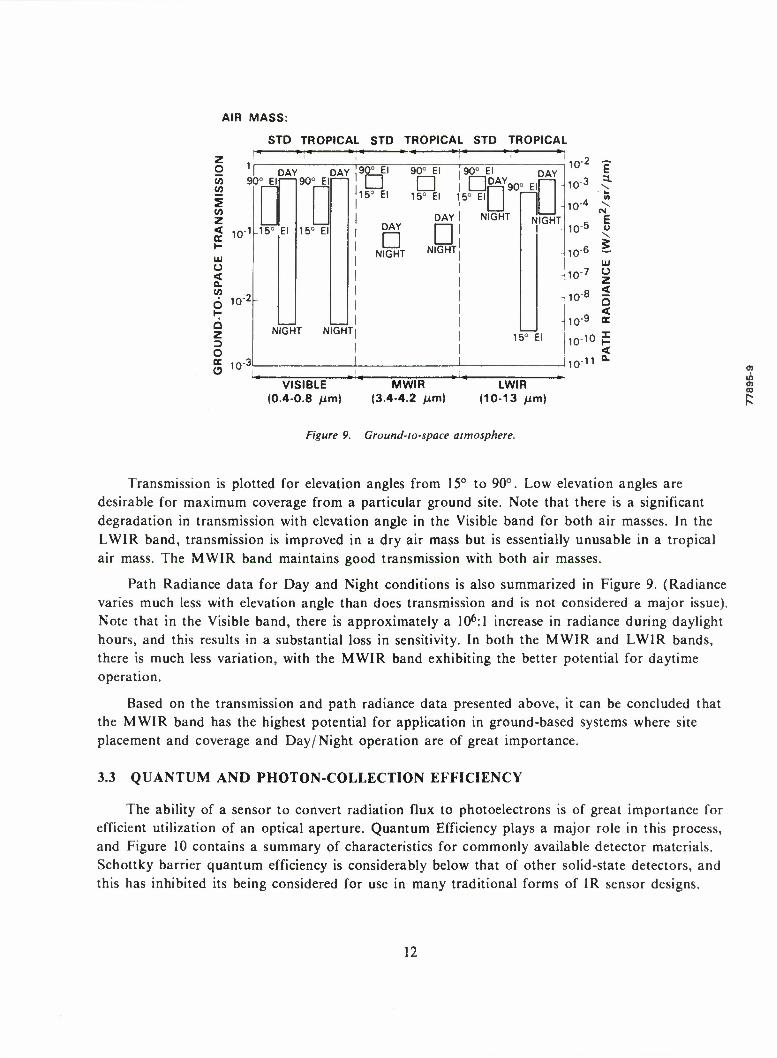
The phenomenology associated with ground-to-space atmosphere is of particular importance for ground-based surveillance sensors. Transmission losses affect the level of signal available, and background noise is produced by radiation from both thermal-emission and scatter. Data has been obtained from available measurements and from the USAF Geophysics Laboratory LOWTRAN program. Figure 9 contains a summary of the more important characteristics associated with both dry and tropical air masses.
11
AIR MASS:
STD TROPICAL STD TROPICAL STD TROPICAL
z o (/> </)
c/j z < QC
ixl O < o. V)
6 Q Z
o
1f 90° El
DAY DAY 90° E' 90° El ,90° El
10" ^15° El
10"
10"
90° El
15° El
a. • ID ]15° El 15° El 15°
DAY I NIGHT °EID
DAY 90° El
DAY I 1
3 U NIGHT N|GHT
NIGHT NIGHTi
NIGHT
15° El
VISIBLE (0.4-0.8 fitn)
MWIR (3.4-4.2 /xm)
LWIR (10-13 |Um)
2 E •3 ^
VI
S CM
E o S
»-6
,6 i
-8 2
0-10 f <
n-11 °"
Figure 9. Ground-to-space atmosphere.
Transmission is plotted for elevation angles from 15° to 90°. Low elevation angles are desirable for maximum coverage from a particular ground site. Note that there is a significant degradation in transmission with elevation angle in the Visible band for both air masses. In the LWIR band, transmission is improved in a dry air mass but is essentially unusable in a tropical air mass. The MWIR band maintains good transmission with both air masses.
Path Radiance data for Day and Night conditions is also summarized in Figure 9. (Radiance varies much less with elevation angle than does transmission and is not considered a major issue). Note that in the Visible band, there is approximately a 106:1 increase in radiance during daylight hours, and this results in a substantial loss in sensitivity. In both the MWIR and LWIR bands, there is much less variation, with the MWIR band exhibiting the better potential for daytime operation.
Based on the transmission and path radiance data presented above, it can be concluded that the MWIR band has the highest potential for application in ground-based systems where site placement and coverage and Day/Night operation are of great importance.
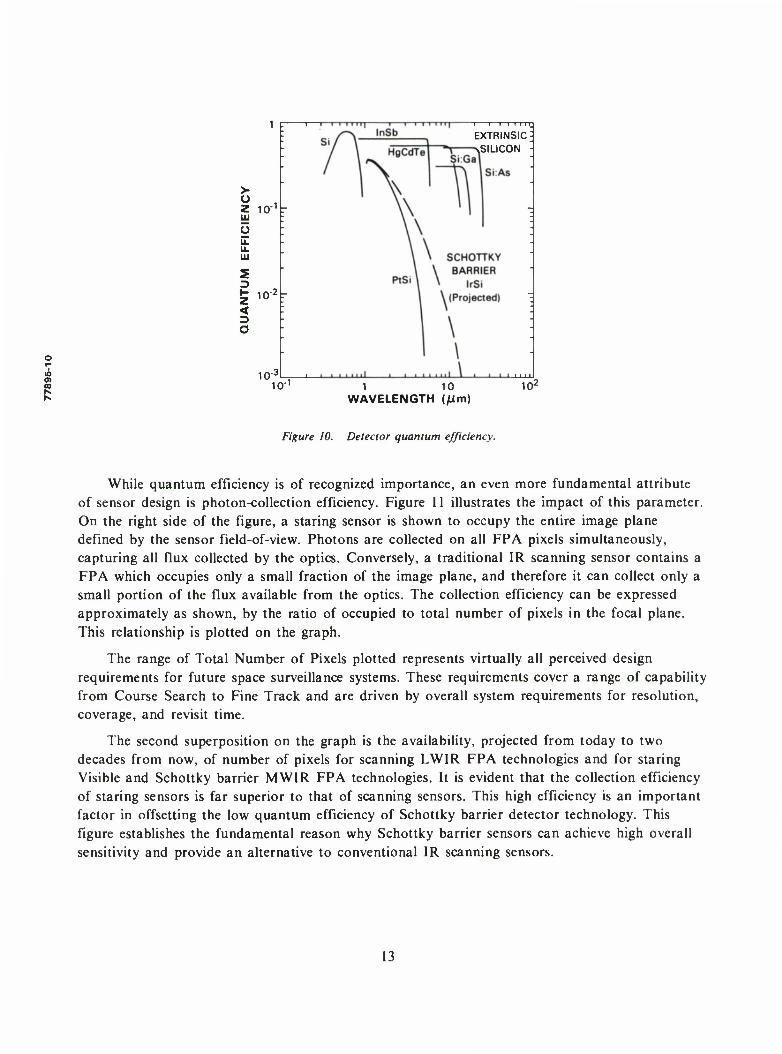
3.3 QUANTUM AND PHOTON-COLLECTION EFFICIENCY
The ability of a sensor to convert radiation flux to photoelectrons is of great importance for efficient utilization of an optical aperture. Quantum Efficiency plays a major role in this process, and Figure 10 contains a summary of characteristics for commonly available detector materials. Schottky barrier quantum efficiency is considerably below that of other solid-state detectors, and this has inhibited its being considered for use in many traditional forms of IR sensor designs.
12
o Z 10"1
III o E u. UJ
1 £ 10-2
< a
10' 10
EXTRINSIC \SILICON
1 10 WAVELENGTH (/im)
10'
Figure 10. Detector quantum efficiency.
While quantum efficiency is of recognized importance, an even more fundamental attribute of sensor design is photon-collection efficiency. Figure 11 illustrates the impact of this parameter. On the right side of the figure, a staring sensor is shown to occupy the entire image plane defined by the sensor field-of-view. Photons are collected on all FPA pixels simultaneously, capturing all flux collected by the optics. Conversely, a traditional IR scanning sensor contains a FPA which occupies only a small fraction of the image plane, and therefore it can collect only a small portion of the flux available from the optics. The collection efficiency can be expressed approximately as shown, by the ratio of occupied to total number of pixels in the focal plane. This relationship is plotted on the graph.
The range of Total Number of Pixels plotted represents virtually all perceived design requirements for future space surveillance systems. These requirements cover a range of capability from Course Search to Fine Track and are driven by overall system requirements for resolution, coverage, and revisit time.
The second superposition on the graph is the availability, projected from today to two decades from now, of number of pixels for scanning LWIR FPA technologies and for staring Visible and Schottky barrier MWIR FPA technologies. It is evident that the collection efficiency of staring sensors is far superior to that of scanning sensors. This high efficiency is an important factor in offsetting the low quantum efficiency of Schottky barrier detector technology. This figure establishes the fundamental reason why Schottky barrier sensors can achieve high overall sensitivity and provide an alternative to conventional IR scanning sensors.
13

LLI
z
ui
< 5
O w z LU (/) o z cc
r i II
(0 2 _
i! x. < \. 2
> o LL
O 5 Z £
si 1- V)
-
X. N. *^\
\r«g /M\
^' X/VVX/^
//1s
1 1 1 X tf
roo
O
< 0.
o < - 0.
z LU
LU
1 I I I 3 -c a, k O s
3
IS — O
o z
•h
O
i») ADN3IDIdJ3 N0I103TI0D in
oo
14

3.4 SURVEILLANCE SENSOR RANGE PERFORMANCE
3.4.1 Sensitivity Analysis
Computation of sensor sensitivity requires a large number of parameters as shown in Figure 12. In addition to the quantities discussed above, note that signature components include earth-shine, and background components include telescope and cold-shield radiation and FPA dark current. Also included are system requirements for angular resolution and for coverage. These parameters are combined appropriately to compute exposure and noise. For a fixed SNR criterion, sensor performance can be expressed in terms of Range vs Angle-Rate for various environmental conditions. Details of this computational procedure are presented in Appendix A.
The utility of this type of sensor performance can be assessed by a comparison with independently determined Range vs Angle-Rate characteristics of satellite populations of interest.
SIGNATURES
O) 00
Figure 12. IR sensor sensitivity analysis.
15

3.4.2 Ground-Based MWIR Sensor Performance
Range performance has been computed for a system designed with a near-term PtSi type of Schottky barrier FPA and with the telescope located at Lincoln Laboratory's Electro-optical Test Site. Performance for detection of fairly large satellites under Day and Night conditions is presented in Figure 13.
DWELL-IN-CELL LIMIT
T 1 1 1 1 1 1 1 1 r
800 1200 1600 2000 ANGLE RATE (sec/s)
2400 2800
Figure 13. Ground-based MWIR sensor performance.
Note that range decreases with Angle-Rate because of reduced resolution-element integration time. Day performance is somewhat higher than that of Night principally because solar radiation adds substantially to thermal emission and because daytime atmospheric path radiance is low in the MWIR region.
Overlaid on Figure 13 is a Range vs Angle-Rate region associated with low-altitude circular- orbit satellites observed between elevation angles of 15 and 90 degrees. These angle-rates have a sidereal reference and correspond to operation of the sensor in an autonomous, open-search mode in which stars are immobilized during the integration time period to facilitate their rejection by a Moving Target Indicator (MTI) type of signal processor. This open-search mode is the most demanding; however, Figure 13 indicates that essentially all satellites will be detected in the daytime and approximately 75% of them will be detected at night. For ground surveillance sensors of this type deployed as a fence, observed satellites will be clustered near the lower boundary of the population presented in Figure 13, and this will permit virtually all satellites to be detected under both Day and Night conditions.
16

At low angle-rates, Range performance is substantially above the maximum range of low- altitude satellites. This performance margin could be employed effectively, with some a priori knowledge of satellite location, for detection, track, or signature analysis of much smaller objects.
3.4.3 Space-Borne MWIR Sensor Performance
Figure 14 contains Range vs Angle-Rate performance predicted for a space-borne sensor designed with an advanced IrSi FPA. Performance is plotted for a family of object cross-sections of 0.5 and 5 m2. Superimposed on these characteristics are both near-earth and deep-space satellite populations as observed from a sensor located on a 5,600 nmi altitude platform and with line-of-sight stabilized to inertial space. This represents a completely autonomous open-search capability. A comparison of the characteristics of Figure 14 indicates that this capability will be realized for objects of 0.5 m2 in the near-earth population and 0.5 to 3 m2 in the deep-space population.
At low angle-rates, the indicated Range performance margin could be employed to observe even smaller objects for which some a priori knowledge of location is available.
in o> CO
E 5
z <
DWELL-IIM-CELL LIMIT
60 i r i i i NI i i i i i i i i i i i i
- ^^CROSS SECTION = 5 m2
50 \ ^""-^^^^ T = 300 K -
\ IrSi SCHOTTKY BARRIER CCD """
40 \ OPTICS D = 1.2 m
\ SNR = 6
30 • \
\ DEEP-SPACE OBJECTS \ (5,600 nmi Alt Platform)
20 ^^-^X^ CROSS SECTION = 0.5 m2 - /~~ "^ T = 300 K /INtAM-LAItlM-UUJfcCTS "^\
10 / (5,600 nmi Alt Platform) tt
0 i i i i i i i i i i i > i i i i i >
0 20 40 60 80 100 120 140 160 180 200
ANGLE RATE (sec/s)
Figure 14. Space-borne MWIR sensor performance.
17
4. SUMMARY
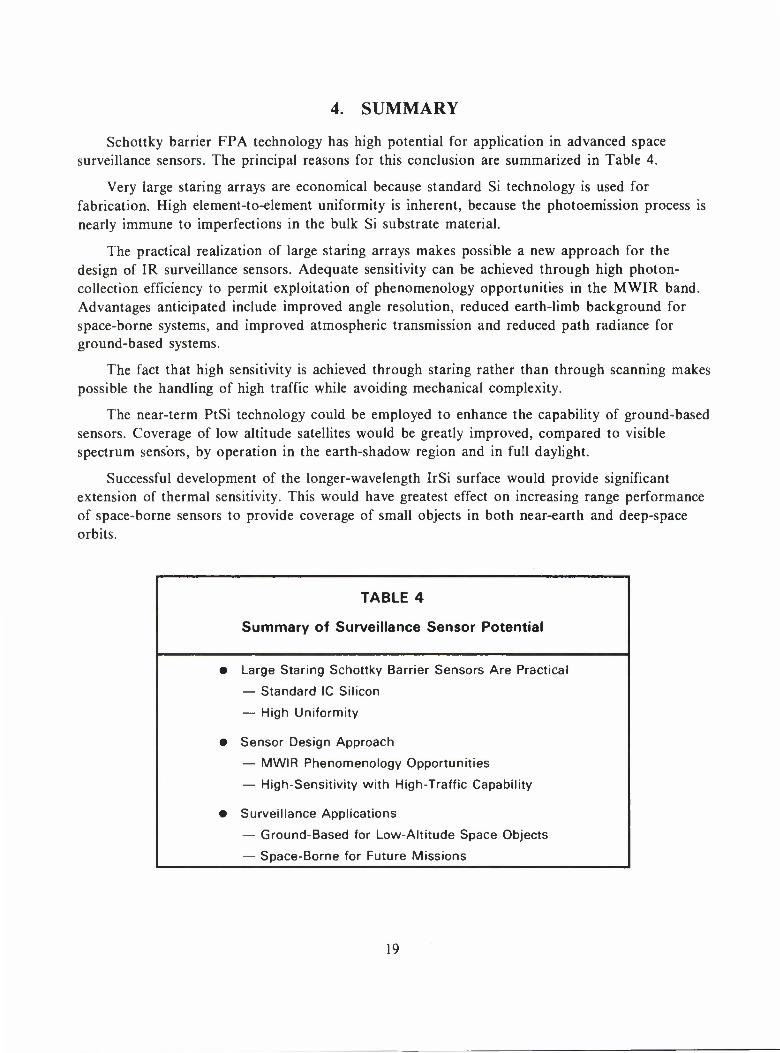
Schottky barrier FPA technology has high potential for application in advanced space surveillance sensors. The principal reasons for this conclusion are summarized in Table 4.
Very large staring arrays are economical because standard Si technology is used for fabrication. High element-to-element uniformity is inherent, because the photoemission process is nearly immune to imperfections in the bulk Si substrate material.
The practical realization of large staring arrays makes possible a new approach for the design of IR surveillance sensors. Adequate sensitivity can be achieved through high photon- collection efficiency to permit exploitation of phenomenology opportunities in the MWIR band. Advantages anticipated include improved angle resolution, reduced earth-limb background for space-borne systems, and improved atmospheric transmission and reduced path radiance for ground-based systems.
The fact that high sensitivity is achieved through staring rather than through scanning makes possible the handling of high traffic while avoiding mechanical complexity.
The near-term PtSi technology could be employed to enhance the capability of ground-based sensors. Coverage of low altitude satellites would be greatly improved, compared to visible spectrum sensors, by operation in the earth-shadow region and in full daylight.
Successful development of the longer-wavelength IrSi surface would provide significant extension of thermal sensitivity. This would have greatest effect on increasing range performance of space-borne sensors to provide coverage of small objects in both near-earth and deep-space orbits.
TABLE 4
Summary of Surveillance Sensor Potential
Large Staring Schottky Barrier Sensors Are Practical
— Standard IC Silicon
— High Uniformity
Sensor Design Approach
— MWIR Phenomenology Opportunities
— High-Sensitivity with High-Traffic Capability
Surveillance Applications
— Ground-Based for Low-Altitude Space Objects
— Space-Borne for Future Missions
19

5. REFERENCES
1. F.D. Shepherd, R.W. Taylor, L.H. Skolnik, B.R. Capone, S.A. Roosild, W.F. Kosonocky, and E.S. Kohn, "Schottky IRCCD Thermal Imaging," Advances in Electronics and Electron Physics, Vol. 52, pp. 495-512, 1979.
2. R.W. Taylor, L.H. Skolnik, B.R. Capone, W. Ewing, F.D. Sheperd, S.A. Roosild, B. Cockrun, M.J. Cantella, J.J. Klein, and W.F. Kosonocky, "Improved Platinum Silicide IRCCD Focal Plane," SPIE, Vol. 217, pp. 103-110, 1980.
3. F.D. Shepherd, Jr., "Schottky Diode Based Infrared Sensors", SPIE, Vol. 443, 1984.
4. W.F. Kosonocky, F.V. Shallcross, T.S. Villani, J.V. Groppe, M.J. Cantella, R. Merlino, and J.J. Klein, "Design, Performance, and Application of 160 X 244-Element IR-CCD Imager", Proc. 32nd National Infrared Information Symposium, May 1984.
5. J. Gates and R. Wyles, "256 X 256 Hybrid Schottky Focal Planes for Missile Seekers", Proc. Infrared Information Symposium Specialty Group on Infrared Dectectors, August 1986.
6. W.F. Kosonocky, T.S. Villani, F.V. Shallcross, J.V. Groppe, and J.J. O'Neill, III, "Direct Schottky Injection Imagers", Proc. Infrared Information Symposium Specialty Group on Infrared Dectectors, August 1986.
7. M.J. Cantella, "IR Focal Plane Array System Performance Modeling", SPIE, 1982.
8. M.I. Skolnik, Radar Handbook, McGraw-Hill, 1970.
21
APPENDIX A RANGE PERFORMANCE COMPUTATION
A.l RANGE EQUATION
A. 1.1 Object and Background Exposure Components
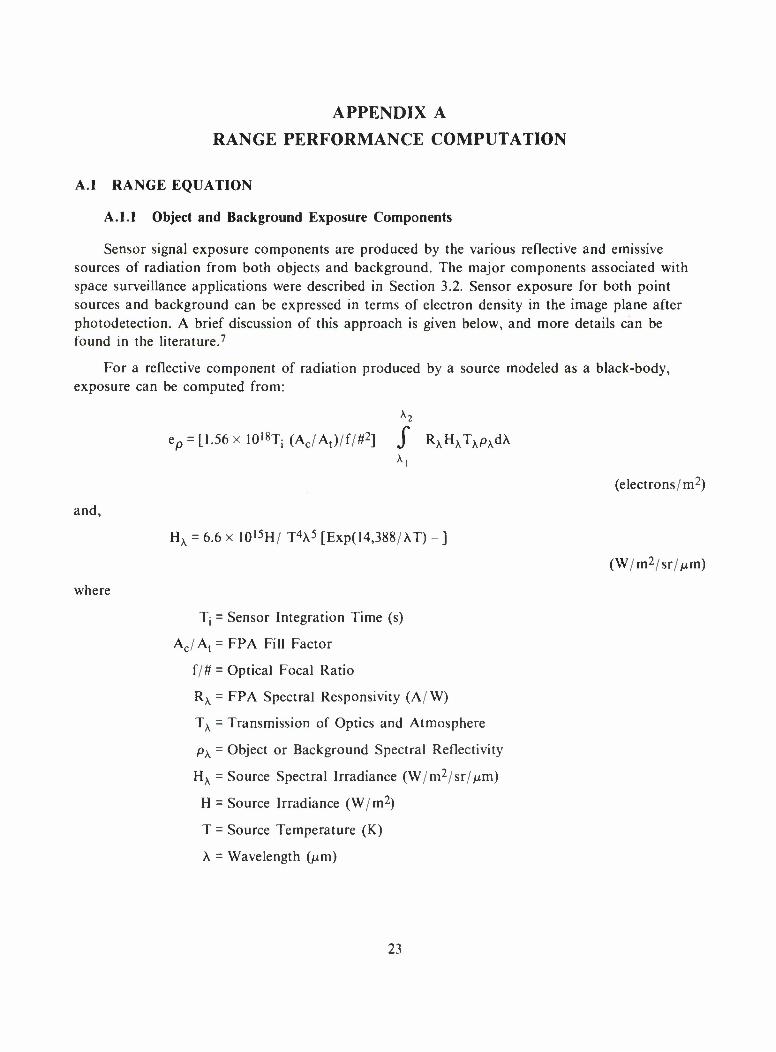
Sensor signal exposure components are produced by the various reflective and emissive sources of radiation from both objects and background. The major components associated with space surveillance applications were described in Section 3.2. Sensor exposure for both point sources and background can be expressed in terms of electron density in the image plane after photodetection. A brief discussion of this approach is given below, and more details can be found in the literature.7
For a reflective component of radiation produced by a source modeled as a black-body, exposure can be computed from:
ep = [1.56 x lO'STj (Ac/At)/f/#2] J RAHATxPxd\
(electrons/m2)
*i
and,
where
Hk = 6.6 x 10¹⁵H/ T4A5 [Exp(14,388/AT) - ]
Tj = Sensor Integration Time (s)
Ac/At = FPA Fill Factor
f/# = Optical Focal Ratio
Rx = FPA Spectral Responsivity (A/W)
TA = Transmission of Optics and Atmosphere
pK = Object or Background Spectral Reflectivity
HA = Source Spectral Irradiance (W/m2/sr/)um)
H = Source Irradiance (W/m2)
T = Source Temperature (K)
A = Wavelength (fim)
(W/m2/sr//xm)
23

Similarly, for exposure from thermal emission,
e [5.85 x 1026 Tj (Ac/ At)/f/#2] f RxTxexdX/ \5 [Exp(14,388/AT) - 1]
(electrons/m2)
*i
where
ex = Object or Background Spectral Emissivity
T = Object or Background Temperature (K)
These exposure expressions are used to compute each component of signal and background, and the totals are obtained simply by addition.
In a detection process, signal originates from the difference between exposure from the object and that from the adjacent background. If the object is located in front of (occludes) the background, the difference signal is the difference between signal and background exposures, but if the object is in back, the difference is simply the object exposure. At this stage of the analysis, signals from both object and background are treated as through resolved by the sensor.
A.1.2 Noise Components
In a space surveillance system, at the long ranges of interest, objects are not resolved but appear as point sources. The distribution of exposure from the object is described by the point response of the sensor. This response results from the cascade of optics and FPA and is determined by convolution of the spread functions of these separate components. For white-noise, an optimum detection scheme would contain a two-dimensional filter which is an optimum match8 to the overall sensor point response. Under these conditions, the actual point response can be approximated, for economy of bookkeeping, by a square aperture function which is noise- equivalent to the actual one. This is defined as the spread factor, and its size is determined by making its cross-sectional area equal to the area obtained by integration under the square of the actual response.
For first-order performance assessment, a constant signal-to-noise ratio (SNR) criterion is appropriate, and the detection threshold is set by the tolerable false-alarm-rate within the total field-of-view. Background noises are the most important in determining false alarm probability because the number of their resolution elements greatly exceeds that of a point signal. The background noise variance is computed from the product of the background noise variance density and the area of the noise-equivalent spread factor. The rms noise can therefore be expressed as:
N = 10-3 Ssqrt [KeB + (MeB/2)2 + en]
(electrons)
24
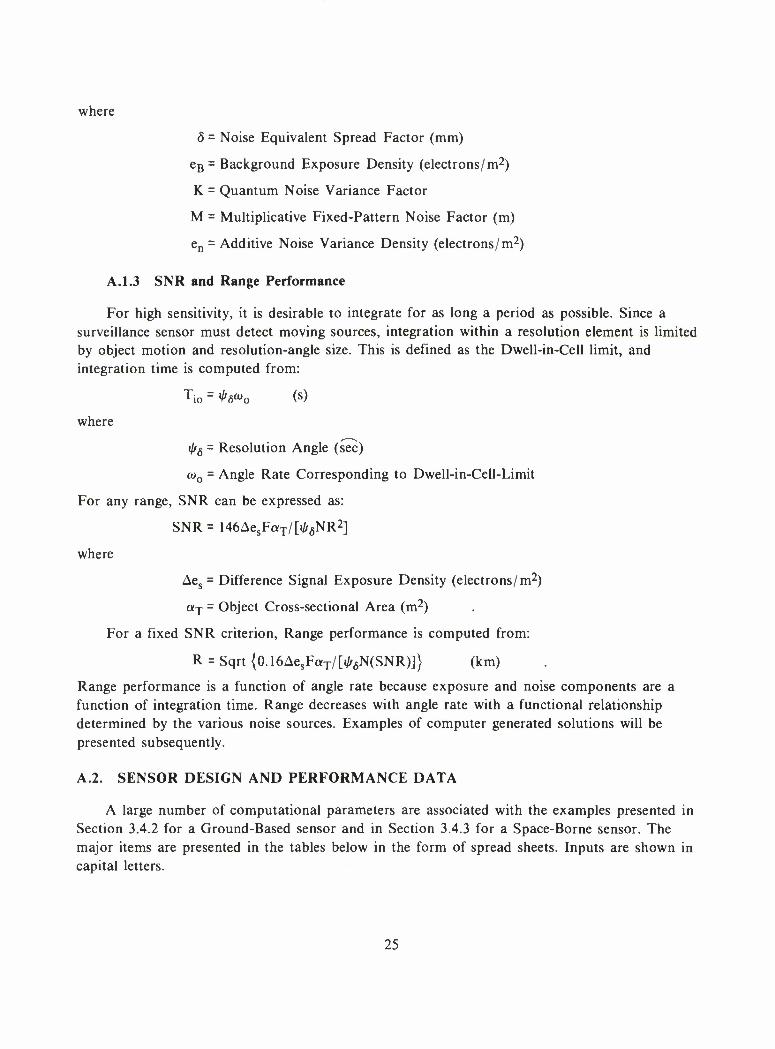
where
5 = Noise Equivalent Spread Factor (mm)
eB = Background Exposure Density (electrons/m2)
K = Quantum Noise Variance Factor
M = Multiplicative Fixed-Pattern Noise Factor (m)
en = Additive Noise Variance Density (electrons/ m2)
A.1.3 SNR and Range Performance
For high sensitivity, it is desirable to integrate for as long a period as possible. Since a surveillance sensor must detect moving sources, integration within a resolution element is limited by object motion and resolution-angle size. This is defined as the Dwell-in-Cell limit, and integration time is computed from:
Tio = "As^o (s)
where
i/fg = Resolution Angle (sec)
a>0 = Angle Rate Corresponding to Dwell-in-Cell-Limit
For any range, SNR can be expressed as:
SNR = 146AesFaT/|>6NR2]
where
Aes = Difference Signal Exposure Density (electrons/ m2)
otj = Object Cross-sectional Area (m2)
For a fixed SNR criterion, Range performance is computed from:
R = Sqrt{0.16AesFaT/[i/f6N(SNR)]} (km)
Range performance is a function of angle rate because exposure and noise components are a function of integration time. Range decreases with angle rate with a functional relationship determined by the various noise sources. Examples of computer generated solutions will be presented subsequently.
A.2. SENSOR DESIGN AND PERFORMANCE DATA
A large number of computational parameters are associated with the examples presented in Section 3.4.2 for a Ground-Based sensor and in Section 3.4.3 for a Space-Borne sensor. The major items are presented in the tables below in the form of spread sheets. Inputs are shown in capital letters.
25
The first category summarizes geometry and coverage quantities and includes optics and FPA geometry, integration time, FOV and scan pattern, coverage rates and revisit time, output data rates, and satellite population geometry and angle-rates.
The second category summarizes exposure and noise quantities and includes object size, object and earthshine reflectivity, emissivity and temperature parameters, solar illumination levels, sky background parameters (Day and Night), telescope stray radiation, and FPA noise characteristics. The table then presents Range performance computed for a single input angle- rate. Range performance for other angle rates are computed separately for the Range vs Angle- Rate curves presented in Section 3.4.
Tables 5a and 5b contain the parameters associated with the Ground-Based sensor example. These parameters represent the near-term development status of PtSi FPAs and the potential for observation of low altitude satellites at the MIT Lincoln Laboratory test site.
Tables 6a and 6b pertain to a future Space-Borne sensor which employs the advanced IrSi FPA technology. Successful development of this material would permit significant improvement in performance for detection of both near-earth and deep-space objects.
26
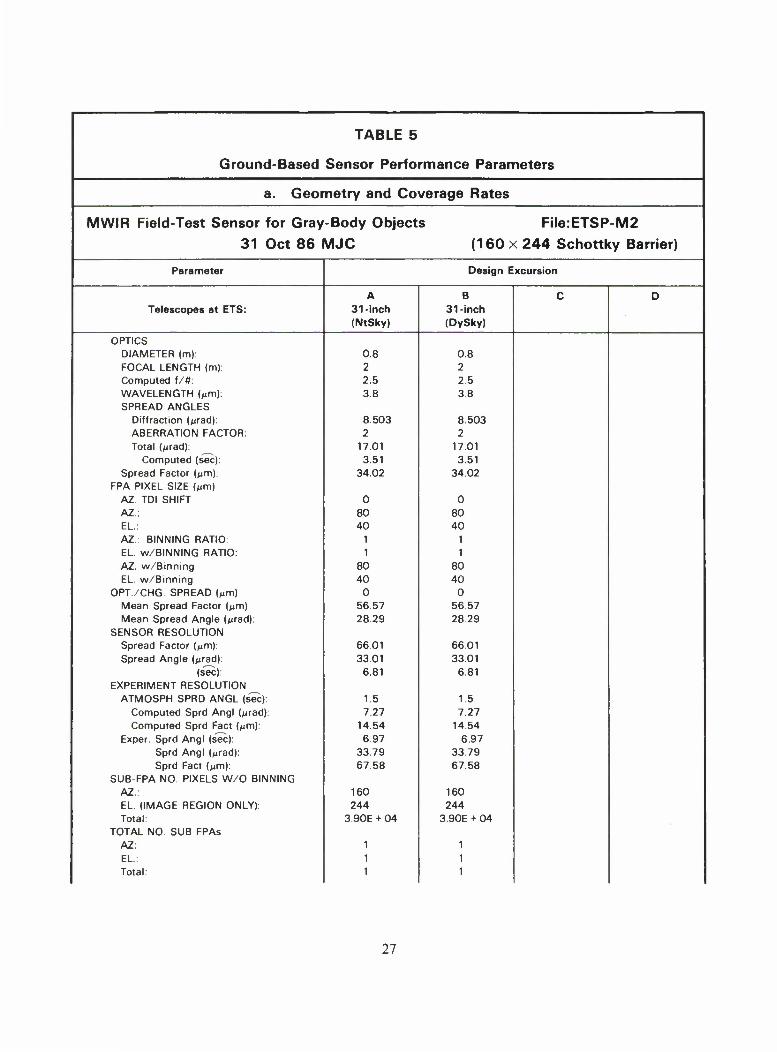
TABLE 5
Ground-Based Sensor Performance Parameters
a. Geometry and Coverage Rates
MWIR Field-Test Sensor for Gray-Body Objects File:ETSP-M2 31 Oct 86 MJC (160 x 244 Schottky Barrier)
Parameter Design Excursion
A B c D Telescopes at ETS: 31-inch
(NtSky) 31-inch (DySky)
OPTICS DIAMETER (m): 0.8 0.8 FOCAL LENGTH (m): 2 2 Computed f/#: 2.5 2.5 WAVELENGTH (^m): 3.8 3.8 SPREAD ANGLES
Diffraction (^rad): 8.503 8.503 ABERRATION FACTOR: 2 2 Total (/irad): 17.01 17.01
Computed (sec): 3.51 3.51 Spread Factor (urn): 34.02 34.02
FPA PIXEL SIZE (Mm) AZ. TDI SHIFT 0 0 AZ.: 80 80 EL: 40 40
AZ.: BINNING RATIO: 1 1 EL. w/BINNING RATIO: 1 1 AZ. w/Binning 80 80 EL. w/Binning 40 40
OPT./CHG. SPREAD (Mm) 0 0 Mean Spread Factor (^m) 56.57 56.57 Mean Spread Angle (/urad): 2829 2829
SENSOR RESOLUTION Spread Factor (jim): 66.01 66.01 Spread Angle i^rad) 33.01 33.01
(sec): 6.81 6.81 EXPERIMENT RESOLUTION
ATMOSPH SPRD ANGL (sec): 1.5 1.5 Computed Sprd Angl (/urad): 7.27 7.27 Computed Sprd Fact (Mm): 14.54 14.54
Exper. Sprd Angl (sec): 697 6.97 Sprd Angl (^rad): 33.79 33.79
Sprd Fact (Mm): 67.58 67.58 SUB-FPA NO. PIXELS W/O BINNING
AZ.: 160 160 EL. (IMAGE REGION ONLY): 244 244
Total: 3.90E + 04 3.90E + 04 TOTAL NO SUB FPAs
AZ: 1 1
EL: 1 1
Total: 1 1
27

TABLE 5a (Continued)
Parameter Design Excursion
A B C D Telescopes at ETS: 31-inch
(NtSky) 31-inch (DySky)
Total-FPA No. Pixels w/Binning Az.: 160 160 El. (Image Region Only): 244 244 Total 3.90E + 04 3.90E + 04
Total FPA Length (mm) Az.: 12.8 12.8 El. (Image Region Only): 9.76 9.76 Diagonal: 16.1 16.1
OPTICS FOC PLN MAX DIAG (mm): 17 17 System FOV (deg)
Az.: 0.37 0.37 El.: 0.28 0.28 Diagonal: 0.46 0.46
SYSTEM COVERAGE AND DATA RATES Angle Rate (sec/s): 209.1 209.1 Integration Time (s): 3.33E-02 3.33E - 02 NO. FRAMES PER/STARE: 5 5 Step-Settle Time (s) 2.50E-01 2.50E - 1 FOV Look-Step Time (s): 4.17E-01 4.17E-01 Read Frame Time (s): 3.33E-02 3.33E - 02 Read Pix Rate w/Stor (MHz): 1.17E + 00 1.17E + 00 Ave. Pir Rate to/Step (MHz): 4.68E-01 4.68-01 FPA OUTPUTS
MAX FPA PIXEL-RATE (MHz): 10 10 Min No Parallel Chan/FPA: 1 1 SELCT NO. PARALLEL CHAN/FPA: 1 1 Approx. No. Az Pix/Channel: 160 160 Channel Pixel Rate (MHz): 1.17E + 00 1.17 + 00 NO QUANTIZATION BITS: 12 12 Single Fr Mem Req (MBytes: 5.68E - 02 5.68E - 02
Coverage FOV (sq deg): 1.04E-01 1 04E - 01 Coverage Rate (sq deg/s): 2.49E-01 2.49E-01 SAT SYS FIELD REGARD (deg):
AZ.: 3 3 MEAN ELEVATION ANGLE (deg): 45 45 Compressed Az.: 2.1 2.1 EL: 3 3
NO. SEN'S SHARING COVERAGE 1 1 Required No Steps
AZ.: 6 6 EL: 11 11 Total: 66 66
Coverage Overlap Factor: 1.09 1.09 Revisit Time (s): 27.5 275
SPACE OBJECT POPULATI ON OVERLAY MIN ALTITUDE (km): 300 Max Angle Rate (sec/s): 5 31E + 03 MAX ALTITUDE (km): 1000 MIN ELEVATION ANGLE (deg): 15 Max Range (km) 2409 Min Angle Rate (sec/s): 3.46E + 02
28

TABLE 5
Ground-Based Sensor Performance Parameters
b. Exposure and Noise
Sensor Exposure and Noise Parameters 31 Oct 86 MJC File: ETSP-M2
Parameter Design Excursion
A B C D 31-inch 31-inch
INTEG WAVELENGTH LIMIT (»m)
(NtSky) (DySky)
LOWER: 3.2
UPPER: 5
OBJECT TEMPERATURE (K): 300
OBJECT EMISSIVITY: 0.8 0.8 Therm Earthshine on Obj Tot Refl: 0.2 0.2 EARTHSHINE EMISSION TEMP. (K):
300 OBJECT SOLAR REFLECTIVITY: 0.3 0.3 EARTH SOLAR REFLECTIVITY: 0.3 0.3 EARTHSHINE OBJ ALTITUDE (km): 500 500 ATMOSPHERIC TRANSMISSION: 0.8 0.8 SKY BACKGROUND SPECTRAL RADIANCE (W/m2/sr/Mm):
NIGHT: 2.00E - 02 2.00E - 02 DAY: 8.00E - 02 8.00E - 02
SKY BACKGROUND AVE WAVELENGTH (^m): 4
SKY BACKGROUND TEMPERATURE (K): 280
Sky Bkgnd Equiv Emissivity: Night: 6.53E-02 6.53E - 02 Day: 2.61E-01 2.61E-01
Optics Diameter (m): 0.8 0.8 Optics Focal Length (m): 2 2 Optics f/#: 2.5 2.5 OPTICS TRANSMISSION: 0.9 0.9 Optics Temperature (K):
NIGHT: 270
DAY: 295
OPT/COLD-SHIELD EQUIV EMISSIV: 0.1 0.1 SENSOR READ AND INTEGRATION TIMES
READ FRAME TIME (s): 3.33E-02 3.33E-02 NO. FRAMES OF INTEGRATION 1 1 Integration Time (s): 3.33E-02 3.33E-02
Dw/Cell Ang Vel (sec/s): 209 1 209.1 FPA FILL FACTOR: 0.39 0.39
29

TABLE 5b (Continued)
Parameter Design Excursion
A B C D 31-inch 31-inch
SENSOR EXPOSURES
(NtSky) (DySky)
SELECT "Quan, PtSi, or IrSi": PtSi PtSi SELECT "DAY OR NIGHT": Night Day Difference Signal Components (Elect 'm2): Thermal Emission: 2.80E+ 14 2.80E + 14 Thermal Earthshine: 7.01 E+ 13 7.01E+13 Solar Reflection: O.OOE + 00 5.89E+ 14 Solar Earthshine Reflection: O.OOE + 00 1.77E+14
Total Diff Signal (Elect/m2): Background Components (Elect/m2):
Sky: 1.26E + 13 5.05E+ 13 Optics/Cold-Shield: 1.37E + 13 4.01 E+ 13
Total Backgnd (Elect/m2): 2.63E + 13 9.06E + 13 Total Backgnd (Elect/Pixel): 8.42E + 04 2.90E + 05 FPA NOISE PARAMETERS
QUANTUM NOISE FACTOR: 1.20E + 00 1.20E + 00 MULTIPLICATIVE FIXED PATTERN
PIXEL NONUNIFORMITY (%): O.OOE + 00 O.OOE + 00 Noise Factor (m) O.OOE + 00 O.OOE + 00
ADDITIVE AMPLIFIER READOUT MEAS rms FLOOR (Elect/Pix): 6 6 MEAS rms @ 1 MHz (Elect/MHz'/!) 90 90 PRENOISE GAIN 1 1 Floor Var Dens (Elect/m2): 1.12E + 10 1.12E+ 10 Read Rate VarDns (Elect/m2): 2.96E + 12 2.96E+ 12 Tot Read VarDens (Elect/m2): 2.98E + 12 2.98E+ 12 Tot rms @ Read Rt (Elect/Pix): 98 98
ADDITIVE DARK CURRENT MEAS CURRENT DENS (nA/cm2): 2 2 Dark Expos Dens (Elect/m2): 1.63E + 12 1.63E+ 12 Dark Exposure (Elect Pixel): 5.20E + 03 5.20E + 03 rms Noise Dens (Elect/Pix): 72 72
SENSOR NOISE Variance Density (Elect/m2):
Backgnd. Photoelectron 3.16E + 13 1.09E+ 14 Mult. Fixed Pattern O.OOE + 00 O.OOE + 00 Additive: 4.60E + 12 4.60E + 12 Total: 3.62E+ 13 1.13E + 14
Sprd Fact rms (Elect/Resel) Backgnd. Photoelectron: 3.80E + 02 7.05E + 02 Mult. Fixed Pattern: O.OOE + 00 O.OOE + 00 Additive: 1 45E + 02 1 45E + 02 Total: 4.06E + 02 7.19E + 02
DESIRED RESEL SNR: 6.00E + 00 6.00E + 00 Required Sig (Elect/Resel.): 2.44E + 03 4.32E + 03 Object Area (m2): 1.50E + 01 1.50E + 01 Object Emissivity* Area 12 12 Dwell/Cell Range Perf. (km): 2.47E + 03 3.31 E +03
30

TABLE 6
Space-Borne Sensor Performance Parameters
a. Geometry and Coverage Rates
SWIR/MWIR Sensor for Gray-Body Objects 19 Jun 8C > MJC (Advanced Detectors)
Parameter Design Excursion
OPTICS
A B C D
Lo XSect Me XSect
DIAMETER (m): 1.2 1.2
Focal Length (m): 9 9 Computed f/#: 7.5 7.5
WAVELENGTH (Mm): 7.1 7.1
SPREAD ANGLES Diffraction (/jrad): 10.591 10.591
ABERRATION FACTOR: 1.5 1.5 Total (/.mad) 15.89 15.89
Computed (sec): 3.28 3.28 Spread Factor ||im): 143.01 143.01
FPA PIXEL SIZE (/im) AZ. TDI SHIFT 0 0 AZ.: 50 50 EL.: 50 50
AZ. BINNING RATIO: 1 1
EL. BINNING RATIO: 1 1
Az. w/Binning Ratio: 50 50 El. w/Binning: 50 50 OPT./CHG. SPREAD {fim) 0 0 Mean Spread Factor |jim| 50 50 Mean Spread Angle (^rad) 5.56 5.56
SENSOR RESOLUTION
Spread Factor (/im): 151.5 151.5 Spread Angle (Mrad): 16.83 16.83
(sec): 3.47 3.47
EXPERIMENT RESOLUTION ATMOSPH SPRD ANGL (s'ec): 0 0
Computed Sprd Angl (^rad): 0 0 Computed Sprd Fact (/jm): 0 0
Exper. Sprd Angl (s'ec): 3.47 3.47 Sprd Angl (/jrad): 16.82 16 82 Sprd Fact |^m): 151.38 151.38
SUB-FPA NO. PIXELS w/o BINNING AZ.: 512 512
EL. (IMAGE REGION ONLY): 1024 1024 Total: 5.24E + 05 5.24E + 05
TOTAL NO. SUB FPAs AZ: 24 24
EL: 2 2
Total: 48 48
31
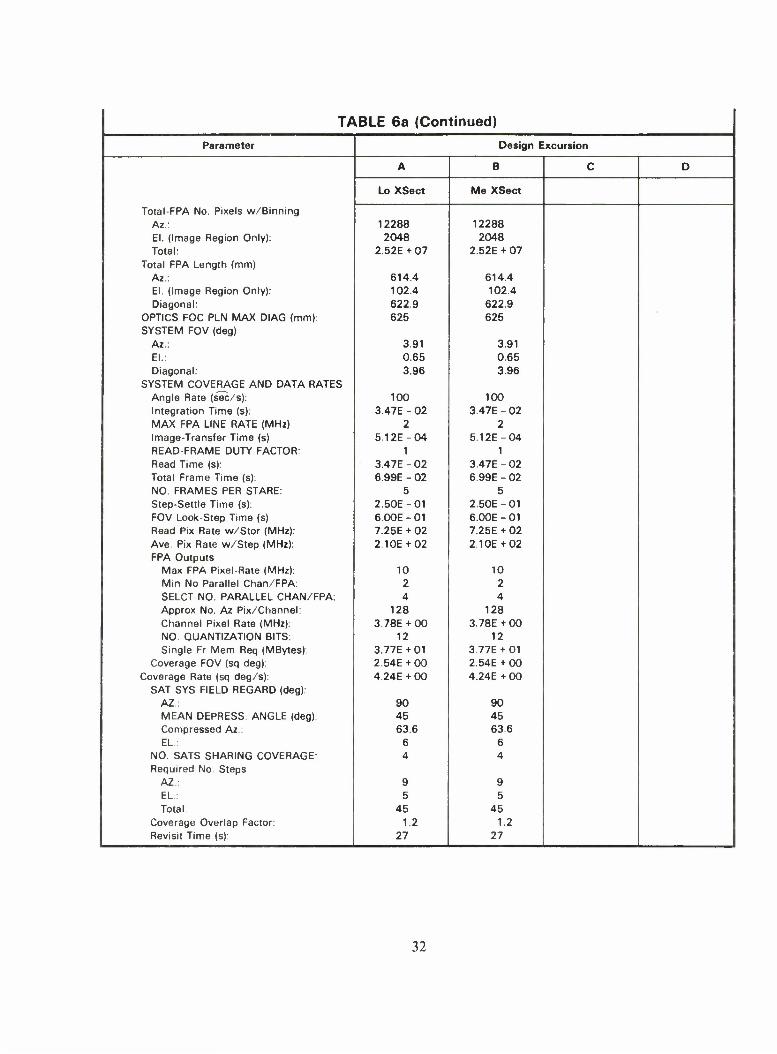
TABLE 6a (Continued)
Parameter Design Excursion
Total-FPA No. Pixels w/Binning
A B C D
Lo XSect Me XSect
Az.: 12288 12288 El. (Image Region Only): 2048 2048 Total: 2.52E + 07 2.52E + 07
Total FPA Length (mm) Az.: 614.4 614.4 El. (Image Region Only): 102.4 102.4 Diagonal: 622.9 622.9
OPTICS FOC PLN MAX DIAG (mm): 625 625 SYSTEM FOV (deg)
Az.: 3.91 3.91 El.: 0.65 0.65 Diagonal: 3.96 3.96
SYSTEM COVERAGE AND DATA RATES Angle Rate (sec/s): 100 100 Integration Time (s): 3.47E-02 3.47E - 02 MAX FPA LINE RATE (MHz) 2 2 Image-Transfer Time (s) 5.12E-04 5.12E-04 READ-FRAME DUTY FACTOR: 1 1 Read Time (s): 3.47E - 02 3.47E-02 Total Frame Time (s): 6.99E - 02 6.99E - 02 NO. FRAMES PER STARE: 5 5 Step-Settle Time (s): 2.50E-01 2 50E-01 FOV Look-Step Time (s) 6 00E-01 6.00E-01 Read Pix Rate w/Stor (MHz): 7.25E + 02 7.25E + 02 Ave Pix Rate w/Step (MHz): 2.10E + 02 2.10E + 02 FPA Outputs
Max FPA Pixel-Rate (MHz): 10 10 Min No Parallel Chan/FPA: 2 2 SELCT NO. PARALLEL CHAN/FPA: 4 4 Approx No. Az Pix/Channel: 128 128 Channel Pixel Rate (MHz): 3.78E + 00 3.78E + 00 NO. QUANTIZATION BITS: 12 12 Single Fr Mem Req (MBytes): 3.77E + 01 3.77E + 01
Coverage FOV (sq deg): 2.54E + 00 2.54E + 00 Coverage Rate (sq deg/s): 4.24E + 00 4.24E + 00
SAT SYS FIELD REGARD (deg): AZ.: 90 90 MEAN DEPRESS. ANGLE (deg): 45 45 Compressed Az.: 63.6 636 EL: 6 6
NO. SATS SHARING COVERAGE: 4 4 Required No Steps
AZ.: 9 9 EL: 5 5 Total: 45 45
Coverage Overlap Factor: 1.2 1.2 Revisit Time (s): 27 27
32
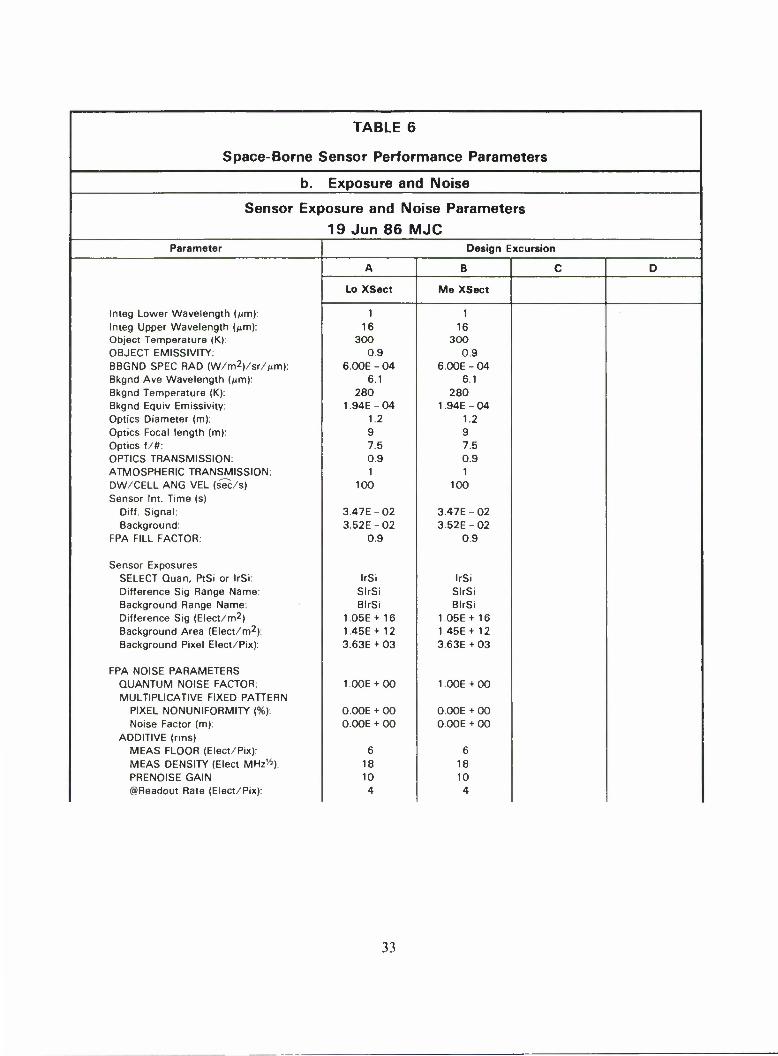
TABLE 6
Space-Borne Sensor Performance Parameters
b. Exposure and Noise
Sensor Exposure and Noise Parameters 19 Jun 86 MJC
Parameter Design Excursion
Integ Lower Wavelength (^m):
A B C D
Lo XSect Me XSect
1 1 Integ Upper Wavelength (Mm): 16 16 Object Temperature (K): 300 300 OBJECT EMISSIVITY: 0.9 0.9 BBGND SPEC RAD (W/m2)/sr/Mm): 6.00E-04 6.00E - 04 Bkgnd Ave Wavelength ||im): 6.1 6.1 Bkgnd Temperature (K): 280 280 Bkgnd Equiv Emissivity: 1 94E - 04 1 94E - 04 Optics Diameter (m): 1.2 1.2 Optics Focal length (m): 9 9 Optics f/#: 7.5 7.5 OPTICS TRANSMISSION: 0.9 0.9 ATMOSPHERIC TRANSMISSION: 1 1 DW/CELL ANG VEL (sec/s) 100 100 Sensor Int. Time (s)
Diff. Signal: 3.47E - 02 3.47E - 02 Background: 3.52E - 02 3.52E-02
FPA FILL FACTOR: 0.9 0.9
Sensor Exposures SELECT Quan, PtSi or IrSi: IrSi IrSi Difference Sig Range Name: SlrSi SlrSi Background Range Name: BlrSi BlrSi Difference Sig (Elect/m2) 1.05E + 16 1.05E+ 16 Background Area (Elect/m2): 1.45E + 12 1 45E+ 12 Background Pixel Elect/Pix): 3.63E + 03 3.63E + 03
FPA NOISE PARAMETERS QUANTUM NOISE FACTOR: 1.O0E + O0 1 00E + 00 MULTIPLICATIVE FIXED PATTERN
PIXEL NONUNIFORMITY (%): O.OOE + 00 O.OOE + 00 Noise Factor (m): O.OOE + 00 O.OOE + 00
ADDITIVE (rms) MEAS FLOOR (Elect/Pix): 6 6 MEAS DENSITY (Elect MHz'/2): 18 18 PRENOISE GAIN 10 10 ©Readout Rate (Elect/Pix): 4 4
33

TABLE 6b (Continued) Parameter Design Excursion
Sensor Noise
A B C D
Lo XSect Me XSect
Variance Density Elect/m^) Backgnd. Photoelectron: 1,45E + 12 1.45E + 12 Mult. Fixed Pattern: O.OOE + 00 O.OOE + 00 Additive: 6.40E + 09 6.40E + 09 Total: 1.46E + 12 1.46E + 12
Sprd Fact rms (Elect/Resel) Backgnd. Photoelectron: 1.82E + 02 1.82E + 02 Mult. Fixed Pattern: O.OOE + 00 O.OOE + 00 Additive: 1.21E + 01 1.21E + 01 Total: 1.83E + 02 1.83E + 02
DESIRED RESEL SNR: 6.00E + 00 6.00E + 00 Required Sig (Elect/Resel.): 1.10E + 03 1.10E + 03 OBJECT AREA (m*) 5.00E-01 5.00E-00 Dwell/Cell Range Perf. (km): 1.65E + 04 5.23E + 04
34

UNCLASSIFIED
SECURITY CLASSIFICATION OF THIS PAGE (When Data Entered)
REPORT DOCUMENTATION PAGE READ INSTRUCTIONS BEFORE COMPLETING FORM
1. REPORT NUMBER
ESD-TR-86-142 2. G0VT ACCESSION NO. 3. RECIPIENT'S CATALOG NUMBER
4. TITLE (and Subtitle)
Space Surveillance Application Potential
of Schottky Barrier IR Sensors
S. TYPE OF REPORT & PERIOD COVERED
Technical Report
6. PERFORMING 0RG. REPORT NUMBER Technical Report 772
7. AUTHOR^
Michael J. Cantella
8. CONTRACT OR GRANT NUMBER^)
F19628-85-C-0002
9 PERFORMING ORGANIZATION NAME AND ADDRESS
Lincoln Laboratory, MIT P.O. Box 73 Lexington, MA 02173-0073
10. PROGRAM ELEMENT. PROJECT. TASK AREA ft. WORK UNIT NUMBERS
Program Element No. 63220F
11 CONTROLLING OFFICE NAME AND ADDRESS
Air Force Systems Command, USAF Andrews AFB Washington, DC 20334
12. REPORT DATE
9 April 1987
13. NUMBER OF PAGES
46 14. MONITORING AGENCY NAME & ADDRESS (if different from Controlling Office)
Electronic Systems Division
Hanscom AFB, MA 01731
IS. SECURITY CLASS (of this Report)
Unclassified
IBn. DECLASSIFICATION DOWNGRADING SCHE0ULE
16 DISTRIBUTION STATEMENT (of this Report)
Approved for public release; distribution unlimited.
17. DISTRIBUTION STATEMENT (of the abstract entered in Block 20, if different from Report)
11. SUPPLEMENTARY NOTES
None
19. KEY WORDS (Continue on reverse side if necessary and identify by block number)
infrared focal plane arrays (FPAs) thermal range performance Schottky barrier sensors detection sensitivity detectors space surveillance electro-optical
20. ABSTRACT (Continue on reverse side if necessary and identify by block number)
Schottky Barrier IR detection is based on the principle of internal photoemission at the surface between a Si substrate and a deposited metal. In a multi-element focal plane array (FPA), this phenomenon provides very high pixel-to-pixel uniformity, so the requirement for corrective signal processing is minimal. The use of standard silicon design and fabrication techniques simplifies detector readout and multiplexing functions and permits practical realization of sensors that contain very large staring focal planes. This report summarizes the status of FPA and camera development and includes typical imagery. For surveillance applications, the high sensitivity obtainable with these large staring arrays offers both signature and background phenomenology opportunities in the medium wavelength (MWIR) band which could not be exploited previously with scanning-type sensors. Examples of predicted surveillance sensor performance include (1) a near-term ground-based system for Day/Night detection of low-altitude space objects and (2) a future space-borne system for space missions. It is concluded that significant potential exists for future application of this technology.
DD FORM
1 Jan 73 1473 EDITION OF 1 N0V 65 IS OBSOLETE UNCLASSIFIED
SECURITY CLASSIFICATION OF THIS PAGE (When Data Entered)