Space for picture - Chalmers Publication Library...
79
Battery Thermal Management Systems of Electric Vehicles Master’s Thesis in Automotive Engineering JILING LI ZHEN ZHU Department of Applied Mechanics Division of Vehicle Engineering & Autonomous Systems Road Vehicle Aerodynamics and Thermal Management CHALMERS UNIVERSITY OF TECHNOLOGY Gö teborg, Sweden 2014 Master’s thesis 2014:42 Space for picture Replace this square with a picture illustrating the content of the report. This picture should be “floating over the text”, in order not to change the position of the title below (clic on Format: Object: Layout, and chose “In front of text”) Instructions for use of this template Replace the yellow marked text with your own title, name etc on the first nine pages. Replace only the text and not the return-signs, comment marks [mp1] etc. Update all field in the document by choosing Edit: Select All (Ctrl A) and then clicking the F9-button. Write your report using the formats and according to the instructions in this template. When it is completed, update the table of contents. The report is intended to be printed double-sided.
Transcript of Space for picture - Chalmers Publication Library...

Battery Thermal Management Systems of
Electric Vehicles Master’s Thesis in Automotive Engineering
JILING LI
ZHEN ZHU
Department of Applied Mechanics
Division of Vehicle Engineering & Autonomous Systems
Road Vehicle Aerodynamics and Thermal Management
CHALMERS UNIVERSITY OF TECHNOLOGY
Göteborg, Sweden 2014
Master’s thesis 2014:42
Space for picture Replace this square with a picture illustrating the content of the report. This picture
should be “floating over the text”, in order not to change the position of the title
below (clic on Format: Object: Layout, and chose “In front of text”)
Instructions for use of this template
Replace the yellow marked text with your own title, name etc on the first nine
pages. Replace only the text and not the return-signs, comment marks [mp1] etc.
Update all field in the document by choosing Edit: Select All (Ctrl A) and then
clicking the F9-button. Write your report using the formats and according to the
instructions in this template. When it is completed, update the table of contents.
The report is intended to be printed double-sided.


MASTER’S THESIS IN AUTOMOTIVE ENGINEERING
Battery Thermal Management Systems of
Electric Vehicles
JILING LI
ZHEN ZHU
Department of Applied Mechanics
Division of Vehicle Engineering & Autonomous Systems
Road Vehicle Aerodynamics and Thermal Management
CHALMERS UNIVERSITY OF TECHNOLOGY
Göteborg, Sweden 2014

Battery Thermal Management Systems of Electric Vehicles
JILING LI
ZHEN ZHU
©Jiling Li;Zhen Zhu, 2014
Master’s Thesis 2014:42
ISSN 1652-8557
Department of Applied Mechanics
Division of Vehicle Engineering & Autonomous Systems
Road Vehicle Aerodynamics and Thermal Management
Chalmers University of Technology
SE-412 96 Göteborg
Sweden
Telephone: + 46 (0)31-772 1000
Cover:
Saab 9-3 ePower electric vehicle made its debut at 2010 Paris Motor Show
Chalmers / Department of Applied Mechanics
Göteborg, Sweden 2014

I
Battery Thermal Management Systems of Electric Vehicles
Master’s Thesis in Automotive Engineering
JILING LI
ZHEN ZHU
Department of Applied Mechanics
Division of Vehicle Engineering & Autonomous Systems
Road Vehicle Aerodynamics and Thermal Management
Chalmers University of Technology
ABSTRACT
Electric vehicles (EV) develop fast and have become popular due to their zero emission
and high tank-to-wheels efficiency. However, some factors limit the development of
the electric vehicle, especially performance, cost, lifetime and safety of the battery.
Therefore, the management of batteries is necessary in order to reach the maximum
performance when operating at various conditions.
The battery thermal management system (BTMS) plays a vital role in the control of the
battery thermal behaviour. The BTMS technologies are: air cooling system, liquid
cooling system, direct refrigerant cooling system, phase change material (PCM) cooling
system, and thermo-electric cooling system as well as heating. These systems are
analysed through a trade-off between performance, weight, size, cost, reliability, safety
and energy consumption. According to the analysis two prime battery thermal
management systems are recommended: combined liquid system (CLS) and a variant
system with PCM.
The models of CLS and PCM system were built and simulated using software
MATLAB/Simulink. The simulation results predict the battery temperature variation
and the energy consumption of BTMS. Through simulating the PCM system model, the
effect of PCM on battery temperature variation was investigated and the proper PCM
mass was estimated.
Seen from the simulation results, BTMS is of great importance to control battery
thermal behaviour. Further study could be more comprehensive and accurate through
combining the simulation model with battery thermal electric and CFD models.
Key words: EV, Battery thermal management, BTMS, Air cooling system, Liquid
cooling system, Direct refrigerant system, PCM, MATLAB/Simulink
model

II

III
Contents
1 INTRODUCTION 1
1.1 Background 1
1.2 Objectives 1
1.3 Limitation 1
1.4 Thesis Outline 2
2 THEORY 3
2.1 Lithium-ion Battery 3 2.1.1 Mechanism of Secondary Lithium-ion battery 3
2.1.2 Thermal Issues of Li-ion battery 4 2.1.3 Operating Requirements 5
2.2 Heat Transfer 7 2.2.1 Overall Heat Transfer Coefficient 7
2.2.2 Heat Balancing within Heat Exchanger 9
2.3 On-Off Controller 10
2.4 Phase Change Material (PCM) 12
3 BATTERY THERMAL MANAGEMENT SYSTEMS (BTMS) 13
3.1 Systems Functions 13
3.2 Technologies of BTMS 14
3.2.1 Air Cooling and Heating 14 3.2.2 Liquid Cooling and Heating 15
3.2.3 Direct Refrigerant Cooling and Heating 16 3.2.4 PCM 17 3.2.5 Thermoelectric Module 17 3.2.6 Heat Pipe 18
3.2.7 PTC Heater 19
3.3 Evaluation of Different Technologies 19 3.3.1 Forced Air System 19 3.3.2 Liquid System 20 3.3.3 PCM System 20
3.3.4 Thermo-electrics 21
3.4 Recommended Cooling System 22
3.4.1 Combined Liquid System (CLS) 22 3.4.2 PCM Model (CLS+PCM) 23
4 MODELLING OF BTMS 24
4.1 Modelling Conditions 25
4.2 CLS Model 27 4.2.1 Battery Unit 27

IV
4.2.2 Air Conditioner (Active Cooling) 28
4.2.3 Radiator (Passive Cooling) 28 4.2.4 PTC Heater (Heating) 29 4.2.5 Pump 29
4.2.6 Control Unit 31
4.3 PCM Model 33
4.4 Performance Parameters 34
5 RESULTS AND DISCUSSION 36
5.1 CLS Model 36
5.1.1 NEDC versus US06 39 5.1.2 Cold and Hot Weather 40
5.1.3 Mild Weather 44
5.2 PCM Model 45 5.2.1 Comparison of Two Systems 45 5.2.2 Choose the PCM Mass 46
6 CONCLUSION 49
7 FUTURE PROSPECTS 50
REFERENCES 52
APPENDIX A: SYSTEM EVALUATION 54
APPENDIX B: MODELLING PROCESS 57
APPENDIX C: CLS RESULTS 59
APPENDIX D: CLS+PCM RESULTS 63

V
Acknowledgements
It is our honour to be involved in this master thesis project. Experts at LeanNova
Engineering AB have been very welcoming, friendly and helpful throughout our thesis.
They have continuously supported us with their comprehensive expertise and
knowledge of automotive systems. We have gained a lot from this thesis not only the
experience but also the innovate spirit to solve complex problems.
We would like to extend a warm thank you to our supervisor Peter Hayden who has
been involved in most of this thesis. With his expertise for HVAC system, we have
managed to solve dozens of problems. He also inspired us with ideas, action and
confidence by talking with us patiently. The project would never have completed
without his engineering skills and management.
Thank you also to all our great team members. Zhongyuan Zhang has provided us
strong theoretical support in thermodynamic, MATLAB simulation and battery
technology. Her guidance took us directly into the central issues without detour. Claes
Zimmer and Anders Lindén have accompanied us from the beginning to the end with
their knowledgeable comments and answers to all our questions.
We would also like to thank our examiner Professor Lennart Löfdahl. In weekly
conversation during the project he has brought us his guidance and advice in every
aspect.
Lastly, we would like to thank our friends and our family for all support and
encouragement throughout the project and also our study in Chalmers.
Jiling Li and Zhen Zhu
Göteborg, 2014

VI

VII
Notations
Symbol List
𝐴 (Contact) area
Li Lithium
𝑞 Heat transfer rate
�̇�𝑔𝑒𝑛 Heat generation rate
�̇�𝑑𝑖𝑠 Heat dissipation rate
Re Reynolds number
𝑇𝑎𝑚𝑏 Ambient temperature
𝑇𝑏𝑎 Battery temperature
𝑇𝑏𝑎,𝑖𝑛 Battery initial temperature
𝑇𝑑𝑒𝑠 Desired temperature
𝑇𝑓𝑙,𝑖𝑛 Fluid inlet temperature
𝑇𝑓𝑙,𝑜𝑢𝑡 Fluid outlet temperature
∆𝑇𝑀 Mean temperature difference
𝑈 Overall heat transfer coefficient
Abbreviation List
AC Air Conditioner / Air Conditioning
BEV Battery Electric Vehicle
BMS Battery Mangement System
BP Bypass
BTMS Battery Thermal Management System
Eq. Equation
EV Electric Vehicle
Fig. Figure
HT Heater / Heating
HVAC Heating, Ventilation and Air Conditioning
kph kilo per hour
NEDC New European Driving Cycle
P Page
PCM Phase Change Material
PTC Positive Temperature Coefficient
RA Radiator
Sec. Section
SEI Solid electrolyte interface/interphase
Tab. Table
TDC Testing Driving Cycle
US06 A Supplemental Federal Test Procedure of USA

VIII

CHALMERS, Applied Mechanics, Master’s Thesis 2014:42 1
1 Introduction
In this chapter, a brief synopsis of this report is presented. Section 1.1 Background,
explains the original motivation of this thesis. Section 1.2 Objectives, points out what
this thesis is aiming at. Section 1.3 Limitation, defines the circumscription of thesis
work and Section 1.4 Thesis Outline, introduces briefly the report structure.
1.1 Background
There are nowadays different blending levels of hybrid electric vehicle and pure electric
vehicle available on the current automobile market. According to the blending level,
various size, type and number of battery cells are mounted in EVs. Unlike conventional
fuel, battery cells as an energy source have stricter requirement on working
environment. They are especially sensitive to temperature. To ensure a proper thermal
working environment, a Battery Thermal Management System (BTMS) will normally
be integrated with battery cells. Thus, knowledge about the proper working
requirements of battery is vital, and what kind of management systems can sufficiently
and efficiently meet these requirements. With this cornerstone, the performance and
durability of battery pack can be maximized in an electric vehicle. Furthermore, the
electric range of vehicle is restricted due to limited capacity of the battery. It is very
useful to investigate carefully the electric energy consumption of BTMS and to look for
potential savings. This investigation will help battery performance by reducing the
energy consumption of BTMS and extending the electric range of EVs.
1.2 Objectives
The main purpose of this master thesis is to develop a BTMS model for balancing the
different cooling and heating circuits within the battery pack to fulfil the performance
requirements. As prerequisites for the modelling, the requirements of the battery pack
will be investigated at first through literature research. Then, several potential BTMSs,
both in commercial stage and study phase, will be listed in a concept selection matrix
with their pros and cons. Two of them will be proposed as candidates for the following
simulation. After the models are built up through simulation tool Simulink®, they will
be tested in different initial conditions. Lastly, the corresponding performance
parameters of systems will be analysed and compared.
1.3 Limitation
Although hybrid EVs are popular on the current market, this thesis concentrates only
on battery electric vehicles and plug-in hybrid electric vehicles which are equipped with
larger battery packs compared with those on other EVs. The thesis focuses only on
building a simulation model for the thermal balancing within the battery pack. Thus,
the exact heat generation model of battery cells is not discussed in detail; also this model
is taken from an exterior resource. Furthermore, the other cooling and heating circuits,
such as chiller, radiator and heater, will be simplified. The delay, fluctuation or fading
of operation will be neglected. The pre- and post-conditions will be mentioned, but the
operation and system feature during test driving cycles is the main points of this thesis
and thus will be intensively investigated and compared.

CHALMERS, Applied Mechanics, Master’s Thesis 2014:42 2
1.4 Thesis Outline
This report is divided into seven main chapters. It starts with a general introduction in
Chapter 1 and a theoretical fundamental in Chapter 2 which offers basic knowledge
about Li-ion battery, heat transfer theory, on-off control and PCM. Chapter 3 presents
the basic required functions of BTMS and several commercial and potential solutions
in Section 3.2 with corresponding evaluation in Section 3.3. Depending on the
evaluation two candidate systems are proposed in Section 3.4.
Based on the system description in Chapter 4 the combined liquid system model is built
up at the first phase in Section 4.1. Then improvement is achieved with an additional
PCM unit which is described in Section 4.2. Chapter 5 presents the modelling results
of both systems with defined performance parameters.
In the Chapter 6 a final conclusion based on previous results analysis is discussed.
Lastly, possible work for the future is recommended for completing and optimising the
models.
To summarise the contributions: Jiling Li took main responsibility for Sections 2.1 2.4
3.3 3.4 4.2.4 4.2.5 4.3 5.2; and Zhen Zhu took main responsibility for Sections 2.2 2.3
3.2 4.1 4.2.1-4.2.3 4.2.6 5.1. The rest of the report was completed in co-operation with
each other.
CHALMERS, Applied Mechanics, Master’s Thesis 2014:42 3
2 Theory
This chapter highlights the most important fundamental points of thesis, presenting the
theoretical thoughts of automobile engineering, chemistry, thermodynamics and
automatic control behind numerical simulations.
2.1 Lithium-ion Battery
2.1.1 Mechanism of Secondary Lithium-ion battery
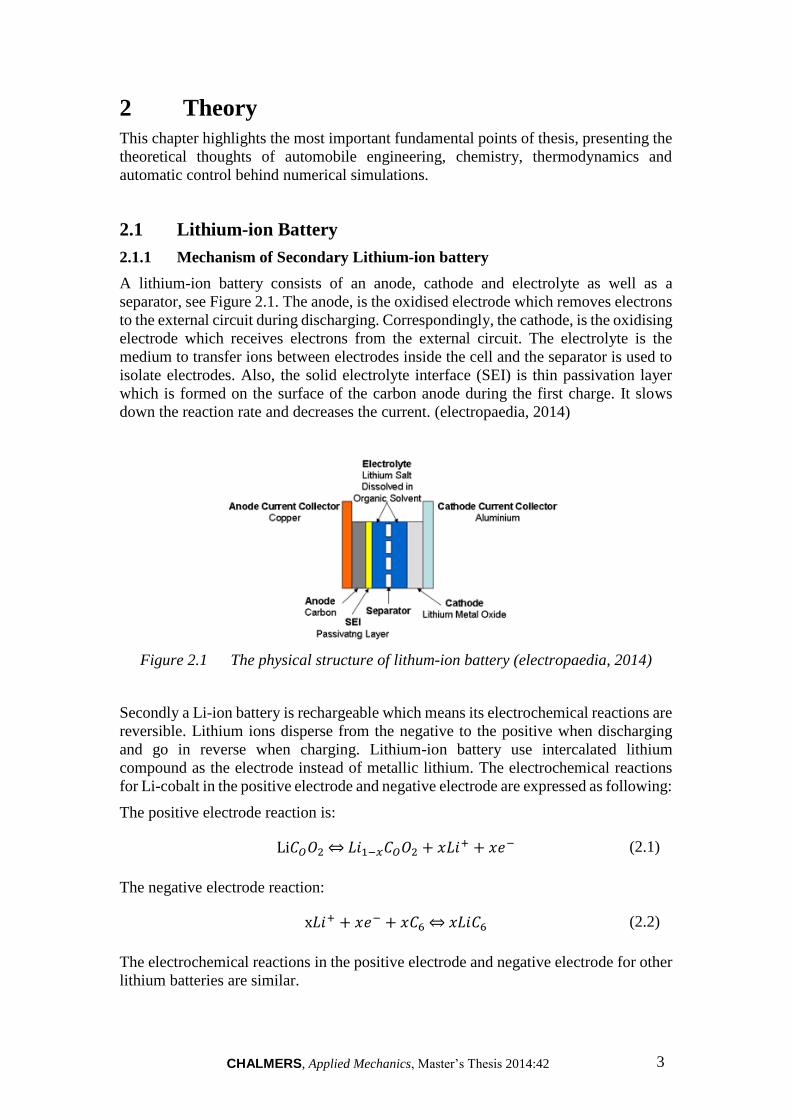
A lithium-ion battery consists of an anode, cathode and electrolyte as well as a
separator, see Figure 2.1. The anode, is the oxidised electrode which removes electrons
to the external circuit during discharging. Correspondingly, the cathode, is the oxidising
electrode which receives electrons from the external circuit. The electrolyte is the
medium to transfer ions between electrodes inside the cell and the separator is used to
isolate electrodes. Also, the solid electrolyte interface (SEI) is thin passivation layer
which is formed on the surface of the carbon anode during the first charge. It slows
down the reaction rate and decreases the current. (electropaedia, 2014)
Figure 2.1 The physical structure of lithum-ion battery (electropaedia, 2014)
Secondly a Li-ion battery is rechargeable which means its electrochemical reactions are
reversible. Lithium ions disperse from the negative to the positive when discharging
and go in reverse when charging. Lithium-ion battery use intercalated lithium
compound as the electrode instead of metallic lithium. The electrochemical reactions
for Li-cobalt in the positive electrode and negative electrode are expressed as following:
The positive electrode reaction is:
Li𝐶𝑂𝑂2⇔𝐿𝑖1−𝑥𝐶𝑂𝑂2 + 𝑥𝐿𝑖+ + 𝑥𝑒− (2.1)
The negative electrode reaction:
x𝐿𝑖+ + 𝑥𝑒− + 𝑥𝐶6 ⇔𝑥𝐿𝑖𝐶6 (2.2)
The electrochemical reactions in the positive electrode and negative electrode for other
lithium batteries are similar.

CHALMERS, Applied Mechanics, Master’s Thesis 2014:42 4
There are many types of lithium-ion battery which are named by cathode oxides and
each one has its own characteristics as followings:
Table 2.1 Reference names for Li-ion batteries (Battery University, 2014).
Chemical name Material Short form Note
Lithium Cobalt
Oxide
LiCoO2 Li- cobalt High capacity; for
cell phone laptop,
camera
Lithium Manganese
Oxide
LiMn2O4 Li- manganese Most safe; lower
capacity than Li-
cobalt but high
specific power
and long life.
Power tools,
e-bikes, EV,
medical,
hobbyist.
Lithium Iron
Phosphate
LiFePO4 Li- phosphate
Lithium Nickel
Manganese Cobalt
Oxide
LiNiMnCoO2 NMC
Lithium Nickel
Cobalt Aluminium
Oxide
LiNiCoAlO2 NCA Gaining
importance
in electric
powertrain and
grid storage Lithium titanate Li4Ti5O12 Li- titanate
Seen from Table2.1, three types of lithium batteries are particularly suitable for an EV
battery, namely LiMn2O4, LiFePO4, and LiNiMnCoO2.
2.1.2 Thermal Issues of Li-ion battery
Lithium-ion cells performance depends on both the temperature and the operating
voltage. Lithium-Ion cells work well when cells operate within limited voltage and
temperature. Otherwise, damage will occur to the cells and will be irreversible.
In over-voltage situations the charging voltage exceeds the bearable cell voltage,
resulting in excessive current flows and at the same time, it causes two problems.
At excessive currents the Lithium-ions are deposited more rapidly than intercalation to
the anode layers, Lithium ions are then deposited on the surface of the anode as metallic
Lithium. This is Lithium plating. It gives rise to the reduction in the free Lithium ions
and an irreversible capacity loss. (Electropaedia, 2014). There are two types of metal
lithium plating, namely homogeneous lithium plating and heterogeneous lithium
plating, but the lithium plating is dendritic in form. Eventually it can result in a short-
circuit between the electrodes.

CHALMERS, Applied Mechanics, Master’s Thesis 2014:42 5
As with over-voltage, under-voltage also brings about problems which give rise to the
breakdown of the electrode materials.
For the anode, the copper current collector breaks down. It causes the increase of battery
discharge rate and battery voltage, however, the copper ions are precipitated as metal
copper which is irreversible. The situation is dangerous for it can result in short-circuit
between anode and cathode. For the cathode, the cobalt oxide or manganese oxide will
be decomposed after many cycles under low voltage. Meanwhile, oxygen will be
released and the battery suffers from capacity loss.
The battery temperature should be controlled carefully. Both excess heat and lack of
heat will brings about problems.
Chemical reaction rates have a linear relation to temperature. The decrease of the
operating temperature will reduce reaction rate and the capacity of carrying current
during charging or discharging. In other words, the battery power capacity is decreased.
Moreover, the reduction of reaction rate makes it harder to insert lithium ions into
intercalation spaces. The result is the reduction of power and lithium plating causing
the capacity loss.
High temperature increases the reaction rate with higher power output, however, it also
increases the heat dissipation and generates even higher temperatures. Unless heat is
dissipated quicker than heat is generated, the temperature will be higher and finally a
thermal runaway will result.
Thermal runaway consists of several stages and each stage will give rise to more
irreversible damage to cells. First, the SEI layer is dissolved to electrolyte at round
80ºC. The primary overheating may result from excessive current or high ambient
temperature. After breakdown of the SEI layer, electrolyte begins to react with the
anode. This reaction is exo-thermal which drives the temperature higher. Secondly, the
higher temperature causes the organic solvents to break down with the release of
hydrocarbon gases. Normally this starts at around 110 ºC. The pressure inside cells is
built up by the gas and the temperature is beyond the flashpoint. However, the gas does
not burn due to the lack of oxygen. A vent is needed to release the gas in order to keep
cells under proper pressure and avoid a possible rupture. Then, the separator is melted
and short-circuits occur between the anode and cathode at 135 ºC. Finally, the metal-
oxide cathode breaks down at 200 ºC and releases oxygen which allows the electrolyte
and hydrogen gas to burn. This reaction is also exo-thermal and drives temperature and
pressure still further. (Electropaedia, 2014)
In addition, uneven temperature distribution is another problem of batteries. Typically,
it is caused by the excessive local temperature, variable current in a cell and the thermal
conductivity of the case, as well as the placement of positive and negative terminals
and so on. (Pesaran, 2001) It results in local deterioration and even thermal runaway
with reducing the battery lifetime. (Kizilel, et al., 2009)
2.1.3 Operating Requirements
The battery temperature should be controlled within temperature limits to avoid the
thermal issues and improve the performance. The temperature range affects the battery
power and battery cycle life, see Figure 2.2 and Figure 2.3. At the same time, the
temperature distribution should be even to guarantee the battery performance and

CHALMERS, Applied Mechanics, Master’s Thesis 2014:42 6
lifetime. That is also the reason why the battery thermal management system is
necessary to the battery system.
Figure 2.2 Battery power and temperature (Matthe, et al., 2011).
When temperature ranges from 20°C to 40°C, battery power reaches maximum, see
Figure 2.2.
Figure 2.3 Cycle life and temperature (Electropaedia, 2014).
The cycle life goes down slowly below 10°C because of anode plating and drops off
quickly above 60°C due to the breakdown of electrode materials, see Figure 2.3.
Generally, the temperature must be controlled between 20°C and 40°C to ensure the
performance and cycle life. Moreover, the temperature distribution is controlled under
5K to keep the safety and lifetime of battery (Pesaran, 2002). In addition, ventilation is
also essential to the battery system and should be taken into account.

CHALMERS, Applied Mechanics, Master’s Thesis 2014:42 7
2.2 Heat Transfer
2.2.1 Overall Heat Transfer Co-efficient
To predict the performance of the heat exchange, the heat transfer can generally be
expressed using overall heat transfer co-efficient by following equation (Incropera,
2007, p. 678):
𝑞 = 𝑈𝐴∆𝑇𝑀 (2.3)
where
𝑞 Heat transfer rate [W]
𝑈 Overall heat transfer coefficient [W/ (m²·K)]
𝐴 Heat transfer surface area [m²]
∆𝑇𝑀 Approximate mean temperature different [K]
This equation includes the convective and conductive parts of heat transfer between the
hot and cold fluids in the heat exchanger. The radiation part of heat transfer and the heat
transfer between the heat exchanger and the atmosphere is negligible.
For the un-finned, tubular heat exchanger of Figure 2.4, the overall heat transfer co-
efficient can by expressed as Equation 2.4 (Incropera, 2007, p. 675)
Figure 2.4 Un-finned, tubular cross-flow heat exchanger (Incropera, 2007, p.
671).
1
𝑈𝐴=
1
ℎ𝑖𝐴𝑖+𝑅𝑓,𝑖′′
𝐴𝑖+ 𝑅𝑤 +
𝑅𝑓,𝑜′′
𝐴𝑜+
1
ℎ𝑜𝐴𝑜
(2.4)
where
𝑈𝐴 Product of U and A [W/K], A could be either 𝐴𝑖 or 𝐴𝑜.
ℎ𝑖 , ℎ𝑜 Convective heat transfer co-efficient of inner, outer tube surface [W/m²]
𝐴𝑖 , 𝐴𝑜 Contact area of inner, outer tube surface [m²]
𝑅𝑓,𝑖′′ , 𝑅𝑓,𝑜
′′ Fouling Factors [m²·K/W]

CHALMERS, Applied Mechanics, Master’s Thesis 2014:42 8
𝑅𝑤 Conductive resistance [K/W]
𝑅𝑤 in this case indicates the conductive resistance of the tube and is obtained by the
equationln(𝐷𝑜/𝐷𝑖)
2𝜋𝑘𝐿 where 𝐷𝑜is the outer diameter of the tube, 𝐷𝑖is the inner diameter , 𝑘
is the thermal conductivity of the tube material, and 𝐿 is the tube length
In particular, if the convection of outer surface occurs very strong i.e.ℎ𝑜 → ∞ and the
fouling effect is insignificant, the terms 1
ℎ𝑜𝐴𝑜,𝑅𝑓,𝑖′′
𝐴𝑖 and
𝑅𝑓,𝑜′′
𝐴𝑜 in Equation 2.4 can be
negligible and the equation reduces to
1
𝑈𝐴=
1
ℎ𝑖𝐴𝑖+ln(𝐷𝑜/𝐷𝑖)
2𝜋𝑘𝐿
(2.5a)
If the calculation is based on the inner tube surface 𝐴 = 𝐴𝑖 and since𝐴𝑖 = 𝜋𝐿𝐷𝑖, the
Equation 2.5a is equivalent to
1
𝑈=
1
ℎ𝑖+𝐷𝑖ln(𝐷𝑜/𝐷𝑖)
2𝑘
(2.5b)
or
𝑈 =1
1ℎ𝑖+𝑟𝑖ln(𝑟𝑜/𝑟𝑖)
𝑘
(2.5c)
where 𝑟𝑜 , 𝑟𝑖 refers to the outer and inner tube radius. The Equation 2.5c will be applied
in the following model unit “Battery Pack” in Section 4.2.1 to describe the heat transfer
between battery cells and heat transfer fluid.
In Equation 2.5a to 2.5c, there is still one parameter unknown which is ℎ convective
heat-transfer co-efficient. It can be obtained by the following equations:
𝑁𝑢𝐷 =
ℎ𝑓𝑙 ∙ 𝐷ℎ
𝑘𝑓𝑙
(2.6)
where 𝐷ℎ is hydraulic diameter that is equal to 𝐷𝑖 in the case of a filled round tube,𝑘𝑓𝑙
is the thermal conductivity of fluid and 𝑁𝑢𝐷 is determined according to the different
flow situations (laminar or turbulent) (Incropera, 2007, pp. 507,515):
laminar: 𝑁𝑢𝐷 = 3.66 (𝑅𝑒𝐷 ≲ 3000) (2.7a)
turbulent: 𝑁𝑢𝐷 =(𝑓/8)(𝑅𝑒𝐷 − 1000)𝑃𝑟
1 + 12.7(𝑓/8)1/2(𝑃𝑟2/3 − 1)
(3000 ≲ 𝑅𝑒𝐷 ≲5 × 10⁶)
(2.7b)
In Equation 2.7b 𝑅𝑒𝐷 is the Reynolds number, which is determinate by (Incropera,
2007, p. 487)

CHALMERS, Applied Mechanics, Master’s Thesis 2014:42 9
𝑅𝑒𝐷 =
4�̇�
𝜋𝐷ℎ𝜇
(2.8)
𝑚̇ refers to the mass flow-rate of fluid, and 𝜇 is the dynamic viscosity of fluid.
𝑓 is called the Moody friction factor, which is determinate by (Incropera, 2007, p. 490)
𝑓 = (0.790 ln 𝑅𝑒𝐷 − 1.64)−2 (2.9)
𝑃𝑟 is the Prandtl number interpreting the ratio of the momentum and thermal
diffusivities and defined by the equation𝑃𝑟 =𝜇𝐶𝑝
𝑘.
To combine the equations from 2.6 to 2.9, it can be concluded that for a fixed physical
layout and determined fluid the ℎ𝑓𝑙 is a function only of �̇� which is expressed as:
laminar: ℎ𝑓𝑙 = 𝑐𝑜𝑛𝑠𝑡𝑎𝑛𝑡 (2.10a)
turbulent: ℎ𝑓𝑙 = 𝑓(�̇�) (2.10b)
The flow situation is determined by �̇� itself. This calculation will be executed in the
model unit “Battery Unit” in Section 4.2.1.
2.2.2 Heat Balancing within Heat Exchanger
For a controlled volume the conservation of energy is stated in the expression as
(Incropera, 2007, p. 15):
𝑑𝐸𝑠𝑡𝑑𝑡
= �̇�𝑖𝑛 − �̇�𝑜𝑢𝑡 + �̇�𝑔 (2.11)
The term 𝐸𝑠𝑡 means stored thermal and mechanical energy, �̇�𝑔 is the thermal energy
(heat) generation rate, �̇�𝑖𝑛 and �̇�𝑜𝑢𝑡 are the thermal and mechanical energy transport
rate across the control surfaces as inflow and outflow.
To consider the tube of a tube-and-shell heat exchanger as a control volume (see Figure
2.4), the mechanical energy changes can be negligible and the stored thermal energy
change will be indicated by temperature change of heat-transfer fluid within the tube.
Figure 2.5 Tube-and-shell heat exchanger schematic (Ricker, 2014).
The Equation 2.11 reduces to the following form of the steady-flow energy equation
(Ricker, 2014):

CHALMERS, Applied Mechanics, Master’s Thesis 2014:42 10
𝑚𝐶𝑝
𝑑𝑇𝑜𝑑𝑡
= �̇�𝐶𝑝(𝑇𝑖 − 𝑇𝑜) + �̇� (2.12)
where
𝑚 Fluid mass within the tube (= 𝜌𝑓𝑙𝑉𝑓𝑙) [kg]
�̇� Fluid mass flow rate through the heat exchanger [kg/s]
𝑇𝑖, 𝑇𝑜 Temperature of fluid entering and leaving tubes [°C]
𝐶𝑝 Specific thermal capacity of fluid [J/ (kg·K)]
�̇� Heat transfer rate to the liquid in the tube [W]
Note that this equation is widely applicative to different heat transfer situations, such
as heater, radiator and chiller. For a heater, �̇� refers to the heater power, and for a
radiator refers to the heat rejection rate according to the performance diagram.
2.3 On-Off Controller
In many applications, it is required to control a quantity to stay at some fixed value,
such as temperature of hot water in a tank. On-off control is one basic mode of control
to solve this problem. It is also known as “bang-bang” control, relay control or two-
position control. An automatic temperature control might consist of a heater, an actuator
and a thermostat. The thermostat measures the water temperature in the tank and
activates the actuator to switch on the heater, when heating is required and deactivated
the actuator conversely. Consider that, if the switching point of thermostat was 60°C
which is the required temperature of hot water, the system would never work properly,
because the heater would be switched on and off rapidly.
To avoid that issue, the thermostat would have two switching points. One upper
switching point (might be 61°C) to shut down the heater, and the other lower switching
point (might be 59°C) to start the heater. Thus, there is a switching difference in the
thermostat of 2°C. Figure 2.6 shows the status of the heater versus the water temperature
under the on-off controlling of the thermostat. When the water temperature is at the
lower switching temperature (59°C) or below, the thermostat will activate the heater
and keep it working till water temperature reach the upper switching temperature
(61°C). When the water temperature is at the upper switching temperature or above, the
thermostat will turn the heater off and keep it off till the lower switching temperature.
Figure 2.6 Heater action over the water temperature.
Hea
ter
ON
OFF
59°C 60°C 61°CWater Temperature
Action when off Action when on

CHALMERS, Applied Mechanics, Master’s Thesis 2014:42 11
To clarify the control feature, Figure 2.7 presents the water temperature in the tank over
time. During T1 the heater is off. At point A the water temperature is at the lower
switching point (59°C) and the heater is turned on and keeps working during T2. At
point B the water temperature reaches the upper switching point (61°C) and the heater
is turned off. However, the heater is still hotter than the water and continues to give up
its heat till point C. Due to heat dissipation to the surroundings the temperature
decreases subsequently. At point D the heater is active again, because of the delay of
warming up, the temperature rise starts at point E later than D.
Figure 2.7 Tank temperature versus time (Spirax Sarco, 2011).
The example above shows an on-off controlling system with a single on-off controller,
which makes the system possible to switch between two statuses over temperature. In
Section 4.1.6 a combination strategy with a three on-off controller will be applied in
order to realise a more complex switching between four working conditions.

CHALMERS, Applied Mechanics, Master’s Thesis 2014:42 12
2.4 Phase Change Material (PCM)
Phase change materials (abbreviated to PCM) has high fusion heat which stores and
releases the amount of heat during melting and solidifying at a fixed point. As seen in
Figure 2.8, when the temperature is lower than the melting point, PCM is solid and heat
is absorbed as sensible heat with the temperature rise. When the temperature reaches
the melting point, heat is absorbed and stored as latent heat until the latent heat is up to
the maximum without the temperature increasing. At the same time PCM changes its
phase from solid to liquid. After that, PCM becomes liquid and heat is absorbed by
PCM and stored as sensible heat, see Figure 2.8. The melting temperature of PCM is
variable and can be chosen according to requirements.
Figure 2.8 The relationship of temperature and energy storage of PCM.

CHALMERS, Applied Mechanics, Master’s Thesis 2014:42 13
3 Battery Thermal Management Systems (BTMS)
3.1 Systems Functions
As stated in Section 2.1.2 and 2.1.3, the battery pack for safety, performance (both
power and capacity) and lifespan reasons should be stored in a controlled surrounding
where the temperature is controlled and there is no risk of thermal runaway. According
to a foundational research (Pesaran, 2001), the BTMS should be equipped with four
essential functions to ensure the right operation conditions of the battery pack:
1. Cooling
Due to inefficiency, battery cells will not only generate electricity but also heat.
This heat should be moved from the battery pack when battery temperature
reaches the optimum temperature or even in advance. Thus, a cooling function
is required in BTMS.
2. Heating
In cold climates, battery pack temperature probably falls below the lower
temperature limit. Hence, a heating function, such as PTC heater, is required to
assist the battery pack to reach the proper temperature range in a shorter time.
3. Insulation
In extreme cold or hot weather, the temperature difference between the inside
and outside of the battery pack is much larger than that in mild weather. Battery
temperature will thus fall (cold) or rise (hot) sooner out of the proper
temperature range. To prevent this, good insulation can slow down the falling
or rising of battery temperature, especially when the vehicle is parked outdoors.
4. Ventilation
Ventilation is required to exhaust the hazardous gases within battery pack. In
some systems, such as air systems, this function is combined with cooling and
heating functions.
In the following sections, different technologies of heating and cooling will be
introduced in detail and their possibility and ease of ventilation will be evaluated.
Insulation affects mainly stationary conditions rather than driving conditions, so it will
not be further discussed in this thesis.
CHALMERS, Applied Mechanics, Master’s Thesis 2014:42 14
3.2 Technologies of BTMS
3.2.1 Air Cooling and Heating
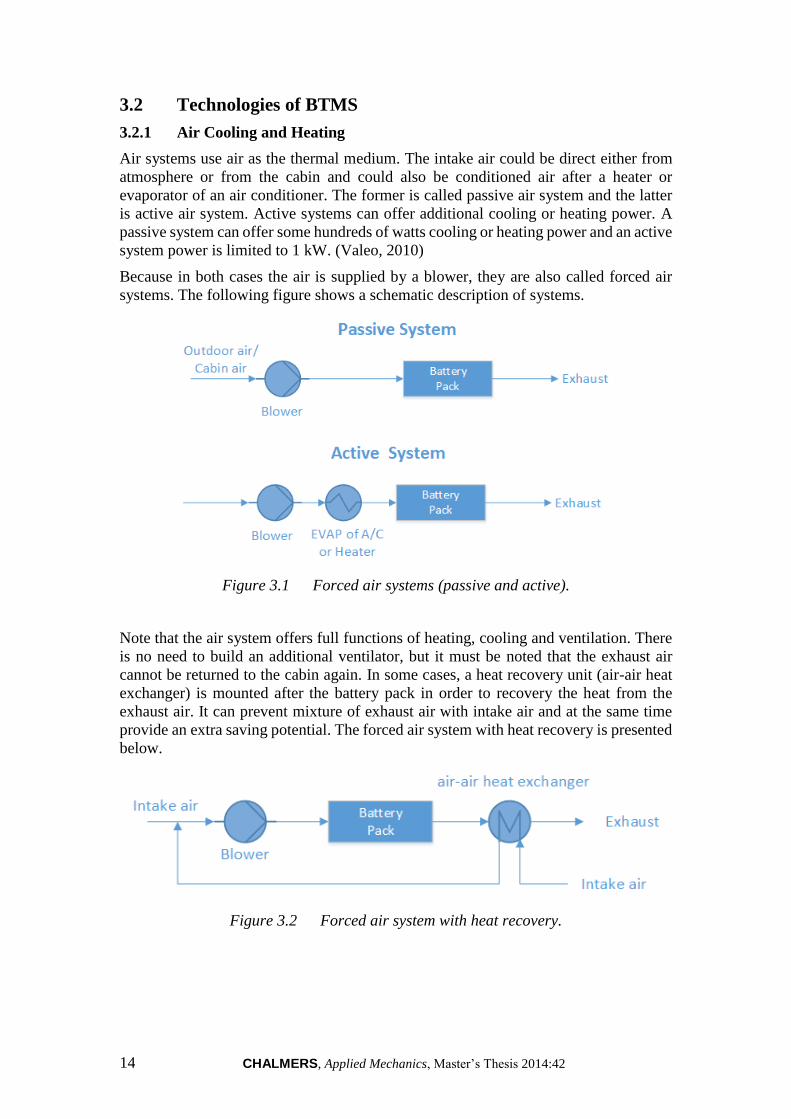
Air systems use air as the thermal medium. The intake air could be direct either from
atmosphere or from the cabin and could also be conditioned air after a heater or
evaporator of an air conditioner. The former is called passive air system and the latter
is active air system. Active systems can offer additional cooling or heating power. A
passive system can offer some hundreds of watts cooling or heating power and an active
system power is limited to 1 kW. (Valeo, 2010)
Because in both cases the air is supplied by a blower, they are also called forced air
systems. The following figure shows a schematic description of systems.
Figure 3.1 Forced air systems (passive and active).
Note that the air system offers full functions of heating, cooling and ventilation. There
is no need to build an additional ventilator, but it must be noted that the exhaust air
cannot be returned to the cabin again. In some cases, a heat recovery unit (air-air heat
exchanger) is mounted after the battery pack in order to recovery the heat from the
exhaust air. It can prevent mixture of exhaust air with intake air and at the same time
provide an extra saving potential. The forced air system with heat recovery is presented
below.
Figure 3.2 Forced air system with heat recovery.

CHALMERS, Applied Mechanics, Master’s Thesis 2014:42 15
3.2.2 Liquid Cooling and Heating
Besides air, liquid is another heat transfer fluid to transfer heat. There are generally two
groups of liquids applied for thermal management systems. One is dielectric liquid
(direct-contact liquid) which can contact the battery cells directly, such as mineral oil.
The other is conducting liquid (indirect-contact liquid) which can only contact the
battery cells indirectly, such as a mixture of ethylene glycol and water. Depending on
the different liquids, different layouts are designed. For direct-contact liquid, the normal
layout is to submerge modules in mineral oil. For indirect-contact liquid, a possible
layout can be either a jacket around the battery module, discrete tubing around each
module, placing the battery modules on cooling/heating plate or combining the battery
module with cooling/heating fins and plates. (Pesaran, 2001) Between these two groups,
indirect contact systems are preferred in order to achieve better isolation between
battery module and surroundings and thus better safety performance.
By different heat-sinks for cooling, liquid systems can also be categorized into either
passive systems or active systems. In passive liquid system, the heat-sink for cooling is
a radiator. This system has no ability to heat. Figure 3.3 presents the systematic scheme
of a passive liquid system. Heat transfer fluid is circulated by the pump within a closed
system. The circulating fluid absorbs heat from battery pack and releases heat via a
radiator. The cooling power depends strongly on the temperature between ambient air
and battery. Fans behind the radiator can improve the cooling performance, but if
ambient air is higher than the battery temperature or the difference between them is too
small, the passive liquid system becomes ineffective.
Figure 3.3 Passive liquid cooling system.

CHALMERS, Applied Mechanics, Master’s Thesis 2014:42 16
Figure 3.4 shows the systematic scheme of an active liquid system. There are two loops.
The upper is called the primary loop and the lower the secondary loop. The primary
loop is similar to the loop in a passive liquid system, where the heat transfer fluid is
circulated by pump. The secondary loop is actually an air conditioning loop (A/C loop).
The upper heat exchanger instead of being a radiator works as an evaporator (EVAP)
for cooling operation and connects both loops. During heating operation, the 4 way
valve will be switched, and the upper heat exchanger works as a condenser (COND)
and the lower heat exchanger works as an evaporator. The heating operation loop is
also called heat pump loop.
Figure 3.4 Active liquid cooling system.
3.2.3 Direct Refrigerant Cooling and Heating
Similar to active liquid systems, a direct refrigerant system (DRS) consists of an A/C
loop, but DRS uses refrigerant directly as heat transfer fluid circulating through battery
pack. The systematic layout is in Figure 3.5.
Figure 3.5 Direct refrigerant cooling system.

CHALMERS, Applied Mechanics, Master’s Thesis 2014:42 17
3.2.4 PCM
During melting, heat is absorbed by PCM and is stored as latent heat until the latent
heat is up to the maximum. The temperature is kept at melting point for a period and
the temperature increase is delayed. Therefore, PCM is used as conductor and buffer in
battery thermal management systems. Figure 3.6 shows the working mechanism of
PCM on battery cells. Also, a PCM is always combined with air cooling system or
liquid cooling system to manage the battery temperature.
Figure 3.6 The working mechanism of PCM on battery cells (Charged, 2014).
3.2.5 Thermo-electric Module
To improve cooling/heating power of passive air systems, there are two possible
upgrades. One is through thermo-electric modules, which will be introduced here. The
other is a heat pipe will be discussed in Section 3.2.6.
Thermo-electric module can convert electric voltage to temperature difference and vice-
versa. Here the former effect is adopted. That means it transfers heat through the module
by consuming electricity directly. The schematic structure is presented in Figure 3.7.
Two fans are installed to improve heat transfer by forced convection. To combine a
passive air system with thermo-electric module, the combined system is able to cool
down the battery even lower than the intake air temperature, but the power is still
limited to around some hundreds of watts and less than one kW. (Valeo, 2010) It’s easy
to switch between cooling and heating operation. To achieve that, the poles of
electrodes need to be reversed.
Figure 3.7 Thermoelectric cooling/heating system.

CHALMERS, Applied Mechanics, Master’s Thesis 2014:42 18
3.2.6 Heat Pipe
Besides thermo-electric modules, a heat pipe is another way to upgrade passive air
systems. The structure of a heat pipe is shown in Figure 3.8. The flat copper envelope
of the heat pipe was under partial vacuum. The capillary structure is made of sintered
copper powder. The heat pipe uses water as the working fluid. Water on the evaporator
side will absorb heat and become vapour lower 100°C due to low pressure inside. Water
on the condenser will dissipate heat to the surrounding and become liquid again. This
cycle repeats again and again.
Figure 3.8 Structure of the heat pipe (Tran, 2014).
The following figure shows the schematic description of a heat pipe cooling system. A
battery as heat source sits below the heat pipe (on the evaporating side). Cooling fins
as heat sinks are on the heat pipe (on the condensing side). According to the conclusion
of an experiment (Tran, 2014), heat pipe cooling system can reduce the thermal
resistance by 30% under natural convection as compared to without heat pipe . A
thermal resistance reduction of 20% under low air velocity convection is possible.
Note that, in comparsion to thermo-electric, a heat pipe is more reliable, because there
are no moving parts and no energy consumption. However, a heat pipe is unable to heat
the battery due to its fixed structural layout.
Figure 3.9 Scheme of heat pipe cooling system.

CHALMERS, Applied Mechanics, Master’s Thesis 2014:42 19
3.2.7 PTC Heater
PTC thermistors have many self-heated applications by utilizing their own voltage-
current or current-time characteristics. One of the applications is as a self-regulating
heater known as a PTC heater. The temperature of a PTC heater can be kept at a fixed
point through adjusting the resistance of PTC heater automatically, see Figure 3.10.
(Digikey, 2014)
Figure 3.10 Resistance versus Temperature for a PTC (Digikey, 2014).
3.3 Evaluation of Different Technologies
Here the comparison of different battery thermal management systems has been made
according to several items, see Appendix A1.
3.3.1 Forced-Air System
Forced-air cooling system with a simple structure has the advantage of high reliability
and low cost as well as easy maintenance, while it has poor thermal management, i.e.
beyond operating temperature, uneven uniformity of temperature distribution and
spread of thermal runaway.
In high ambient temperatures e.g. 45°C-50°C, the temperature inside the battery pack
exceeds 55°C which is beyond the operating temperature and will result in thermal
runaway. The uniformity of temperature distribution is also crucial due to the effect of
degradation and cycle life. If one ignores the ambient temperature, the difference
between cells is 2°C at the discharge current 2C-rate, and 4.8°C at the discharge current
6.67C-rate. The uniformity of temperature distribution is also affected by the flow rate.
As the flow rate increase, cell maximum temperature difference will increase, e.g. 3K
at Re=136 and 4.8K at Re=1347. With the increasing flow rate, the cell maximum
temperature difference can be even over 5K. (Sabbah, et al., 2008) It will give rise to
degradation and the decrease of cycle life because the heat transfer between cells is
quicker than the heat transfer from battery pack to air. So if one cell fails, thermal
runaway will spread over the battery pack. (Kizilel, et al., 2009)
The following Table 3.1 shows that at the same flow rate the air volume is much bigger
than the water volume, while the air heat transfer co-efficient is much lower than water
heat co-efficient. So for air cooling to dissipate heat as much as water cooling, it
requires higher volumetric flow rate which means more space and more power. Air

CHALMERS, Applied Mechanics, Master’s Thesis 2014:42 20
cooling system takes up larger space and consumes much more energy comparing to
liquid cooling system.
Table 3.1 The volumetric flow rate and average heat transfer co-efficient at the
same mass flow rate 50g/s (Pesaran, 2001).
Volumetric flow rate(L/s) Average heat transfer
coefficient (W/m^2K)
Air 43 25
Mineral Oil 0.057 57
Water 0.049 390
3.3.2 Liquid System
There are three types of cooling systems, namely passive cooling system, active cooling
system, and refrigerant cooling system.
The passive cooling system is affected by the ambient temperature, because the heat
dissipation is dependent on the radiator and the radiator dissipates heat through the
temperature difference between liquid and the ambient temperature. Under normal
circumstances, it works well, but under high ambient temperature it is insufficient.
Active cooling systems have good thermal performance which can keep the battery
pack within the operating temperature and keep temperature distribution between cells
even because of high heat co-efficient of the coolant. Due to many auxiliaries and
moving parts, the structure is complicated and difficult to maintain. It also has the
tendency of leaking out.
Compared to active cooling systems, direct refrigerant cooling systems are more
efficient because they use refrigerant directly to cool the system instead of using
refrigerant to cool coolant first and then using coolant to cool the system. The
weaknesses of refrigerant cooling system are complicated structure and difficult
maintenance, as well as potential to leak out and so on.
3.3.3 PCM System
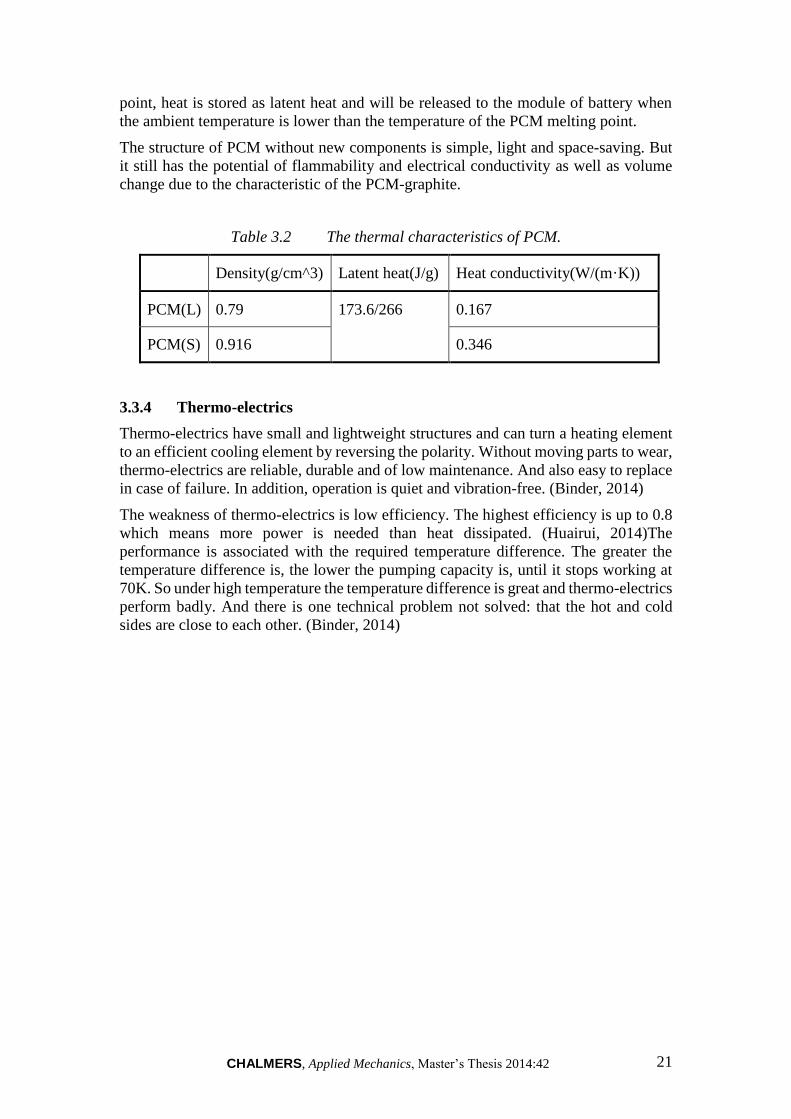
PCM cooling systems perform well on thermal management. Even under high ambient
temperatures from 45°C to 50°C, the temperature inside the cell pack is always below
55°C because of high thermal conductivity and latent heat. (Sabbah, et al., 2008) Table
3.2 shows the characteristics of PCMs. In the case of stressful situations e.g. at current
discharge rate 6.67C-rate and ambient temperatures of 45°C, the cell maximum
temperature difference doesn’t exceed 0.5K. And at normal conditions the difference
of temperature between cells is negligible. (Sabbah, et al., 2008) If one cell fails,
thermal runaway will not propagate because the PCM-graphite matrix absorbs and
spreads the heat quickly. (Kizilel, et al., 2009)
The weakness of PCM is that it is more suitable for cold conditions or in space. When
the temperature of the battery pack is higher than the temperature of the PCM melting
CHALMERS, Applied Mechanics, Master’s Thesis 2014:42 21
point, heat is stored as latent heat and will be released to the module of battery when
the ambient temperature is lower than the temperature of the PCM melting point.
The structure of PCM without new components is simple, light and space-saving. But
it still has the potential of flammability and electrical conductivity as well as volume
change due to the characteristic of the PCM-graphite.
Table 3.2 The thermal characteristics of PCM.
Density(g/cm^3) Latent heat(J/g) Heat conductivity(W/(m·K))
PCM(L) 0.79 173.6/266 0.167
PCM(S) 0.916 0.346
3.3.4 Thermo-electrics
Thermo-electrics have small and lightweight structures and can turn a heating element
to an efficient cooling element by reversing the polarity. Without moving parts to wear,
thermo-electrics are reliable, durable and of low maintenance. And also easy to replace
in case of failure. In addition, operation is quiet and vibration-free. (Binder, 2014)
The weakness of thermo-electrics is low efficiency. The highest efficiency is up to 0.8
which means more power is needed than heat dissipated. (Huairui, 2014)The
performance is associated with the required temperature difference. The greater the
temperature difference is, the lower the pumping capacity is, until it stops working at
70K. So under high temperature the temperature difference is great and thermo-electrics
perform badly. And there is one technical problem not solved: that the hot and cold
sides are close to each other. (Binder, 2014)

CHALMERS, Applied Mechanics, Master’s Thesis 2014:42 22
3.4 Recommended Cooling System
Through the trade-off of the items mentioned above, two cooling systems are
recommended, see Appendix A3.
As seen in Appendix A2, the performance of the items is described as a score and the
importance of the items is described as a weighting factor. The product of score and
weighting factor is the total score of the system, see Appendix A3. The systems of the
two highest scores are the recommended systems.
3.4.1 Combined Liquid System (CLS)
The first is the liquid cooling system, which has four working modes: bypass with
heater working; bypass without heater working; passive cooling system; and active
cooling system (see Figure 3.11). The cooling system takes advantage of both passive
cooling system and active cooling system. Passive cooling system has simple structure
and is able to dissipate heat under normal conditions with low energy consumption.
Under extreme condition, active cooling system has good thermal performance to keep
battery temperature in the required range.
Figure 3.11 The combined liquid system.

CHALMERS, Applied Mechanics, Master’s Thesis 2014:42 23
3.4.2 PCM Model (CLS+PCM)
The other preferred system is the combination of PCM material and CLS. PCM layers
are inserted into battery pack. It uses the advantage of PCM to have good thermal
performance, and CLS compensates for the limited operating temperature of PCM, see
Figure 3.12.
Figure 3.12 The combined liquid system with PCM system

CHALMERS, Applied Mechanics, Master’s Thesis 2014:42 24
4 Modelling of BTMS
Before starting to build up a MATLAB/Simulink model, a logic model was built to
construct an overall logic framework of BTMS simulation. It helped not only with the
following steps of modelling but also the possibility of future modification, extension
and improvement. A detailed graphic description is shown in Appendix B1.
The logic modelling was developed mainly in four steps:
Initial inputs and thermal cycles settings
Starting with the battery unit, physical parameters such as thermal capacity and
mass were defined as fixed parameters. When the PCM is located close to the
battery cell, these two parts could be treated as one integrated part. Thus the PCM
in this case could be considered a part within the battery unit. Focusing on the
thermal issues of the battery pack, there are two main parts of heat transfer flows
that influenced the battery temperature. One was the heat generation internally.
This part depended on driving behaviour, battery features and other vehicle
parameters, such as vehicle mass and aerodynamic performance. Since this thesis
focused on thermal rather than electro-thermal issues, this interior heat was
generated by exterior electro-thermal model. The other part was the external heat
dissipation. This part of the heat was from the different thermal cycles which took
away certain amounts of heat from the battery or in some cases brought heat to
the battery. The amount of heat depended both on which thermal cycle was
chosen and surrounding thermal conditions. Therefore, some parameters were
collected from the battery unit and testing conditions for calculation. After this
step the required battery thermal model was built.
Control strategy development
Normally, there are more than two thermal cycles designed in battery thermal
models. To decide which cycle to operate, some characteristic parameters were
required, such as battery temperature and ambient temperature. According to
these parameters, an operation state was chosen. The state corresponding to the
thermal cycle that was active and some related components, for example, the
pump would change their operating state as well. In some cases a sub-state under
the main operation state could be introduced in order to achieve better operation
feature.
Simplification and decoupling
Some complex calculation cases would give endless loops thus a simplified or
approximate calculation method should be adopted to solve the endless loops and
to accelerate the simulation. In other cases, decoupling was an alternative solution.
For example, the activated thermal cycle consumes electricity, causing additional
load and consequently additional heat. This coupling between the thermal model
and electro-thermal model would cause unexpected programming issues. Thus, it
was better to decouple these two models at the beginning and connect them later
when both of them worked well.
Data process and output
Not all output parameters were meaningful. Only parameters which represented
the outcome of the model were recorded. Some raw data was processed into
performance parameters (see Section 4.4) in order to evaluate different results
with a common standard. For a better visual understanding, some figures were
also plotted based on numerical data.
CHALMERS, Applied Mechanics, Master’s Thesis 2014:42 25
4.1 Modelling Conditions
Both of the models were built up based on almost the same conditions, meaning that
most parameters were the same. Some important ones are listed in the following Table
4.1.
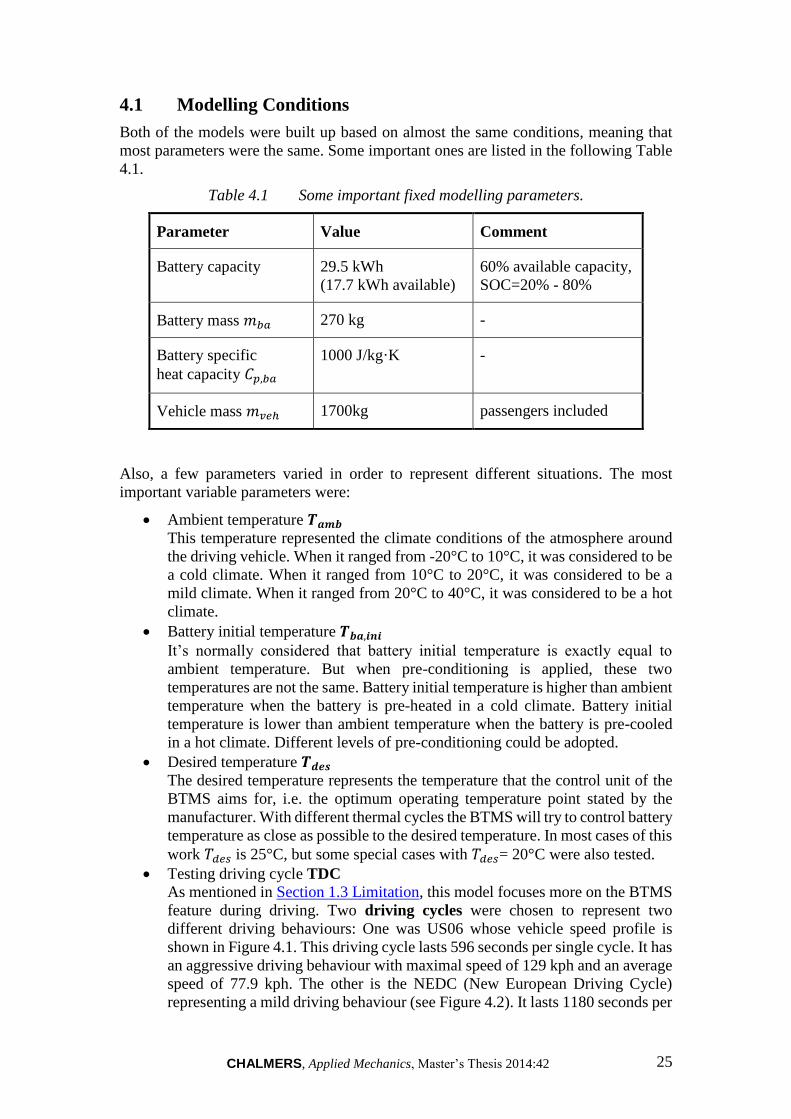
Table 4.1 Some important fixed modelling parameters.
Parameter Value Comment
Battery capacity 29.5 kWh
(17.7 kWh available)
60% available capacity,
SOC=20% - 80%
Battery mass 𝑚𝑏𝑎 270 kg -
Battery specific
heat capacity 𝐶𝑝,𝑏𝑎
1000 J/kg·K -
Vehicle mass 𝑚𝑣𝑒ℎ 1700kg passengers included
Also, a few parameters varied in order to represent different situations. The most
important variable parameters were:
Ambient temperature 𝑻𝒂𝒎𝒃
This temperature represented the climate conditions of the atmosphere around
the driving vehicle. When it ranged from -20°C to 10°C, it was considered to be
a cold climate. When it ranged from 10°C to 20°C, it was considered to be a
mild climate. When it ranged from 20°C to 40°C, it was considered to be a hot
climate.
Battery initial temperature 𝑻𝒃𝒂,𝒊𝒏𝒊 It’s normally considered that battery initial temperature is exactly equal to
ambient temperature. But when pre-conditioning is applied, these two
temperatures are not the same. Battery initial temperature is higher than ambient
temperature when the battery is pre-heated in a cold climate. Battery initial
temperature is lower than ambient temperature when the battery is pre-cooled
in a hot climate. Different levels of pre-conditioning could be adopted.
Desired temperature 𝑻𝒅𝒆𝒔 The desired temperature represents the temperature that the control unit of the
BTMS aims for, i.e. the optimum operating temperature point stated by the
manufacturer. With different thermal cycles the BTMS will try to control battery
temperature as close as possible to the desired temperature. In most cases of this
work 𝑇𝑑𝑒𝑠 is 25°C, but some special cases with 𝑇𝑑𝑒𝑠= 20°C were also tested.
Testing driving cycle TDC
As mentioned in Section 1.3 Limitation, this model focuses more on the BTMS
feature during driving. Two driving cycles were chosen to represent two
different driving behaviours: One was US06 whose vehicle speed profile is
shown in Figure 4.1. This driving cycle lasts 596 seconds per single cycle. It has
an aggressive driving behaviour with maximal speed of 129 kph and an average
speed of 77.9 kph. The other is the NEDC (New European Driving Cycle)
representing a mild driving behaviour (see Figure 4.2). It lasts 1180 seconds per
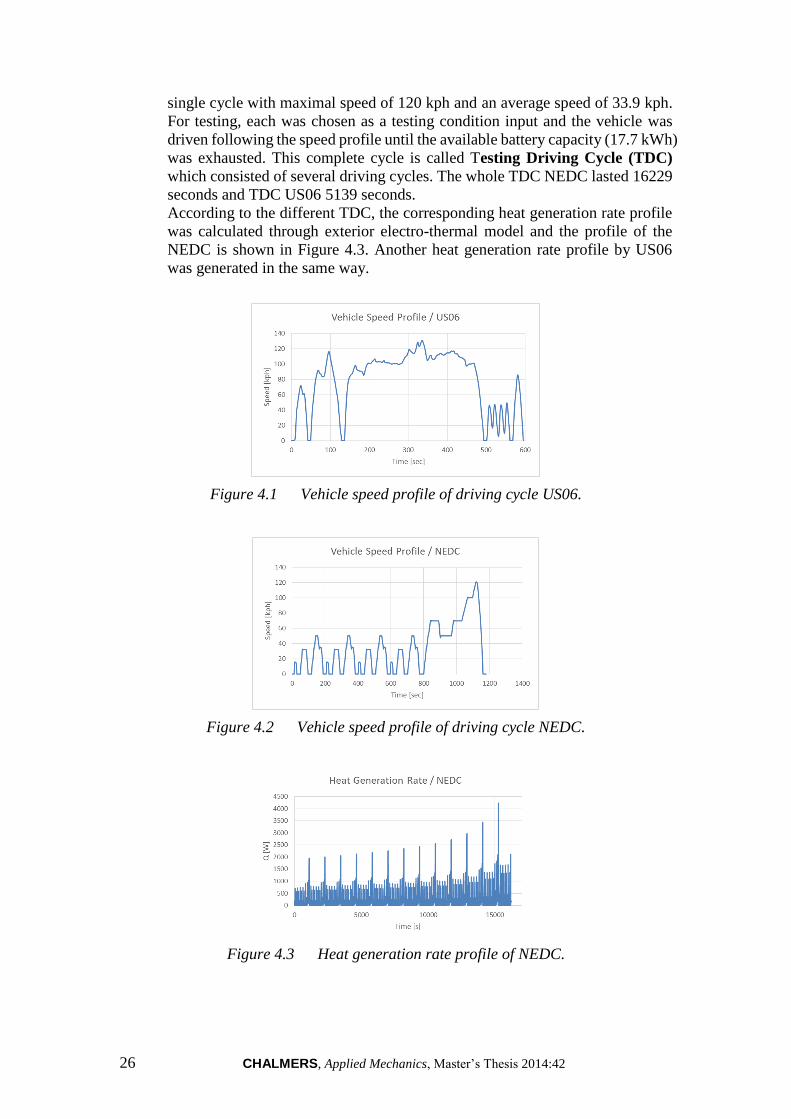
CHALMERS, Applied Mechanics, Master’s Thesis 2014:42 26
single cycle with maximal speed of 120 kph and an average speed of 33.9 kph.
For testing, each was chosen as a testing condition input and the vehicle was
driven following the speed profile until the available battery capacity (17.7 kWh)
was exhausted. This complete cycle is called Testing Driving Cycle (TDC)
which consisted of several driving cycles. The whole TDC NEDC lasted 16229
seconds and TDC US06 5139 seconds.
According to the different TDC, the corresponding heat generation rate profile
was calculated through exterior electro-thermal model and the profile of the
NEDC is shown in Figure 4.3. Another heat generation rate profile by US06
was generated in the same way.
Figure 4.1 Vehicle speed profile of driving cycle US06.
Figure 4.2 Vehicle speed profile of driving cycle NEDC.
Figure 4.3 Heat generation rate profile of NEDC.

CHALMERS, Applied Mechanics, Master’s Thesis 2014:42 27
4.2 CLS Model
Based on the system layout of CLS in Section 3.4.1, a MATLAB/Simulink model was
developed following the four steps mentioned at the beginning of this chapter.
A basic model layout is shown in the following Figure 4.4. The complete model layout
is attached in Appendix B2.
In the basic layout, the temperature flow of heat transfer fluid connects the main parts
together. In initial step, testing data was loaded. Then starting with the battery unit the
fluid was heated up. Afterwards, the fluid flows through different parts, but only one
outcome was chosen by control unit. The flow rate of the pump was also governed by
control unit. Lastly, the coolant returned to battery pack. This calculation process was
repeated until the driving cycle ended.
Figure 4.4 Basic Simulink model layout for CLS.
4.2.1 Battery Unit
It was assumed that the parts of battery cells were homogeneous and the interior heat
conductivity between cells approaches infinity so that the heat transferred between cells
very quickly and that all points on the battery cells had the same temperature, called
battery temperature 𝑇𝑏𝑎. The differential of battery temperature over time is stated with
the following equation:
𝑑𝑇𝑏𝑎𝑑𝑡
=�̇�𝑔𝑒𝑛 − �̇�𝑑𝑖𝑠
𝑚𝑏𝑎𝐶𝑝,𝑏𝑎
(4.1)
�̇�𝑔𝑒𝑛 and �̇�𝑑𝑖𝑠 states respectively heat generation rate and heat dissipation rate. The
former is set up by the program interior signal generator or by heat generation rate
profile of either US06 or NEDC (see Figure 4.3). This heat represents the heat generated
through battery electro-thermal effects. The later one was calculated by sub-system of
the battery unit, which is expressed in Equation 4.2. This heat represents the heat
dissipated through thermal cycle(s). The value is positive when thermal cycle is in

CHALMERS, Applied Mechanics, Master’s Thesis 2014:42 28
cooling operation. The value is negative when thermal cycle is in heating operation.
𝑚𝑏𝑎 and 𝐶𝑝,𝑏𝑎 is battery mass and specific heat capacity of battery
In the battery pack, three discrete copper tubes are jointed very closely to the battery
cells in order to transfer heat to and from the battery. Overall heat transfer co-efficient
𝑈 will be thus calculated as mentioned in Section 2.2.1. 𝐴 represents the contact area
which is the total inner area of the three tubes. 𝑇𝑓𝑙̅̅̅̅ − 𝑇𝑏𝑎 represents the approximate
mean temperature difference. 𝑇𝑓𝑙̅̅̅̅ is the mean temperature of fluid inlet and outlet
temperature.
4.2.2 Air Conditioner (Active Cooling)
When heat transfer fluid flows through air conditioner, the fluid temperature differential
is expressed as the following equation varied from Equation 2.12:
𝑑𝑇𝑜𝑑𝑡
=�̇�𝑓𝑙𝐶𝑝,𝑓𝑙(𝑇𝑖 − 𝑇𝑜) − �̇�𝐴𝐶
𝑚𝑓𝑙,𝐴𝐶𝐶𝑝,𝑓𝑙
(4.3)
The air conditioner always takes heat from the fluid, thus �̇� in Equation 2.12 is always
negative. Here �̇� is replaced by −�̇�𝐴𝐶 where �̇�𝐴𝐶 means cooling load of air condition
and is always positive. �̇�𝐴𝐶 can be calculated by the following equation:
�̇�𝐴𝐶 = 𝑃𝑒𝑙,𝐴𝐶 ∙ 𝐶𝑂𝑃 (4.4)
𝑃𝑒𝑙,𝐴𝐶 is the electricity consumption by air conditioner and COP is Co-efficient of
Performance which is dependent on working condition of air conditioner.
4.2.3 Radiator (Passive Cooling)
Similar to the air conditioner, the fluid temperature differential in the radiator can be
expressed as:
𝑑𝑇𝑜𝑑𝑡
=�̇�𝑓𝑙𝐶𝑝,𝑓𝑙(𝑇𝑖 − 𝑇𝑜) − �̇�𝑅𝐴
𝑚𝑓𝑙,𝑅𝐴𝐶𝑝,𝑓𝑙
(4.5)
Where �̇�𝑅𝐴 is the product of overall heat transfer co-efficient, contact area and
temperature difference of inlet fluid temperature and ambient temperature:
�̇�𝑅𝐴 = 𝑈𝐴(𝑇𝑓𝑙,𝑖𝑛 − 𝑇𝑎𝑚𝑏) (4.6)
and the product 𝑈𝐴 is given by the technical performance maps of the chosen radiator.
It is expressed as a function of fluid mass flow rate and air flow rate:
𝑈𝐴 = 𝑓(�̇�𝑓𝑙, �̇�𝑎𝑖𝑟) (4.7)
In other expression, �̇�𝑅𝐴 is decided by temperature difference between fluid and
ambient, fluid mass flow rate and air flow rate these three terms:
�̇�𝒅𝒊𝒔 = 𝑼𝑨(𝑻𝒇𝒍̅̅ ̅̅ − 𝑻𝒃𝒂) (4.2)

CHALMERS, Applied Mechanics, Master’s Thesis 2014:42 29
�̇�𝑅𝐴 = 𝑓(�̇�𝑓𝑙, �̇�𝑎𝑖𝑟 , 𝑇𝑓𝑙,𝑖𝑛 − 𝑇𝑎𝑚𝑏)
4.2.4 PTC Heater (Heating)
Heater energy balance equation is expressed as:
𝑚𝐶𝑝
𝑑𝑇𝑜𝑢𝑡𝑑𝑡
= �̇�𝐶𝑝(𝑇𝑖𝑛 − 𝑇𝑜𝑢𝑡) + �̇� (4.8)
where �̇� is the heat provided by heater, 𝑇𝑖𝑛, 𝑇𝑜𝑢𝑡 is the temperature of coolant in and
out,�̇� is the coolant mass flow rate, 𝑚 is the coolant mass in tubes.
PTC heater is widely used as an electrical vehicle heater and it has two main
characteristics (Lauda, 2014):
P = 𝑃𝑚𝑎𝑥 = 𝑐𝑜𝑛𝑠𝑡 (4.9)
mfl = mfl.rated (4.10)
Where the heater power P is always equal to the maximum heater power𝑃𝑚𝑎𝑥, the mass
of flow rate mfl is constant.
4.2.5 Pump
The electrical energy consumption of the pump is expressed as the following:
𝑃 =
𝛶𝐻�̇�
𝜂
(4.11)
where the specific gravity 𝛶 is the multiplication of the coolant density and gravity and
expressed as:
𝛶 = 𝜌𝑔
(4.12)
where�̇� is the mass flow rate, 𝜂 is the efficiency of the pump, 𝐻 is the total head and
is related to the mass flow rate �̇�, see Figure 4.6:
𝐻 = 𝑓(�̇�) (4.13)
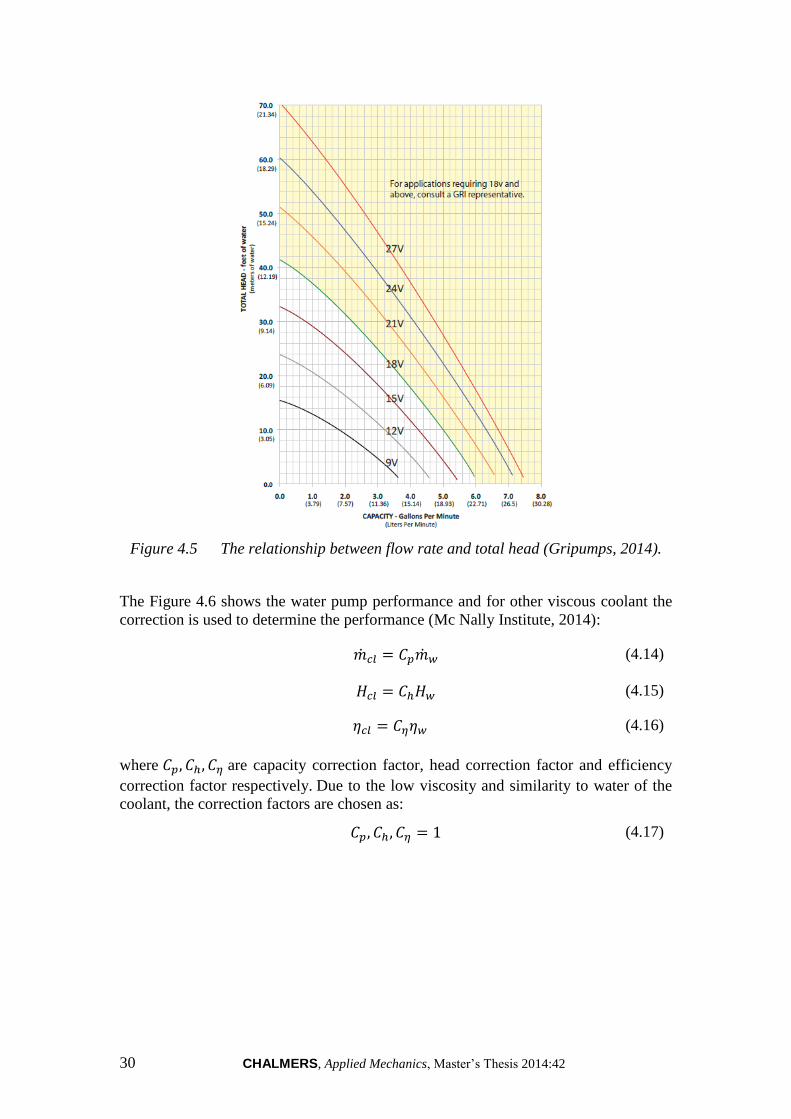
CHALMERS, Applied Mechanics, Master’s Thesis 2014:42 30
Figure 4.5 The relationship between flow rate and total head (Gripumps, 2014).
The Figure 4.6 shows the water pump performance and for other viscous coolant the
correction is used to determine the performance (Mc Nally Institute, 2014):
�̇�𝑐𝑙 = 𝐶𝑝�̇�𝑤 (4.14)
𝐻𝑐𝑙 = 𝐶ℎ𝐻𝑤 (4.15)
𝜂𝑐𝑙 = 𝐶𝜂𝜂𝑤 (4.16)
where 𝐶𝑝, 𝐶ℎ, 𝐶𝜂 are capacity correction factor, head correction factor and efficiency
correction factor respectively.Due to the low viscosity and similarity to water of the
coolant, the correction factors are chosen as:
𝐶𝑝, 𝐶ℎ, 𝐶𝜂 = 1
(4.17)

CHALMERS, Applied Mechanics, Master’s Thesis 2014:42 31
4.2.6 Control Unit
Generally, a complex on-off control strategy is applied which has already been
introduced in Section 2.3. Here three on-off controllers with different switching
temperatures create four states and each state matches an operation modus. Controller
I controls the switching between State 1(Heating) and State 2(Bypass). Controller II
controls the switching between State 2 and State 3(Passive cooling). Controller III
controls the switching between State 3 and State 4(Active cooling).
Table 4.2 Switching points of three on-off controllers (Tdes=20/25°C).
On-off
controller
Lower switching
temperature
Upper switching
temperature State Operation
1 Heating
I
- 10
2 Bypass
II
Tdes − 2 (18/23°C) Tdes (20/25°C)
3 Passive Cooling
III
Tdes (20/25°C) Tdes + 2 (22/27°C)
4 Active Cooling
Note that, for controller I, there is no lower switching temperature or the lower
switching temperature is the same as the upper switching temperature of 10°C. The
reason to set up this on-off controller is to heat the battery with the PTC heater when
the battery is below the lower temperature limit of 10°C (Section 2.1.3) and to switch
the state into 2 (Bypass) when battery is heated up above 10°C. Since the focus is the
driving cycle and the cooling load from ambient is negligible, the battery temperature
will not drop below 10°C again after it has been above 10°C. Thus, the lower switching
temperature is invalid here. For controller II and III, variable switching points are
introduced in order to create a flexible control strategy. However, Tdes is set to 25°C in
most cases. Only in a few cases Tdes was set to 20°C.
Besides the basic strategy described above, there are two improvements for better
performance:
1. Forced switching to active cooling
There is one exceptional situation which the control unit has to face. It is that
the ambient temperature is higher than desired temperature. In this case the
passive cooling is invalid and even has a negative effort i.e. bringing heat to the
battery. Thus, the state of passive cooling should be forced to switch to active
cooling when ambient temperature is higher than Tdes − 4K. The reason to set
this temperature point is that the radiator operates when battery temperature is
from Tdes until to Tdes − 2𝐾. To make passive cooling efficient, a temperature
difference between the battery and ambient temperature of an extra 2K is needed.
Thus, the ambient temperature should below than Tdes − 4K(Tdes − 2K − 2K) to make sure that passive cooling works properly and efficiently. The control
strategy for this is shown in Table 4.3.

CHALMERS, Applied Mechanics, Master’s Thesis 2014:42 32
2. Sub-states during active cooling
Another improvement of control unit is achieved by dividing active cooling into
three sub-levels. The higher the battery temperature, the more powerful the
active cooling is. The switching points of the controller are shown in Table 4.4.
With this improvement, electricity could be further saved when battery
temperature is low and cooling is not so urgently required. Moreover, a high AC
level offers more powerful cooling and ensures safety during high battery
temperature.
Table 4.3 Control strategy for the high ambient temperature (Tdes=20/25°C).
Lower switching
temperature
Upper switching
temperature State Operation
1 Heating
- 10
2 Bypass
Tdes – 2 (18/23°C) Tdes (20/25°C)
4 Passive Cooling
Table 4.4 Sub-states of active cooling (Tdes=20/25°C).
Lower switching
temperature
Upper switching
temperature State Operation
4.1 AC level low
Tdes + 1 (21/26°C) Tdes + 3 (23/28°C)
4.2 AC level medium
Tdes + 2 (22/27°C) Tdes + 4 (24/29°C)
4.3 AC level high

CHALMERS, Applied Mechanics, Master’s Thesis 2014:42 33
4.3 PCM Model
To verify the usage and effectiveness of PCM, the PCM unit is inserted into the battery
pack of the liquid cooling system.
The state of the PCM is controlled by the battery temperature and heat generated by
battery, see Figure 4.7.
Figure 4.6 PCM unit with battery in battery pack.
The model is simplified and the temperature of the PCM is equal to the battery
temperature ignoring the process of melting and solidifying:
𝑇𝑃𝐶𝑀 = 𝑇𝑏𝑎 (4.18)
The battery temperature is defined as:
𝑑𝑇𝑏𝑎,𝑃𝐶𝑀𝑑𝑡
=�̇�𝑔𝑒𝑛 − �̇�𝑑𝑖𝑠 − �̇�𝑎𝑏𝑠𝑜𝑟𝑏𝑒𝑑
𝑚𝑏𝑎𝐶𝑝,𝑏𝑎 +𝑚𝑃𝐶𝑀𝐶𝑝,𝑃𝐶𝑀
(4.19)
Where �̇�𝑔𝑒𝑛 is the heat generated by the battery, �̇�𝑑𝑖𝑠 is the heat dissipated by the
cooling system, �̇�𝑎𝑏𝑠𝑜𝑟𝑏𝑒𝑑 is the heat absorbed and stored by the PCM as latent heat.
The point at which the PCM starts to store heat depends on the battery temperature. If
battery temperature exceeds the melting temperature of the PCM, heat will be absorbed
by the PCM and stored as latent heat at a certain temperature. When battery temperature
goes below the melting temperature, the latent heat will be released.
Table 4.5 An illustrative table for PCM unit.
Battery Temperature PCM Latent heat
Tbattery < Tmelting 𝑄𝑎𝑏𝑠𝑜𝑟𝑏𝑒𝑑 = 0
Tbattery = Tmelting
Qgene < 𝐻𝑚𝑎𝑥
𝑄𝑎𝑏𝑠𝑜𝑟𝑏𝑒𝑑 = Qgene
Tbattery > Tmelting
Qgene > 𝐻𝑚𝑎𝑥
𝑄𝑎𝑏𝑠𝑜𝑟𝑏𝑒𝑑 = Hmax

CHALMERS, Applied Mechanics, Master’s Thesis 2014:42 34
where 𝐻𝑚𝑎𝑥 is the total latent heat of PCM.
The PCM melting temperature is set to 23°C. During driving, the latent heat stored in
the PCM will not be released and instead it will be dissipated by BTMS.
4.4 Performance Parameters
In the following, the equations of performance parameters are briefly shown. It includes
the electrical energy consumption of each component and the temperature of the battery
as well as the working time for each component.
The total electrical energy consumption is formulated as a combination of electrical
energy consumed by each component:
𝐸𝑇 =∑𝐸𝐻𝑇 + 𝐸𝐵𝑃 + 𝐸𝑃𝐶 + 𝐸𝐴𝐶 (4.20)
The heater consumption is obtained through the integration of heater power and pump
power when theheaterworks:
𝐸𝐻𝑇 = ∫𝑃𝑃𝑇𝐶 + 𝑃𝑝𝑢𝑚𝑝𝑑𝑡
(4.20)
The bypass consumption is calculated by the integration of pump power when the
coolant is going through the bypass:
𝐸𝐵𝑃 = ∫𝑃𝑝𝑢𝑚𝑝𝑑𝑡
(4.21)
The air conditioner consumption is the sum of the integration of air condition power
and pump power when the air conditioner works:
𝐸𝐴𝐶 = ∫𝑃𝐴𝐶 + 𝑃𝑝𝑢𝑚𝑝𝑑𝑡
(4.22)
The maximum battery temperature is defined as:
𝑇𝑏,𝑚𝑎𝑥 = 𝑚𝑎𝑥 𝑇𝑏(𝑡) (4.23)
The average battery temperature is calculated as:
𝑇𝑏,𝑎𝑣𝑒 = 𝑇𝑏(𝑡)̅̅ ̅̅ ̅̅ ̅ (4.24)
The average battery temperature 𝑇𝑏,𝑎𝑣𝑒,𝑐 represents the average battery temperature
during passive cooling and active cooling. It is characterized by the following equation:
𝑇𝑏,𝑎𝑣𝑒,𝑐 = 𝑇𝑏(𝑡1)̅̅ ̅̅ ̅̅ ̅̅ (4.25)
In addition, there are some other parameters to evaluate the model performance.
𝑡𝐻𝑇,𝑡𝐵𝑃,𝑡𝑃𝐶 and 𝑡𝐴𝐶 represent operating duration of heating, by-pass, passive
cooling and active cooling respectively.

CHALMERS, Applied Mechanics, Master’s Thesis 2014:42 35
𝑡10 is the time when the battery temperature is above 10°C for the first time after
driving cycle starts at cold condition.
𝑡𝑑𝑒𝑠 is expressed as the time when the battery temperature is below the desired
temperature for the first time after driving cycle starts at hot condition.
𝑡𝑃𝐶𝑀(PCM only) is to evaluate how long the PCM can keep the battery at the melting
temperature by using latent heat.

CHALMERS, Applied Mechanics, Master’s Thesis 2014:42 36
5 Results and Discussion
In following sections, two models are tested under different conditions which are
described in Section 4.1. In addition, for the PCM model the mass of the PCM will
affect the energy consumption. Thus, a detailed comparison between the PCM model
and the CLS model is included.
5.1 CLS Model
For better visual understanding of the modelling results, four types of figures are
generated by Simulink with numerical result. They show temperature, energy
consumption, transferred heat and overview in detail. An example is introduced for the
condition NEDC, Tamb=20°C, Tba_ini=20°C and Tdes=25°C. More details are
attached in Appendix C.
Figure 5.1 shows the temperature changes over time. Blue curve represents the battery
temperature; green, the heat transfer fluid (coolant) inlet temperature before battery
unit; and red, the coolant outlet temperature after battery unit.
Figure 5.1 Temperature feature of battery and coolant over time.

CHALMERS, Applied Mechanics, Master’s Thesis 2014:42 37
Figure 5.2 summaries the electricity consumption of different components and also the
total. Note that, for passive cooling, the radiator consumes nothing by itself and only
pump energy consumption has been taken into account.
Figure 5.2 Electricity consumption feature.
Figure 5.3 shows the heat transferred between fluid and battery. Red curve is for heating
(in this result equal to zero); cyan is for passive cooling; and blue is for active cooling.
In this figure, the effective cooling or heating power of the battery is shown in detail.
Figure 5.3 Heat transfer feature.

CHALMERS, Applied Mechanics, Master’s Thesis 2014:42 38
Figure 5.4 gives an overview of the whole operation feature. It consists of information
about heat generation rate, battery temperature, state of the BTMS and pump flow rate.
Figure 5.4 Overview operation feature.

CHALMERS, Applied Mechanics, Master’s Thesis 2014:42 39
5.1.1 NEDC versus US06
Customers drive their cars in different ways. Thus, two driving cycles representing two
styles are tested with these models. The ambient temperature varied from-20°C to 40°C
with an interval of 10°C. The battery initial temperature was equal to the ambient
temperature i.e. there was no pre-conditioning introduced. The following diagrams
show a comparison of energy consumption between the two driving cycles. The
different colors show accumulated electricity consumption of different BMTS states for
the whole TDC. Also, the table below the diagram shows the exact sub-total, the total
electricity consumption and its percentage in available battery capacity.
Figure 5.5 Electricity Consumption for TDC NEDC and US06.
There are several points to be highlighted:
In cold and hot weather, more electricity is used.
Both diagrams show the tendency that the colder or hotter the weather is, the
more energy will be used. Especially in extreme weather, the total soon rises.
The electricity required for the NEDC accounted for 16% of total available
battery capacity at the ambient temperature of -20°C. It therefore shortened the
electric range significantly.
NEDC consumed more in cold weather and less in hot weather. US06 was the
opposite.
US06, as an aggressive cycle, had a higher heat loss, thus generating more heat
during driving. Consequently, it utilized the heat generated by itself for heating
in cold weather and less electricity for heating was required. Conversely, in hot
weather, due to high heat generation rate, much more cooling load was needed.
Therefore, TDC US06 consumed more electricity than NEDC.

CHALMERS, Applied Mechanics, Master’s Thesis 2014:42 40
In mild weather pump consumption dominates
To compare both results at an ambient temperature of 10°C, the pump consumed
more with the TDC NEDC. The reason for this was the NEDC lasted 16229
seconds which was about three times longer than US06 and the energy used
during bypass state (only pump operating) dominated the total.
5.1.2 Cold and Hot Weather
From Figure 5.5 is it obviously concluded that electricity consumption by BTMS is
much higher in cold and hot weather than it in mild weather. Optimization is required.
One method to save energy would be to increase battery initial temperature in advance.
In other words, the battery should be kept close to the operation temperature range as
much as possible. This improvement could be realized by better insulation or/and active
pre-conditioning. Here active pre-conditioning was further investigated as a potential
energy saving measure. Active pre-conditioning means that the battery will be heated
up in cold weather (pre-heating) or be cooled down in hot weather (pre-cooling) before
driving. Its advantage is to prepare the battery in the operating temperature range in
advance and thus the battery can work optimally with full performance. In addition, if
the battery charger is connected, pre-conditioning makes use of electricity from power
grid instead of consuming battery capacity, i.e. it can save energy and offers longer
electric range of EV.
The following figure shows how much contribution pre-heating can make. The ambient
temperatrue was fixed at -20°C. The battery initial temperature (Tba_ini) varied from -
20°C (meaning no pre-heating) via -10°C and 0°C up to 10°C. It was assumed here that
the EV was connected to the power grid and thus the energy consumed by pre-
conditioning was not taken into account in the energy consumption for testing driving
cycle. From this figure it will be seen that the pre-heating reduces electricity
consumption dramatically. The maximum saving potential could reach 91% when the
battery was heated to 10°C in advance.
Figure 5.6 Energy saving by pre-heating for US06.

CHALMERS, Applied Mechanics, Master’s Thesis 2014:42 41
Another probable issue of BTMS in cold weather is passive cooling. The figure 5.7
shows the temperature changes of the battery and coolant. Around 4100 seconds and
the 4600 seconds, there were two intervals for passive cooling. The inlet fluid
temperature fell below 0°C and the temperature difference between fluid and battery
was larger than 20K. This large temperature gradient would potentially damage battery
lifetime. This issue was caused by too high a pump flow rate which consequently
resulted in too high cooling power. A special control of the pump could be introduced
in future work for passive cooling in cold weather in order to reduce pump flow rate
and to offer coolant of proper temperature.
Figure 5.7 Temperature feature for US06, Tamb=-20°C.

CHALMERS, Applied Mechanics, Master’s Thesis 2014:42 42
Similar to cold weather, electricity consumption in hot weather could be further saved
by pre-cooling. Figure 5.8 shows the results for testing driving cycle US06 with fixed
ambient temperature of 30°C and variable battery initial temperature from 30°C(means
no pre-cooling) via 25/20/15°C to 10°C. The reduction of electricity consumption was
not as significant as that by pre-heating, but there was still about half saved when the
battery was cold down to 10°C in advance.
Figure 5.8 Energy saving by the pre-cooling for US06.
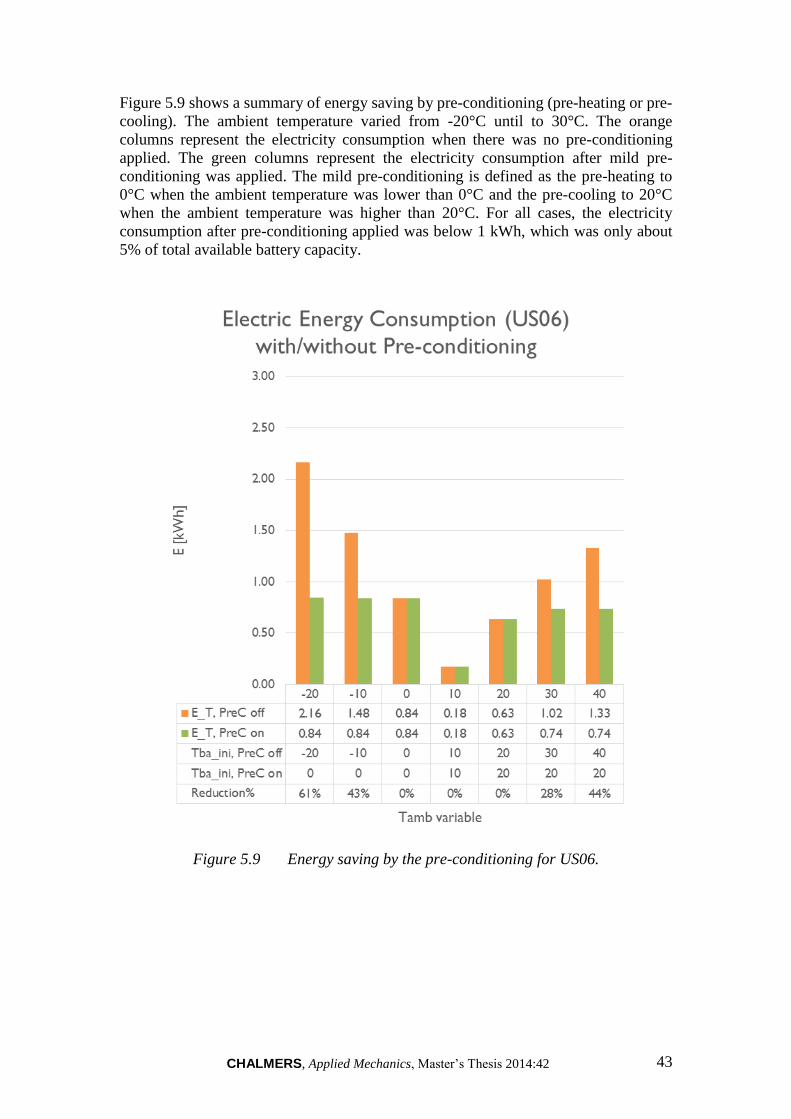
CHALMERS, Applied Mechanics, Master’s Thesis 2014:42 43
Figure 5.9 shows a summary of energy saving by pre-conditioning (pre-heating or pre-
cooling). The ambient temperature varied from -20°C until to 30°C. The orange
columns represent the electricity consumption when there was no pre-conditioning
applied. The green columns represent the electricity consumption after mild pre-
conditioning was applied. The mild pre-conditioning is defined as the pre-heating to
0°C when the ambient temperature was lower than 0°C and the pre-cooling to 20°C
when the ambient temperature was higher than 20°C. For all cases, the electricity
consumption after pre-conditioning applied was below 1 kWh, which was only about
5% of total available battery capacity.
Figure 5.9 Energy saving by the pre-conditioning for US06.

CHALMERS, Applied Mechanics, Master’s Thesis 2014:42 44
5.1.3 Mild Weather
In mild weather, the total electricity consumption was relatively low compared to that
in hot or cold weather. Here the influence of the desired temperature was further
investigated. The diagram left in the following figure shows the result at the variable
ambient temperature and the fixed desired temperature of 25°C. When the ambient
temperature was at 10°C or 15 °C, battery temperature was below 25°C in the whole
TDC and thus BTMS stayed in the bypass state. Only when the ambient temperature
rose to 20°C, passive cooling was active and a little more energy was consumed. In
comparison to that, the result for the desired temperature of 20°C were very different.
Firstly, the passive cooling was activated in advance even at the ambient temperature
of 15°C. Moreover, at the ambient temperature of 20°C the passive cooling was invalid
and active cooling was required in order to cool down the battery below 20°C. In
conclusion, the desired temperature will obviously affect total electricity consumption.
In mild weather, it could be estimated that the higher desired temperature the less total
electricity was consumed. However, the desired temperature was set up according the
battery feature. Safety, performance and lifespan should also be considered. Further
investigation about setting of the desired temperature will reveal more details about its
influence.
Figure 5.10 Electricity Consumption in mild weather for NEDC, Tdes=25/20°C.
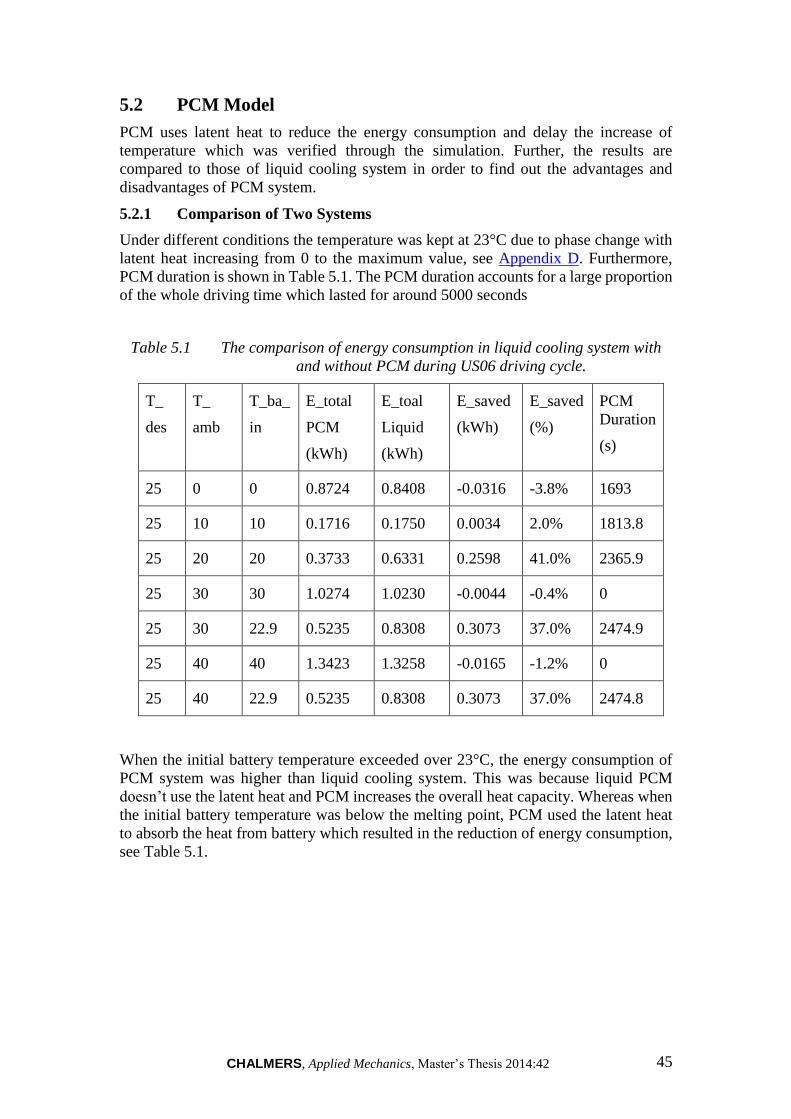
CHALMERS, Applied Mechanics, Master’s Thesis 2014:42 45
5.2 PCM Model
PCM uses latent heat to reduce the energy consumption and delay the increase of
temperature which was verified through the simulation. Further, the results are
compared to those of liquid cooling system in order to find out the advantages and
disadvantages of PCM system.
5.2.1 Comparison of Two Systems
Under different conditions the temperature was kept at 23°C due to phase change with
latent heat increasing from 0 to the maximum value, see Appendix D. Furthermore,
PCM duration is shown in Table 5.1. The PCM duration accounts for a large proportion
of the whole driving time which lasted for around 5000 seconds
Table 5.1 The comparison of energy consumption in liquid cooling system with
and without PCM during US06 driving cycle.
T_
des
T_
amb
T_ba_
in
E_total
PCM
(kWh)
E_toal
Liquid
(kWh)
E_saved
(kWh)
E_saved
(%)
PCM
Duration
(s)
25 0 0 0.8724 0.8408 -0.0316 -3.8% 1693
25 10 10 0.1716 0.1750 0.0034 2.0% 1813.8
25 20 20 0.3733 0.6331 0.2598 41.0% 2365.9
25 30 30 1.0274 1.0230 -0.0044 -0.4% 0
25 30 22.9 0.5235 0.8308 0.3073 37.0% 2474.9
25 40 40 1.3423 1.3258 -0.0165 -1.2% 0
25 40 22.9 0.5235 0.8308 0.3073 37.0% 2474.8
When the initial battery temperature exceeded over 23°C, the energy consumption of
PCM system was higher than liquid cooling system. This was because liquid PCM
doesn’t use the latent heat and PCM increases the overall heat capacity. Whereas when
the initial battery temperature was below the melting point, PCM used the latent heat
to absorb the heat from battery which resulted in the reduction of energy consumption,
see Table 5.1.

CHALMERS, Applied Mechanics, Master’s Thesis 2014:42 46
5.2.2 Choose the PCM Mass
The additional mass of the PCM will increase vehicle weight and at the same time
decrease the performance of vehicle. However, PCM can use latent heat to decrease
energy consumption of BTMS. So the balance point should be found which is related
to the PCM mass and its most profitable point.
Table 5.2 Battery capacity loss with the mass addition
Weight
(ton)
Range
(km)
Battery capacity
(kWh)
Battery capacity
loss(kWh)
1.7 203.05 29.5 0
1.71 202.43 29.59035 0.090352
1.72 201.81 29.77217 0.272167
1.73 201.18 30.0489 0.548904
1.74 200.56 30.42197 0.921968
1.75 199.95 30.89363 1.393627
1.76 199.34 31.4686 1.968601
1.77 198.74 32.15105 2.651049
1.78 198.14 32.94777 3.447766
1.79 197.55 33.86507 4.365067
1.8 196.95 34.91395 5.413947
The relationship between mass addition and battery capacity loss was estimated
according to range loss, see Table 5.2.

CHALMERS, Applied Mechanics, Master’s Thesis 2014:42 47
PCM of various mass were used to test BTMS energy consumption through model
simulation. Further, the energy saving can be calculated by comparing with BTMS
energy consumption of liquid cooling system, see Table 5-3, Table 5-4, Table 5-5,
Table 5-6.
Table 5.3 Ambient temperature and initial battery temperature of 20°C during
driving cycle US06, the energy benefit and loss.
mass E_total E_benefit E_cost ΔE Percentage
0 0.63 0.00 0.00 0.00 0%
10 0.52 0.11 0.09 0.02 3%
20 0.36 0.27 0.27 0.00 0%
30 0.22 0.42 0.55 -0.13 -21%
40 0.17 0.46 0.92 -0.46 -73%
50 0.17 0.46 1.39 -0.93 -147%
Table 5.4 Ambient temperature of 30°C and initial battery temperature of 22.9°C
during driving cycle US06, the energy benefit and loss.
mass E_total E_benefit E_cost ΔE Percentage
0 0.83 0.00 0.00 0.00 0%
10 0.65 0.18 0.09 0.09 10%
20 0.49 0.34 0.27 0.07 8%
30 0.33 0.50 0.55 -0.05 -6%
40 0.22 0.62 0.92 -0.31 -37%
50 0.17 0.66 1.39 -0.73 -88%

CHALMERS, Applied Mechanics, Master’s Thesis 2014:42 48
Table 5.5 Ambient temperature and initial battery temperature of 20°C during
driving cycle NEDC, the energy benefit and loss.
mass E_total E_benefit E_cost ΔE Percentage
0 0.57 0.00 0.00 0.00 0
5 0.55 0.03 0.05 -0.02 -3%
10 0.54 0.03 0.09 -0.06 -10%
20 0.54 0.03 0.27 -0.24 -42%
30 0.54 0.03 0.55 -0.52 -90%
Table 5.6 Ambient temperature of 30°C and initial battery temperature of 22.9°C
during driving cycle US06, the energy benefit and loss.
mass E_total E_benefit E_cost ΔE Percentage
0 0.80 0.00 0.00 0.00 0
5 0.73 0.07 0.05 0.03 3%
10 0.61 0.19 0.09 0.10 12%
15 0.54 0.26 0.18 0.08 10%
20 0.54 0.26 0.27 -0.01 -1%
25 0.54 0.26 0.41 -0.15 -18%
From the tables above, it can be seen that when PCM mass was 10kg, the difference
between benefited energy and energy loss was the biggest. So 10kg was chosen as
optimal PCM mass.

CHALMERS, Applied Mechanics, Master’s Thesis 2014:42 49
6 Conclusion
Generally, the two models for the two proposed systems have been built up fulfilling
almost all the requirements asked for in the beginning. Numerical results with figures
have been generated under different weather, control and driving conditions. The
electric energy consumption predicted makes sense and had the correct tendency.
Moreover, the modelling showed also its flexibility to fit new systems with a few
modification.
CLS model results have indicated how the driving behaviour, battery initial temperature
and ambient temperature influenced the BTMS and the corresponding electricity
consumption. From the results it was seen that different driving cycles would change
the BTMS feature significant in hot weather but less significantly in cold weather. The
ambient temperature was the most important variable for the BTMS. The battery initial
temperature representing pre-conditioning treatment changed the energy consumption
significantly, especially in extreme hot and cold weather.
The PCM model showed that the electric range of EV was sensitive to the vehicle mass.
PCM could bring significant improvement of BTMS, but the mass of PCM was difficult
to choose. For this specific case, 10 kg of PCM was an optimal point. However, further
investigation is still required to figure out the influence in detail.
CHALMERS, Applied Mechanics, Master’s Thesis 2014:42 50
7 Future Prospects
Though a Simulink model has been built up, a lot more work could be done in the topic
of battery thermal management system. Firstly, this investigation as the first study
focused more on the essential issues, such as system requirements and modelling
functions. Thus, only a simplified model has been completed. This model has low
accuracy and lacks validation with laboratory data. Another limitation of this thesis is
the connection and coupling with other models. Currently this model can only process
static data from file. The interface of the model should be therefore further developed
to interact with other models of battery pack or vehicle components. Last but not least,
optimisation of the thermal management system can also be achieved by pre- and post-
conditions, different control strategies, customer behaviour and other factors.
Accuracy improvement
In the Simulink model only main heat sources and heat sinks are included for
calculation. The following factor may also have an effect:
Heat transfer through the insulation material of battery pack case
Heat dissipation from electric inverter, electric control unit and water pump
Also, many components could be improved to achieve a better prediction of energy
balancing and energy consumption:
Use CFD Simulation tools to predict the heat transfer condition of radiator,
chiller and battery pack. The heat transfer between thermal fluid and battery
cells should be thoroughly investigated.
The pressure drop of each component and pipe should be added together and
then the calculations of water pump power will be more accurate.
Dynamic performance of heater, chiller and radiator could be introduced instead
of the current static performance in order to improve the prediction, especially
during start-up period and sudden power changes.
Laboratory tests of the same BTMS system could be carried out. A comparison
between modelling result and experimental data could further correct the error
of the modelling.
Functionality Development
There are several points which could be extended in the future development:
One of the high-priorities is to connect this Simulink model with available
thermodynamic simulation tools such as GT-SUITE or StateFlow in order to
achieve more accurate heat-transfer calculation.
Also, a direct connection with the battery electro-thermal model is also needed
to output the power of BTMS and to obtain the dynamic data of battery heat
generation rate instead of static data.
Another important part of BTMS is to monitor the battery thermal health in
order to prevent battery from thermal issues and damage. It is important to
send a warning in risk situations and to send an emergency stop signal when
the system is in danger.
CHALMERS, Applied Mechanics, Master’s Thesis 2014:42 51
Alternative work
Beside the two topics above, the following points are also very interesting:
Pre- and post-conditioning
The most interesting potential energy-saving that should be further investigated
is the battery behaviour before and after driving and the corresponding thermal
treatment i.e. pre- and post-condition, which should be implemented by BTMS.
The different control strategy can be developed according to different
conditions. Both heating and cooling energy consumption will change and could
be saved.
Control strategy of BTMS for charging cycle
During charging, the battery pack will also generate a large amount of heat
requiring even more strict thermal demands. To develop a proper control
strategy of BTMS for charging is highly recommended to ensure both safety
and high charging rate.
Control strategy optimization
This thesis has generally analysed the increasing energy consumption with
decreasing the desired temperature of the battery, which is charged by control
unit. But there are some other factors affecting on the energy consumption of
BTMS, such as the switching differential of control relays for radiator and air
conditioner.
Measurement, analysis and improvement of battery temperature unevenness
In this thesis the battery was treated as a homogenous body. Each point on
battery simultaneously had the same temperature, but in reality battery cells
have a different temperature distribution. To measure this is interesting. It is
also interesting to reduce the unevenness by re-design of the BTMS.
BTMS simulation with customised conditions
Evaluation of BTMS energy consumption is related not only to one given
condition but on a combination of different situations. For example, both cold
winter and hot summer conditions should be included for a comprehensive
evaluation. It is reasonable to develop such simulation conditions with varying
parameters, such as the whole year ambient temperatures in a city, charging
behaviour, and BTMS ageing. This overall evaluation would present a more
practical performance of BTMS

CHALMERS, Applied Mechanics, Master’s Thesis 2014:42 52
References
Battery University, 2014. Battery University. [Online]
Available at: http://batteryuniversity.com/learn/article/types_of_lithium_ion
[Accessed 08 04 2014].
Binder, 2014. Thermoelectric cooling technology. [Online]
Available at: http://www.binder-world.com/ext/getdownload.cfm?pud=74&lang=2
[Accessed 06 03 2014].
Charged, 2014. Charged electric vehicles magazine. [Online]
Available at: http://chargedevs.com/features/allcell-technologies%E2%80%99-new-
phase-change-thermal-management-material/
[Accessed 20 04 2014].
CW, 2013. Chevy Volt battery pack: Rugged but precise. [Online]
Available at: http://www.compositesworld.com/articles/chevy-volt-battery-pack-
rugged-but-precise
[Accessed 25 03 2014].
Digikey, 2014. Digikey. [Online]
Available at: http://www.digikey.com/Web%20Export/Supplier%20Content/api-
technologies-1171/pdf/api-ptc-applications.pdf?redirected=1
[Accessed 23 05].
Eberspracher, 2014. Eberspracher. [Online]
Available at: http://www.eberspacher.com/products/electrical-heaters.html
[Accessed 02 03 2014].
electropaedia, 2014. electropaedia. [Online]
Available at: http://www.mpoweruk.com/chemistries.htm
[Accessed 19 05 2014].
Electropaedia, 2014. Lithium Battery Failures. [Online]
Available at: http://www.mpoweruk.com/lithium_failures.htm
[Accessed 06 03 2014].
GM-Volt, 2010. The chevrolet volt cooling/heating system explained. [Online]
Available at: http://gm-volt.com/2010/12/09/the-chevrolet-volt-coolingheating-
systems-explained/
[Accessed 24 03 2014].
Gripumps, 2014. Gripumps. [Online]
Available at: http://www.gripumps.com/series.asp?action=display&id=172
[Accessed 03 04 2014].
Huairui, 2014. 200W Communication Battery Industry Cabinet Thermoelectric Cooler
(TEC). [Online]
Available at: http://huaruicooling.en.alibaba.com/product/683329653-
215080785/200W_Communication_Battery_Industry_Cabinet_Thermoelectric_Coole
r_TEC_.html
[Accessed 06 03 2014].
Incropera, F. P., 2007. Fundamentals of Heat and Mass Transfer. 6th edition ed.
s.l.:John Wiley & Sons.

CHALMERS, Applied Mechanics, Master’s Thesis 2014:42 53
Kizilel, R., Sabbah, R., Selman, J. Robert & Al-hallaj, S., 2009. An alternative
cooling system to enhance the safety of Li-ion battery packs. Journal of Power
Sources, 194(2), pp. 1105-1112.
Lauda, 2014. Lauda. [Online]
Available at:
http://www.lauda.de/hosting/lauda/website_en.nsf/urlnames/prospektdownload
[Accessed 08 04 2014].
Matthe, R., Turner, L. & Mettlach, H., 2011. VOLTEC Battery System for Electric
Vehicle with Extended Range. SAE International Journal of Engines, 4(1), pp. 1944-
1962.
Mc Nally Institute, 2014. Mc Nally Institute. [Online]
Available at: http://www.mcnallyinstitute.com/14-html/14-04.htm
[Accessed 07 04 2014].
Peng Zhou, E. C. C., 2010. Electric vehicle thermal management system. US, Patent
No. US 2010/0025006 A1.
Pesaran, A. A., 2001. Battery Thermal Management in EVs and HEVs : Issues and
Solutions. Advanced Automotive Battery Conference, p. 10.
Pesaran, A. A., 2002. Battery thermal models for hybrid vehicle simulations. Journal
of power sources, Volume 110(2), p. 377–82.
Ricker, N. L., 2014. A Simulink Tutorial. [Online]
Available at: tang.eece.wustl.edu/SimulinkTutorial.pdf
[Accessed 16 05 2014].
Sabbah, R., Kizilel, R., Selman, J. R. & Al-Hallaj, S., 2008. Active (air-cooled) vs.
passive (phase change material) thermal management of high power lithium-ion
packs: Limitation of temperature rise and uniformity of temperature distribution.
Journal of Power Sources, 182(2), pp. 630-638.
Spirax Sarco, 2011. The Steam and Condensate Loop. s.l.:s.n.
Tran, T.-H. e. a., 2014. Experimental investigation on the feasibility of heat pipe
cooling for HEV/EV lithium-ion battery. Applied Thermal Engineering, 2(63), p.
551–558.
Valeo, 2010. Battery Thermal Management for HEV & EV – Technology overview.
s.l., s.n.

CHALMERS, Applied Mechanics, Master’s Thesis 2014:42 54
Appendix A: System Evaluation
Air
active co
olin
gp
assive co
olin
gactive
coo
ling
com
bin
ation
Co
olin
g po
we
rsm
allm
ed
ium
large
largelarge
largem
ed
ium
me
diu
m
Tem
pe
rature
distr.
un
eve
nu
ne
ven
eve
ne
ven
eve
ne
ven
mo
de
ratem
od
erate
Pro
pagatio
n o
f the
rmal ru
naw
ayb
igb
igsm
allsm
allsm
allsm
allb
igb
ig
He
at transfe
r Efficien
cylo
wh
ighh
ighh
ighm
ed
ium
high
me
diu
mlo
w
He
ating (availab
le )
yes
no
yes
yes
yes
yes
no
yes
Co
olin
g (available
)ye
sye
sye
sye
sye
sye
sye
sye
s
We
ight
light
me
diu
mh
eavy
he
avym
ed
ium
me
diu
mm
ed
ium
light
Sizelarge
small
small
small
small
small
largesm
all
Co
mp
lexity
simp
leco
mp
lex
com
ple
xco
mp
lex
com
ple
xm
ed
ium
mo
de
ratesim
ple
Ease o
f Main
ten
ance
easy
difficu
ltd
ifficult
difficu
ltd
ifficult
easy
mo
de
ratee
asy
Re
liability
high
me
diu
mlo
wlo
wlo
wlo
wh
ighe
asy
BTM
S Lifetim
elo
ng
mo
de
ratem
od
erate
mo
de
ratem
od
erate
lon
glo
ng
sho
rt
First cost
low
me
diu
mh
ighh
ighh
ighm
od
erate
high
high
An
nu
al cost
low
me
diu
mh
ighh
ighh
ighlo
wm
od
erate
high
Ene
rgy con
sum
ptio
nh
ighlo
wlo
wm
od
erate
low
eve
n lo
wh
ighh
igh
Ve
ntilatio
ngo
od
me
diu
mm
ed
ium
me
diu
mm
ed
ium
bad
goo
db
ad
System
Ch
aracteristic
Co
olan
t H
eat p
ipe
The
rmo
ele
ctricsR
efrige
rant
coo
ling syste
mP
CM
-graph
ite
Ap
pe
nd
ix A1
: Co
nce
pt Se
lectio
n M
atrix

CHALMERS, Applied Mechanics, Master’s Thesis 2014:42 55
Item
sP
erfo
rman
ceSafe
tyW
eigh
t Size
Re
liability
Co
stEn
ergy C
on
sum
ptio
n
We
ightin
g factor
x12x5
x3x3
x11x4
x4
Active
Air syste
m1
13
13
31
78
Passive
Liqu
id Syste
m2
12
22
23
83
Active
Liqu
id Syste
m
33
13
11
286
Co
mb
ine
d Liq
uid
System
33
13
11
390
Dire
ct Re
frigeran
t System
32
23
11
388
PC
M3
32
31
13
93
He
at pip
e2
22
12
21
77
The
rmo
ele
ctrics2
13
32
11
77
Ap
pe
nd
ix A2
: Evaluatio
n Sco
re Tab
le o
f diffe
ren
t BTM
S
Sum

CHALMERS, Applied Mechanics, Master’s Thesis 2014:42 56

CHALMERS, Applied Mechanics, Master’s Thesis 2014:42 57
Appendix B: Modelling Process
Appen
dix
B1: L
ogic M
odellin
g P
rocess

CHALMERS, Applied Mechanics, Master’s Thesis 2014:42 58
Appen
dix
B2: M
AT
LA
B/S
imulin
k M
odellin
g P
rocess
Byp
ass
RA
sum
ma
ry
he
at tra
nsfe
r
el. c
on
sum
ptio
n
Ta
mb
am
bie
nt te
mp
.
To
tal
Te
mp
.
Sta
te
Sw
itch
Tfl_
inTfl_
out
Q_R
A
Ra
dia
tor
Tfl_
in
m_fl
Tfl_
out
Pel_
pum
p
Pu
mp
DC
P
Po
rt Nu
mb
er
Tfl_
in
Tfl_
out
Pel_
PTC
Q_P
TCP
TC
He
ate
r
DC
_P
ort
Driv
ing
Cycle
Sw
itch
1 =
NE
DC
(16
22
9.3
sec)
2 =
US
06
(51
39
sec)
3 =
Sim
ula
tion
Tam
b
Tbatte
ry
m_fl
BTM
S_S
tate
Co
ntro
l syste
m
Tfl_
in
Tfl_
out
Tbatte
ry
Ba
ttery
Tfl_
in
Tfl_
out
Pe_A
C
Q_A
C
Air c
on
ditio
ne
r
AC
AC
Sum
PTC
PTC
Pum
p
Pum
p
AC
RA
RA
Heate
r

CHALMERS, Applied Mechanics, Master’s Thesis 2014:42 59
Appendix C: CLS Results

CHALMERS, Applied Mechanics, Master’s Thesis 2014:42 60

CHALMERS, Applied Mechanics, Master’s Thesis 2014:42 61

CHALMERS, Applied Mechanics, Master’s Thesis 2014:42 62

CHALMERS, Applied Mechanics, Master’s Thesis 2014:42 63
Appendix D: CLS+PCM Results

CHALMERS, Applied Mechanics, Master’s Thesis 2014:42 64

CHALMERS, Applied Mechanics, Master’s Thesis 2014:42 65

CHALMERS, Applied Mechanics, Master’s Thesis 2014:42 66

CHALMERS, Applied Mechanics, Master’s Thesis 2014:42 67