ADVANCING SUBSTATION INFRASTRUCTURE - … SUBSTATION INFRASTRUCTURE - elp.com

Substation Earth System Injection Analysis Tool
User Guide
Substation Earth System Injection Analysis Tool User Guide
i Reference SP0510R03 Ver 1
Ergon Energy Corporation Limited ABN 50 087 646 062
Table of Contents
Purpose and Scope ............................................................................................ 1
Responsibilities .................................................................................................. 1
Definitions, Abbreviations and Acronyms ........................................................... 1
References ......................................................................................................... 2
1. Introduction ................................................................................................ 2
2. Getting started ........................................................................................... 3
3. Current distribution worksheet ................................................................... 5
4. Voltage gradient worksheet ....................................................................... 8
5. Entering and analysing step, touch & reach potentials ............................ 11 5.1 Inside Sub ..................................................................................................... 11
5.2 Outside Sub & Special Location .................................................................... 15
6. Analysis worksheet .................................................................................. 17
7. Reiterating some important points ........................................................... 23

Substation Earth System Injection Analysis Tool User Guide
Page 1 of 23 Reference SP0510R03 Ver 1
Ergon Energy Corporation Limited ABN 50 087 646 062
PURPOSE AND SCOPE The purpose of this document is to provide a guide to using SP0510C07 Substation Earth System Injection Analysis Tool.
RESPONSIBILITIES The General Manager Substations is responsible for approving this Reference.
The Senior Support Engineer is the Subject Matter Expert (SME) for the content and shall implement and maintain this Reference.
The Manager Management Systems is the Management System Representative and is responsible for the endorsement of this Reference prior to submission for approval.
DEFINITIONS, ABBREVIATIONS AND ACRONYMS CMEN - Common Multiple Earth Neutral
Current distribution test – a test carried out to
a) determine the proportion of fault current that flows into a buried earth grid via the earth mass which subsequently allows a calculation of grid impedance;
b) identify paths/points where high transfer voltages may exist under fault conditions.
Earth fault - a fault on an electrical network where a single phase conductor or multiple phase conductors make contact to the earth either directly or through an impedance.
Earth grid - system of interconnected uninsulated conductors buried in the earth intended for conduction and dissipation of fault current and providing a common ground for electrical devices or metallic structures.
Earth potential rise (EPR) - the maximum electrical potential that a substation earthing system may attain relative to a distant grounding point assumed to be at the potential of remote earth.
Earth return current - commonly referred to as grid current and designated Ig, is the portion of the total earth fault current which returns to the source by flowing through the grid and into the surrounding soil.
Effective (loaded) step voltage - the voltage across a body, under fault conditions, in a position as described for prospective step voltage but allowing for the voltage drop caused by a current in the body.
Effective (loaded) touch voltage - the voltage across a body, under fault conditions, in a position as described for the prospective touch voltage but allowing for the voltage drop caused by a current in the body.
Effective (loaded) reach voltage - the voltage across a body, under fault conditions, in a position as described for the prospective reach voltage but allowing for the voltage drop caused by a current in the body. Theoretically the prospective reach voltage and the effective reach voltage should be exactly the same.
Fall of potential test - a test used to calculate the earth potential rise of an earthing installation under earth fault conditions with respect to a remote earth.
Inside Sub - locations inside the substation main fence including the internal perimeter of that fence.
Outside Sub - locations outside the substation main fence, excluding those locations defined as Special Locations, but including the external perimeter of that fence.

Substation Earth System Injection Analysis Tool User Guide
Page 2 of 23 Reference SP0510R03 Ver 1
Ergon Energy Corporation Limited ABN 50 087 646 062
Prospective step voltage - the voltage difference between two points on the earth’s surface separated by a distance equal to a person’s normal maximum step (approximately one metre).
Prospective touch voltage - the voltage difference between an earthed metallic structure and a point on the earth’s surface separated by a distance equal to a person’s normal horizontal reach (approximately one metre).
Prospective reach voltage - the voltage difference between earthed metallic objects or structures that may be bridged by direct hand to hand contact.
Remote earth - part of the earth considered as conductive, the electric potential of which is conventionally taken as zero, being outside the zone of influence of the earthing system under test.
Rogowski coil - is an electrical device for measuring alternating current (AC).
Special Location - locations with high exposure rates and where people are likely to be wet and have no footwear. Such locations include:
Within a school ground Children’s playground Public swimming pool area Popular water recreation area Public thoroughfare within 100 metres of the above locations.
Soil resistivity - is a measure of how much the soil resists the flow of electricity. Sol resistivity is expressed normally in ohm-metres.
REFERENCES EG0 Power System Earthing Guide Part 01 (External Reference)
IEEE-80 Guide for Safety in AC Substation Grounding (External Reference)
SP0510. Substation Earth System Earth Injection Testing SWP (Standard Work Practice)
SP0510C07. Substation Earth System Injection Analysis Tool (Form)
SP0510R01. Substation Earth Testing Job Safety Analysis (Reference)
Electrical Safety Code of Practice 2010 Works
1. INTRODUCTION This document provides a brief guide to the use of the spreadsheet SP510C07 Substation Earth System Injection Analysis Tool to be used when carrying out analysis on substation earthing systems. The spreadsheet is a tool comprising the following worksheets:
1. Analysis – this worksheet is to assist the user in coming up with a suitable combination of fault current and associated clearance time to enter into either of the “Inside Sub”, “Outside Sub” and “Special Location” worksheets. The sheet covers off for faults on both the HV and LV sides of the substation. It is unwise to assume that it is always the maximum fault current and associated clearance time that will result in problems with unacceptable step, touch and reach voltages at an installation. As such this sheet provides the user the ability to display protection clearance curves and superimpose maximum allowable clearance curves for the three analysis standards of IEEE, EG0 and the Electrical Safety Code of Practice. From there, a suitable combination of fault current and associated clearance time can be determined and subsequently translated over to the “Inside Sub”, “Outside Sub” and “Special Location” worksheets.
2. Current distribution – as the name suggest, this sheet allows the user to enter in results for current splits obtained at a site under test. The results for this test are passed to the

Substation Earth System Injection Analysis Tool User Guide
Page 3 of 23 Reference SP0510R03 Ver 1
Ergon Energy Corporation Limited ABN 50 087 646 062
“Voltage Gradient” spreadsheet to determine both the entire substation earthing system impedance as well as just the substation grid impedance.
3. Voltage gradient – this sheet allows the user to enter in results for a Fall of Potential test carried out on the site. The sheet displays the soil surface voltage profile as a function of distance relative to the substation and is used in conjunction with the “Current Distribution” sheet to determine both the entire substation earthing system impedance as well as just the substation grid impedance. It also calculates the maximum earth potential rise (EPR) for the substation.
4. Inside Sub, Outside Sub & Special Location – these worksheets allow the user to enter in measured field values for step, touch and reach voltage for various locations. By entering in appropriate fault levels and clearing times, the user can determine compliance for these locations against the standards of IEEE, EG0 and the Electrical Safety Code of Practice.
2. GETTING STARTED It is essential before using the spreadsheet to ensure macros are enabled. If using Excel 2010, carry out the following steps once the document is open.
1) Select File>Options. 2) Click on Trust Centre on the left hand side of the screen.
WARNING
The worksheets “Inside Sub”, “Outside Sub” and “Special Location” have links directly to
the worksheet “Analysis” and vice versa.
Adding additional worksheets to the spreadsheet will affect the integrity of the
tool.

Substation Earth System Injection Analysis Tool User Guide
Page 4 of 23 Reference SP0510R03 Ver 1
Ergon Energy Corporation Limited ABN 50 087 646 062
3) Now click on Trust Centre Settings on the right hand side of the screen.
4) Now click on Macro Settings on the left hand side of the screen. The following screen should appear

Substation Earth System Injection Analysis Tool User Guide
Page 5 of 23 Reference SP0510R03 Ver 1
Ergon Energy Corporation Limited ABN 50 087 646 062
5) Make sure that “Enable all macros” is enabled as per the screen shot below
3. CURRENT DISTRIBUTION WORKSHEET Current distribution measurements are recorded in the worksheet titled “Current distribution”. As well as information pertaining to the test instruments used, time of test and location tested, three parameters are required to be entered for each current measurement taken:
Number of turns used on the Rogowski coil Magnitude of the current Phase angle of the current
Figure 1 below shows the data entry section for current distributions. Only enter values in the field highlighted in yellow.

Substation Earth System Injection Analysis Tool User Guide
Page 6 of 23 Reference SP0510R03 Ver 1
Ergon Energy Corporation Limited ABN 50 087 646 062
Figure 1: Current Distribution Data Entry
DATE: 3/12/22014
Current Distribution report
InstrumentTunable VoltmeterRogowski CoilInjection SetAmmeter
48
TimeRogowski Coil turns
Ammeter reading (Amps)
Current distribution
(Reading/No. of turns)
Measured angle with respect to injection
1 14.200 14.200 0
2 3.421 1.711 -164
2 0.196 0.098 -15
2 1.763 0.882 -159
2 0.058 0.029 -2
2 1.324 0.662 158
2 1.090 0.545 167
2 0.826 0.413 166
2 2.295 1.148 175
2 3.520 1.760 -196
1 14.200 14.200 0
Injection Current and Distribution Measurements
11kV Bus VT Pole 6013857
F452 River Road feeder Pole 5260204
Injection Current at finish
Location / conductor
Injection Current at start
Concrete pole 1 landing span T59 feeder -Pole 5260212
Concrete pole 2 landing span T59 feeder -Pole 5260213
Concrete pole 1 landing span T12 feeder -Pole 5260214
Concrete pole 2 landing span T12 feeder -Pole 5260215
SUBSTATION:
D452 QWRC feeder Pole 4240452
B452 Bidwill feeder Pole 3189346
A452 Antigua feeder Pole 6013851
Kilkivan Town
Test Equipment UsedMake/Model
Injection Frequency (Hz) Coupling Transf Tap
4025C
Injection Current
The Coils are matched to the Tunable Meter.Touch 4025C,Step 4025B
Redphase 4024, 4023

Substation Earth System Injection Analysis Tool User Guide
Page 7 of 23 Reference SP0510R03 Ver 1
Ergon Energy Corporation Limited ABN 50 087 646 062
The current returning via the earth’s mass into the grid, is calculated by the vector addition of the injected current with all of the individual alternate path return currents.
A pictorial view of the injected current, individual return currents through alternate paths and ground current is provided at the bottom of the worksheet (refer Figure 2)
Figure 2: Current Distribution
52.68%
47.32%
7.48
4161.00
2191.81
1969.19Current entering/exiting via alternate paths during fault condition
Current entering/exiting earth grid via ground mass during fault condition
LV Side fault current level
% Current entering/exiting earth grid via ground mass
% Current entering/exiting via alternate paths (e.g. cable sheaths)
Current entering/exiting earth grid through ground mass
-1
-0.8
-0.6
-0.4
-0.2
0
0.2
0.4
0 1 2 3 4 5 6 7 8 9 10 11 12 13 14 15
Imag
inar
y C
om
pon
ent
Real Component
Current Distribution
Notes:Red = injected currentBlue = currents returning through alternate paths e.g. cable sheaths, overhead earth wires (cumulative)Green = current returning through earth mass (injected current - current through alternate paths)

Substation Earth System Injection Analysis Tool User Guide
Page 8 of 23 Reference SP0510R03 Ver 1
Ergon Energy Corporation Limited ABN 50 087 646 062
4. VOLTAGE GRADIENT WORKSHEET
To determine the EPR (Earth Potential Rise) of a substation under fault conditions, through current injection the potential of the earthing system is measured with reference to a test potential electrode placed at increasing distances from the earth system until the difference between a minimum of three successive voltage readings is negligible.
As well as information pertaining to the test instruments used, the voltage measurements at each distance are recorded into the worksheet as per Figure 3 below:
Figure 3: Calculation of EPR
Once a plateau value has been obtained for the voltage measurements, the plateau voltage figure is manually entered into the cell titled “Voltage at Offset Frequency”. In addition to this, the total injection current must also be manually entered into the cell titled “Injection current (amps)”. Note, in most cases this will simply be the same value as the current injected when carrying out the current distribution test and step, touch & reach voltage measurements.
In conjunction with data entered into the “Current Distribution” worksheet, the following values are calculated on the “Voltage Gradient” worksheet:
SUBSTATION: Date: 10/11/2014
VOLTAGE GRADIENT MEASUREMENT SHEET
Tunable VoltmeterSpectrum AnalyserMultimeter (RMS voltmeter)
Suggested Voltage Gradient Distances - Ergon: 1, 2, 5, 10, 20, 50, 100, 150, 200, 250, … until plateau
Powerlink: 10, 20, 30, 40, 50, … until plateau
Test Probe Location (metres)
Grid to Probe Voltage (Volts)
Test Probe Location (metres)
Grid to Probe Voltage (Volts)
Test Probe Location (metres)
Grid to Probe Voltage (Volts)
1 0.800 400 4.920 10002 1.198 450 5.140 10505 1.563 500 5.220 1100
10 2.080 550 5.340 115020 2.430 600 5.370 120050 2.650 650 5.430 1250100 3.160 700 5.435 1300150 3.770 750 5.490 1350200 3.830 800 5.510 1400250 3.850 850 5.510 1450300 4.380 900 5.510 1500350 4.620 950 1550
Voltage at Offset
frequency (Volts)
RMS voltage (Volts)
RMS standing voltage
900 14.20 5.51
0.74 Ω
0.39 Ω
LV Side fault EPR = 1614.59 volts
Earth Potential Rise Measurements (at "Plateau" of Voltage Gradient)
Distance from Earthmat (metres)
Injection current (Amps)
Measured Voltage between earthmat and voltage spike
Telstra EPR Measurement
Earth Grid Impedance, Zgrid =
Earth System Impedance, Zsys =
Red Phase 4025C
Fluke
Voltage Gradient Measurements
5664
Kilkivan Town
Test Equipment UsedMake/ModelInstrument Serial Number
Substation Earth System Injection Analysis Tool User Guide
Page 9 of 23 Reference SP0510R03 Ver 1
Ergon Energy Corporation Limited ABN 50 087 646 062
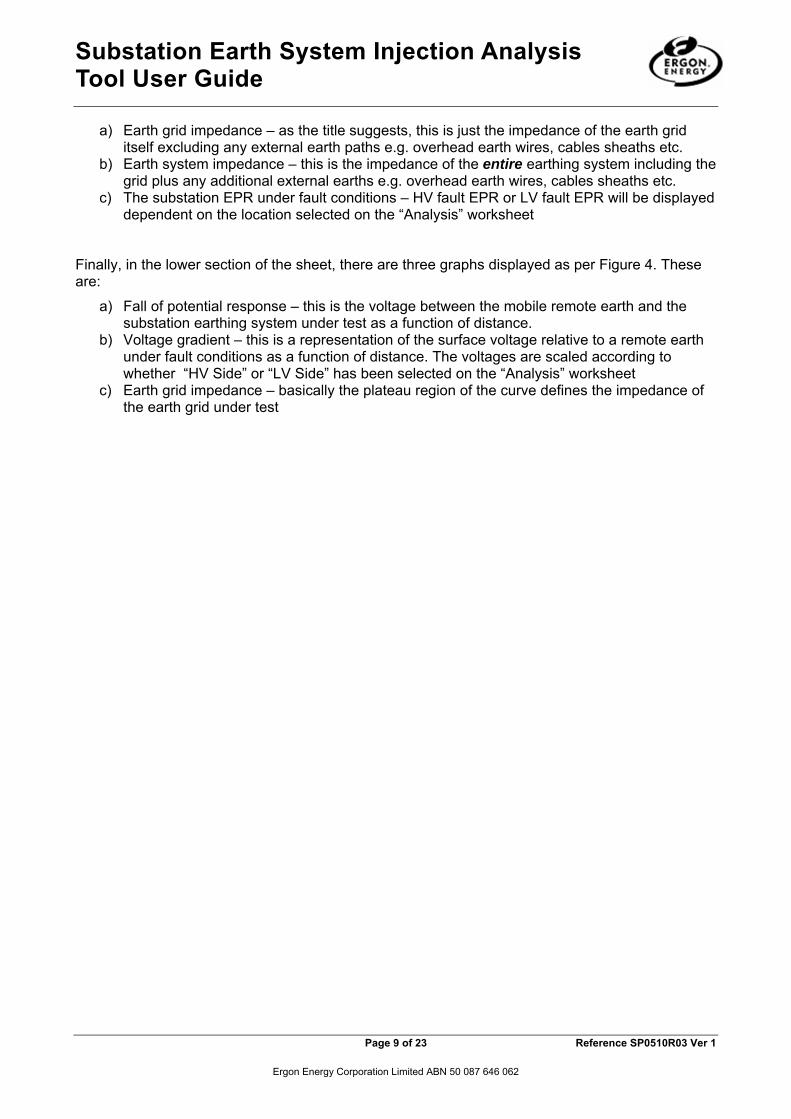
a) Earth grid impedance – as the title suggests, this is just the impedance of the earth grid itself excluding any external earth paths e.g. overhead earth wires, cables sheaths etc.
b) Earth system impedance – this is the impedance of the entire earthing system including the grid plus any additional external earths e.g. overhead earth wires, cables sheaths etc.
c) The substation EPR under fault conditions – HV fault EPR or LV fault EPR will be displayed dependent on the location selected on the “Analysis” worksheet
Finally, in the lower section of the sheet, there are three graphs displayed as per Figure 4. These are:
a) Fall of potential response – this is the voltage between the mobile remote earth and the substation earthing system under test as a function of distance.
b) Voltage gradient – this is a representation of the surface voltage relative to a remote earth under fault conditions as a function of distance. The voltages are scaled according to whether “HV Side” or “LV Side” has been selected on the “Analysis” worksheet
c) Earth grid impedance – basically the plateau region of the curve defines the impedance of the earth grid under test

Substation Earth System Injection Analysis Tool User Guide
Page 10 of 23 Reference SP0510R03 Ver 1
Ergon Energy Corporation Limited ABN 50 087 646 062
Figure 4: Voltage Gradient Plots
Voltage gradient for a HV side fault
Voltage gradient for HV Side fault of 462 amps
0.000
1.000
2.000
3.000
4.000
5.000
6.000
0 100 200 300 400 500 600 700 800 900 1000
Vo
lts
Distance (metres)
Fall of Potential Response
0
20
40
60
80
100
120
140
160
180
200
0 100 200 300 400 500 600 700 800 900 1000
Vo
lts
Distance from Substation (metres)
Voltage gradient
0
0.1
0.2
0.3
0.4
0.5
0.6
0.7
0.8
0 100 200 300 400 500 600 700 800 900 1000
Imp
ed
an
ce
(o
hm
s)
Distance (metres)
Earth Grid Apparent Impedance

Substation Earth System Injection Analysis Tool User Guide
Page 11 of 23 Reference SP0510R03 Ver 1
Ergon Energy Corporation Limited ABN 50 087 646 062
5. ENTERING AND ANALYSING STEP, TOUCH & REACH POTENTIALS There are three individual worksheets where step, touch and reach potentials are entered. They are relative to the location and are designated:
Inside Sub Outside Sub Special Location
5.1 Inside Sub
The “Inside sub” worksheet allows you to analyse for faults against both IEEE and EG0 standards for locations inside the substation fence. The Electrical Safety Code of Practice is not used for analysis of faults within the substation.
In general, data entry is only allowed in cells with a yellow background.
For this sheet to work correctly, the following parameters must be entered into the “Analysis” worksheet:
1. The value for injected current used to obtain the associated step, touch and reach voltages – Iinject
2. The natural soil surface resistivity – ρs.
3. The thickness of gravel/crushed rock or bitumen laid on the surface to mitigate against high step and touch potentials - hs
The “Inside Sub” sheet is set up into the following main sections:
1. Test Equipment used: Self explanatory
2. Surface type and analysis criteria: a. For surface type, the user has the option of selecting Natural, Gravel or Bitumen.
This allows the user to look at possible options for mitigating against high step or touch voltages
b. For the analysis criteria, the user has the option of selecting EG0 or IEEE
3. HV Fault & LV Fault: This requires the user to manually enter both fault levels and associated primary protection clearance times in msecs (including CB opening times) for both HV and LV fault scenarios.
InstrumentTunable Voltmeter Red Phace Model 4025C
MAKE/MODELGW1495
Spectrum AnalyserMultimeter (RMS voltmeter)
Test Equipment Used
SERIAL No
Surface type NaturalAnalysis Criteria EG0
HV FAULT LV FAULTFault current (amps) 462 4161Primary clearing time (msecs) 480 402
Substation Earth System Injection Analysis Tool User Guide
Page 12 of 23 Reference SP0510R03 Ver 1
Ergon Energy Corporation Limited ABN 50 087 646 062
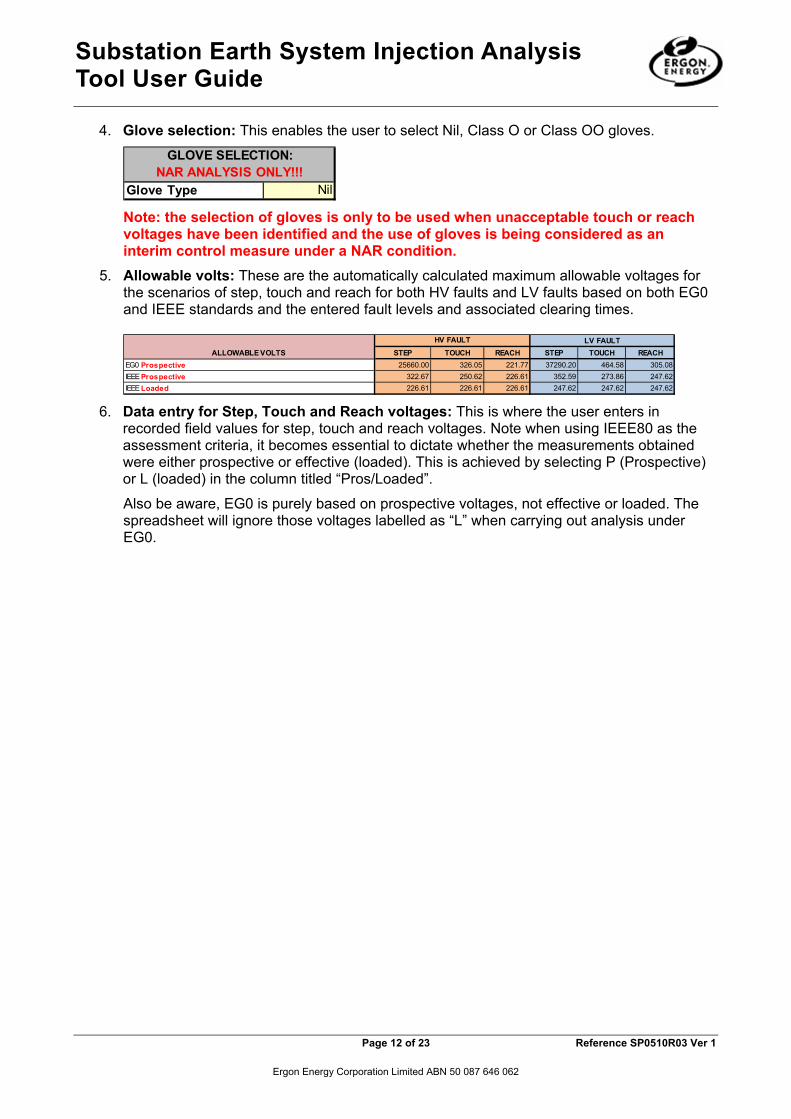
4. Glove selection: This enables the user to select Nil, Class O or Class OO gloves.
Note: the selection of gloves is only to be used when unacceptable touch or reach voltages have been identified and the use of gloves is being considered as an interim control measure under a NAR condition.
5. Allowable volts: These are the automatically calculated maximum allowable voltages for the scenarios of step, touch and reach for both HV faults and LV faults based on both EG0 and IEEE standards and the entered fault levels and associated clearing times.
6. Data entry for Step, Touch and Reach voltages: This is where the user enters in recorded field values for step, touch and reach voltages. Note when using IEEE80 as the assessment criteria, it becomes essential to dictate whether the measurements obtained were either prospective or effective (loaded). This is achieved by selecting P (Prospective) or L (loaded) in the column titled “Pros/Loaded”.
Also be aware, EG0 is purely based on prospective voltages, not effective or loaded. The spreadsheet will ignore those voltages labelled as “L” when carrying out analysis under EG0.
NilGlove Type
GLOVE SELECTION:NAR ANALYSIS ONLY!!!
STEP TOUCH REACH STEP TOUCH REACH
25660.00 326.05 221.77 37290.20 464.58 305.08
322.67 250.62 226.61 352.59 273.86 247.62
226.61 226.61 226.61 247.62 247.62 247.62
LV FAULTHV FAULT
ALLOWABLE VOLTS
IEEE Loaded
IEEE Prospective
EG0 Prospective

Substation Earth System Injection Analysis Tool User Guide
Page 13 of 23 Reference SP0510R03 Ver 1
Ergon Energy Corporation Limited ABN 50 087 646 062
In addition, at the bottom of each data entry section for step, touch and reach, the user can choose whether to look at prospective or effective (loaded) voltages for IEEE analysis on the “Analysis” worksheet. Note, changing this field does not affect any calculations on this worksheet – it purely dictates whether to pass prospective or effective (loaded) voltages back to the “Analysis” worksheet.
Interpreting the results: Determining whether a specific location is a PASS or FAIL using the selected assessment criteria (i.e. EG0 or IEEE) is a straight forward process. A green PASS or red FAIL flag is placed adjacent to the scaled voltage for both HV and LV faults.
Scaled Volts HV
FaultEG0
PASS/FAIL
Scaled Volts LV
FaultEG0
PASS/FAIL
1 NW corner adjacent to No1 transformer bund 0.145 P 5.58 PASS 50.28 PASS
2 NW corner adjacent to No1 transformer bund 0.019 L
3 SW corner adjacent to Kilkivan 66kV feeder bay 0.234 P 9.01 PASS 81.14 PASS
4 SW corner adjacent to Kilkivan 66kV feeder bay 0.018 L
5
6
7
8
9
10
0.234 9.01 81.14
L
Scaled Volts HV
Fault
EG0 PASS/FAIL
w ith Nil gloves
Scaled Volts LV
Fault
EG0 PASS/FAIL
w ith Nil gloves
1 Fence - North West corner 0.847 P 32.61 PASS 293.70 PASS
2 Fence - North West corner 0.456 L
3 Fence - east 0.618 P 23.79 PASS 214.29 PASS
4 Fence - east 0.279 L
5 Fence - east 0.566 P 21.79 PASS 196.26 PASS
Fence - east 0.296 L
7 66kV Bus Isolator A629 Operating Handle 0.478 P 18.40 PASS 165.75 PASS
8 66kV Bus Isolator A629 Operating Handle 0.231 L
9 No1 Tx Lightning Arrestor Support Structure 0.794 P 30.57 PASS 275.32 PASS
10 No1 Tx Lightning Arrestor Support Structure 0.212 L
MAXIMUM TOUCH VOLTAGE 0.847 32.61 293.70
P
Scaled Volts HV
Fault
EG0 PASS/FAIL
w ith Nil gloves
Scaled Volts LV
Fault
EG0 PASS/FAIL
w ith Nil gloves
1 3.000 115.50 PASS 1040.25 FAIL
2
3
4
5
6
7
8
9
10
MAXIMUM REACH VOLTAGE 3.000 115.50 1040.25
P
LV FAULT
STEP
HV FAULT LV FAULT
REACH
HV FAULT LV FAULT
Grid ref Description Msd Volts
For IEEE analysis, do you want to look at prospective (P) or loaded (L) voltages?
Grid ref Description Msd Volts Pros/ Loaded
Description Msd Volts Pros/ LoadedGrid ref
TOUCH
HV FAULT
For IEEE analysis, do you want to look at prospective (P) or loaded (L) voltages?
Pros/ Loaded
MAXIMUM STEP VOLTAGE
For IEEE analysis, do you want to look at prospective (P) or loaded (L) voltages?
PFor IEEE analysis, do you want to look at prospective (P) or loaded (L) voltages?

Substation Earth System Injection Analysis Tool User Guide
Page 14 of 23 Reference SP0510R03 Ver 1
Ergon Energy Corporation Limited ABN 50 087 646 062
Things to consider: As already stated, the use of gloves is only to be considered when unacceptable touch or reach voltages have been identified and the use of gloves is being considered as an interim control measure under a NAR condition. If gloves are selected, the spreadsheet automatically recalculates acceptable prospective touch voltages. A warning is however displayed and the affected acceptable prospective voltages (i.e. EG0 Prospective Touch, EG0 Prospective Reach, IEEE Prospective Touch, and IEEE Prospective Reach) are now displayed in bold red in the table.
If the use of gloves at a particular location results in a PASS using either IEEE or EG0 criteria, however the voltage across the glove exceeds the nominal rated voltage of the glove but does not exceed the nominal test voltage for that glove, a PASS will be indicated however instead of the cell having a green background, it will now be flagged yellow.
Finally, if the calculated voltage for a particular location across a glove exceeds the nominal test voltage for the glove, a FAIL is indicated and the text is displayed in italics as below.
Scaled Volts HV
Fault
EG0 PASS/FAIL
w ith Nil gloves
Scaled Volts LV
Fault
EG0 PASS/FAIL
w ith Nil gloves
1 Fence - North West corner 0.847 P 32.61 PASS 293.70 PASS
2 Fence - North West corner 0.456 L
3 Fence - east 5.000 P 192.50 PASS 1733.75 FAIL
4 Fence - east 0.279 L
5 Fence - east 0.566 P 21.79 PASS 196.26 PASS
Fence - east 0.296 L
7 66kV Bus Isolator A629 Operating Handle 4.000 P 154.00 PASS 1387.00 FAIL
8 66kV Bus Isolator A629 Operating Handle 0.231 L
9 No1 Tx Lightning Arrestor Support Structure 0.794 P 30.57 PASS 275.32 PASS
10 No1 Tx Lightning Arrestor Support Structure 0.212 L
MAXIMUM TOUCH VOLTAGE 5.000 192.50 1733.75
HV FAULT LV FAULT
Grid ref Description Msd Volts
TOUCH
Pros/ Loaded
STEP TOUCH REACH STEP TOUCH REACH
25660.00 57348.05 285331.79 37290.20 83344.49 414704.62
322.67 113555.62 226836.59 352.59 124084.12 247868.14
226.61 226.61 226.61 247.62 247.62 247.62
WARNING: YOU HAVE GLOVES SELECTED!!!!LV FAULTHV FAULT
ALLOWABLE VOLTS
IEEE Loaded
IEEE Prospective
EG0 Prospective
Scaled Volts HV
Fault
EG0 PASS/FAIL w ith Class 0 gloves
Scaled Volts LV
Fault
EG0 PASS/FAIL
w ith Class 0 gloves
1 Fence - North West corner 0.847 P 32.61 PASS 293.70 PASS
2 Fence - North West corner 0.456 L
3 Fence - east 5.000 P 192.50 PASS 1733.75 PASS
4 Fence - east 0.279 L
5 Fence - east 0.566 P 21.79 PASS 196.26 PASS
Fence - east 0.296 L
7 66kV Bus Isolator A629 Operating Handle 4.000 P 154.00 PASS 1387.00 PASS
8 66kV Bus Isolator A629 Operating Handle 0.231 L
9 No1 Tx Lightning Arrestor Support Structure 0.794 P 30.57 PASS 275.32 PASS
10 No1 Tx Lightning Arrestor Support Structure 0.212 L
MAXIMUM TOUCH VOLTAGE 5.000 192.50 1733.75
HV FAULT LV FAULT
Grid ref Description Msd Volts
TOUCH
Pros/ Loaded

Substation Earth System Injection Analysis Tool User Guide
Page 15 of 23 Reference SP0510R03 Ver 1
Ergon Energy Corporation Limited ABN 50 087 646 062
In summary, when using gloves the following methodology is used for displaying results:
Scenario Display
The measured field voltage is less than the revised allowable touch/reach voltage and the voltage across a glove does not exceed the rated voltage of the glove
PASS
The measured field voltage is less than the revised allowable touch/reach voltage but the voltage across a glove exceeds the rated voltage of the glove but is less than the routine test voltage of the glove
PASS
The calculated voltage across a glove for a particular location exceeds the routine test voltage of the glove
FAIL
5.2 Outside Sub & Special Location
The “Outside sub” and “Special Location” worksheets work exactly as per the “Inside Sub” worksheet and with the same conditions except for the following:
1. For locations outside the substation, analysis is available using curves as defined in “Figure 2: Touch Voltage versus Fault Duration” from the Electrical Safety Code of Practice 2010.
2. The ability to select gloves is not applicable to both “Outside Sub” and “Special Locations”.
Things to consider:
1. When using IEEE as the assessment criteria for “Outside Sub” and “Special Location”, it is important that appropriate backup, not primary, protection clearance times are used. As such, there is an additional row in both worksheets which allows the user to enter backup protection clearing times. For “Outside Sub” and “Special Location”, if EG0 or Code of Practice is selected as the analysis criteria, primary, not backup, clearance times are used i.e. EG0 and the Code of Practice always use primary protection clearance times in the analysis.

Substation Earth System Injection Analysis Tool User Guide
Page 16 of 23 Reference SP0510R03 Ver 1
Ergon Energy Corporation Limited ABN 50 087 646 062
2. As with the “Inside Sub” worksheet, at the bottom of each data entry section for step, touch and reach, the user can choose whether to look at prospective or effective (loaded) voltages for IEEE analysis on the “Analysis” worksheet. Note, changing this field does not affect any calculations on this worksheet – it purely dictates whether to pass prospective or effective (loaded) voltages back to the “Analysis” worksheet.
3. Be aware - EG0 and the Code of Practice are based on prospective voltage analysis, not effective or loaded voltages. The spreadsheet will ignore those voltages labelled as “L” when carrying out analysis under EG0 or Code of Practice.
4. If the Code of Practice is chosen to be the relevant assessment criteria, it becomes necessary that the user define whether the location under test is part of the CMEN network or not. A CMEN system is that in which the low voltage neutral conductor and the low voltage earthing system are connected to the high voltage earthing system. As an example, a metal fence running down the side of a consumer’s property would normally have no direct connection to the LV network. As such you would select “No” in the column titled “CMEN”. On the other hand, consider a steel shed at the same property which is bonded to earth which in turn is connected to the LV neutral via the MEN connection at the LV switchboard. Also, the LV neutral conductor back at the distribution transformer in this example is bonded to the HV earthing system. In this case, you would select “Yes” in the column titled “CMEN”.
5. The use of the Code of Practice requires the nominal system voltage levels be entered for both the HV and LV sides of the substation under test. Basically you have two options:
a. ≤66kV
b. >66kV
6. In addition, the user can choose whether to look at CMEN or non CMEN voltages for Code of Practice Analysis on the “Analysis” worksheet. Note, changing this field does not affect
HV FAULT LV FAULT≤ 66kV ≤ 66kV
462 4161480 402
Backup clearing time (msecs) 1020 960Primary clearing time (msecs)
Voltage level Fault current (amps)
Scaled Volts HV Fault
Code of Practice
PASS/FAIL
Scaled Volts LV
Fault
Code of Practice
PASS/FAIL
1 Metal fence on property at 7 Grevillea Street 0.654 P No 25.18 PASS 226.77 PASS
2 Steel shed at 7 Grevillea Street 1.254 P Yes 48.28 PASS 434.82 FAIL
3 Sw itchboard at 7 Grevillea Street 1.673 P Yes 64.41 PASS 580.11 FAIL
4
5
6
7
8
9
10
MAXIMUM TOUCH VOLTAGE 1.673 64.41 580.11
LV FAULT
Description Msd Volts Pros/ LoadedGrid ref
HV FAULT
TOUCH
CMEN
HV FAULT LV FAULT≤ 66kV ≤ 66kV
462 4161480 402
Backup clearing time (msecs) 1020 960Primary clearing time (msecs)
Voltage level Fault current (amps)

Substation Earth System Injection Analysis Tool User Guide
Page 17 of 23 Reference SP0510R03 Ver 1
Ergon Energy Corporation Limited ABN 50 087 646 062
any calculations on this worksheet – it purely dictates whether to pass CMEN or non CMEN voltages back to the “Analysis” worksheet.
6. ANALYSIS WORKSHEET The aim of the “Analysis” worksheet is to provide the user assistance in determining the correct combination of fault level and associated clearance times to be used in the “Inside Sub”, “Outside Sub” and “Special Location” worksheets. To simply use the maximum fault level and associated clearance time does not always give the worst case scenario for step, touch and reach voltage as will be shown further on.
The use of the “Analysis” sheet however is not essential, but on saying that, the following parameters must be filled out on this sheet to allow correct analysis in other worksheets:
1. The value for injected current used to obtain the associated step, touch and reach voltages – Iinject
2. The natural soil surface resistivity – ρs.
3. The thickness of gravel/crushed rock or bitumen laid on the surface to mitigate against high step and touch potentials - hs
Figure 5 below shows the data entry section of the Analysis worksheet. Data entry occurs only in the yellow cells.
Figure 5: “Analysis” worksheet data entry section
non CMEN
PFor IEEE analysis, do you want to look at prospective (P) or loaded (L) voltages?
For ESCOP analysis, do you want to look at CMEN or non CMEN locations?
Substation Earth System Injection Analysis Tool User Guide
Page 18 of 23 Reference SP0510R03 Ver 1
Ergon Energy Corporation Limited ABN 50 087 646 062
The relevant fields and their functions are outlined below:
a) Substation – Location of earth system under test (this will get automatically transferred onto all supplementary sheets)
b) Date – Date of test
c) Maximum E/F level HV Side – the spreadsheet will cover analysis for faults both on the HV and LV side of the substation under test. This field dictates:
a. the maximum earth fault level for a HV fault
b. what current level the relay curves are plotted to for a HV fault
c. what level the automatic analysis is undertaken for a HV fault
d) Maximum E/F level LV side – the spreadsheet will cover analysis for faults on both the HV and LV side of the substation under test. This field dictates:
a. the maximum earth fault level for a LV fault
b. what current level the relay curves are plotted to for a LV fault
c. what level the automatic analysis is undertaken for a LV fault
e) Injected current – this is the current injected into a remote earth when carrying out all step, touch and reach potential measurements. In many cases, but not all, this will be exactly the same value as the current injected when carrying out the current distribution and EPR tests.
f) CB Opening time – opening time for a CB in the substation. A nominal time of 80msecs is generally regarded as being suitable. For analysis, this CB opening time is added onto the relay operating time to come up with an overall clearance time for the fault in question
g) Location –
a. Inside sub
b. Outside sub
c. Special location defined as a place with high exposure rates and where people are likely to be wet and have no footwear e.g. school grounds, public swimming pools etc.
h) Contact type -
a. Step – foot to foot
b. Touch – hand to foot
c. Reach – hand to hand
i) Surface soil resistivity – this is the resistivity of the surface layer of natural soil obtained through soil resistivity testing and subsequent analysis. If no figures are available, 50Ωm may be used as a conservative value. This figure must be entered as not only is it used on this worksheet, but also transferred across to the “Inside Sub”, “Outside Sub” and “Special Location” worksheets
j) Thickness of rock/bitumen – This is the thickness of a surface layer of high resistivity material that may be installed. This figure must be entered as not only is it used on this worksheet, but also transferred across to the “Inside Sub”, “Outside Sub” and “Special Location” worksheets
k) Analysis required – this allows for analysis of either HV side or LV side faults
l) Relay data – This area covers off on the various protection relays that are installed at the substation in question. The spreadsheet currently allows for four IDMT relays plus two definite time relays. The following fields are configurable:
a. Name/Description – the name of the feeder or relay identifier
b. Curve – the following relay curves are available at this point in time:
i. IEC 60255 SI – standard Inverse
ii. IEC 60255 VI – very Inverse

Substation Earth System Injection Analysis Tool User Guide
Page 19 of 23 Reference SP0510R03 Ver 1
Ergon Energy Corporation Limited ABN 50 087 646 062
iii. IEC 60255 EI – extreme inverse
iv. IEC 60255 LTI – long time inverse
v. IEC 60255 STI – short time inverse
vi. CDGx1 SI – standard inverse
vii. CDGx3 – very inverse
viii. CDGx4 – extreme inverse
ix. None – no curve
c. Definite time multiplier – for certain IEC60255 relays, this is the multiple of pickup current where the relay characteristic goes from inverse to definite time. The options available are – N/A, 10, 20 & 30
d. Ie>set – relay pickup current in primary amps
e. TMS – time multiplier setting in a range 0 to 1.0
f. te>set – operating time for definite time relays only in msecs
g. Ie>>set – instantaneous/high level E/F setting of the relay in primary amps
h. te>>set – instantaneous/high level E/F relay operating time in msecs
i. HV Side/LV Side – identifies the relay as either being on the HV side or LV side of the site in question. If the analysis required is HV side, only relays being designated as HV side will be displayed on the relay characteristic operating plot. Similarly, if the analysis required is LV side, only relays being designated as LV side will be displayed.
j. Display curve – allows the user the option to display the curve or not.
Interpreting the results:
Below the data entry screen, is displayed a clearing time versus current graph (refer Figure 6 below) for the location/contact scenario as selected above. On this graph is displayed all the relay curves entered on the analysis page. Clearing times for all relays, including CB opening times, are displayed up to the maximum earth fault level for the site in question.
Coupled with this, three additional curves have been generated showing the maximum allowable clearance times (based on the highest recorded field voltage) for a particular primary current fault level.
The first is based on traditional IEEE80 calculations The second uses the EG0 approach. For EG0, calculations have been based on Curve C1
of Figure 20 – “Conventional time/current zones of effect of a.c. current (15Hz to 100Hz) on persons for a current path corresponding to left hand to feet “of AS60479 – Effects of current on human beings and livestock”.
The third are curves from the Electrical Safety Code of Practice 2010 – Works. Note these are relevant only for faults that occur outside the substation.
The user has the option of displaying the allowable body current curves by the menu directly below the graph.

Substation Earth System Injection Analysis Tool User Guide
Page 20 of 23 Reference SP0510R03 Ver 1
Ergon Energy Corporation Limited ABN 50 087 646 062
Figure 6: Relay curves and allowable clearance times
What does it mean?
Simply speaking, the clearance times (i.e. relay operating time + CB opening time) for any device must be less than the allowable clearance times (IEEE80, EG0 or Electrical Safety Code of Practice) across the entire current range up to the maximum earth fault level. In other words, if the graph for the maximum allowable clearance time cuts across any of the relay operating curves, we have a problem – the maximum allowable clearance time curves must always be above the protection relay operating curves.
Consider the following very hypothetical case, where we are looking at analysing for voltages inside a substation for an LV side fault using only EG0 criteria.

Substation Earth System Injection Analysis Tool User Guide
Page 21 of 23 Reference SP0510R03 Ver 1
Ergon Energy Corporation Limited ABN 50 087 646 062
Figure 7: Results interpretation
Note here, that on the Oakview feeder (light blue), the maximum allowable clearance time EG0 Curve C1 (red), cuts across the relay operating characteristic at a value of approximately 1650 amps with an associated clearing time of approx. 777 msecs. As such, we now have a problem. A good point to note here however - at the maximum fault level of 10000 amps (indeed for fault levels > 3000 amps) the instantaneous element of the feeder protection has come into play and we no longer have the problem i.e. the maximum allowable clearance time curve C1 is above the relay operating characteristic. The point of this is that it is not always the maximum fault level which may cause problems with excessive step, touch and reach voltages.
As a follow on, in the above example, if we were to enter in the maximum fault level of 10000 amps with an associated clearance time of 80 msecs (as per the relay operating characteristics above) into the “Inside Sub” worksheet, we would get a PASS for all measured voltages using EG0 as the assessment criteria. However if were to enter in a significantly reduced fault level of 3000 amps with its clearance time of approx. 800msecs, we would find at least one location that would exhibit a FAIL.
A similar approach can be adopted for the IEEE80 model, however the user must remember that for outside the substation it is the backup protection (e.g. transformer earth fault protection) that is used, not the primary protection when using IEEE80 criteria.
Once again a similar approach can be applied when using the Electrical Safety Code of Practice as the assessing criteria noting that in this case:
a) Primary protection clearance times are used b) The Electrical Safety Code of Practice curves are only relevant for outside the substation
and in special locations

Substation Earth System Injection Analysis Tool User Guide
Page 22 of 23 Reference SP0510R03 Ver 1
Ergon Energy Corporation Limited ABN 50 087 646 062
To provide more assistance, an additional graph has been added to the Analysis worksheet. This graph is a voltage versus time curve (refer Figure 8) and displays the following:
Allowable volts versus time using EG0 criteria Allowable volts versus time using IEEE80 Prospective Voltage criteria Allowable volts versus time using IEEE80 Loaded Voltage criteria Allowable volts versus time using the Electrical Safety Code of Practice criteria The substation EPR with maximum earth fault current
The user can enter in a desired clearance time for the location and contact scenario as specified and obtain a value for maximum allowable voltages for IEEE80, EG0 and Electrical safety Code of Practice criteria.
Figure 8: Max Allowable Prospective Voltage versus Time
One final graph is displayed in the Analysis worksheet that being a permissible body current versus clearance time using both IEEE80 and EG0 criteria. Once again, a clearance time can be selected and the permissible body currents using both these criteria will be displayed (refer Figure 9)

Substation Earth System Injection Analysis Tool User Guide
Page 23 of 23 Reference SP0510R03 Ver 1
Ergon Energy Corporation Limited ABN 50 087 646 062
Figure 9: Max Permissible Body Current versus Time
7. REITERATING SOME IMPORTANT POINTS The worksheets “Inside Sub”, “Outside Sub” and “Special Location” have links directly to
the worksheet “Analysis” and vice versa. Adding additional worksheets to the spreadsheet will affect the integrity of the tool. DO NOT ADD ADDITIONAL WORKSHEETS TO THE SPREADSHEET AND EXPECT TO GET MEANINGFUL RESULTS.
The calculations done on the sheets “Inside Sub”, “Outside Sub” and “Special Location” are independent of the calculations done on the “Analysis” worksheet excepting for the values for injected current, natural soil surface resistivity and thickness of any additional surface material (e.g. crushed rock, bitumen etc.) that can be applied.
Whilst the individual worksheets “Inside Sub”, Outside Sub” & “Special Locations” allow an instantaneous view of all measured voltages and their alignment with IEEE80, EG0 and Electrical Safety Code of Practice guidelines, it is up to the user to decide on a relevant combination of both fault current and clearance time. This is the intended purpose of the “Analysis” worksheet i.e. to help the user decide on a suitable fault current/clearing time combination to put into the respective “Inside Sub”, “Outside Sub” and “Special Location” worksheets.
If using IEEE80 criteria, it is important to note that for contact scenarios outside the substation perimeter fence, backup protection clearance times are used, whereas inside the substation fence, primary protection clearance times are used.
EG0 and the Electrical Safety Code of Practice use only primary protection clearance times for analysis
Loaded voltages are only relevant to IEEE analysis
The Electrical Safety Code of Practice assessment criteria are only suitable for locations outside the substation including special locations


![Report on Ichchhapore substation Substation...2014/07/06 · Date:02/02/2018 Report on Ichchhapore substation Substation: SubstationEquipment: 1] PowerTransformer: A ...](https://static.fdocuments.us/doc/165x107/6082a7423c38c8542368e070/report-on-ichchhapore-substation-substation-20140706-date02022018-report.jpg)