soy barometer 2014 - Both ENDS
28
soy barometer 2014
Transcript of soy barometer 2014 - Both ENDS

soy barometer 2014

soytable of contents
introduction 2
soy is everywhere 4
negative impacts of soy in production countries 6
the global soy trade 8
dutch import and export of soy 10
soybean processing 12
soy consumption in the netherlands 14
standards for responsible soy 16
initiatives and progress 18
european soy use and protein dependency 20
replacement of imported soy 22
conclusion 24
2

the secret life of soy
400301 605 34 33666 36gramsof soy
gramsof soy
gramsof soy
gramsof soy
gramsof soy
gramsof soy
gramsof soy
How much more would we have to pay if we use rtrs certified soy?
per kilo / per egg
per kilo / per litre / per egg
0,1 cent 0,18 cent 0,17 cent 0,01 cent0,14 cent+ + + ++
1

introduction
When people hear the word “soy” most of them think of soy milk and meat substitutes such as tofu. But many of us don’t realise that soybeans are pre-sent in more than half of the products in the supermarket, in one way or another, and that we consume more soy than we think.
The majority of soybeans are used to manufacture soybean oil and protein rich soymeal, an important ingredient in livestock feed, used for the produc-tion of meat, milk and eggs. Soybean oil is also found in many other prod-ucts, such as detergents and biodiesel.
The global consumption of soy is increasing, partly because of population growth, but also because of rising prosperity in countries such as China. This has led to an explosive growth in worldwide meat consumption, leading in turn to an increasing need for fodder, and thus soy.
Soy production provides income, but also has great social, environmental and economic impacts in countries where soy is grown. To address these problems and to seek solutions, Dutch civil society organisations founded the Dutch Soy Coalition in 2004. The coalition collaborates with scientists, the private sector and civil society organisations in soy producing, process-ing and consuming countries to fi nd ways to reduce the negative effects of soy production.
The Dutch Soy Coalition focuses on the three R’s of Replacement, Reduction and Responsibility: Replacement of imported soy in animal feed, Replacement of imported soy in animal feed, Replacement Reductionof soy consumption and taking a Responsible approach to soybean produc-tion. This publication is mainly focused on the two R’s of Replacement and Responsibility.
In the Netherlands, various parties are committed to ensuring that we will only process and use responsible soy. But how are these developments evol v-ing? Are things going in the right direction? The Dutch Soy Coalition address-es these questions, and more, in the latest edition of the Soy Barometer, the third in its series. For more details, please see the background report, which you can order from the Dutch Soy Coalition.
2
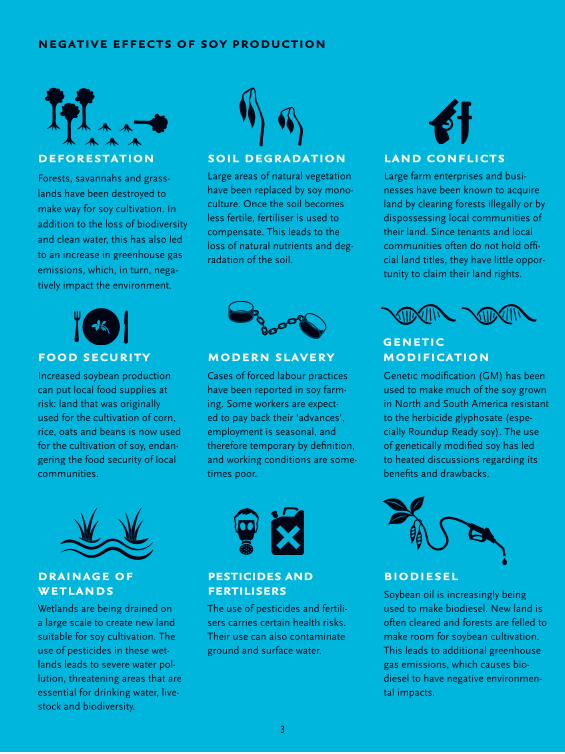
negative effects of soy production
deforestation
modern slaverygenetic modification
soil degradation
drainage of wetlands
biodieselpesticides and fertilisers
land conflicts
food security
Forests, savannahs and grass-
lands have been destroyed to
make way for soy cultivation. In
addition to the loss of biodiversity
and clean water, this has also led
to an increase in greenhouse gas
emissions, which, in turn, nega-
tively impact the environment.
Cases of forced labour practices have been reported in soy farm-ing. Some workers are expect-ed to pay back their 'advances', employment is seasonal, and therefore temporary by defi nition, and working conditions are some-times poor.
Genetic modifi cation (GM) has been used to make much of the soy grown in North and South America resistant to the herbicide glyphosate (espe-cially Roundup Ready soy). The use of genetically modifi ed soy has led to heated discussions regarding its be nefi ts and drawbacks.
Large areas of natural vegetation have been replaced by soy mono-culture. Once the soil becomes less fertile, fertiliser is used to compensate. This leads to the loss of natural nutrients and deg-radation of the soil.
Wetlands are being drained on a large scale to create new land suitable for soy cultivation. The use of pesticides in these wet-lands leads to severe water pol-lution, threatening areas that are essential for drinking water, live-stock and biodiversity.
Soybean oil is increasingly being used to make biodiesel. New land is often cleared and forests are felled to make room for soybean cultivation. This leads to additional greenhouse gas emissions, which causes bio-diesel to have negative environmen-tal impacts.
The use of pesticides and fertili-sers carries certain health risks. Their use can also contaminate ground and surface water.
Large farm enterprises and busi-nesses have been known to acquire land by clearing forests illegally or by dispossessing local communities of their land. Since tenants and local communities often do not hold offi -cial land titles, they have little oppor-tunity to claim their land rights.
Increased soybean production can put local food supplies at risk: land that was originally used for the cultivation of corn, rice, oats and beans is now used for the cultivation of soy, endan-gering the food security of local communities.
3

soy is everywhere
Soybeans are edible beans that grow on an annual plant in temperate, subtropical and tropical climates in the United States, South America (especially South Central Brazil, Argentina and Paraguay), Asia (especial-ly Central India and Northeast China) and, to a limited extent, in Russia, Africa (especially Angola and Mozambique) and Europe (mainly in the Ukraine and Italy). The global soybean harvest has increased by 140% in the past 20 years. In 2013, the main soy producing country was the USA, followed by Brazil and Argentina.
Despite these percentages, you will not easily fi nd a packet of soybeans in the supermarket, because soy is mainly used in processed foods. The most recognisable soy products are food items such as soy milk, soy sauce, tofu and other meat substitutes. Yet only 6% of the soybeans pro-duced worldwide are used for such foods, mainly in Asia. The majority of soybeans are used to produce soymeal and soybean oil.
Soymeal is a much-used ingredient in fodder because it is very protein-rich. The high demand for soy in recent decades has been a direct result of the growing global population and related consumption patterns. Humans are consuming increasing amounts of dairy and meat and more and more soy is needed to feed the growing number of livestock.
Soybean oil is mainly used in food products, such as mayonnaise, mar-garine, sauces and dressings, but can also be found in biscuits, ready meals, ice cream and other snacks. Soybean oil can even be found on the labels of cosmetics, detergents and cleaning products.
In addition, an increasing amount of soybean oil is used in biodiesel pro-duction, mainly in the USA. Lecithin, a by-product of the soybean press-ing process, is used by the food industry as an emulsifi er in products such as chocolate and peanut butter.
4

191115 276total
(incl. other countries)
global soy production 1993 2003 2013in 1,000,000 tonnes of soy beans
1993
1993
1993
1993
1 15
52311
2
0
2003
2003
2003
2003
2 15
85235
4
2
51 67 892013
2013
2013
2013
55 13
128249
9
2
usa europe china
indiabrazilargentina
paraguay
bolivia
1993 2003 2013
1993 2003 2013 1993 2003 2013 1993 2003 2013
1993 2003 2013
5
negative impacts of soy in production countries
In Europe, soy is the import crop that causes the most deforestation: some 60% of the deforestation caused by crops exported to Europe is the result of soybean cultivation. Soy is grown primarily in North- and South America, and with the expansion of the areas where soy is grown, millions of hectares of forest, savannah, grasslands and wetlands are dis-appearing. This doesn’t only translate to an invaluable loss of biodiver-sity, but also to the disruption of water management, with signifi cantly increased risks of droughts and fl oods. Moreover, deforestation leads to the release of greenhouse gases, contributing to climate change.
Wherever intensive soy cultivation takes place, the landscape changes completely. The disappearance of natural vegetation causes soil to lose its protective fertile layer, making it a less conducive environment for plant growth. To compensate, fertiliser and many pesticides are used for the cultivation of soybeans. These farming solutions pollute ground- and surface water, and endanger the health of the people living in the vicinity of soy plantations.
In recent years, soy production has spread to sensitive areas that are actually not suitable for soy cultivation. Not only in the Amazon, but also in drier areas such as the Chaco and wetlands such as the Pantanal. To ensure a good harvest in areas that are too wet or dry, (GM) seeds are used with a range of pesticides that are suitable for the soy, but disas-trous for the rest of the area. Most of the soy grown in these areas and elsewhere is genetically modifi ed (GM) - in Argentina up to 99%.
Increased soy cultivation has also caused various social problems. Small-scale farmers, who are dependent on the land and water for their survival, see their environment changing into large soy plantations. Powerful cor-porations force locals to hand over their land, sometimes through vio-lence. Without offi cial land titles, thousands of subsistence farmers are losing their land, and thus, their income.
6

impact in numbers
Soy production in Latin America increased
by 300% between 1993 and 2013, from 18.4
million hectares to 55.6 hectares.
Currently, an average of 15 litres of chemicals per hectare
is used for the production of soy in South America.
According to the Slave labour laundry list, based on information from the
Brazilian government, it appears that still at least ten soybean compa-
nies in Brazil are guilty of modern slavery practices.
A very large part of the cropland in
South America is used for soy production.
In the province of Córdoba, Argentina, 70% of the Saladillo wetlands have been
lost as a result of the construction of canals for soy cultivation. In addition,
20% has been destroyed, with major implications for water management.
70% loss of the saladillo wetlands in córdoba, argentina
cropland used for soy cultivation
10 companies using slavery in brazil
from 3 to 15 litres of poison per hectare
300% growth from 1993 to 2013
- 70%
+ 300%
1015 litres
Paraguay
Bolivia
Argentina
Brazil
1997 2013 2013
42%
54%
36%
55%
7

the global soy trade
The cultivation of soybeans in producing countries is the fi rst link in the soy chain, but there are enormous varieties in scale. There are millions of small-scale farmers in South America, Asia and Africa who grow soy on less than 50 hectares of land. However, most soy is grown on huge industrial farms of up to 100,000 hectares, mainly in Brazil and Argentina.
Some two-thirds of the global soybean production - 173 out of 276 million tonnes - is exported. Brazil is the largest supplier, and its soybean exports have increased by 75% in the past six years. Argentina is the third-largest soy exporter, but leads the world ranking when it comes to the export of soymeal and soybean oil.
Soy is harvested, purchased, processed and subsequently traded in the form of beans, meal or oil. Four multinational companies dominate the global soy trade and processing industry: Archer Daniel Midlands (ADM), Bunge, Cargill and Louis Dreyfus. These multinationals are mainly from the United States and Europe. Other key players are the Brazilian Maggi Group, Japan's Marubeni and Dutch-Chinese Nidera. These key traders sell their (processed) soy stock to the feed industry and the food- and cosmetics industries. Multinational companies such as Unilever, Danone, Procter & Gamble, Mondelez and Nestlé play an important role in these industries.
China is the world’s main soy importer, followed by the European Union. In 2013, China imported more than half of the globally traded soy, while the European Union purchased the most soy meal. China’s demand for soy is increasing due to the country’s population growth, economic growth and the associated increase in meat consumption.
4
8

worldwide soy import & export 2008 2011 2013in 1,000,000 tonnes of soybeans, -meal and -oil
the netherlands
9 9 8
china
40 54 65
4 5 4
1 1 2
0 1 2 rest of europe
32 29 24
29 49 57
43 43 50
41 43 37
6 7 8
export
importparaguay
india
bolivia
ukraine
argentina
usa
brazil
4 %
21%
38%
37%
276
total production
export
do
mes
tic
use bean
s
meal oil
9

dutch import and export of soy
The Netherlands is an important global trading partner and the sec-ond largest exporter of agricultural products in the world, after the United States. The Netherlands is also the largest importer of soy in the European Union and thus an important link in the European soy chain. About a quarter of the soy imported by the European Union arrives through the Dutch ports of Amsterdam and Rotterdam. The Netherlands imports soy mainly from South America, especially from Brazil.
The amount of soy annually imported by the Netherlands requires a total surface for cultivation that is comparable to 80% of the Netherlands.
Of the 8.3 million tonnes of soy beans, -meal and -oil that entered the Netherlands in 2013 (unprocessed or crushed), 5.9 million tonnes (71%) were exported by the Netherlands to other countries (mainly in Europe). Of the 2.4 million tonnes that remained in the Netherlands, 2.1 million tonnes were processed into animal feed to eventually end up in products such as meat, dairy and eggs. Germany and Belgium are the largest con-sumers of soy and animal derived products from the Netherlands, fol-lowed by the United Kingdom, France and Denmark. More than 1 million tonne of soy is consumed in the Netherlands itself in a variety of forms.
Dutch ports, the meat- and dairy industries, and Dutch subsidiaries of multinational corporations profi t from the transit of soy through the Netherlands and from the processing of soy into export products for the food- and livestock industries. This makes them co-responsible for the consequences of soy cultivation in soy producing countries. They should therefore demand minimum criteria on how this soy production takes place.
5
10

usa
belgiumbelgium
germanygermany
unitedunitedkingdomkingdom
rest of europe
other countries
denmarkdenmark
francefrance
europe
paraguay
dutch import and export 2013
brazil
argentina
990
370
1,209
4,638
other countries
680
394
2,1932,193
1,2721,272
645645
631631631631631631631631
204
233233233233233233233233233233233233233233233233233233233233233233233233233233233233233233233233233233233233233233233233233233233233233233233233233233233233233233233233233
241241241241241241241241241241241241241241241241241241241241241241241241241241241
in 1,000 tonnes of soybeans, -meal and -oil
the netherlands
8,281
11

soybean processing
There are two major factories that process soybeans in the Netherlands. These so-called soybean crushing plants are owned by two of the biggest soy traders in the world: Archer Daniel Midlands (ADM) in Rotterdam and Cargill in Amsterdam. In 2013, some 2.4 million tonnes of soybeans were crushed in the Netherlands - 76% of all soybeans that were import-ed by the Netherlands.
Approximately 2.4 million tonnes of soy products were further processed in the Netherlands. The animal feed industry is by far the Netherlands’ largest soybean processing sector. Soy meal – and to a lesser extent, soy-beans and soybean oil – is a popular ingredient in animal feed, because the animals grow quickly due to the high protein content. Although most of the feed is used by Dutch farmers, a large proportion of the soy used in animal feed indirectly fi nds its way to other countries in Europe in the form of meat, such as pork and chicken, eggs and dairy products.
There are over 100 feed processing companies active in the Netherlands. The three largest are Agrifi rm, ForFarmers and De Heus. In 2013, an estimated 17 million tonnes of fodder was consumed, with a soy con-tent between 7 and 26%. The soy content in animal feed varies by sector. More than 2 million tonnes of soybeans were processed to produce this feed, more than a quarter of the total Dutch imports in 2013.
The poultry and pork sectors are the largest consumers of soy-based ani-mal feed. Some 605 grams of soy is used to produce one kilo of chicken, 336 grams for one kilogram of pork and 400 grams of soy for one kilo-gram of beef. An average of 36 grams of soy is needed for the production of 1 egg of 60 grams. Major players in these sectors are Plukon (chicken), VION (pork) and the Interovo Egg Group.
12
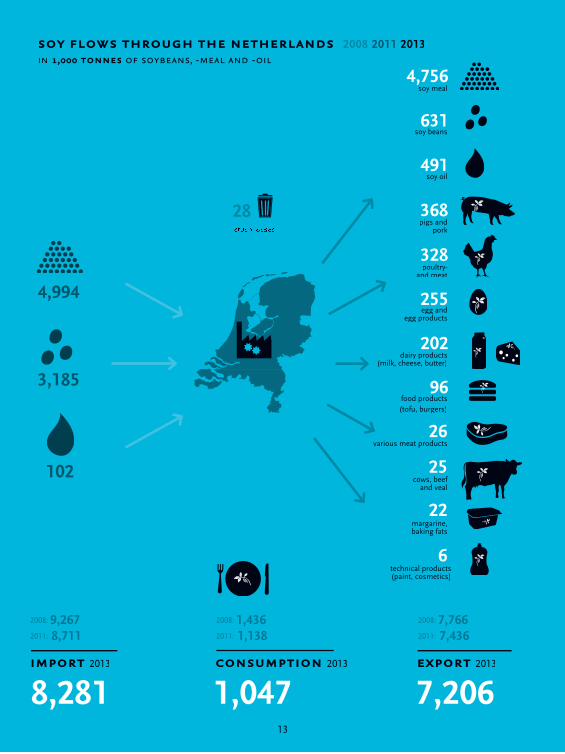
soy flows through the netherlands 2008 2011 2013in 1,000 tonnes of soybeans, -meal and -oil
631
25
368
328
255
6
22
26
96
202
4,756
3,185
8,281 1,047 7,206
4,994
102
491
dairy products (milk, cheese, butter)
soy meal4,756
soy meal4,756
technical products (paint, cosmetics)
soy beans
pigs and pork
soy oil
egg and egg products
poultry- and meat
food products (tofu, burgers)
various meat products
margarine, baking fats
cows, beef and veal
import 2013 consumption 2013 export 2013
2008: 9,2672011: 8,711
2008: 1,4362011: 1,138
2008: 7,7662011: 7,436
28crush losses
13

soy consumption in the netherlands
The Dutch consume about 13% of all soy imported into the Netherlands: more than 1 million tonnes. The majority of this soy is consumed in the form of meat-, egg- and dairy products. In 2013, the Netherlands pro-duced more than 10 billion eggs, of which no fewer than 3.3 billion were consumed in the Netherlands, either directly or incorporated into fi n-ished products.
Of the 1.8 million tonnes of Dutch pork produced in 2013, almost 700,000 tonnes were destined for the Dutch market. The Dutch produc-tion of chicken meat has increased by 21% – from 762,000 to 920,000 tonnes – between 2011 and 2013. A large part of the additional production was for export, because the domestic consumption of poultry - 377,000 tonnes - remained virtually unchanged.
Most of the livestock products and foodstuffs containing soy reach Dutch consumers through retail channels. In fact, 59% of consumers buy their meat at the supermarket, compared to 4% who purchase meat at the butcher. Some 35% of the remaining meat reaches the consumer through the hospitality industry, offi ces and catering and 2% through other chan-nels. Some 81% of sandwich meats are sold via supermarkets, but the sale of eggs takes the cake, with a supermarket sales share of almost 89%.
Supermarket chains play a leading role in the procurement and market-ing of soy based products and are therefore a crucial link in fi nding ways to replace soy, in making soybean production more sustainable, or in reducing the consumption of animal proteins, the three Rs previously mentioned.
14

10
consumption in the netherlands & farmland required 2013
in 1,000 tonnes
consumption soy required
farmland required shown in football fields
377
686
3,3
3718
248
158
302
50
billion eggs
228
230
football fi elds10,000
95,000
59,000
67,000
48,000
47,000
29,000
11,000
5,000
96,000
118
150
102
75
121
1315

standards for responsible soy
Various certifi able standards for resposible soy co-exist, however these stand-ards may have different approaches to issues such as social- and environmen-tal criteria. This raises questions about how and by whom these criteria are determined, how they are implemented and if and in what way they are (inde-pendently) audited. Below is an overview of the main differences:
The certifi cation GMO-free indicates that no genetically modifi ed soy was used in the entire chain. There are no other social or environmental criteria associ-ated with this label. The control of non-GM is very strict.
Soy farmers that are certifi ed organic may not use chemical pesticides, fertili-sers or genetically modifi ed organisms. There are also various requirements in the fi eld of nature conservation, land and labour laws, and health and safety regulations. All stakeholders are involved in the standard and audits are strict.
In addition to organic farming criteria (see above), EcoSocial, a Brazilian hall-mark, uses a number of social criteria aimed at improving the living conditions of the local population and small-scale farmers. These criteria may be audited via internal or external means.
The standard Round Table on Responsible Soy (RTRS) was created from an international platform of soy producers, traders, processors, banks and civil society organisations. The standard has strong social- and environmental cri-teria. One requirement is that as of 2009 no forest or other valuable natural resources may be destroyed. RTRS may be used for both GM and non-GM soy and there is strict control.
The ProTerra standard has strong social- and environmental criteria and cer-tifi es only non-GM. Furthermore, ProTerra prohibits farms where deforesta-tion took place after 2004. Diverse stakeholders are now involved and exter-nal audits are required, but verifi cation is less transparent than with RTRS. Because ProTerra allows only non-GM soy, it should be possible to track this soy separately.
16

2008
2013
174
583
2,400
2015
417
110
124
39
ProTerra
Organic Non-GMEcoSocial
Non-GM OrganicFSP EcoSocial
2215
136
RTRS
ProTerra
110,5
Standards are still under development, and the differ-ences are often in the details. More information can be found in the studies refer-enced in the background report.
In 2013, at least 583,000 tonnes of soybeans import-ed into the Netherlands were certifi ed according to one or more of the standards above.
volume of certified soy processed in the netherlandsx 1,000 tonnes
commitment
100 % rtrs soy2015 netherlands
17

initiatives and progress
A number of Dutch companies have decided to start or join initiatives that encourage certifi ed soy cultivation, sometimes in collaboration with civil society organisations.
In 2011, Dutch supermarkets, LTO Netherlands (an organisation that rep-resents the interests of employers and businesses in the Dutch agricul-tural- and horticultural sectors), the Dutch Margarine, Fats & Oils Board, representatives of the dairy-, poultry- and pork sectors and a number of civil society organisations signed the Covenant for Responsible Soy (Intentieverklaring Verantwoorde Soja). In the statement, the parties agreed that by 2015 all soy used for the production of meat, dairy, eggs and other foods in the Netherlands, should be RTRS (or equivalent) certifi ed.
In 2012, the business signatories founded the Dutch Foundation for Chain Transition Responsible Soy (Stichting Ketentransitie Verantwoorde Soja) to achieve the aforementioned goals. Of the 1 million tonne of RTRS soy that would be purchased in 2013 according to the letter of intent, 417,000 tonnes was realised.
Solidaridad and the RTRS have supported the Farmer Support Programme (FSP) since 2009, with the aim of supporting small-scale farmers to produce responsible soy and prepare them for certifi cation. A number of Dutch companies support this programme. In 2013, 85,000 small-scale soy producers in South America, Asia and Africa received support, of which 17,000 were already producing 75,000 tonnes of RTRS soy in 2013.
IDH (The Sustainable Trade Initiative) has supported processors or buy-ers who invest in certifying soy with the Soy Fast Track Fund (SFTF) since 2012. In 2013, 21 projects in Brazil, Argentina and Paraguay received SFTF support to attain certifi cation for 3 million tonnes of soy by 2015. Both the FSP and SFTF received fi nancial support from the Dutch government.
18

In 2006, Brazilian soy traders announced the Soy Moratoriumand have since been working on its implementation with civil society organisations and the Brazilian government. As a result, in 2013 the Netherlands used no soy cultivated in deforested are-as of the Amazon after July 2006.
In 2013, 5.5 million tonnes of soy was certifi ed worldwide under a sustainability standard. This was 2% of the world’s total soy production. That same year, the Netherlands purchased and pro-cessed 10% of this certifi ed production (0.2%).
To ensure that soy is actually produced without causing social- and environmental problems in the world, the share of certifi ed soy must increase signifi cantly and the standards should be con-tinuously improved. Moreover, the implementation of, and com-pliance with, the rules should be independently and thoroughly audited.
4% 7% 25%2008 2011 2013
certifi ed soy in the netherlands
towards
100 %rtrs soy2015netherlands2015netherlands2015
19

european soy use and protein dependency
The consumption of meat, dairy and eggs is rising in Europe. The per capita consumption of meat in the Netherlands is more than 80 kilos a year (the global average is 43 kg). European livestock requires an increas-ing amount of protein-rich animal feed, but instead of producing more protein-rich crops, the European production of these crops has actually decreased in the last decade. Protein-rich crops, such as soy, are import-ed from other parts of the world, because it is more economically attrac-tive to do so. European farmers also grow few protein-rich crops because soy from South America is cheaper, and because other crops such as wheat and corn yield more.
Currently, cultivation of protein-rich crops in the European Union sup-plies only 20-30% of the protein supply in the food, and only a small percentage of this is soy. More than 31 million tonnes of soy is used in Europe each year, of which only 3.6% is produced in Europe. Currently, some 1.1 million tonnes of soybeans are grown on 417,000 hectares of farmland across 28 EU countries – a fraction (0.4%) of the global soy-bean production.
Thus, Europe is highly dependent on other continents for its protein sup-ply. An additional effect is the risk that agricultural land in South America becomes impoverished, while nutrients accumulate in European soils. Because the Netherlands imports so many raw materials – such as soy – it even has a nutrient surplus, also known as a manure surplus.
Europe could become less dependent on the import of soy and contrib-ute to the reduction of the negative impacts of soy production by taking the cultivation of protein-rich crops into its own hands.
20

31 europe uses 31 million tonnes of soy,
but produces only 1.1 million tonnes domestically
1111111111111111111.1.1.1.1.1.1.1million tonnes
29.9million tonnes
europe produces little soy
21

replacement of imported soy
The production of protein-rich crops in Europe could have the added ben-efi t of making European soil even more fertile, because crops such as peas, lupines and soy bind atmospheric nitrogen to the soil. They need less (arti-fi cial) fertiliser and crops that are subsequently grown on the same land can be grown with less manure. Another advantage of growing protein-rich crops in Europe is that it will close the so-called nutrient cycle, which means that the nutrients from the soil can be reused for the cultivation of new crops.
Europe is in the process of looking for sustainable alternatives for its soy imports. A production level of 3.1 tonnes of soy per hectare would already be competitive with South American soy and would reduce the fodder footprint. Europe should, however, heed the pitfalls of soy production: it must not take place at the expense of other crops or natural resources, as is the case in other production countries. There are several initiatives to increase European production, such as “Danube Soy”, cultivation trials in the Netherlands and initiatives in France, Germany and Sweden. In 2013, Friends of the Earth Netherlands organised a cheese production initiative called Kleine Hoefprint (“Little Hoof Print”), which was based on the use of regionally grown fodder.
There are also other possibilities besides soy cultivation. Bone meal has almost the same nutritional properties as soy fodder and a low carbon foot-print. The sustainable production of algae, duckweed, insects and synthetic amino acids could also contribute to the protein values in fodder.
All Dutch parties in the soy chain, including the Dutch government, can play an important role in the development of opportunities to replace imported soy; by investing in research into alternatives, for example, and buying from national and regional suppliers. Should these measures ultimately lead to a loss of market share and income for small-scale soybean farmers in South America, stakeholders should jointly look for possible sustainable alterna-tives and solutions.
22

increasing soybean production
results in a deficiency of nutrients = depleted soil
manure surplus
potential agricultural land available in europe
effects of soy on farmland
0.5 million hectares used for soybean cultivation.
south america europe
2.4 million hectares of
agricultural land available for the European cultivation
of protein-rich crops.
23

conclusion
In 2013, 276 million tonnes of soybean was grown worldwide in an area the size of France and Spain combined, most of it in the United States, Brazil, Argentina and China. More than 11% of the world’s soy production ends up in the European Union, of which the Netherlands is the largest soy importer.
The global demand for soy is increasing, but soy production has negative effects on natural resources and local populations. We use a lot of soy in Europe, but we hardly produce any ourselves. To prevent the negative effects of soy production, we should import less soy and only responsible, certifi ed soy.
In 2013, only 2% of all the soy produced worldwide was certifi ed under a sus-tainability standard. Of the 2.4 million tonnes of soy that was used in the Netherlands in 2013, 25% was certifi ed, compared to 7% in 2011. The target of 100% by 2015 is therefore not yet in sight.
In addition to using certifi ed soy, efforts are being made to cultivate soy and other protein-rich crops on European soil. Making soy cultivation in the Netherlands and Europe a truly sustainable and profi table endeavour requires further development.
Real change requires political and corporate will in both producing- and con-suming countries. The Netherlands and Europe must seriously invest in domestic soy cultivation, realise a drastic reduction in the consumption of animal proteins and commit to purchasing certifi ed soy. In addition to the current voluntary agreements, strict, enforceable rules must be established. Monitoring compliance with laws and regulations must become much strict-er in producing countries.
The Dutch Soy Coalition urges the government of the Netherlands and Dutch companies to put considerable extra effort into ensuring that the soy we use and trade in the Netherlands – both in products for the Dutch market and for export - has no negative impacts in producing countries.
24

issue
Duth Soy Coalition 2014
text
Project manager: Tamara Mohr - Both ENDS. With thanks to
Sandra Mulder - WWF NL, Hugo Hooijer - Milieudefensie,
Ben Hermans - Natuur & Milieu, Gert van der Bijl - Solidari-
dad, Heleen van den Hombergh - IUCN NL, Maria Stolk -
Wetlands International, Ioan Nemes - Oxfam Novib,
Masja Helmer and Sanderijn van Beek - Both ENDS.
research
Profundo: Barbara Küpper, Jan Willem van Gelder en
Minique Vrins
translation
Karin Engelbrecht
design and graphics
Tegenwind grafi sch ontwerpburo: Roelant Meijer
sources
Soy Barometer 2014, A Research report for the Dutch Soy
Coalition, Profundo Research and Advice, September 2014
Observatorio Socioambiental de la Soja
www.observatoriosoja.org
printing
Drukkerij Mostert & Van Onderen!
The Dutch Soy Coalition consists of eight Dutch organisati-The Dutch Soy Coalition consists of eight Dutch organisati-
ons: Both ENDS, IUCN Netherlands Committee, Milieu-
defensie (Friends of the Earth Netherlands), Oxfam Novib,
Solidaridad, Natuur & Milieu, World Wild Fund for Nature
and Wetlands International.
secretariat the dutch soy coalition
c/o Both ENDS
Nieuwe Keizersgracht 45
1018 VC Amsterdam
The Netherlands
contact: Tamara Mohr
telephone number: +31-(0)20-5306600
Email: [email protected]
www.bothends.org
www.sojacoalitie.nl
This publication was made possible thanks
to the fi nancial support of the Ecosystem Alliance.
3

www.sojacoalitie.nl
4