
Sovereign Rating Downgrades and Firm …...Sovereign credit ratings are issued by credit rating...
39
Sovereign Rating Downgrades and Firm Performance: The Sovereign Ceiling Channel Thomas To University of Sydney [email protected] Eliza Wu* University of Sydney [email protected] Lambert Zhang University of Sydney [email protected] *Corresponding author. Tel.: +61-2-86274626.
Transcript of Sovereign Rating Downgrades and Firm …...Sovereign credit ratings are issued by credit rating...
Sovereign Rating Downgrades and Firm
Performance: The Sovereign Ceiling Channel
Thomas To
University of Sydney
Eliza Wu*
University of Sydney
Lambert Zhang
University of Sydney
*Corresponding author. Tel.: +61-2-86274626.
Sovereign Rating Downgrades and Firm
Performance: The Sovereign Ceiling Channel
ABSTRACT
We study the effect of sovereign credit rating downgrades on firm performance through the
sovereign ceiling channel. Sovereign ceiling policies of CRAs require firms to have ratings at
or below their sovereign. Using a difference-in-differences approach, we show that the
performance of non-bound firms improve relative to firms at the bound after a sovereign rating
downgrade. We further show that the effect is concentrated in bound firms with large reductions
in debt issuance and investment levels around a sovereign downgrade suggesting that non-
bound firms benefit significantly from the increasing debt financing costs faced by bound firms
after a sovereign rating downgrade. Overall, our findings indicate that there are reallocation
effects from CRAs’ credit policies.
JEL classification: G24, G31, G32, G38, H63, I25
Keywords: Credit ratings, Sovereign ceiling, Financial constraints, Investment, Firm
performance
1
1. Introduction
Credit ratings are one of the most salient measures of the creditworthiness of debt issuers. They
received widespread and unprecedented scrutiny following the 2007-2009 Global Financial
Crisis and the ensuing European sovereign debt crisis. Investors were shocked by the series of
sovereign debt defaults that caused many countries’ credit ratings, including the United States,
to be downgraded for the first time in history (New York Times, 2011).
Extant evidence identifies that corporates have been affected by these sovereign rating
downgrades through the sovereign ceiling channel. Credit rating agencies’ sovereign ceiling
policies require firms’ ratings to remain at or below the rating of their country of domicile, and
Almeida et al. (2017) show that firms at the sovereign bound are forced to reduce their
investment and reliance on credit markets due to the increasing cost of debt capital following a
sovereign rating downgrade. Similarly, anecdotal evidence also reveals that many large and
economically important firms have been affected through the sovereign ceiling channel. For
example, several Russian gas and oil giants such as Gazprom and Rosneft were downgraded
after Russia got downgraded by Standard & Poor’s (S&P) from BBB- to BB+ in January 2015.
With outstanding total debt estimated at over $40 billion, Rosneft’s financing activities were
severely impacted by the forced rating downgrade which led the firm to alter its investment
strategy. A senior spokesman of Roseneft stated “We have taken a decision to adjust our
business plans to take into account the macro environment and optimize capital expenditures to
prioritize upstream projects” (Reuters, 2015).
A natural question emanating from these observations is: How is the operating performance of
firms in downgraded countries affected by sovereign rating downgrades? Can there be winners
as well as losers? Are the sovereign bound firms that are forced to reduce corporate investments
performing worse as a result of being forced to forgo projects that they can no longer fund or
2
are they unaffected as they are able to adjust their business plans to prioritize on core projects?
Are the unbound firms benefiting from the bound firms’ misfortunes by taking on “investment
slack” that bound firms can no longer afford to take on? This paper attempts to answer these
questions by examining the effects of sovereign rating downgrades on corporate performance
induced by the use of sovereign ceiling policies.
Sovereign credit ratings are issued by credit rating agencies, such as Moody’s, Standard &
Poor’s and Fitch, to provide a comprehensive measure of a national government’s
creditworthiness (Ferreira and Gama, 2007). Such ratings are important because they serve as
anchors for credit assessments on all borrowers within a given country. The “sovereign ceiling
policy” is one of the key policies known to be applied by credit rating agencies. The “sovereign
ceiling” rule implies that it is highly unlikely for an individual company to have a credit rating
higher than the long-term government bond rating of its country of operation at any point in
time, since macroeconomic conditions play a large role in a firm’s operations (Borensztein,
Cowan and Valenzuela, 2013). In a recent study, Almeida et al. (2017) find empirical evidence
showing that the sovereign ceiling policy is widely adopted in practice around the world. They
find that within the month of a sovereign rating downgrade, 59% of the companies that have a
better or equal credit rating as the country in which they operate in are also downgraded.
In the spirit of Adelino and Ferreira (2016), we investigate the effects of sovereign ceilings on
firm performance in a matched global sample of “treatment” firms (firms bounded by the
sovereign ceiling) and “control” firms (non-bounded firms) from 1990 to 2016 using a
difference-in-differences approach. We find that the performance of control firms improve
significantly relative to treated firms after a sovereign rating downgrade. Our results show that
control firms’ ROA significantly increases by 1.03% from 11.17% to 12.20%. In contrast,
treated firms’ ROA falls, albeit by an insignificant amount from 14.02% in the year before the
3
downgrade to 13.72% in the year after the downgrade. Overall, we obtain a difference-in-
differences estimator of -1.33%, and the differential effects are statistically significant at the
5% level.
These results suggest that despite being forced to forego profitable projects due a decline in
access to affordable debt funding following a sovereign downgrade, firms at the sovereign
bound are not heavily affected as they are able to adjust their business plans to prioritize on
important core projects. The finding is consistent with the rationale that credit ratings serve as
“coordination mechanisms” proposed by Boot, Milbourn, and Schmedits (2005) in which they
argue that a firm can always optimally choose a project that matches with the firm’s credit
rating. On the other hand, firms below the sovereign bound are able to capitalize from the
increased debt financing costs faced by the bound firms as a result of a sovereign downgrade
by altering their investment plans to take on projects that bound firms can no longer fund. This
is consistent with the finding of Almeida et al. (2017) in which bound firms are forced to reduce
corporate investments due to the increase in their cost of debt. Since the bound firms, which are
rated at or above the sovereign, are usually the leading firms with access to the best investment
projects in the country, the “investment slack” now strategically taken on by the non-bound
firms are expected to improve the operating performance for those non-bound firms.1
We establish that the differences in the operating performance of treated and control firms are
plausibly casued by the sovereign ceiling policy, and not affected by general macroeconomic
conditions or differences in firm fundamentals. To ensure it is not treated firms’ greater
sensitivity to economic downturns that is driving our results, we conduct placebos tests to check
whether there are significant differences in the operating performance of treated and control
1 The reduction in investment for treated firms can have a significant effect on the investment plans of all other
firms in the country. Treatment firms in our sample are responsible for 25% of the aggregate investments within a
country.
4
firms around recessions and the Global Financial Crisis. Indeed we do not find significant
differences in operating performance between the treated and control firms around these events.
To ensure that differences in firm fundamentals around a sovereign downgrade is not driving
our results, we run linear regressions and control for a variety of firm characteristics and firm
and year fixed effects. We find the regression estimates to be consistent with those reported in
our baseline difference-in-differences tests.
Next, we use cross-sectional tests to explore the channels through which sovereign ceilings
affect firm performance. First, we anticipate that non-bound firms may benefit the most when
bound firms experience financial difficulties in funding their projects, since it is in these
circumstances that non-bound firms are able to pick up the investment slack. Our test results
show that our findings regarding foregone investment opportunities are indeed concentrated in
firms which experienced the largest reduction in net debt issuance around a sovereign
downgrade. We also find that our results are stronger for firms that are affected the most by the
changes in capital requirements applied to banks and insurance companies which affects the
supply of debt capital to bound firms. Second, we expect our findings to be stronger in firms
that find it difficult to substitute debt with equity funding, as bound firms that can easily issue
equity would still be able to fund their projects with equity after experiencing an increase in the
cost of debt financing. Consistent with our expectations, we find that our results are driven by
smaller and opaque firms and firms in emerging markets, as these firms are likely to find it
harder to substitute debt with equity funding in external capital markets. Third, we find our
results to be driven by firms that experienced the largest decline in investment around the
sovereign downgrade. This again is consistent with our expectations since nonbound firms
would only be able to take on bound firms’ profitable projects once the bound firms forgo the
projects.
5
Lastly, we perform 2 robustness tests in which we re-examine the effect of sovereign ceilings
on firm performance after excluding firms that are systematically different. First, we exclude
firms from the utility sector as these firms are expected to have closer ties to the government
and hence may be more affected by the sovereign downgrades. Second, we exclude treatment
firms with a corporate credit rating that is higher than the sovereign. We continue to find a
significant differential effect on sovereign ceilings on firm performance that is similar in
magnitude as our baseline results even after excluding these firms.
This study makes three key contributions to the extant literature. First, it adds to the literature
strand that studies the impact that sovereign ceiling policies have on the real economy. Adelino
and Ferreira (2016) show that banks that are downgraded due to CRAs’ sovereign ceiling
policies reduces their lending supply, whereas Almeida et al. (2017) demonstrate that
corporates that are downgraded due to sovereign ceiling policies reduce their debt issuance and
investment due to the increasing cost of debt faced by those firms. In this study, we show that
the operating performance of the corporates that are downgraded are unaffected as they are able
to adjust their business plans to prioritize core projects, whereas the other firms in the
downgraded countries benefit by taking on the forgone projects of the high credit quality firms,
thus resulting in an improvement in resource allocation in the economy. We provide new
evidence on the spillover externalities created by sovereign downgrades.
Second, this study adds to the literature that studies the effects of corporate credit rating changes
on firm outcomes. The prior literature documents that rating changes have a significant impact
on firms’ cost of borrowing (Tang, 2009; Kisgen and Strahan, 2010), capital structure (Kisgen,
2006, Baghai, Servaes, and Tamayo, 2014), and investment and financing decisions (Sufi,
2009; Lemmon and Roberts, 2010; Harford and Uysal, 2014; Almeida et al., 2017). However,
to the best of our knowledge, no study has to date examined how these changes in investment

6
and financing policies due to corporate rating downgrades affect a firm’s operating
performance. In this paper, we are able to establish a causal link between corporate credit rating
changes and corporate operating performance by using the sovereign ceiling policy as an
exogenous shock to corporate credit ratings.
Third, we add to the literature on strategic incentive effects. Prior studies provide evidence that
firm value can be affected by the announcement of rival firms’ bankruptcy (Lang and Stulz,
1992), financial misrepresentation (Goldman, Peyer, and Stefanescu, 2012), dividend revisions
(Laux, Starks, and Yoon, 1998), and corporate investments (Chen, Ho, and Shih, 2007). In this
paper, we provide new evidence to show that a leading firm’s reduction in financing and
investment due to a rating downgrade benefits competitors in the country by enabling
competitors to take on the leading firm’s forgone projects. Our study contributes evidence on
the positive real benefits of the sovereign ceiling policy for improving market competition.
The rest of the paper is organized as follows. Section 2 reviews the related literature and
provides background of the sovereign ceiling policy. Section 3 describes the data and sample
selection. Section 4 presents the main results. Section 5 examines the channels through which
sovereign ceilings affect firm performance, and Section 6 concludes.
2. Related Literature and Institutional Background
In this section, we first review the related literature on how corporate credit rating changes
affect firm outcomes and then provide details on sovereign ceiling polices used by external
CRAs and how it helps to generate exogenous variations to corporate credit ratings.
2.1. Credit Ratings and Firm Outcomes
Widely regarded as one of the most important measures of the creditworthiness of debt issuers,
credit ratings play a critical role in financial markets. Prior literature shows that rating changes
7
affects the cost of debt for corporates. For example, Tang (2009) shows that firms that received
higher refined ratings by Moody’s experienced on average a 20 basis point drop in their
corporate bond yields, while Kisgen and Strahan (2010) show that firms that received a one-
notch higher rating from Dominion Bond Rating Service experienced on average a 39 basis
point reduction in their debt cost of capital. Studies have shown this change in cost of debt has
pushed managers to alter the capital structure of their firms. In a survey by Graham and Harvey
(2001), they find that 57.1% of the CFOs consider credit ratings to be important or very
important in choosing the appropriate amount of debt for their firm. Kisgen (2006) confirm the
survey findings by showing empirically that firms near a credit rating downgrade or upgrade
issue less debt relative to equity, and Baghai, Servaes, and Tamayo (2014) show that
downgraded firms issue less debt and hold more cash to cover their financing needs.
A number of studies have shown that the change to a firm’s cost of debt associated with rating
changes has implications for a firm’s real financing and investment decisions. For example,
Sufi (2009) finds that the introduction of bank loan ratings increases debt usage and investment,
while Harford and Uysal (2014) show that rated firms are more likely to undertake acquisitions
that nonrated firms. However, to the best of our knowledge, no study has examined how the
change in financing and investment policies due to rating changes affect the operating
performance of a firm and its industry peer firms. One possible reason for the lack of research
is the difficulty in establishing a causal relation between rating changes and operating
performance, as a firm’s operating performance is endogenously determined by changes in
firm’s fundamentals which often also causes the rating change. In this paper, we use sovereign
ceiling policies as an exogenous shock to corporate credit rating to examine the causal effect of
rating downgrades on a firm’s operating performance. Additionally, we also examine closely
how the rivals of the downgraded firms are affected.
8
2.2. Sovereign Ceiling Policies
Credit rating agencies assess the ability of governments and corporates to meet their financial
obligations, and provide this information to market participants. The three leading rating
agencies, Standard & Poor’s, Moody’s, and Fitch, provide issuers with credit ratings on debt
issued with different maturities and currency of denomination, and they usually do not assign
private issuers a rating that is higher than the ratings assigned on the sovereign bonds of the
country that the issuer is domiciled. This is known as the sovereign ceiling policy. Empirical
evidence shows that the sovereign ceiling policy is consistently implemented in practice. S&P
(2012) reports that only 113 private issuer ratings in the world exceed their sovereign rating,
and these are typically multinational corporates. Almeida et al. (2017) find that only 3.4% of
the firms in their global firm sample receive a rating higher than the sovereign.
Under the sovereign ceiling policy, firms which have higher or equal ratings compared to the
sovereign, so called bound firms, are expected to be downgraded as a result of a sovereign
downgrade.2 Most importantly, this type of forced corporate rating downgrade for the bound
firms are unlikely to be correlated with changes in firm fundamentals, allowing us to exploit
these special rating actions to examine the causal effect of corporate rating downgrade on firm
performance.
3. Data and Sample selection
In this section, we first describe our data sources, sample selection and matching methodology
and then present summary statistics and balance tests for our matched samples.
2 Almeida et al. (2017) find in their sample that 59% of bound firms are downgraded within one month after a
sovereign downgrade.
9
3.1. Data
We examine the impact of sovereign ceilings using a global sample of firms from 1990 to 2016.
Our data on firm fundamentals are obtained from Compustat Global. Financial markets data are
from Datastream. Sovereign and company ratings data are obtained from Bloomberg, Capital
IQ and Datastream. Ratings issued by S&P are used in our study as S&P have been shown to
be more proactive in making rating revisions and the rating revisions are less likely to be
anticipated by the market compared to the other rating agencies (Reisen and Maltzan, 1999;
Kaminsky and Schmukler, 2002). We exclude financial firms (SIC codes 6000-6999) from our
sample as these firms have different financial and investment policies. Firms operating in
countries with no sovereign credit ratings or have negative total asset values are also removed
from our sample. Our final sample comprises of 601,775 firm-year observations with 45,993
firms from 120 countries. Among them, a limited proportion of the companies have a credit
rating history (22,604 firm-year observations with 1,154 unique firms).3
3.2. Sample selection
In order to study the impact of sovereign ceilings on firm performance, we compare the change
in the performance of bound firms with the change in performance of matched unbounded firms
around a sovereign downgrade rating event. To ensure that bound firms are correctly matched
to similar unbound firms, we match each bound firm with a rated unbound firm from the same
country and year with the closest propensity score estimated with a probit model on pre-event
size, investment, tobin’s q, cash and leverage (See variable definitions provided in Table 1).4
3 We find that all 73 of Almedia et al’s (2017) treatment firms are also included in our dataset. 4 Similar to Almedia et al. (2017), our benchmark sample contains control firms that are not matched by
industry as it is difficult to find industry matches in smaller countries. We obtain similar results using a smaller
matched sample where control firms are also required to operate in the same Fama-French-49 industry as the
treatment firm. The construction details and results are discussed in detail in sections 3.3 and 4.1, respectively.
10
[Place Table 1 about here]
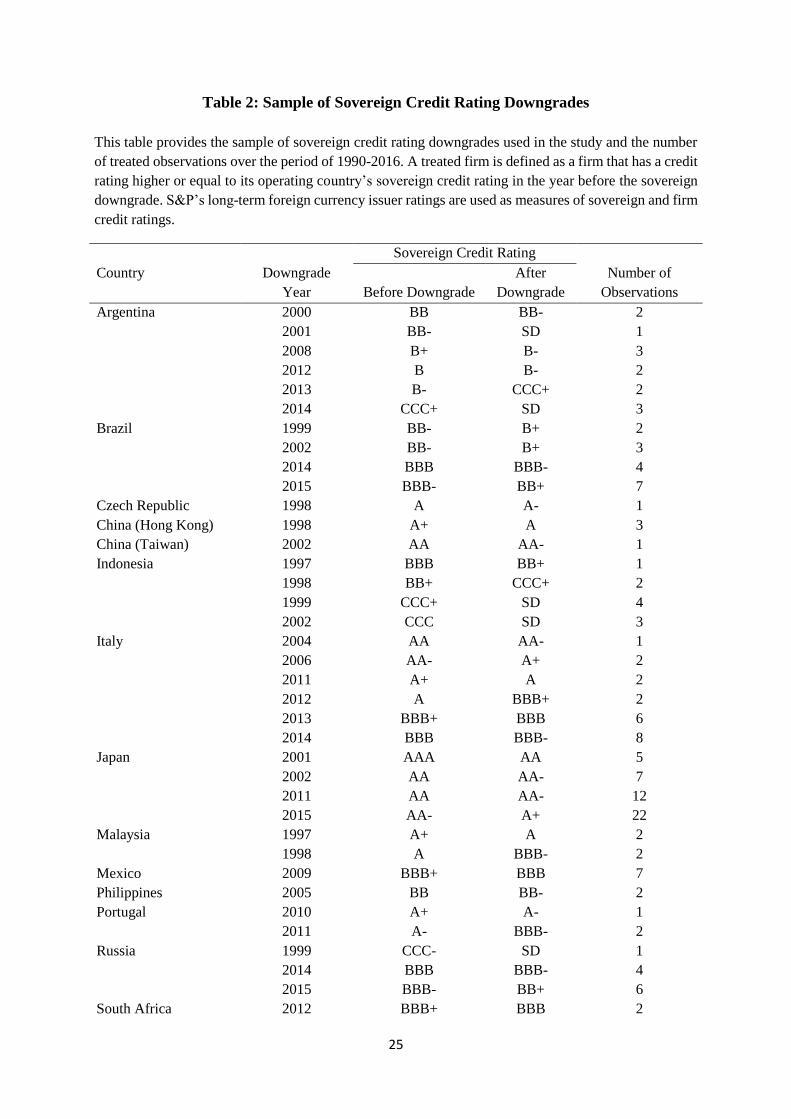
Table 2 provides our global sample of bound (treatment) firms and matched unbound firms
from 1990 to 2016. There are a total of 153 treatment firms and the same number of matched
control firms from 18 individual countries. Our sample contains firms from both emerging
markets (such as Argentina, Brazil) as well as developed markets (such as Japan and the United
States). Some of the countries in our sample experienced multiple sovereign rating downgrades
between 1990 and 2016. For example, Argentina and Italy had six downgrades, Brazil, Japan
and Indonesia had four downgrades, Russia had three, while Malaysia and South Africa had
two. The average sovereign downgrade is two notches while the median is one notch.5 There
are a total of 20 sovereign downgrades after 2007 (the start of the GFC), while there are also a
considerable number of downgrades prior to the GFC period.
[Place Table 2 about here]
3.3. Summary statistics
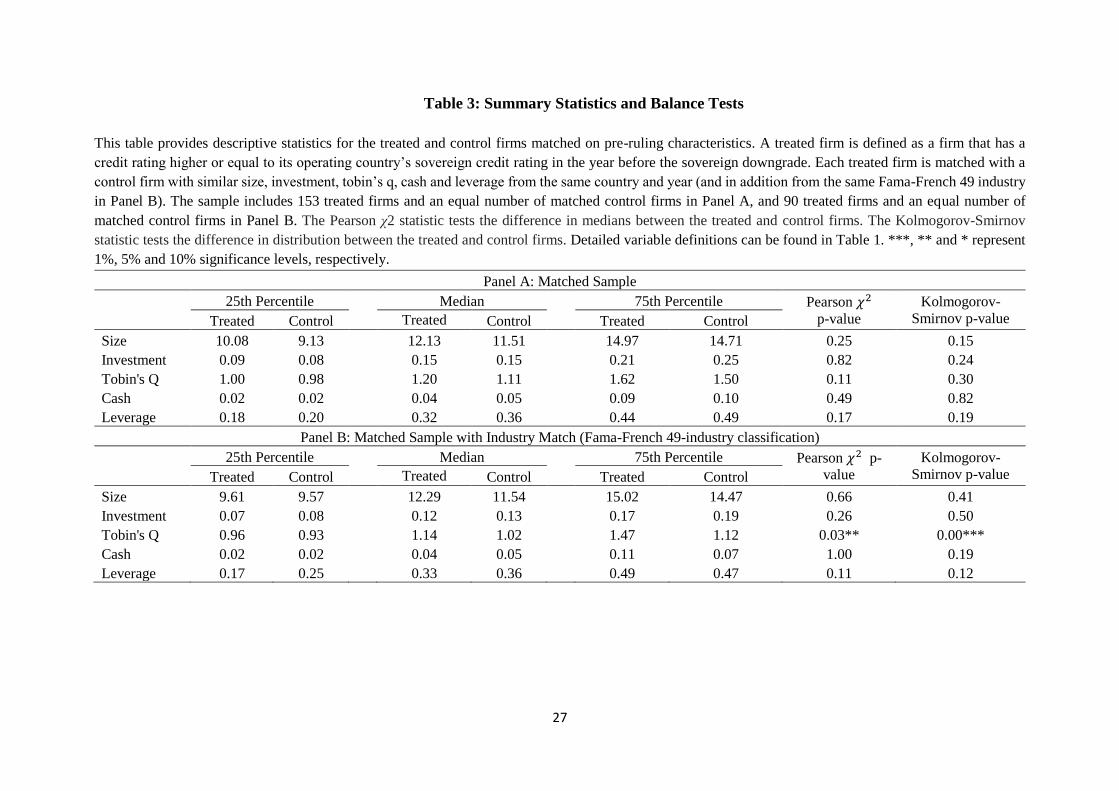
Panel A of Table 3 provides the summary statistics and presents balance tests of the matching
variables for our baseline matched firm sample. The Pearson χ2 test statistics show that there
are no significant differences in the median values of the matching variables between the
treatment and control group in the year before the sovereign downgrade, and the Kolmogorov-
Smirnov test statistics show that there are not significant differences in the distribution of the
matching variables between the treatment and control groups.
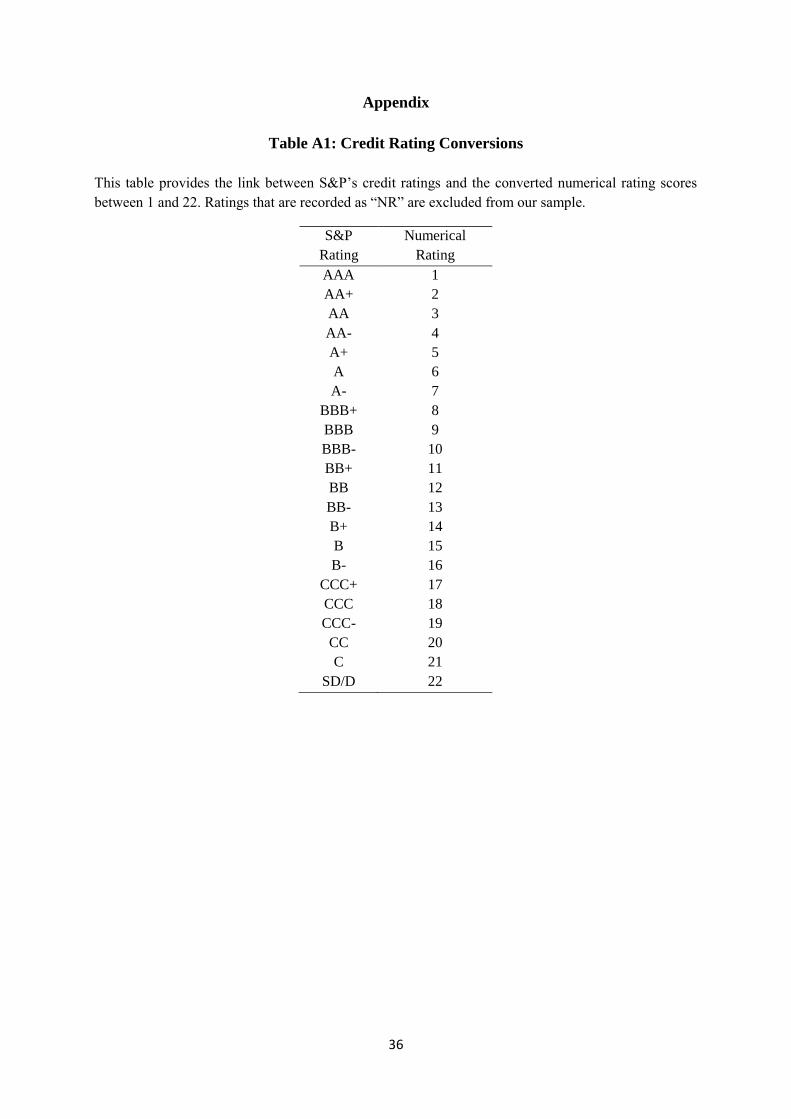
5 Consistent with Almedia et al. (2017), the credit ratings obtained are converted into numerical scores from 1—
22, with 1 representing a AAA rating and 22 representing default. Observations with ratings of “NR (Not rated)”
are excluded. The details of our conversions of credit ratings into numerical scores can be found in Table A1 in
the Appendix.

11
In addition to our baseline matched sample, we also use an alternative matched sample in which
control firms are also required to operate in the same Fama-French-49 industry as the treatment
firm. With this additional matching criterion, we end up with 92 treatment firms and matched
control firms. Panel B of Table 3 presents the summary statistics and balance tests of the
matching variables in this alternative matched sample. The test statistics show that there are no
significant differences in the medians and the distributions of the matching variables between
the treatment and control groups in the year before the sovereign downgrades, except for
Tobin’s Q, consistent with the sample used in Almeida et al. (2017).
[Place Table 3 about here]
4. Sovereign Ceilings and Firm Performance
In this section, we examine the impact of sovereign ceilings on firm performance. We first
present the baseline difference-in-differences test results. We also present placebo test results
to rule out that our findings are not driven by general macroeconomic conditions unrelated to
sovereign downgrades. Finally, we trace the dynamic effect of sovereign ceilings on firm
performance using linear regressions.
4.1. Difference-in-Differences Test Results
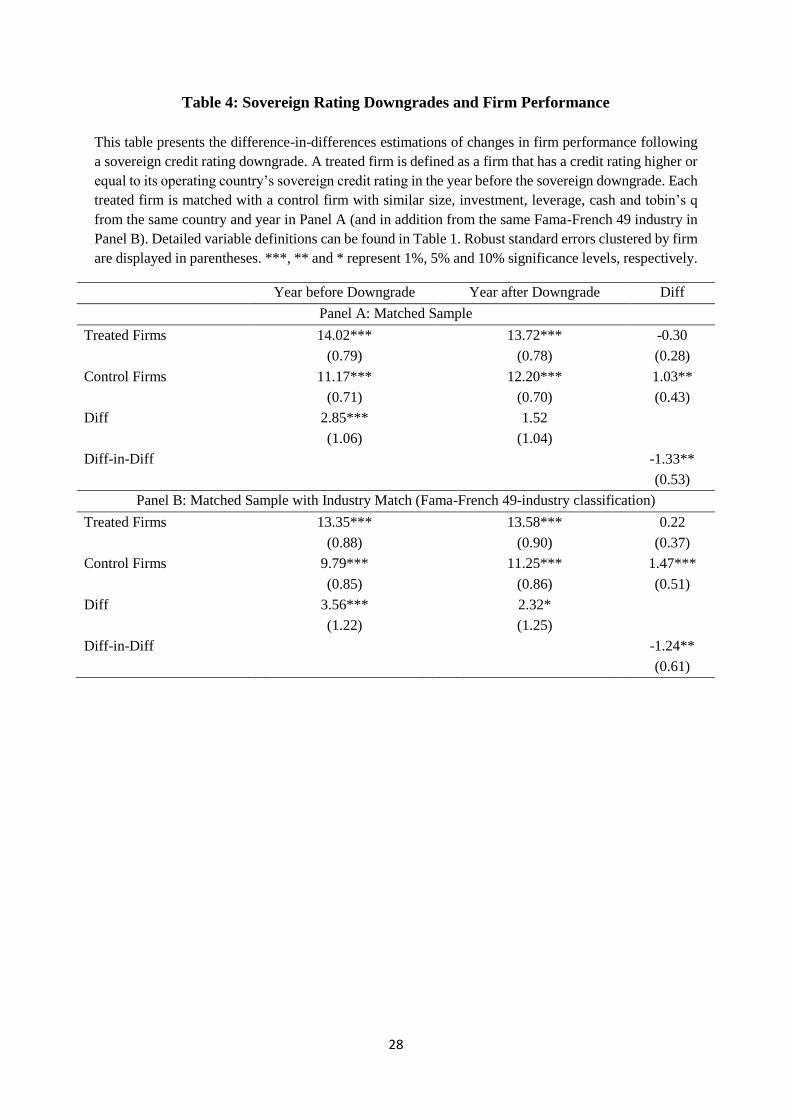
Panel A of Table 4 presents the difference-in-differences test results for firm performance
around sovereign downgrades. The change in performance of the treated firms (firms bounded
by the sovereign ceiling) is directly compared with the change in performance of the matched
control firms (nonbound firms). Standard errors are clustered by firm as a number of treatment
firms appear more than once in our sample since a number of countries have been downgraded
multiple times. We find that the performance of control firms improve relative to treated firms
after a sovereign rating downgrade. The performance enhancement is economically significant
12
with the ROA for the control firms significantly increasing by 1.03% from 11.17% to 12.20%.
In contrast, the ROA of treated firms decline slightly from 14.02% in the year before the
downgrade to 13.72% in the year after the downgrade, but the change in insignificant. Overall,
ROA increases by 1.33% more for control firms relative to treated firms, and the result is
statistically significant at the 5% level.
Panel B of Table 4 present difference-in-differences test results when our control firms are also
required to operate in the same Fama-French 49 industry as the treatment firms. We obtain
similar results using this alternative matched sample. Specifically, the test statistics show that
ROA increases by 1.24% more for control firms relative to treatment firms, and the result is
statistically significant at the 5% level.
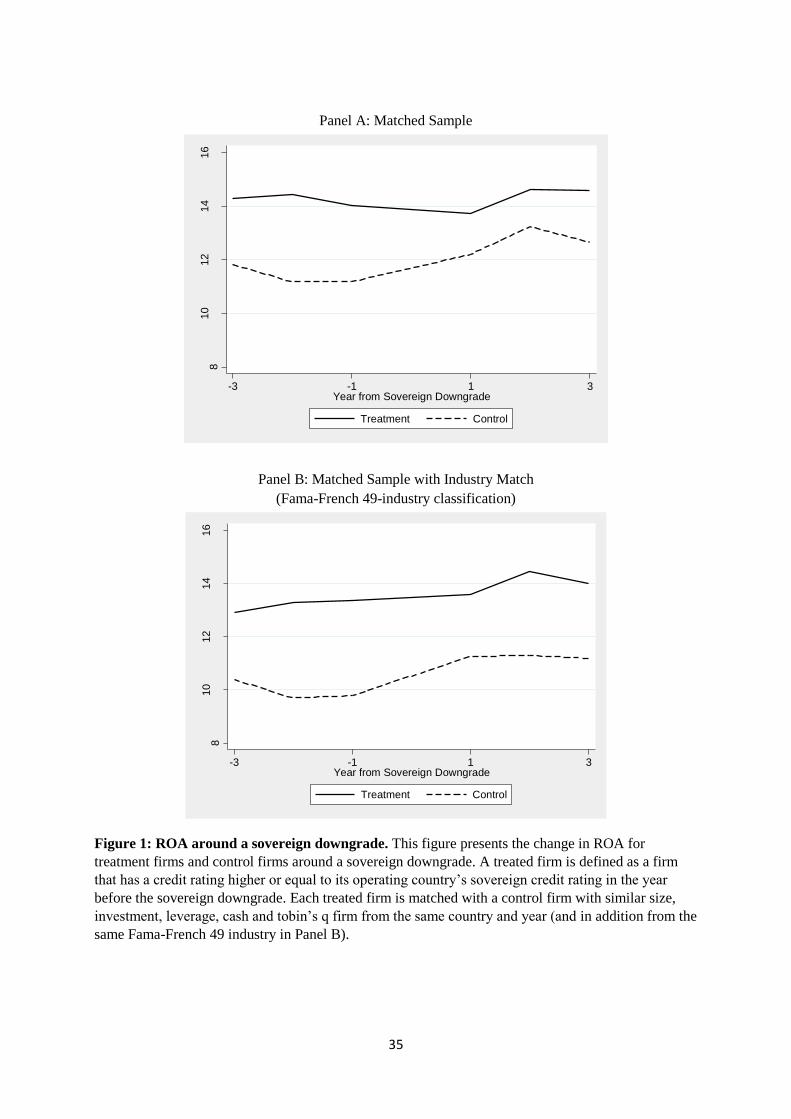
The success of the DID estimation rests on the parallel trend assumption that the ROA of the
treatment and control firms would have changed in a similar manner in the absence of the
sovereign downgrade event. We follow the standard practice in the literature to test this
assumption by looking at whether the trends in ROA are similar between treatment and control
firms before a sovereign downgrade. We plot the level of ROA for the treatment and control
groups from 3 years before a sovereign downgrade to 3 years after a sovereign downgrade in
Figure 1. The figure shows that the treatment and control firms show similar behavior in terms
of their ROA before a sovereign downgrade, indicating that the parallel trend assumption is
satisfied.
Overall, we interpret our results as follows. The performance of bound firms are not heavily
affected by the rating downgrades due to sovereign ceiling policies as they are able to adjust
their business plans to prioritize on core projects and are likely to maintain access to low cost
funding sources. The finding is consistent with the proposal by Boot, Milbourn, and Schmedits
(2005) in which they suggest that firms are able to optimally choose investment projects that
13
matches with the firm’s credit rating. Similarly, Harford and Uysal (2014) find empirically that
firms with less access to debt markets do not make worse investments compared to firms with
better access to debt markets. In contrast, our finding that nonbound firms are able to improve
their operating performance corroborates with Almeida et al. (2017). They find that bound firms
are forced to reduce investments due to the increase in their cost of debt after a sovereign
downgrade. Since the bound firms are usually leading firms in the country with access to the
best projects and are collectively responsible for 25% of the aggregate investments within a
country, the non-bound firms are likely to alter their investment plans to take on the profitable
unfunded projects of the bound firms to increase their own operating performance. The results
for our industry matched sample indicates that the competitors of the bound firms also benefit
heavily by taking on the profitable unfunded projects discarded by the bound firms.
4.2. Placebo Tests
Using a matched sample removes the systematic differences between the treatment and control
group, but one potential concern is that the differences in the changes in operating performance
of treated and control firms may not be due to the rating downgrade but rather to other
cofounding events that happened around the same time as the rating downgrades. For example,
the treatment group consists of firms of national significance and may be more sensitive to
economic downturns, which is when sovereign downgrades usually occur, and this factor may
be driving our results. In order to ensure that this alternative mechanism is not driving our
results, we conduct placebo tests to check whether there is a difference in the changes in
operating performance of treated and control firms around the Global Financial Crisis (GFC)
and recessions.
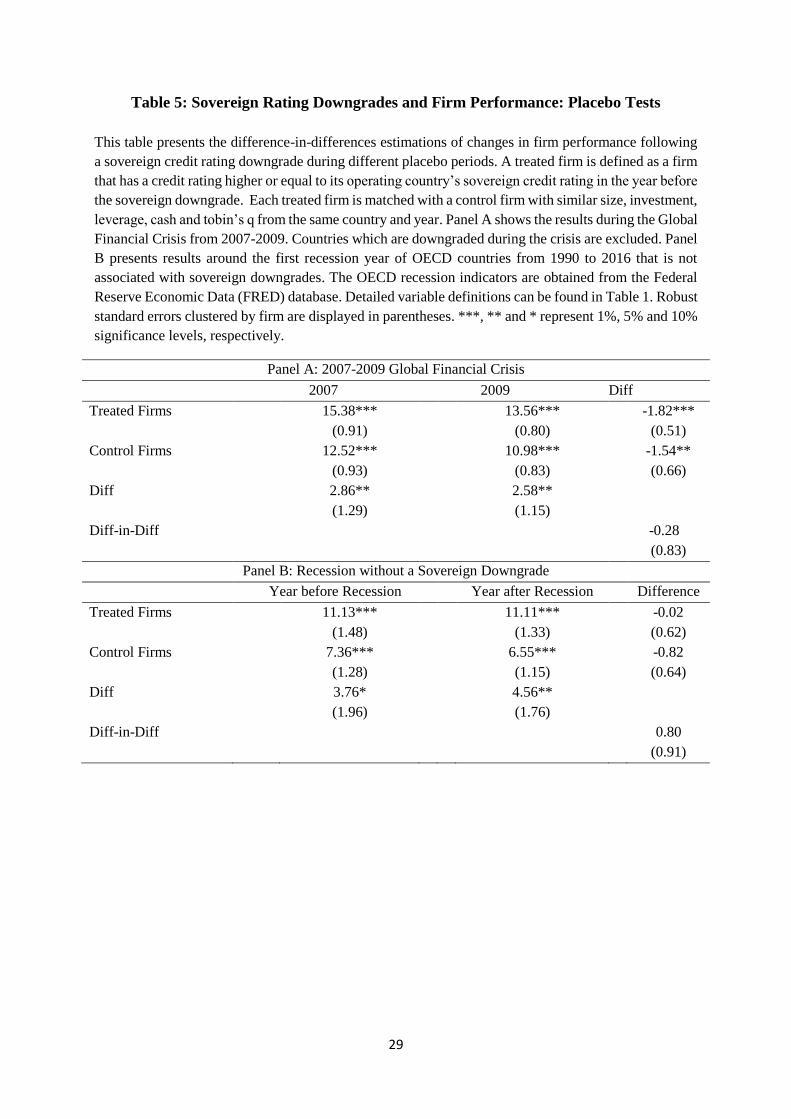
Panel A of Table 5 presents the results of the placebo test using the 2007 to 2009 GFC period.
We exclude firms in countries that experienced a downgrade during the GFC in this placebo
14
test. Our results show that the operating performance of both the treatment and control firms
significantly worsened after the GFC, but we do not find significant differences in the changes
in operating performance between the treatment and control firms. The DID estimator is -0.37
and is statistically insignificant.
Panel B of Table 5 provides the results of the placebo test using recession periods without a
sovereign downgrade. Following Almeida et al. (2017), we use recession indicators sourced
from the Organisation for Economic Co-operation and Development (OECD) for each country
from the Federal Reserve Economic Data (FRED) database to identify recession periods. For
each country we exclude recession years in which the country is downgraded. Our results again
show that there are no significant differences in the changes in operating performance between
the treatment and control firms around a recession. The DID estimator is 0.64 and is statistically
insignificant.
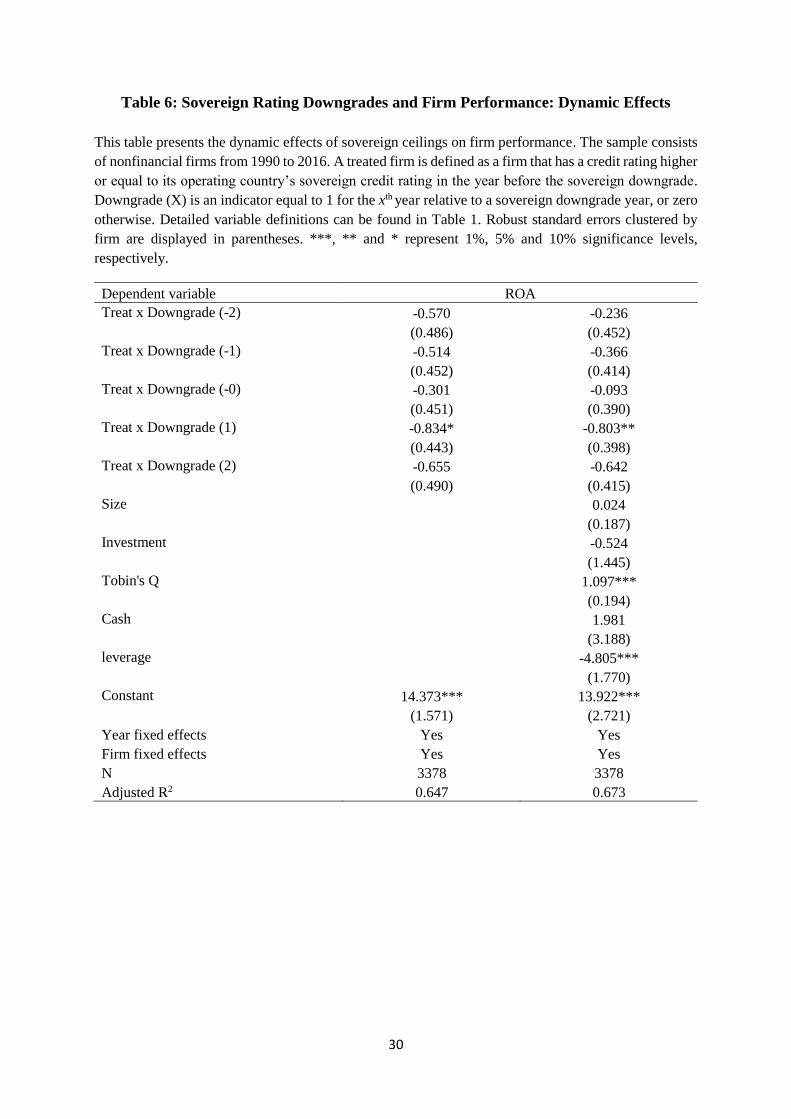
4.3. Dynamic Effects of Sovereign Ceilings on Firm Performance
To further validate a plausible causal relation between rating downgrades and firm
performance, we trace the dynamic effect of sovereign ceilings on firm performance using OLS
regressions. Specifically, we estimate the following model:
𝑅𝑂𝐴𝑖,𝑡 = 𝛼 + 𝛽(1)𝑇𝑟𝑒𝑎𝑡𝑖 + 𝛽(2)𝑇𝑟𝑒𝑎𝑡𝑖 ∗ 𝐷𝑜𝑤𝑛𝑔𝑟𝑎𝑑𝑒 (−2) + 𝛽(3)𝑇𝑟𝑒𝑎𝑡𝑖 ∗ 𝐷𝑜𝑤𝑛𝑔𝑟𝑎𝑑𝑒 (−1) +
𝛽(4)𝑇𝑟𝑒𝑎𝑡𝑖 ∗ 𝐷𝑜𝑤𝑛𝑔𝑟𝑎𝑑𝑒 (0) + 𝛽(5)𝑇𝑟𝑒𝑎𝑡𝑖 ∗ 𝐷𝑜𝑤𝑛𝑔𝑟𝑎𝑑𝑒 (1) + 𝛽(6)𝑇𝑟𝑒𝑎𝑡𝑖 ∗ 𝐷𝑜𝑤𝑛𝑔𝑟𝑎𝑑𝑒 (2) +
𝛾𝑍𝑖,𝑡 + 𝑌𝑒𝑎𝑟𝑡 + 𝐹𝑖𝑟𝑚𝑖 + 𝜀𝑖,𝑡
(1)
where t denotes year and i donates firm. Treat is an indicator variable that equals to 1 for
treatment firms, and 0 for control firms. Downgrade (X) indicates the Xth year with respect to
the sovereign downgrade year. 𝑍𝑖,𝑡 is a vector of firm characteristics (our matching covariates)
15
that are likely to affect a firm’s operating performance. 𝑌𝑒𝑎𝑟𝑡 and 𝐹𝑖𝑟𝑚𝑖 capture year and firm
fixed effects respectively. Standard errors are clustered at the firm level. Our coefficient of
interest is 𝛽(5).
Examining the dynamic effects can help us to better understand the timing of the impact of
rating downgrades. First, we are able to further check whether there is a difference in the pre-
event performance between treated and control firms to ensure that the parallel trend
assumption is satisfied. Second, we pinpoint when the effect of sovereign ceilings on firm
performance actually materialize. Third, we are able to control for firm characteristics and year
and firm fixed effects in our regression models to ensure that changes in firm fundamentals
coinciding with changes in sovereign credit ratings are not driving our results.
[Place Table 6 about here]
Table 6 shows the results. First, we find that there are no significant differences in operating
performance between the treatment and control firms, which is consistent with Figure 1
validating that the parallel trend assumption is satisfied. Second, we find that only the
coefficient of Treat*Downgrade (-1) is negative and significant, which provides further
validation of the causal effect of sovereign ceilings on firm performance. Moreover, the
magnitudes reported in the linear regressions (𝛽(4) + 𝛽(5)) are similar to those reported in our
baseline DID results.
5. Channels through which Sovereign Ceilings affect Firm Performance
Our results so far show that the operating performance of firms below the sovereign bound
improve relative to firms at the sovereign bound. These results suggest that non-bound firms
are able to capitalize from the increased debt financing costs of the bound firms by altering their
investment plans to take on the profitable projects that bound firms can no longer fund. In this
16
section, we conduct cross-sectional tests to further examine in detail the financing and
investment channels that drive our results, and also conduct further robustness tests.
5.1. Reduction in External Financing and Investment
It is well documented in the literature that rating downgrades increases bond yield spreads,
which subsequently forces managers to issue less debt and cut back on corporate investment
(Kisgen, 2006; Lemmon and Roberts, 2010; Baghai, Servaes, and Tamayo, 2014). Using the
same empirical setup as ours, Almeida et al. (2017) find that bound firms are forced to reduce
investment due to the reduced access to debt funding after a sovereign downgrade. Following
this line of thought, we should expect our results to be driven by firms that reduced their level
of net debt issuance due to the sovereign ceiling policy, since the bound firms that faced a
reduction in debt funding are likely to be forced to scale back their investment plans allowing
other firms to potentially access more debt financing and take on the profitable projects
discarded by bound firms. The reduction in debt funding for bound firms can have a significant
effect on the supply of debt financing to other firms as the total debt of bound firms represent
11% of the total debt for all firms within a country.
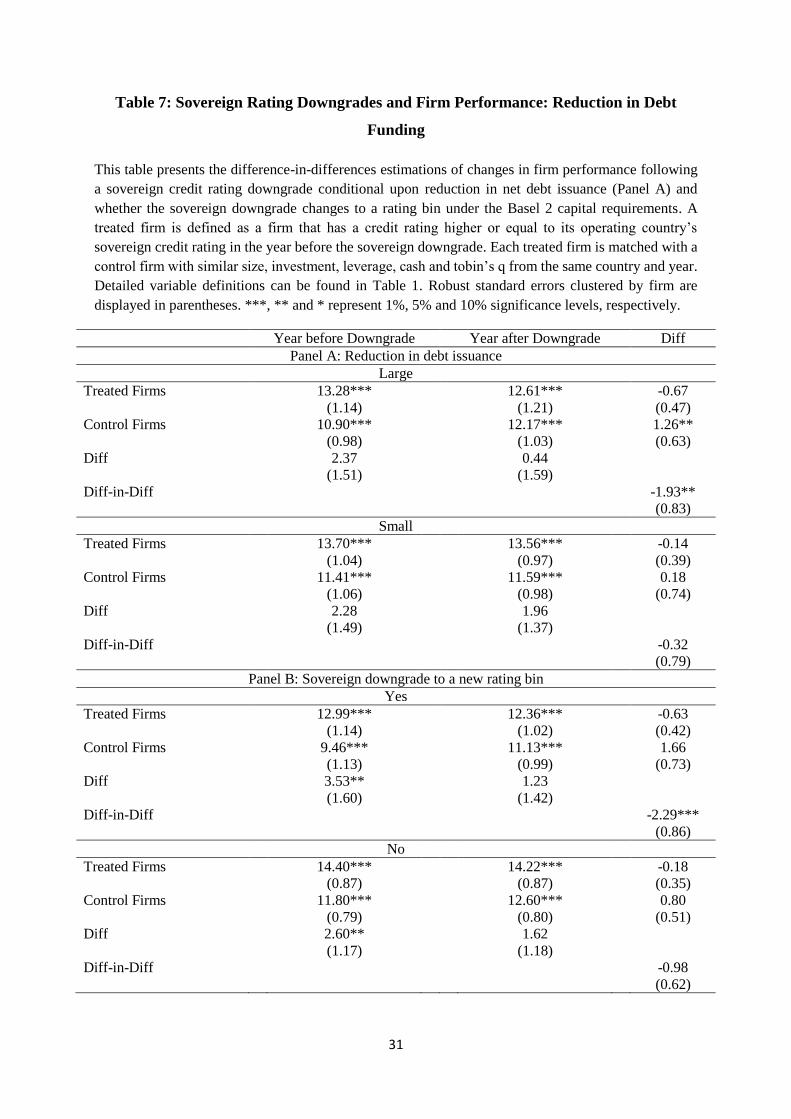
To test this hypothesis, we first split our sample of firms at the median according to their change
in the level of net debt issuance around the sovereign downgrade (from year t-1 to year t).6
Panel A of Table 7 shows the results. Consistent with our predictions, we find that our results
are driven by the sample of firms which experienced the largest decline in the level of net debt
issuance around the sovereign downgrade. The DID estimator is -1.95 and statistically
significant at the 5% level for this subsample of firms.
6 Almedia et al. (2017) find that bound firms reduce net debt issuance more than nonbound firms from year t-1 to
year t.
17
[Place Table 7 about here]
We then examine whether rating based regulations help to explain our results. Under Basel II
and III, changes in credit ratings affect the capital requirements applied to banks and insurance
companies’ assets. Specifically, different risk weights are applied to different rating bins; AAA
to AA- (0%), A+ to A- (20%), BBB+ to BBB- (50%), BB+ to B- (100%), and below B- (150%).
Almeida et al. (2017) find that due to the risk weight requirements, the reduction in capital
supply to bound firms is larger when the sovereign downgrade results in a change in the rating
bin that increases the regulatory costs of creditors. Consistent with their findings, we expect
that a sovereign downgrade that results in a change in the rating bin would reduce the level of
debt funding more for the bound firms, which would the allow unbound firms in the country to
take on the unfunded profitable projects of the bound firms. Panel B of Table 7 shows the
results. There are 41 sovereign downgrades that resulted in a change in rating bins. We find that
our results are indeed concentrated in the subsample where the sovereign downgrade resulted
in a change in rating bin. The DID estimator is -2.29 and statistically significant at the 1% level
for this subsample of firms.
So far we have showed that the reduction in debt funding for bound firms is driving our results.
However, this mechanism should only apply to bound firms that find it difficult to substitute
debt funding with equity funding, as bound firms that have access to equity financing should
still be able to fund all the positive NPV projects with equity financing. Specifically, Almeida
et al. (2017) showed that bound firms reduce debt issuance and increase equity issuance after a
sovereign downgrade. Hence, we should expect our results to be concentrated in the subsample
of firms that have limited ability to substitute debt financing with equity financing.
[Place Table 8 about here]

18
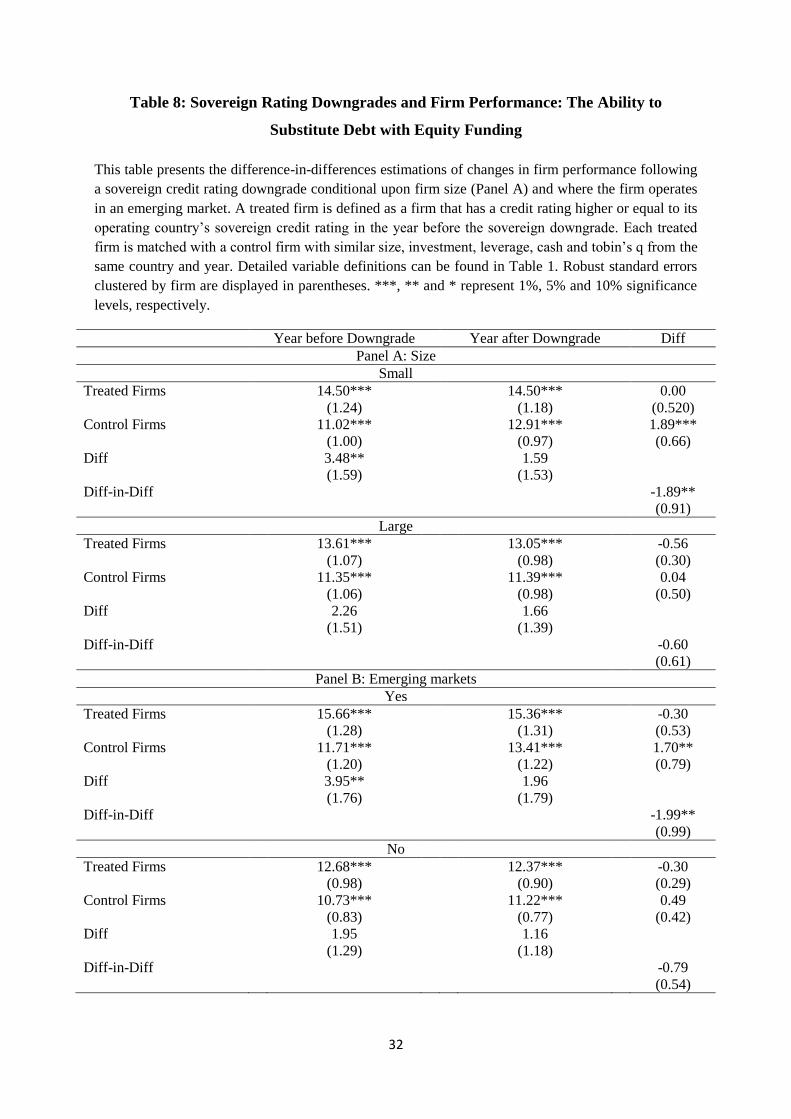
We use firm size and whether a firm operates in an emerging market as proxies for a firm’s
access to equity financing. The emerging market status for our sample countries are sourced
from the International Monetary Fund (2017). We expect our results to be concentrated in
smaller firms and firms that operate in emerging markets since these types of firms would find
it harder to substitute debt financing with equity financing after a sovereign downgrade. Table
8 shows that our findings are indeed concentrated in smaller firms and firms that operate in
emerging markets.
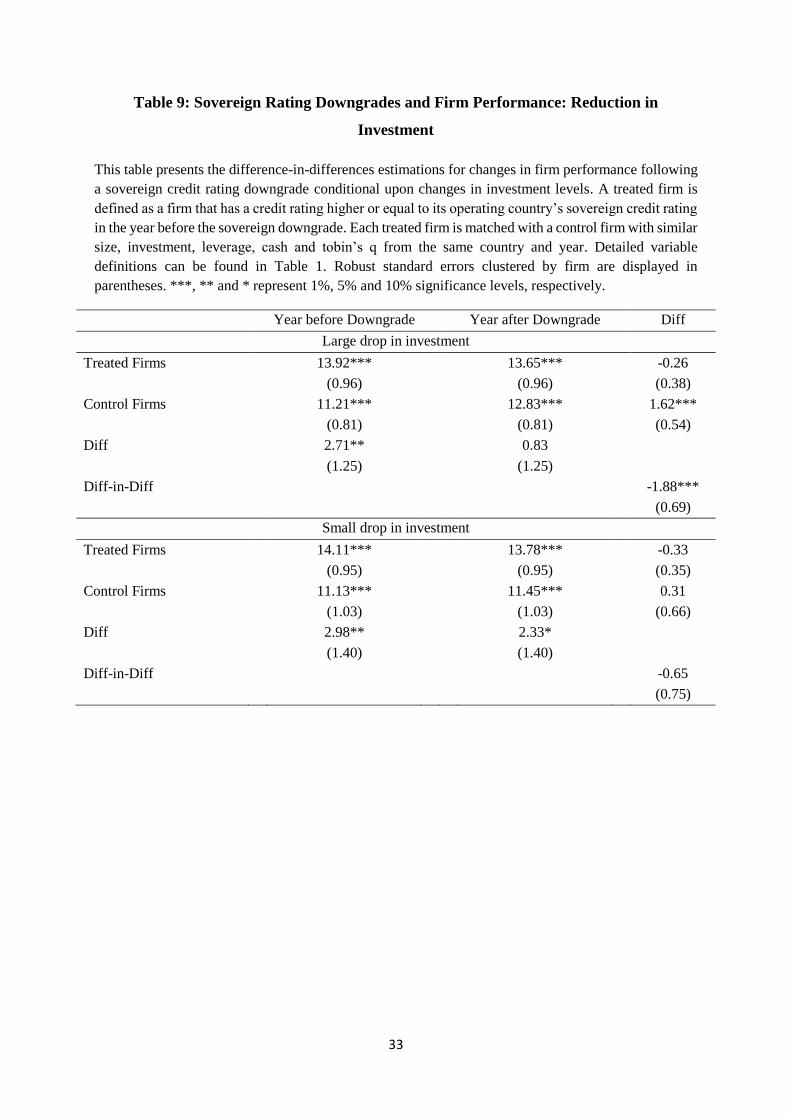
We next directly test whether our findings are driven by the reduction in investment of the
bound firms after a sovereign downgrade. We expect our results to be concentrated in the
subsample of bound firms that experienced the largest cut in investment around a sovereign
downgrade, as unbound firms in the country will most likely take on the profitable projects
from these firms.
[Place Table 9 about here]
We split the firms at the median according to their change in the level of investment around the
sovereign downgrade (from year t-1 to year t). Table 9 shows the results. Consistent with our
predictions, we find that our findings are concentrated in firms which experienced the largest
decline in the investment around the sovereign downgrade. The DID estimator is -1.88 and
statistically significant at the 1% level for this subsample of firms.
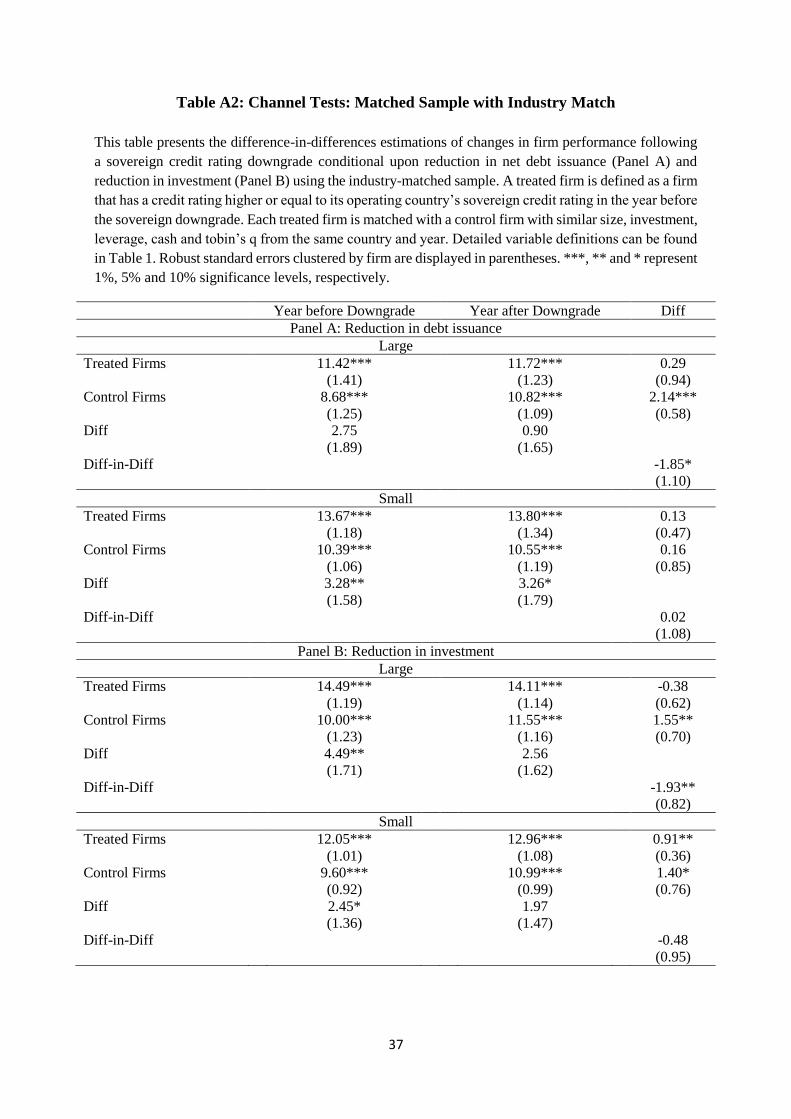
Results based on our benchmark matched sample suggest that treatment firms are responsible
for a large proportion of the debt issuance and investment in a country, and hence a reduction
in debt issuance and investment for the treatment firms import a significant effect on the
financing and investment policies of all other firms in a country even in other industries.
However, we expect the same mechanism to also hold for our industry matched sample, as
competitors of the bound firms are most likely to alter their financing and investment policies
19
to take on the profitable projects that bound firms can no longer fund. Table A2 in the appendix
shows the results of the channel tests using the industry matched sample. We find that, similar
to the results reported using our benchmark matched sample, our main findings remain
concentrated in the subsample of industry-matching firms with the largest reduction in net debt
issuance and investment after a sovereign downgrade.
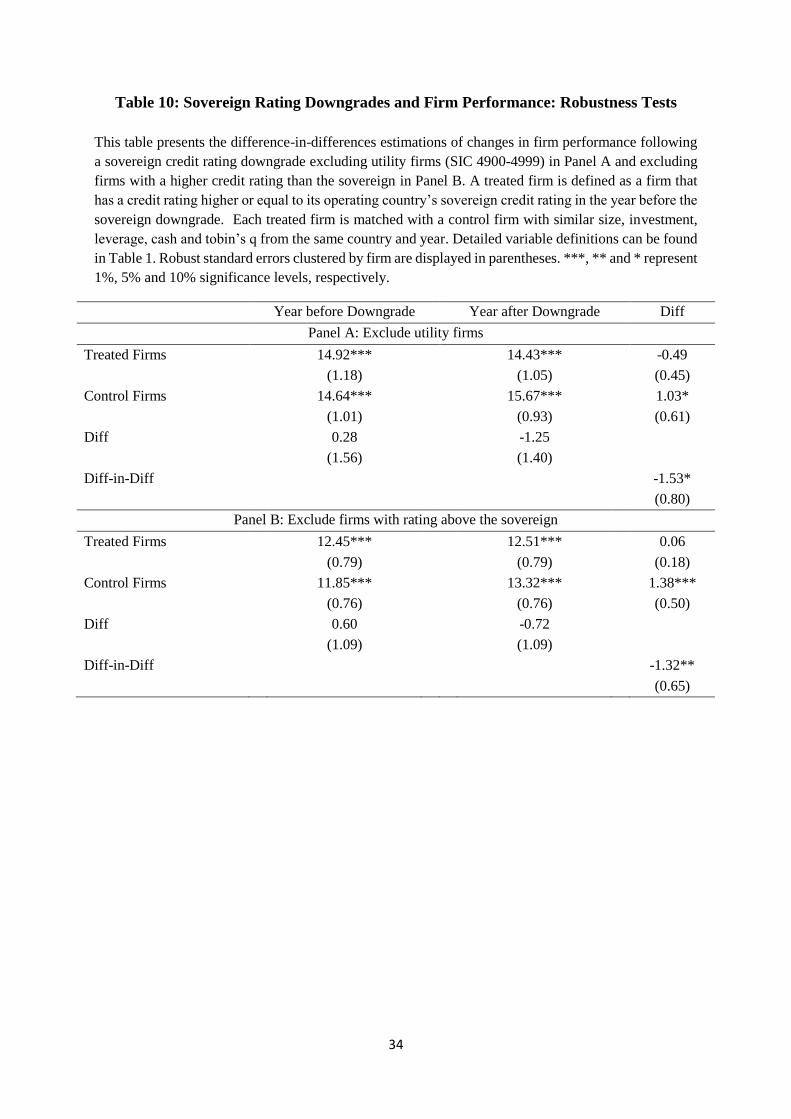
5.2. Robustness Tests
A possible concern regarding our results is that they may be driven by firms of national
significance. We conduct two further robustness tests to re-examine the effect of the sovereign
ceiling on firm performance after excluding special categories of firms.
Our first concern is that some of the treatment firms may be more sensitive to a sovereign
downgrade. For example, utility firms often have close political ties to the government and the
level of support received from the government may be reduced after a sovereign downgrade,
which would subsequently reduce the investment levels of these utility firms (Almeida et al.,
2017; Andrade and Chhaochharia, 2018). To rule out this alternative explanation, we repeat our
tests after excluding utility firms (SIC 4900-4999) from our treatment group (81 firms). Panel
A of Table 10 shows the results. Our results continue to hold and the magnitudes of the DID
estimator is stronger than that reported in our baseline tests (-1.53).
[Place Table 10 about here]
The second concern is that some of the treatment firms may not be bounded by the sovereign
ceiling policy. Specifically, some treatment firms may have a credit rating that is higher than
its sovereign. To ensure that our results are not driven by these firms, we repeat our tests after
excluding these firms from our treatment group (38 firms). Panel B of Table 10 shows that our
20
results remain robust to the exclusion of these firms and and the magnitudes of the DID
estimator is similar to those reported in our baseline test.
6. Conclusions
This study examines the effect of sovereign credit rating downgrades on firm performance
through the sovereign ceiling channel. Rating agencies’ sovereign ceiling policies require
firms’ ratings to remain at or below the rating of their country of domicile. Using a difference-
in-differences approach, we find that the performance of unbound firms improve relative to
firms at the bound after a sovereign rating downgrade. The finding suggests that the unbound
firms are able to capitalize from the increased debt financing costs of the bound firms by taking
on profitable projects that bound firms can no longer fund. Since the bound firms, which are
rated at or above the sovereign, are usually leading firms with access to the best projects in the
country, the unfunded projects now taken on by the unbound firms are expected to improve the
operating performance of their firms. We then use cross-sectional tests to explore the channels
through which sovereign ceilings affect firm performance. We expect our results to be driven
by firms with the largest reduction in debt funding and investments after a sovereign
downgrade, and we find empirical validation for both channels.
Overall, our findings show that the sovereign ceiling policies implemented by rating agencies
have significant effects on the operating performance of firms across the economy, effectively
creating a levelling of playing fields for “normal” firms to compete with the “leading” firms in
their country. Future research in this area should focus on whether sovereign ceilings affect
other types of corporate policies, such as changes in managerial compensation structure to
incentivize managers of the downgraded firms or the use of earnings managements to hide the
adverse effects brought by the sovereign downgrades.
21
References
Adelino, M., and Ferreira, M., 2016. Bank ratings and lending supply: Evidence from sovereign
downgrades. Review of Financial Studies 29, 1709–1746.
Almeida, H., Cunha, I., Ferreira, M., Restrepo, F., 2017. The real effects of credit ratings: The
sovereign ceiling channel. Journal of Finance 72, 249–290.
Andrade, S., Chhaochharia, V., 2018. The costs of sovereign default: Evidence from the stock
market. Review of Financial Studies, Forthcoming.
Baghai, R., Servaes, H., Tamayo, A., 2014. Have rating agencies become more conservative?
Implications for capital structure and debt pricing. Journal of Finance 69, 1961–2005.
Boot, A., Milbourn, T., Schmedits, A., 2006. Credit ratings as coordination mechanisms.
Review of Financial Studies 19, 81–118.
Borensztein, E., Cowan, K., Valenzuela, P., 2013. Sovereign ceilings “lite”? The impact of
sovereign ratings on corporate ratings. Journal of Banking and Finance 37, 4014–4024.
Chen, S., Ho, L., Shih, Y., 2007. Intra‐industry effects of corporate capital investment
announcements. Financial Management 36, 1–21.
Ferreira, M., Gama, P., 2007. Does sovereign debt ratings news spill over to international stock
markets? Journal of Banking and Finance 31, 3162–3182.
Goldman, E., Peyer, U., Stefanescu, I., 2012. Financial misrepresentation and its impact on
rivals. Financial Management 41, 915–945.
Graham, J., Harvey, C., 2001. The theory and practice of corporate finance: Evidence from the
field. Journal of Financial Economics 60, 187–243.
22
Harford, J., Uysal, V., 2014. Bond market access and investment. Journal of Financial
Economics 112, 147–163.
International Monetary Fund., 2017. World economic outlook. October.
Kaminsky, G., Schmukler, S., 2002. Emerging market instability: Do sovereign ratings affect
country risk and stock returns? World Bank Economic Review 16, 171–195.
Kisgen, D., 2006. Credit ratings and capital structure. Journal of Finance 61, 1035–1072.
Kisgen, D, Strahan, P., 2010. Do regulations based on credit ratings affect a firm's cost of
capital? Review of Financial Studies 23, 4324–4347.
Lang, L., Stulz, R., 1992. Contagion and competitive intra-industry effects of bankruptcy
announcements: An empirical analysis. Journal of Financial Economics 32, 45–60.
Laux, P., Starks, L., Yoon, P., 1998. The relative importance of competition and contagion in
intra-industry information transfers: An investigation of dividend announcements. Financial
Management, 5–16.
Lemmon, M., Roberts, M., 2010. The response of corporate financing and investment to
changes in the supply of credit. Journal of Financial and Quantitative Analysis 45, 555–587.
New York Times, 2011. S. & P. downgrades debt rating of U.S. for the first time. August 5.
Reisen, H., Maltzan, J., 1999. Boom and bust and sovereign ratings. International Finance 2,
273–293.
Reuters, 2015. Russian firms, banks shrink as they face fresh peak debt payment. August 11.
Standard and Poor’s Rating Services, 2012. Corporate and government ratings that exceed the
sovereign rating. October.
23
Sufi, A., 2009. The real effects of debt certification: Evidence from the introduction of bank
loan ratings. Review of Financial Studies 22, 1659–1691.
Tang, T., 2009. Information asymmetry and firms’ credit market access: Evidence from
Moody's credit rating format refinement. Journal of Financial Economics 93, 325–351.
24
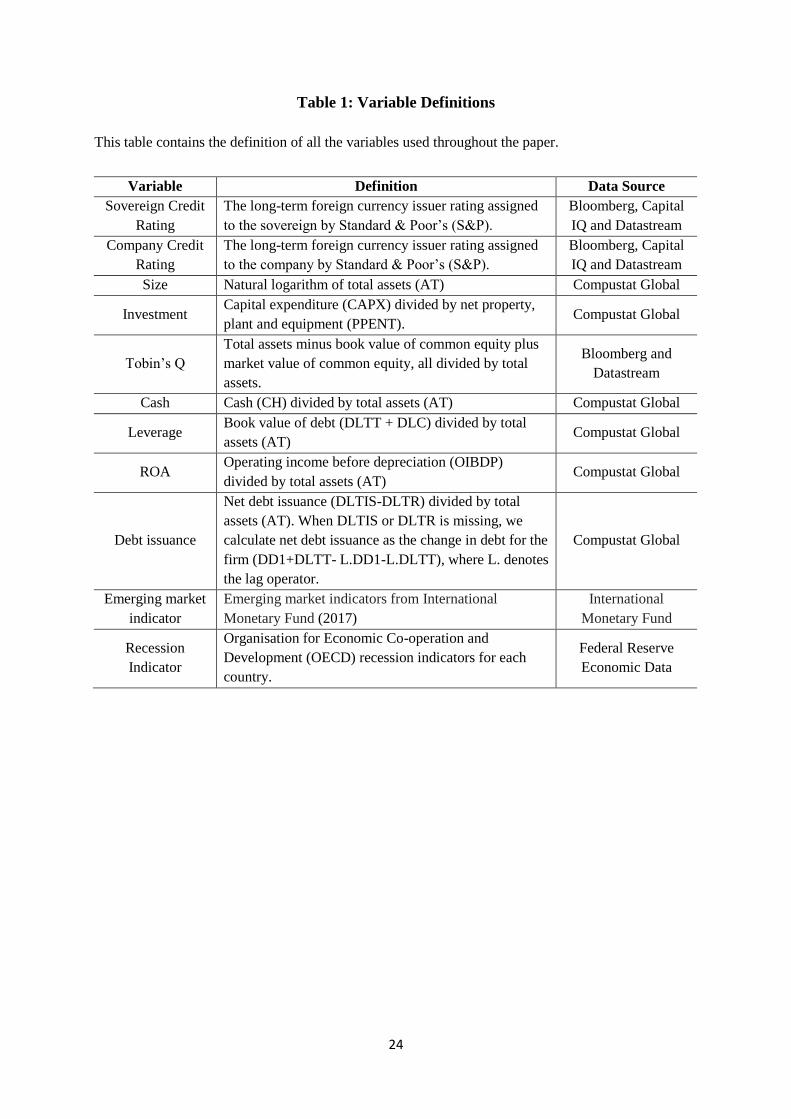
Table 1: Variable Definitions
This table contains the definition of all the variables used throughout the paper.
Variable Definition Data Source
Sovereign Credit
Rating
The long-term foreign currency issuer rating assigned
to the sovereign by Standard & Poor’s (S&P).
Bloomberg, Capital
IQ and Datastream
Company Credit
Rating
The long-term foreign currency issuer rating assigned
to the company by Standard & Poor’s (S&P).
Bloomberg, Capital
IQ and Datastream
Size Natural logarithm of total assets (AT) Compustat Global
Investment Capital expenditure (CAPX) divided by net property,
plant and equipment (PPENT). Compustat Global
Tobin’s Q
Total assets minus book value of common equity plus
market value of common equity, all divided by total
assets.
Bloomberg and
Datastream
Cash Cash (CH) divided by total assets (AT) Compustat Global
Leverage Book value of debt (DLTT + DLC) divided by total
assets (AT) Compustat Global
ROA Operating income before depreciation (OIBDP)
divided by total assets (AT) Compustat Global
Debt issuance
Net debt issuance (DLTIS-DLTR) divided by total
assets (AT). When DLTIS or DLTR is missing, we
calculate net debt issuance as the change in debt for the
firm (DD1+DLTT- L.DD1-L.DLTT), where L. denotes
the lag operator.
Compustat Global
Emerging market
indicator
Emerging market indicators from International
Monetary Fund (2017)
International
Monetary Fund
Recession
Indicator
Organisation for Economic Co-operation and
Development (OECD) recession indicators for each
country.
Federal Reserve
Economic Data
25
Table 2: Sample of Sovereign Credit Rating Downgrades
This table provides the sample of sovereign credit rating downgrades used in the study and the number
of treated observations over the period of 1990-2016. A treated firm is defined as a firm that has a credit
rating higher or equal to its operating country’s sovereign credit rating in the year before the sovereign
downgrade. S&P’s long-term foreign currency issuer ratings are used as measures of sovereign and firm
credit ratings.
Sovereign Credit Rating
Country Downgrade
Year Before Downgrade
After
Downgrade
Number of
Observations
Argentina 2000 BB BB- 2
2001 BB- SD 1
2008 B+ B- 3
2012 B B- 2
2013 B- CCC+ 2
2014 CCC+ SD 3
Brazil 1999 BB- B+ 2
2002 BB- B+ 3
2014 BBB BBB- 4
2015 BBB- BB+ 7
Czech Republic 1998 A A- 1
China (Hong Kong) 1998 A+ A 3
China (Taiwan) 2002 AA AA- 1
Indonesia 1997 BBB BB+ 1
1998 BB+ CCC+ 2
1999 CCC+ SD 4
2002 CCC SD 3
Italy 2004 AA AA- 1
2006 AA- A+ 2
2011 A+ A 2
2012 A BBB+ 2
2013 BBB+ BBB 6
2014 BBB BBB- 8
Japan 2001 AAA AA 5
2002 AA AA- 7
2011 AA AA- 12
2015 AA- A+ 22
Malaysia 1997 A+ A 2
1998 A BBB- 2
Mexico 2009 BBB+ BBB 7
Philippines 2005 BB BB- 2
Portugal 2010 A+ A- 1
2011 A- BBB- 2
Russia 1999 CCC- SD 1
2014 BBB BBB- 4
2015 BBB- BB+ 6
South Africa 2012 BBB+ BBB 2

26
2014 BBB BBB- 2
South Korea 1997 AA- B+ 4
Spain 2012 AA- BBB- 1
Thailand 1998 BBB BBB- 1
Turkey 2001 B+ B- 1
United States 2011 AAA AA+ 4
Total 153
27
Table 3: Summary Statistics and Balance Tests
This table provides descriptive statistics for the treated and control firms matched on pre-ruling characteristics. A treated firm is defined as a firm that has a
credit rating higher or equal to its operating country’s sovereign credit rating in the year before the sovereign downgrade. Each treated firm is matched with a
control firm with similar size, investment, tobin’s q, cash and leverage from the same country and year (and in addition from the same Fama-French 49 industry
in Panel B). The sample includes 153 treated firms and an equal number of matched control firms in Panel A, and 90 treated firms and an equal number of
matched control firms in Panel B. The Pearson χ2 statistic tests the difference in medians between the treated and control firms. The Kolmogorov-Smirnov
statistic tests the difference in distribution between the treated and control firms. Detailed variable definitions can be found in Table 1. ***, ** and * represent
1%, 5% and 10% significance levels, respectively.
Panel A: Matched Sample
25th Percentile Median 75th Percentile Pearson 𝜒2
p-value
Kolmogorov-
Smirnov p-value Treated Control Treated Control Treated Control
Size 10.08 9.13 12.13 11.51 14.97 14.71 0.25 0.15
Investment 0.09 0.08 0.15 0.15 0.21 0.25 0.82 0.24
Tobin's Q 1.00 0.98 1.20 1.11 1.62 1.50 0.11 0.30
Cash 0.02 0.02 0.04 0.05 0.09 0.10 0.49 0.82
Leverage 0.18 0.20 0.32 0.36 0.44 0.49 0.17 0.19
Panel B: Matched Sample with Industry Match (Fama-French 49-industry classification)
25th Percentile Median 75th Percentile Pearson 𝜒2 p-
value
Kolmogorov-
Smirnov p-value Treated Control Treated Control Treated Control
Size 9.61 9.57 12.29 11.54 15.02 14.47 0.66 0.41
Investment 0.07 0.08 0.12 0.13 0.17 0.19 0.26 0.50
Tobin's Q 0.96 0.93 1.14 1.02 1.47 1.12 0.03** 0.00***
Cash 0.02 0.02 0.04 0.05 0.11 0.07 1.00 0.19
Leverage 0.17 0.25 0.33 0.36 0.49 0.47 0.11 0.12
28
Table 4: Sovereign Rating Downgrades and Firm Performance
This table presents the difference-in-differences estimations of changes in firm performance following
a sovereign credit rating downgrade. A treated firm is defined as a firm that has a credit rating higher or
equal to its operating country’s sovereign credit rating in the year before the sovereign downgrade. Each
treated firm is matched with a control firm with similar size, investment, leverage, cash and tobin’s q
from the same country and year in Panel A (and in addition from the same Fama-French 49 industry in
Panel B). Detailed variable definitions can be found in Table 1. Robust standard errors clustered by firm
are displayed in parentheses. ***, ** and * represent 1%, 5% and 10% significance levels, respectively.
Year before Downgrade Year after Downgrade Diff
Panel A: Matched Sample
Treated Firms 14.02*** 13.72*** -0.30
(0.79) (0.78) (0.28)
Control Firms 11.17*** 12.20*** 1.03**
(0.71) (0.70) (0.43)
Diff 2.85*** 1.52
(1.06) (1.04)
Diff-in-Diff -1.33**
(0.53)
Panel B: Matched Sample with Industry Match (Fama-French 49-industry classification)
Treated Firms 13.35*** 13.58*** 0.22
(0.88) (0.90) (0.37)
Control Firms 9.79*** 11.25*** 1.47***
(0.85) (0.86) (0.51)
Diff 3.56*** 2.32*
(1.22) (1.25)
Diff-in-Diff -1.24**
(0.61)
29
Table 5: Sovereign Rating Downgrades and Firm Performance: Placebo Tests
This table presents the difference-in-differences estimations of changes in firm performance following
a sovereign credit rating downgrade during different placebo periods. A treated firm is defined as a firm
that has a credit rating higher or equal to its operating country’s sovereign credit rating in the year before
the sovereign downgrade. Each treated firm is matched with a control firm with similar size, investment,
leverage, cash and tobin’s q from the same country and year. Panel A shows the results during the Global
Financial Crisis from 2007-2009. Countries which are downgraded during the crisis are excluded. Panel
B presents results around the first recession year of OECD countries from 1990 to 2016 that is not
associated with sovereign downgrades. The OECD recession indicators are obtained from the Federal
Reserve Economic Data (FRED) database. Detailed variable definitions can be found in Table 1. Robust
standard errors clustered by firm are displayed in parentheses. ***, ** and * represent 1%, 5% and 10%
significance levels, respectively.
Panel A: 2007-2009 Global Financial Crisis
2007 2009 Diff
Treated Firms 15.38*** 13.56*** -1.82***
(0.91) (0.80) (0.51)
Control Firms 12.52*** 10.98*** -1.54**
(0.93) (0.83) (0.66)
Diff 2.86** 2.58**
(1.29) (1.15)
Diff-in-Diff -0.28
(0.83)
Panel B: Recession without a Sovereign Downgrade
Year before Recession Year after Recession Difference
Treated Firms 11.13*** 11.11*** -0.02
(1.48) (1.33) (0.62)
Control Firms 7.36*** 6.55*** -0.82
(1.28) (1.15) (0.64)
Diff 3.76* 4.56**
(1.96) (1.76)
Diff-in-Diff 0.80
(0.91)
30
Table 6: Sovereign Rating Downgrades and Firm Performance: Dynamic Effects
This table presents the dynamic effects of sovereign ceilings on firm performance. The sample consists
of nonfinancial firms from 1990 to 2016. A treated firm is defined as a firm that has a credit rating higher
or equal to its operating country’s sovereign credit rating in the year before the sovereign downgrade.
Downgrade (X) is an indicator equal to 1 for the xth year relative to a sovereign downgrade year, or zero
otherwise. Detailed variable definitions can be found in Table 1. Robust standard errors clustered by
firm are displayed in parentheses. ***, ** and * represent 1%, 5% and 10% significance levels,
respectively.
Dependent variable ROA
Treat x Downgrade (-2) -0.570 -0.236
(0.486) (0.452)
Treat x Downgrade (-1) -0.514 -0.366
(0.452) (0.414)
Treat x Downgrade (-0) -0.301 -0.093
(0.451) (0.390)
Treat x Downgrade (1) -0.834* -0.803**
(0.443) (0.398)
Treat x Downgrade (2) -0.655 -0.642
(0.490) (0.415)
Size 0.024
(0.187)
Investment -0.524
(1.445)
Tobin's Q 1.097***
(0.194)
Cash 1.981
(3.188)
leverage -4.805***
(1.770)
Constant 14.373*** 13.922***
(1.571) (2.721)
Year fixed effects Yes Yes
Firm fixed effects Yes Yes
N 3378 3378
Adjusted R2 0.647 0.673
31
Table 7: Sovereign Rating Downgrades and Firm Performance: Reduction in Debt
Funding
This table presents the difference-in-differences estimations of changes in firm performance following
a sovereign credit rating downgrade conditional upon reduction in net debt issuance (Panel A) and
whether the sovereign downgrade changes to a rating bin under the Basel 2 capital requirements. A
treated firm is defined as a firm that has a credit rating higher or equal to its operating country’s
sovereign credit rating in the year before the sovereign downgrade. Each treated firm is matched with a
control firm with similar size, investment, leverage, cash and tobin’s q from the same country and year.
Detailed variable definitions can be found in Table 1. Robust standard errors clustered by firm are
displayed in parentheses. ***, ** and * represent 1%, 5% and 10% significance levels, respectively.
Year before Downgrade Year after Downgrade Diff
Panel A: Reduction in debt issuance
Large
Treated Firms 13.28*** 12.61*** -0.67
(1.14) (1.21) (0.47)
Control Firms 10.90*** 12.17*** 1.26**
(0.98) (1.03) (0.63)
Diff 2.37 0.44
(1.51) (1.59)
Diff-in-Diff -1.93**
(0.83)
Small
Treated Firms 13.70*** 13.56*** -0.14
(1.04) (0.97) (0.39)
Control Firms 11.41*** 11.59*** 0.18
(1.06) (0.98) (0.74)
Diff 2.28 1.96
(1.49) (1.37)
Diff-in-Diff -0.32
(0.79)
Panel B: Sovereign downgrade to a new rating bin
Yes
Treated Firms 12.99*** 12.36*** -0.63
(1.14) (1.02) (0.42)
Control Firms 9.46*** 11.13*** 1.66
(1.13) (0.99) (0.73)
Diff 3.53** 1.23
(1.60) (1.42)
Diff-in-Diff -2.29***
(0.86)
No
Treated Firms 14.40*** 14.22*** -0.18
(0.87) (0.87) (0.35)
Control Firms 11.80*** 12.60*** 0.80
(0.79) (0.80) (0.51)
Diff 2.60** 1.62
(1.17) (1.18)
Diff-in-Diff -0.98
(0.62)
32
Table 8: Sovereign Rating Downgrades and Firm Performance: The Ability to
Substitute Debt with Equity Funding
This table presents the difference-in-differences estimations of changes in firm performance following
a sovereign credit rating downgrade conditional upon firm size (Panel A) and where the firm operates
in an emerging market. A treated firm is defined as a firm that has a credit rating higher or equal to its
operating country’s sovereign credit rating in the year before the sovereign downgrade. Each treated
firm is matched with a control firm with similar size, investment, leverage, cash and tobin’s q from the
same country and year. Detailed variable definitions can be found in Table 1. Robust standard errors
clustered by firm are displayed in parentheses. ***, ** and * represent 1%, 5% and 10% significance
levels, respectively.
Year before Downgrade Year after Downgrade Diff
Panel A: Size
Small
Treated Firms 14.50*** 14.50*** 0.00
(1.24) (1.18) (0.520)
Control Firms 11.02*** 12.91*** 1.89***
(1.00) (0.97) (0.66)
Diff 3.48** 1.59
(1.59) (1.53)
Diff-in-Diff -1.89**
(0.91)
Large
Treated Firms 13.61*** 13.05*** -0.56
(1.07) (0.98) (0.30)
Control Firms 11.35*** 11.39*** 0.04
(1.06) (0.98) (0.50)
Diff 2.26 1.66
(1.51) (1.39)
Diff-in-Diff -0.60
(0.61)
Panel B: Emerging markets
Yes
Treated Firms 15.66*** 15.36*** -0.30
(1.28) (1.31) (0.53)
Control Firms 11.71*** 13.41*** 1.70**
(1.20) (1.22) (0.79)
Diff 3.95** 1.96
(1.76) (1.79)
Diff-in-Diff -1.99**
(0.99)
No
Treated Firms 12.68*** 12.37*** -0.30
(0.98) (0.90) (0.29)
Control Firms 10.73*** 11.22*** 0.49
(0.83) (0.77) (0.42)
Diff 1.95 1.16
(1.29) (1.18)
Diff-in-Diff -0.79
(0.54)
33
Table 9: Sovereign Rating Downgrades and Firm Performance: Reduction in
Investment
This table presents the difference-in-differences estimations for changes in firm performance following
a sovereign credit rating downgrade conditional upon changes in investment levels. A treated firm is
defined as a firm that has a credit rating higher or equal to its operating country’s sovereign credit rating
in the year before the sovereign downgrade. Each treated firm is matched with a control firm with similar
size, investment, leverage, cash and tobin’s q from the same country and year. Detailed variable
definitions can be found in Table 1. Robust standard errors clustered by firm are displayed in
parentheses. ***, ** and * represent 1%, 5% and 10% significance levels, respectively.
Year before Downgrade Year after Downgrade Diff
Large drop in investment
Treated Firms 13.92*** 13.65*** -0.26
(0.96) (0.96) (0.38)
Control Firms 11.21*** 12.83*** 1.62***
(0.81) (0.81) (0.54)
Diff 2.71** 0.83
(1.25) (1.25)
Diff-in-Diff -1.88***
(0.69)
Small drop in investment
Treated Firms 14.11*** 13.78*** -0.33
(0.95) (0.95) (0.35)
Control Firms 11.13*** 11.45*** 0.31
(1.03) (1.03) (0.66)
Diff 2.98** 2.33*
(1.40) (1.40)
Diff-in-Diff -0.65
(0.75)
34
Table 10: Sovereign Rating Downgrades and Firm Performance: Robustness Tests
This table presents the difference-in-differences estimations of changes in firm performance following
a sovereign credit rating downgrade excluding utility firms (SIC 4900-4999) in Panel A and excluding
firms with a higher credit rating than the sovereign in Panel B. A treated firm is defined as a firm that
has a credit rating higher or equal to its operating country’s sovereign credit rating in the year before the
sovereign downgrade. Each treated firm is matched with a control firm with similar size, investment,
leverage, cash and tobin’s q from the same country and year. Detailed variable definitions can be found
in Table 1. Robust standard errors clustered by firm are displayed in parentheses. ***, ** and * represent
1%, 5% and 10% significance levels, respectively.
Year before Downgrade Year after Downgrade Diff
Panel A: Exclude utility firms
Treated Firms 14.92*** 14.43*** -0.49
(1.18) (1.05) (0.45)
Control Firms 14.64*** 15.67*** 1.03*
(1.01) (0.93) (0.61)
Diff 0.28 -1.25
(1.56) (1.40)
Diff-in-Diff -1.53*
(0.80)
Panel B: Exclude firms with rating above the sovereign
Treated Firms 12.45*** 12.51*** 0.06
(0.79) (0.79) (0.18)
Control Firms 11.85*** 13.32*** 1.38***
(0.76) (0.76) (0.50)
Diff 0.60 -0.72
(1.09) (1.09)
Diff-in-Diff -1.32**
(0.65)
35
Panel A: Matched Sample
Panel B: Matched Sample with Industry Match
(Fama-French 49-industry classification)
Figure 1: ROA around a sovereign downgrade. This figure presents the change in ROA for
treatment firms and control firms around a sovereign downgrade. A treated firm is defined as a firm
that has a credit rating higher or equal to its operating country’s sovereign credit rating in the year
before the sovereign downgrade. Each treated firm is matched with a control firm with similar size,
investment, leverage, cash and tobin’s q firm from the same country and year (and in addition from the
same Fama-French 49 industry in Panel B).
810
12
14
16
RO
A (
%)
-3 -1 1 3Year from Sovereign Downgrade
Treatment Control
810
12
14
16
RO
A (
%)
-3 -1 1 3Year from Sovereign Downgrade
Treatment Control
36
Appendix
Table A1: Credit Rating Conversions
This table provides the link between S&P’s credit ratings and the converted numerical rating scores
between 1 and 22. Ratings that are recorded as “NR” are excluded from our sample.
S&P
Rating
Numerical
Rating
AAA 1
AA+ 2
AA 3
AA- 4
A+ 5
A 6
A- 7
BBB+ 8
BBB 9
BBB- 10
BB+ 11
BB 12
BB- 13
B+ 14
B 15
B- 16
CCC+ 17
CCC 18
CCC- 19
CC 20
C 21
SD/D 22
37
Table A2: Channel Tests: Matched Sample with Industry Match
This table presents the difference-in-differences estimations of changes in firm performance following
a sovereign credit rating downgrade conditional upon reduction in net debt issuance (Panel A) and
reduction in investment (Panel B) using the industry-matched sample. A treated firm is defined as a firm
that has a credit rating higher or equal to its operating country’s sovereign credit rating in the year before
the sovereign downgrade. Each treated firm is matched with a control firm with similar size, investment,
leverage, cash and tobin’s q from the same country and year. Detailed variable definitions can be found
in Table 1. Robust standard errors clustered by firm are displayed in parentheses. ***, ** and * represent
1%, 5% and 10% significance levels, respectively.
Year before Downgrade Year after Downgrade Diff
Panel A: Reduction in debt issuance
Large
Treated Firms 11.42*** 11.72*** 0.29
(1.41) (1.23) (0.94)
Control Firms 8.68*** 10.82*** 2.14***
(1.25) (1.09) (0.58)
Diff 2.75 0.90
(1.89) (1.65)
Diff-in-Diff -1.85*
(1.10)
Small
Treated Firms 13.67*** 13.80*** 0.13
(1.18) (1.34) (0.47)
Control Firms 10.39*** 10.55*** 0.16
(1.06) (1.19) (0.85)
Diff 3.28** 3.26*
(1.58) (1.79)
Diff-in-Diff 0.02
(1.08)
Panel B: Reduction in investment
Large
Treated Firms 14.49*** 14.11*** -0.38
(1.19) (1.14) (0.62)
Control Firms 10.00*** 11.55*** 1.55**
(1.23) (1.16) (0.70)
Diff 4.49** 2.56
(1.71) (1.62)
Diff-in-Diff -1.93**
(0.82)
Small
Treated Firms 12.05*** 12.96*** 0.91**
(1.01) (1.08) (0.36)
Control Firms 9.60*** 10.99*** 1.40*
(0.92) (0.99) (0.76)
Diff 2.45* 1.97
(1.36) (1.47)
Diff-in-Diff -0.48
(0.95)