Southwest Region ITS Deployment Plan
50
Michigan Department of Transportation Regional ITS Architectures and Deployment Plans Southwest Region and Portions of University Region Final Regional ITS Deployment Plan Prepared by: With assistance by: January 24, 2008
Transcript of Southwest Region ITS Deployment Plan

Michigan Department of Transportation Regional ITS Architectures and Deployment Plans
Southwest Region and Portions of University Region
Final Regional ITS Deployment Plan
Prepared by: With assistance by:
January 24, 2008

TABLE OF CONTENTS FINAL REGIONAL ITS DEPLOYMENT PLAN – SOUTHWEST REGION AND PORTIONS OF
UNIVERSITY REGION
01/24/08 Southwest Region and Portions of University Region i Final Regional ITS Deployment Plan
1. INTRODUCTION.................................................................................................................................1 1.1 Project Overview........................................................................................................................ 1 1.2 Southwest Region and Portions of University Region Background ...................................... 2
1.2.1 Transportation Conditions .................................................................................................... 8 1.2.2 Commercial Vehicles .......................................................................................................... 13 1.2.3 Safety................................................................................................................................... 16 1.2.4 Public Transportation ......................................................................................................... 16
1.3 Report Summary...................................................................................................................... 17 2. REGIONAL ITS ARCHITECTURE DEVELOPMENT PROCESS ........................................................18
2.1 Overview of Study Process...................................................................................................... 18 2.2 Needs Assessment..................................................................................................................... 20
2.2.1 Inventory ............................................................................................................................. 20 2.2.2 Stakeholder Feedback ......................................................................................................... 22 2.2.3 Demand Model Projections................................................................................................. 24
2.3 Definition of Alternatives ........................................................................................................ 24 2.3.1 Alternatives Definition Overview........................................................................................ 24 2.3.2 Alternatives Technology Definition..................................................................................... 25 2.3.3 Deployment Philosophy ...................................................................................................... 26 2.3.4 Deployment Packages ......................................................................................................... 27
2.4 Evaluation of Alternatives....................................................................................................... 36 2.4.1 Evaluation Criteria ............................................................................................................. 36 2.4.2 Technical Evaluation Process............................................................................................. 37
2.4.2.1. IDAS Description ........................................................................................................ 38 2.4.2.2. IDAS Inputs and Default Values................................................................................. 41 2.4.2.3. Estimation of ITS Alternative Costs............................................................................ 44
3. DEPLOYMENT PLAN .......................................................................................................................50 3.1 Deployment Plan Projects ....................................................................................................... 50
3.1.1 Freeway Closure Notification ............................................................................................. 54 3.1.2 Advanced Emergency Route Deployment ........................................................................... 55 3.1.3 Commercial Vehicle Parking Information .......................................................................... 57 3.1.4 Traffic Management Center Configuration......................................................................... 58 3.1.5 DMS and HAR Deployment at Major Interchanges............................................................ 58 3.1.6 ITS Communication Assumptions ....................................................................................... 58 3.1.7 2/10th Mile Markers............................................................................................................. 59
3.2 Screening Process..................................................................................................................... 59 3.3 Final List of Projects for Analysis .......................................................................................... 62
4. ANALYSIS OF SOUTHWEST AND PORTIONS OF THE UNIVERSITY REGION ITS ALTERNATIVES...............................................................................................................................64
4.1 Project Categorization............................................................................................................. 64 4.2 Results of Benefit/Cost Analysis ............................................................................................. 76
4.2.1 Freeway Management Systems ........................................................................................... 76 4.2.2 Freeway Service Patrols ..................................................................................................... 77 4.2.3 Smart Work Zones ............................................................................................................... 77 4.2.4 Traffic Signal System Improvements ................................................................................... 80 4.2.5 Roadway Weather Information Systems (RWIS) ................................................................. 80

TABLE OF CONTENTS FINAL REGIONAL ITS DEPLOYMENT PLAN – SOUTHWEST REGION AND PORTIONS OF
UNIVERSITY REGION
01/24/08 Southwest Region and Portions of University Region ii Final Regional ITS Deployment Plan
4.2.6 Highway Advisory Radio..................................................................................................... 81 4.2.7 Advanced Public Transportation System ............................................................................ 82
4.3 Summary of Results................................................................................................................ 83 4.4 Project Timeframes ................................................................................................................. 85
LIST OF FIGURES
Figure 1 - Existing Conditions..........................................................................................................................3 Figure 2 - Existing Weather Data Collection Locations...................................................................................4 Figure 3 - Incident Management Routes ..........................................................................................................5 Figure 4 - Incident Management Routes ..........................................................................................................6 Figure 5 - Incident Management Routes ..........................................................................................................7 Figure 6 - Study Area Portion of 2006 Average Annual Daily Traffic Map....................................................9 Figure 7 - Benton Harbor / St Joseph Portion of 2006 Average Annual Daily Traffic Map..........................10 Figure 8 - Kalamazoo Portion of 2006 Average Annual Daily Traffic Map..................................................10 Figure 9 - Battle Creek Portion of 2006 Average Annual Daily Traffic Map................................................11 Figure 10 - Jackson Portion of 2006 Average Annual Daily Traffic Map .....................................................11 Figure 11 - 2015 Congestion Levels...............................................................................................................12 Figure 12 - Study Area Portion of 2006 Commercial Average Annual Daily Traffic Map ...........................13 Figure 13 - Benton Harbor/St Joseph Portion of 2006 Commercial Average Annual Daily Traffic Map .....14 Figure 14 - Kalamazoo Portion of 2006 Commercial Average Annual Daily Traffic Map ...........................14 Figure 15 - Battle Creek Portion of 2006 Commercial Average Annual Daily Traffic Map .........................15 Figure 16 - Jackson Portion of 2006 Commercial Average Annual Daily Traffic Map.................................15 Figure 17 - Deployment Study Process Chart ................................................................................................19 Figure 18 - Process to Develop and Evaluate ITS Alternatives .....................................................................20 Figure 19 - IDAS Model Structure .................................................................................................................40 Figure 20 - Sample IDAS Representation of RWIS Deployment ..................................................................43 Figure 21 - IDAS – ITS Deployment Equipment Details...............................................................................48 Figure 22 - Advanced Incident Management Route Deployment ..................................................................57 Figure 23 - ITS Deployment Plan Projects - Rural Freeways ........................................................................67 Figure 24 - ITS Deployment Plan Projects - Urban Freeways .......................................................................68 Figure 25 - ITS Deployment Plan Projects - I-94 and I-69 Interchange.........................................................69 Figure 26 - RWIS and Anti-Icing Deployment Plan ......................................................................................70 Figure 27 - Highway Advisory Radio Deployment Plan................................................................................71 Figure 28 - Arterial Corridor Deployment Plan .............................................................................................72 Figure 29 - Arterial Corridor Deployment Plan .............................................................................................73 Figure 30 - Arterial Corridor Deployment Plan .............................................................................................74 Figure 31 - Arterial Corridor Deployment Plan .............................................................................................75 Figure 32 - Scheduled Work Zones 2008-2001..............................................................................................79

TABLE OF CONTENTS FINAL REGIONAL ITS DEPLOYMENT PLAN – SOUTHWEST REGION AND PORTIONS OF
UNIVERSITY REGION
01/24/08 Southwest Region and Portions of University Region iii Final Regional ITS Deployment Plan
LIST OF TABLES Table 1 - Population and Employment in Southwest and Portions of University Region ......................... 8 Table 2 - Characteristics of Southwest and Portions of University Region Transit Authorities - 2006... 17 Table 3 - Freeway Management Deployment Types ............................................................................... 28 Table 4 - Arterial Management Deployment Types................................................................................. 29 Table 5 - Portable Traffic Management Deployment Types.................................................................... 30 Table 6 - ATIS Deployment Types .......................................................................................................... 30 Table 7 - Incident Management Deployment Types ................................................................................ 31 Table 8 - Advanced Warning and Safety Deployment Types .................................................................. 32 Table 9 - APTS Deployment Types ......................................................................................................... 33 Table 10 - Emergency Vehicle Deployment Types ................................................................................. 33 Table 11 - Advanced Parking Management Deployment Types.............................................................. 34 Table 12 - Roadway Weather Information Deployment Types ............................................................... 35 Table 13 - Advanced In-vehicle Deployment Types................................................................................ 36 Table 14 - ITS Components Assessed in IDAS ....................................................................................... 39 Table 15 - Comparison of Impact Values Used for IDAS Analysis ........................................................ 41 Table 16 - Monetary Values of IDAS Default Parameters....................................................................... 42 Table 17 - Summary Categories for IDAS Benefits................................................................................. 44 Table 18 - Unit Costs................................................................................................................................ 46 Table 19 - Major Components of ITS Deployment Packages.................................................................. 47 Table 20 - Initial List of Deployment Plan Projects................................................................................. 51 Table 21 - Advanced Emergency Route Deployment .............................................................................. 56 Table 22 - Deployment Plan Project Packets ........................................................................................... 61 Table 23 - Final List of Southwest and University Region Deployment Plan Projects ........................... 62 Table 24 - Study Area Projects by Category ............................................................................................ 65 Table 25 - Freeway Management Systems Annual Cost Savings Breakdown......................................... 77 Table 26 - Freeway Service Patrol Annual Cost Savings......................................................................... 77 Table 27 - Smart Work Zone Annual Cost Savings ................................................................................. 78 Table 28 - Traffic Signal System Improvement Annual Cost Savings .................................................... 80 Table 29 - Road Weather Information System (RWIS) Annual Cost Savings......................................... 81 Table 30 - Highway Advisory Radio System Annual Cost Savings ........................................................ 82 Table 31 - Advanced Public Transportation System Cost Savings .......................................................... 82 Table 32 - Deployment Packages Total Annual Benefits......................................................................... 83 Table 33 - Deployment Packages Net Benefits ........................................................................................ 83 Table 34 - Deployment Packages Annualized Cost ................................................................................. 84 Table 35 - Deployment Packages Benefit/Cost Ratios............................................................................. 84 Table 36 - Deployment Packages Capital Cost ........................................................................................ 84 Table 37 - Deployment Packages Operations and Maintenance Cost...................................................... 85 Table 38 - Southwest Region Short-Term (0 – 3 Years) ITS Deployment Plan Projects ........................ 86 Table 39 - Southwest Region Medium-Term (4 – 8 Years) ITS Deployment Plan Projects ................... 87 Table 40 - Southwest Region Long-Term (Over 8 Years) ITS Deployment Plan Projects ..................... 88

LIST OF ACRONYMS
01/24/08 Southwest Region and Portions of University Region iv Final Regional ITS Deployment Plan
AHS Automated Highway System
AMBER America’s Missing: Broadcast Emergency Response
ANSI American National Standards Institute
ATMS Advanced Traffic Management System
AVL Automated Vehicle Location
AWOS Automated Weather Observing System
CCTV Closed Circuit Television
CJIC Criminal Justice Information Center
CRC County Road Commission
DCM Data Collection and Monitoring
DEM Department of Emergency Management
DMS Dynamic Message Sign
DNR Department of Natural Resources
DPW Department of Public Works
DSRC Dedicated Short Range Communication
ESS Environmental Sensor Stations
EOC Emergency Operations Center
AASHTO American Association of State Highway and Transportation Officials
FHWA Federal Highway Administration
FTA Federal Transit Administration
HAR Highway Advisory Radio
HAZMAT Hazardous Materials
HRI Highway Rail Intersection
IDAS ITS Deployment Analysis Software
IEEE Institute of Electrical and Electronics Engineers
IMMS Incident Management Message Sets
ISO International Standards Organization
ISP Information Service Provider
ITS Intelligent Transportation System
MAC Medium Access Control

LIST OF ACRONYMS
01/24/08 Southwest Region and Portions of University Region v Final Regional ITS Deployment Plan
MDT Mobile Data Terminal
MIOC Michigan Intelligent Operations Center
MITSC Michigan Intelligent Transportation Systems Center
MOU Memorandum of Understanding
MSP Michigan State Police
NEMA National Emergency Management Association
NOAA National Oceanic and Atmospheric Administration
NTCIP National Transportation Communications for ITS Protocol
NWS National Weather Service
RWIS Roadway Weather Information System
SAE Society of Automotive Engineers
SAFETEA-LU Safe, Accountable, Flexible and Efficient Transportation Equity Act – A Legacy for Users
SDO Standards Development Organization
STMF Simple Transportation Management Framework
TCP/IP Transmission Control Protocol/Internet Protocol
TEA-21 Transportation Equity Act for the 21st Century
TMC Transportation Management Center
TOC Traffic Operations Center
TSC Transportation Service Centers
TIP Transportation Improvement Program
UDP/IP User Datagram Protocol/Internet Protocol
USDOT United States Department of Transportation
VIVDS Vehicle Imaging Video Detection Systems
WMTMC West Michigan Traffic Management Center
XML Extensible Mark-up Language
01/24/08 Southwest Region and Portions of University Region 1 Final Regional ITS Deployment Plan
1. INTRODUCTION
1.1 Project Overview
The Michigan Department of Transportation (MDOT) Southwest Region and Portions of the University Region Intelligent Transportation Systems (ITS) Deployment Plan is part of an overall effort to develop a statewide ITS architecture along with a deployment plan for each of MDOT’s seven regions. To date, ITS deployments have been concentrated almost exclusively in the two largest metropolitan areas, Detroit and Grand Rapids. Both systems include Traffic Management Centers (TMC) that utilize closed circuit television (CCTV) cameras, detection equipment and dynamic message signs (DMS) to manage traffic on regional freeways. Both systems focus on incident management activities and traveler information with the goal of improving the safety and mobility of the traveling public. While the smaller urban centers and rural areas of Michigan do not experience the levels of recurrent and non-recurrent congestion (incidents) found in the larger cities, there are unmet needs related to traveler safety and mobility that provide opportunities for the strategic application of ITS technologies and concepts. Given the large number of roadway miles in these areas and the very limited capital budget available for improvements, ITS technologies may provide cost-effective ways of meeting these needs. A number of ITS applications were being proposed in these areas to improve service to the traveling public and to improve the overall efficiency of MDOT’s system operations. While recognizing the potential of ITS applications, MDOT also recognized that implementing ITS technologies in an ad-hoc manner across the State would not provide the system wide integration required; not achieve statewide performance requirements; and would, in the end, not be cost-effective. Coordination of services and communication between regions on program and project investments is a critical requirement for long-term success. Operations, maintenance, and ultimately replacement costs would be increased without this integrated approach. MDOT expects to identify ITS deployment projects in each region that address two major elements:
Development of an ITS architecture in regions where none existed and the updating of
the architecture in areas where it existed but was out of date. The program will establish regional architectures for the North, Bay, Grand, Superior, Southwest, and University regions and update the existing architectures for the Detroit, Flint and Lansing metropolitan areas. The Federal Transportation Reauthorization bill of 1998 (TEA-21) greatly expanded the eligibility of ITS projects for Federal funding, but also included Section 940, which required that ITS projects eligible for Federal funding be compatible with the National ITS Architecture. The Federal rule defines the national architecture as “a common framework for ITS interoperability. The National ITS Architecture comprises the logical architecture and physical architecture which satisfy a defined set of user services.” The development of a consistent architecture across the State has several benefits. In addition to making ITS type investments eligible for Federal funding, it assures a consistent approach to technology applications across the State. The process also brings a variety of stakeholders together to open a dialogue that discusses issues of common concern and finds common ground on potential strategies to fund and implement the technologies.
Development of Regional Deployment Plans where they do not currently exist. The architecture itself provides a structure that identifies packages of user services and also defines the connections between them. The Deployment Plan is needed to define the geographic location of the projects, the technologies that will be deployed, and the timing

01/24/08 Southwest Region and Portions of University Region 2 Final Regional ITS Deployment Plan
of the deployments. Projects are defined in a manner consistent with the planning, programming, design, and implementation processes of MDOT. The Deployment Plan accounts for financial constraints and provides benefit/cost analysis of various deployment combinations. Combining the architecture and deployment plan within the same project allows consistency between the two, and consistency in the process across regions facilitates the development of multi-regional projects where appropriate. The product of the Deployment Plan is a set of defined projects with estimated costs and benefits. These projects will then be considered for funding through MDOT’s statewide planning process in rural regions or through the MPO process in the urbanized areas. These regional deployment plans will reflect an understanding of their impact in advancing statewide policies and objectives and agreed to integrated system performance measures and, as such, will support cross regional applications investment programs.
Both of these focused efforts are impacted by a separate project, the development of statewide software specifications for Advanced Traffic Management Systems (ATMS). The software utilized in the Michigan Intelligent Transportation System Center (MITSC) in Detroit dates back to the mid-1990’s and has been in need of replacement for some time. MDOT is making temporary improvements while developing a specification for new software. The West Michigan TMC is currently operating in the Grand Region and additional future TMCs have been identified. These TMCs have been identified in the regional architectures and will also be a part of the statewide Architecture and Deployment Plan. The ATMS project will provide a common platform for all ITS deployments across the state. This will enhance coordination between regions and enable centers to back each other up during off hours or times of emergency. To this end, a series of stakeholder meetings were held across the state to identify user needs and obtain feedback on how the ATMS software can enhance operational and maintenance activities. Deployment plans are based on stakeholder feedback, the state long range plans, urban area long range plans, review of data on transportation needs and the technical feasibility of various technologies. The regional architectures and the ATMS software specification help to define the development and analysis of ITS investment alternatives.
1.2 Southwest Region and Portions of University Region Background
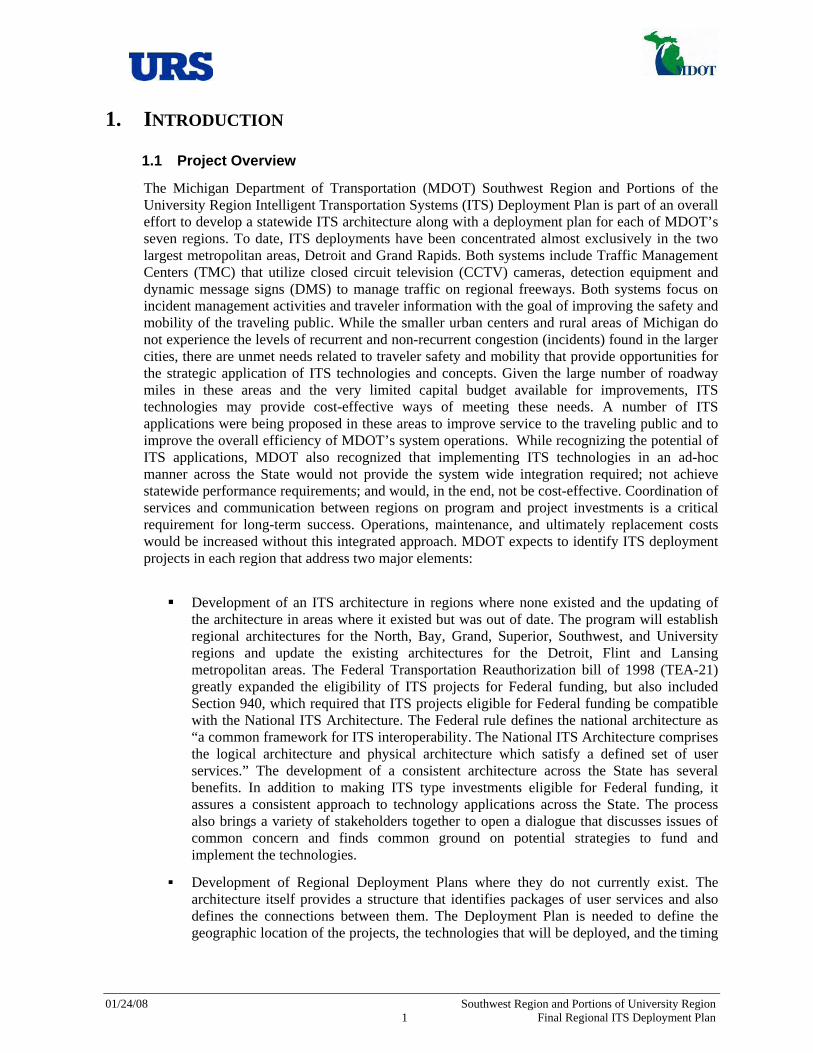
The study area encompasses all 9 counties of the Southwest Region of Michigan as well as Jackson and Shiawassee Counties of the University Region. The study area is defined by the boundary of Lake Michigan to the west, the Grand Region to the north, the University Region to the east, and the State of Indiana to the south. The study area boundaries and existing conditions are shown in Figure 1 and Figure 2. The primary roadway facilities include I-94, I-196, I-69, US-131, US-31, and US-127.
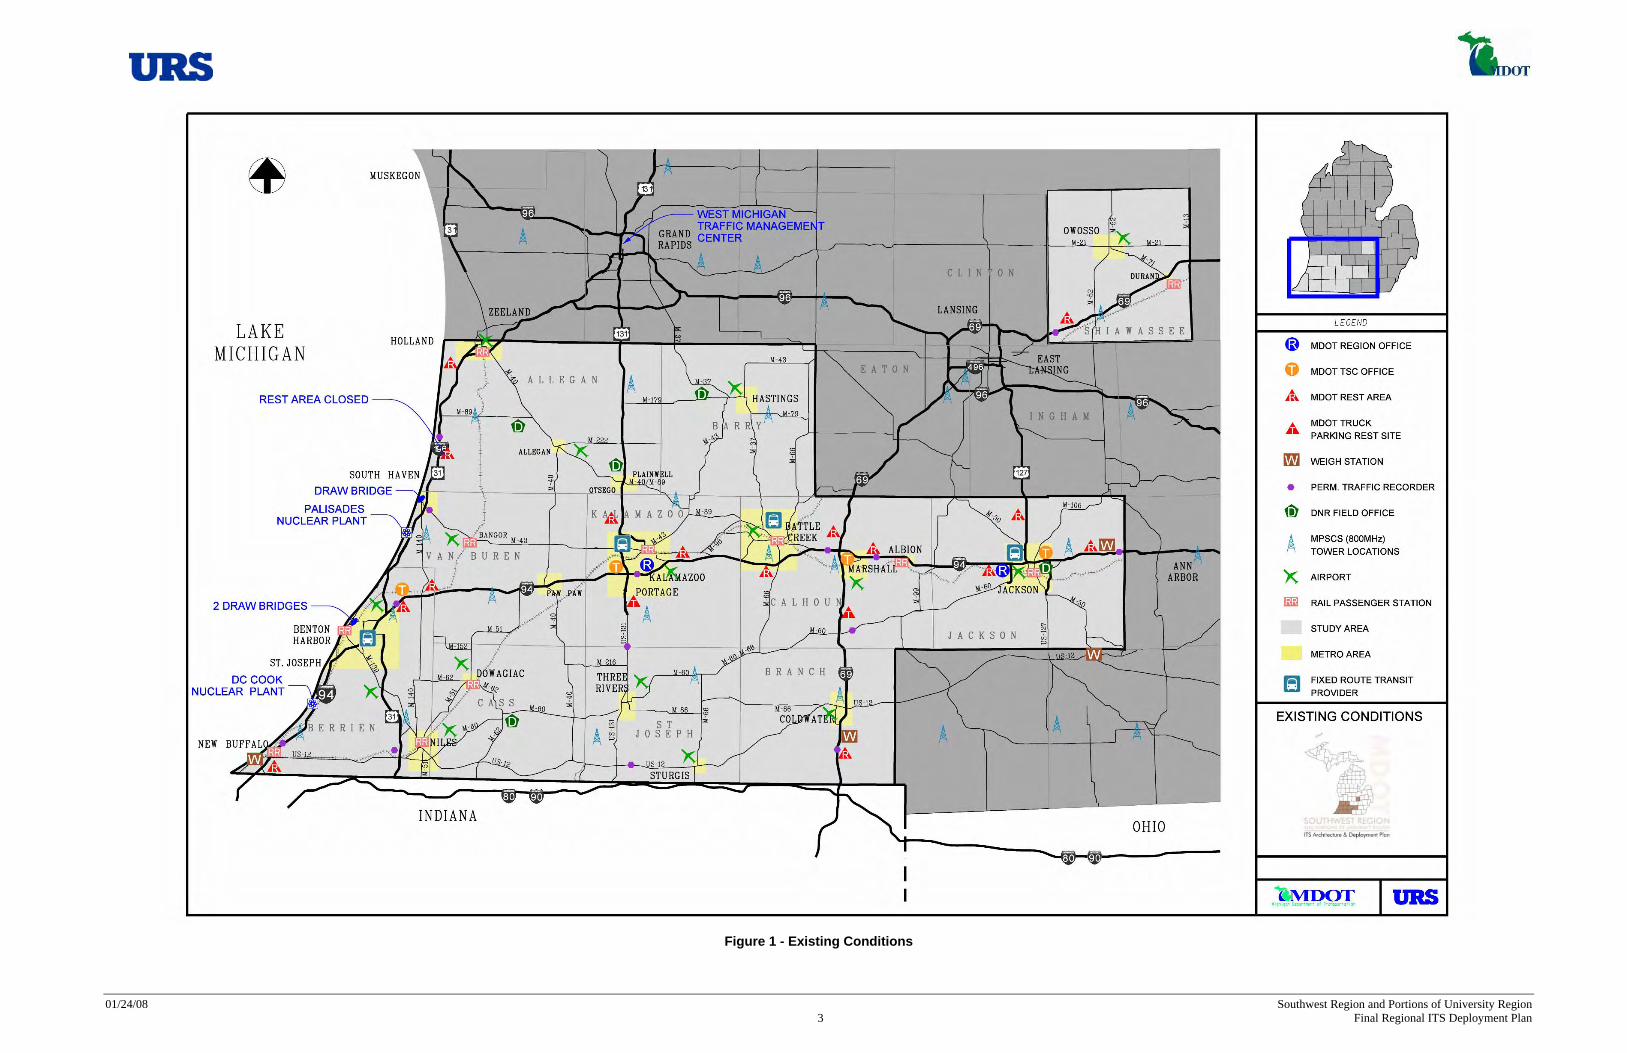
I-94 is a major east-west roadway that connects most of the major cities in southern Michigan including: Port Huron, Detroit, Ann Arbor, Jackson, Battle Creek, Kalamazoo and St. Joseph/Benton Harbor. I-94 is a major route for truck traffic and international trade and serves traffic utilizing all three of Lower Michigan’s international border crossings. The entire length of I-94 in the study area has signed incident management routes. These routes are shown in Figure 3 through Figure 5.
I-196 runs through primarily north-south along the Lake Michigan coast and connects Grand Rapids, Holland, South Haven and I-94.
I-69 is a major roadway that connects Port Huron, Flint, Lansing, Marshall and Coldwater. I-69 intersects Indiana’s I-80/90 Toll Road just south of the Michigan-Indiana border. I-69 is also a major route for truck traffic and international trade.
01/24/08 Southwest Region and Portions of University Region 3 Final Regional ITS Deployment Plan
Figure 1 - Existing Conditions

01/24/08 Southwest Region and Portions of University Region 4 Final Regional ITS Deployment Plan
Figure 2 - Existing Weather Data Collection Locations

01/24/08 Southwest Region and Portions of University Region 5 Final Regional ITS Deployment Plan
Figure 3 - Incident Management Routes

01/24/08 Southwest Region and Portions of University Region 6 Final Regional ITS Deployment Plan
Figure 4 - Incident Management Routes
01/24/08 Southwest Region and Portions of University Region 7 Final Regional ITS Deployment Plan
Figure 5 - Incident Management Routes

01/24/08 Southwest Region and Portions of University Region 8 Final Regional ITS Deployment Plan
US-131 is a major north-south roadway that connects Grand Rapids, Kalamazoo and northern Indiana. US-131 is a freeway north of Portage where it then transitions to a divided highway, and is a two lane highway south of Three Rivers.
US-31 runs concurrently with I-196 for much of the study area but branches off in Benton Harbor where it continues south to the Michigan-Indiana border.
US-127 is a freeway north of Jackson and a two lane highway south of Jackson.
The largest cities within the study area are Kalamazoo, Battle Creek, Jackson, Benton Harbor and St Joseph. Outside of these four metro areas, the region has a relatively low population density and an economy that is largely manufacturing and agriculturally based. As shown in Table 1, the study area has an estimated 2006 population of approximately 1,189,000 and estimated employment of 388,207. The largest concentration of population and activity is in Kalamazoo County, which has approximately 20% of the region’s population and 28% of its employment.
Table 1 - Population and Employment in Southwest and Portions of University Region
County Population
2000 Population
2006 Population
Change Employment
2005 Allegan 105,665 113,501 7,836 34,483
Barry 56,755 59,899 3,144 11,095
Berrien 162,453 161,705 -748 57,374
Branch 45,787 45,875 88 13,283
Calhoun 137,985 137,991 6 52,609
Cass 51,104 51,329 225 8,905
Jackson 158,422 163,851 5,429 50,949
Kalamazoo 238,603 240,720 2,117 109,046
St Joseph 62,422 62,777 355 19,140
Shiawassee 71,687 72,912 1,225 14,843
Van Buren 76,263 79,018 2,755 16,480
Total 1,167,146 1,189,578 22,432 388,207Source: US Census Bureau
1.2.1 Transportation Conditions
The study area contains significant portions of I-94 and I-69, which are critical corridors for commercial traffic and international trade. Congestion and closures on either of these freeways have significant impacts on drivers, commercial vehicles, and local and state economies. Transportation in the study area is facilitated through a substantial network of freeways, MDOT trunk lines, and local roads. The most heavily traveled routes are portions of the freeways near the four major metro areas of Benton Harbor/St Joseph, Kalamazoo, Battle Creek, and Jackson with the Average Daily Traffic (ADT) volumes ranging from 45,000 to 80,000. Significant arterials in these metro areas experience ADT volumes ranging from 15,000 to 30,000.

01/24/08 Southwest Region and Portions of University Region 9 Final Regional ITS Deployment Plan
Figure 6 shows traffic volumes for the study area from the MDOT Annual 2006 Traffic Count map while Figure 7, Figure 8, Figure 9, and Figure 10 show counts on MDOT trunkline routes in Benton Harbor / St Joseph, Kalamazoo, Battle Creek, and Jackson, respectively.
Figure 6 - Study Area Portion of 2006 Average Annual Daily Traffic Map
Source: MDOT

01/24/08 Southwest Region and Portions of University Region 10 Final Regional ITS Deployment Plan
Figure 7 - Benton Harbor / St Joseph Portion of 2006 Average Annual Daily Traffic Map
Source: MDOT
Figure 8 - Kalamazoo Portion of 2006 Average Annual Daily Traffic Map
Source: MDOT

01/24/08 Southwest Region and Portions of University Region 11 Final Regional ITS Deployment Plan
Figure 9 - Battle Creek Portion of 2006 Average Annual Daily Traffic Map
Source: MDOT
Figure 10 - Jackson Portion of 2006 Average Annual Daily Traffic Map

01/24/08 Southwest Region and Portions of University Region 12 Final Regional ITS Deployment Plan
Source: MDOT
MDOT prepared a series of congestion maps for the recently released 2030 State Long Range Transportation Plan. Due to continuing changes in technology, ITS projects are generally planned over a short period. Even though an agency’s operational approach may not change, the technology options and the communications approach can vary and thereby greatly affect the designs of an ITS deployment. Figure 11 shows projections of congested locations and locations approaching congested conditions for 2015. Some congestion is projected in the Southwest and portions of University Region with most of the congestion being centered around metro areas.
Figure 11 - 2015 Congestion Levels
Source: MDOT

01/24/08 Southwest Region and Portions of University Region 13 Final Regional ITS Deployment Plan
1.2.2 Commercial Vehicles
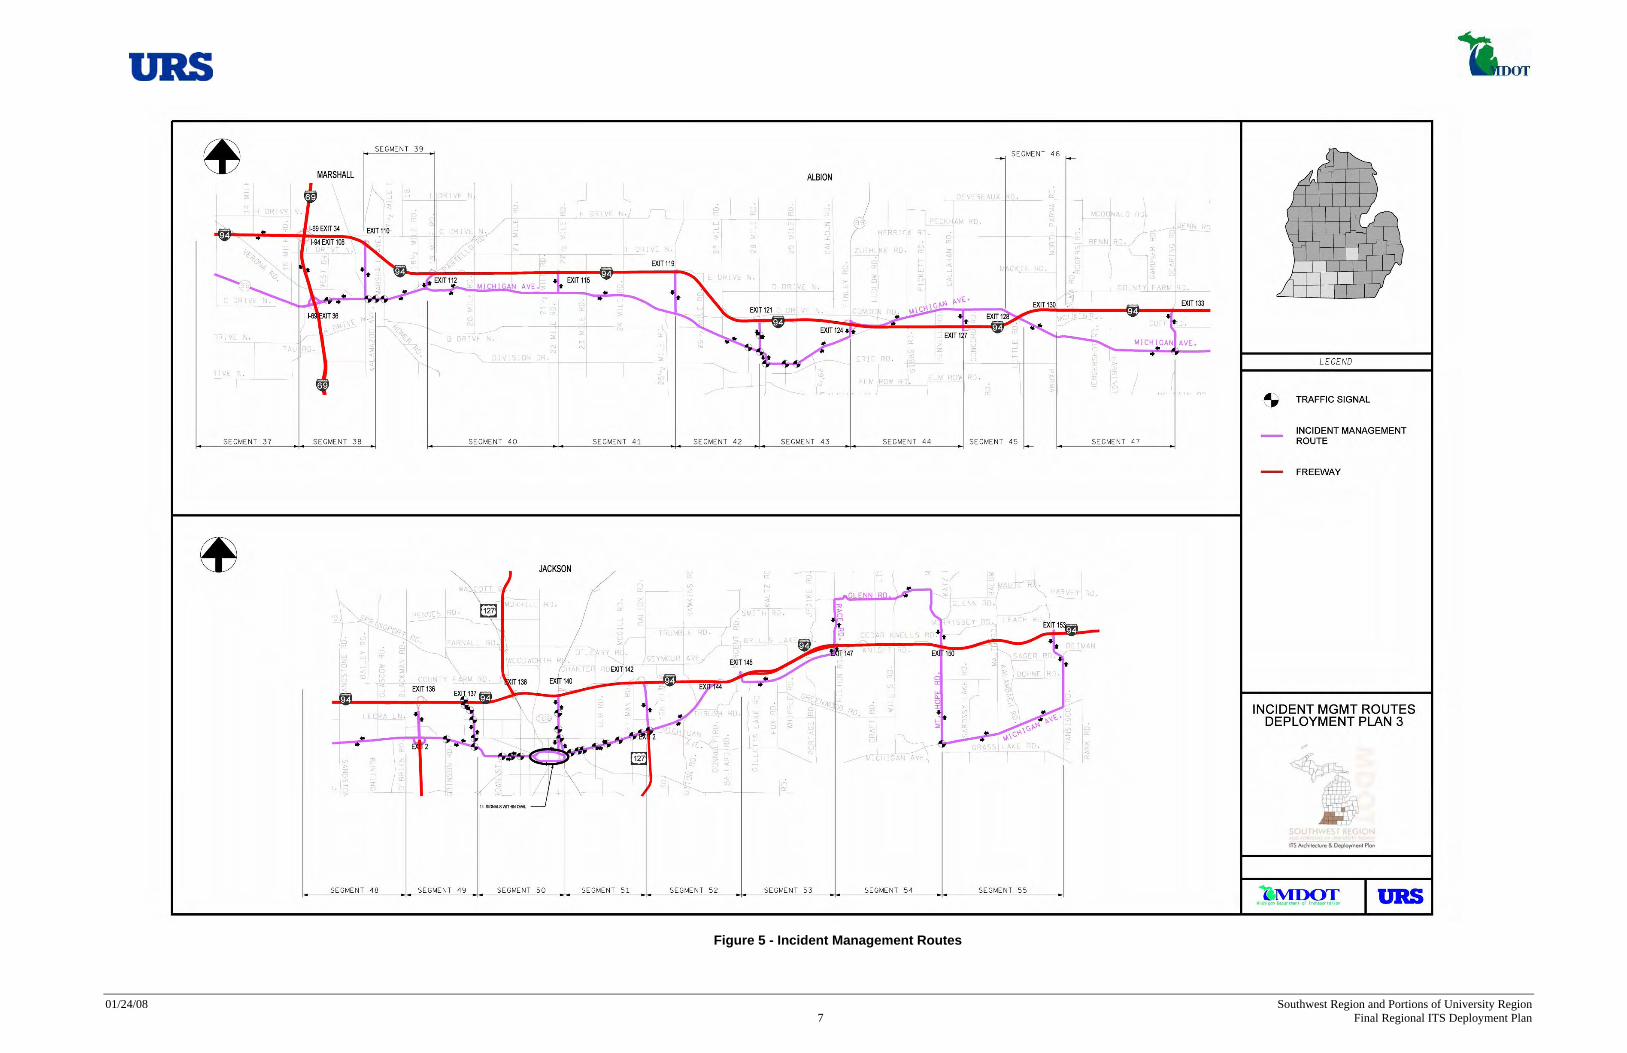
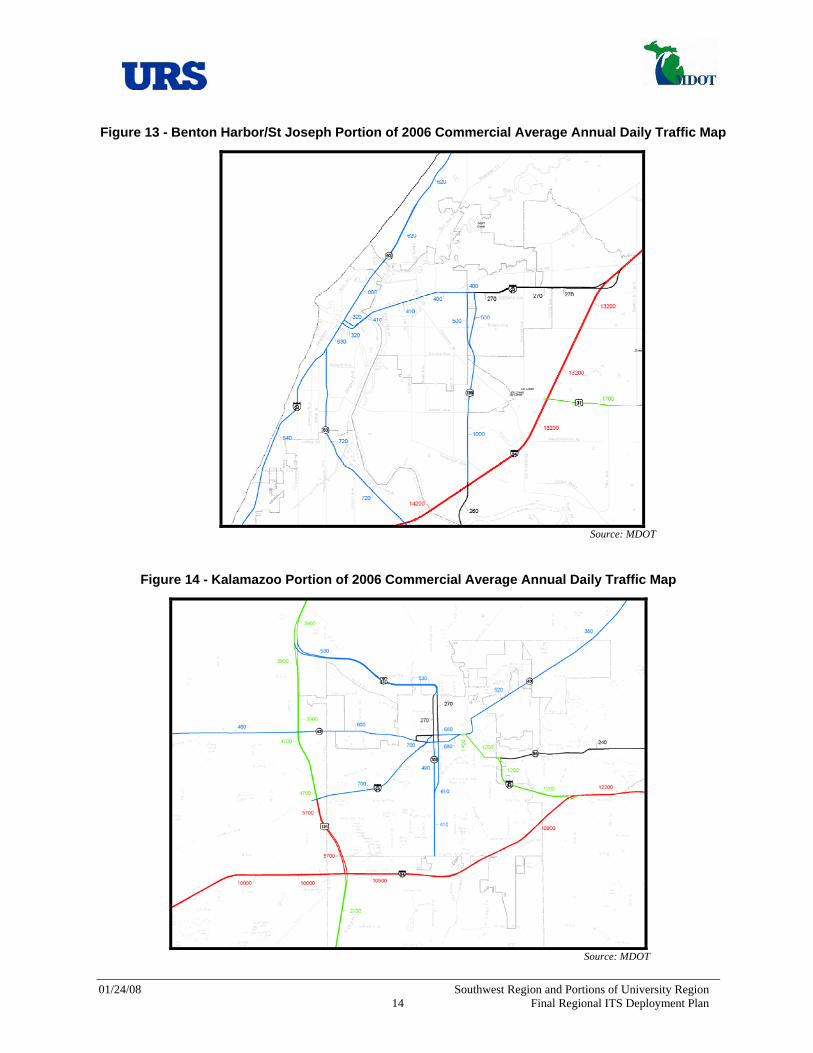
Significant commercial vehicle traffic can be found on most major roadways in the Southwest and portions of University Region study area. As seen in Figure 12, the entire length of I-94 and I-69 within the study area are classified with the highest level of commercial traffic volumes on the 2006 MDOT Commercial ADT Map with volumes ranging from 7,500 – 13,000. Figure 13 through Figure 16 show the commercial vehicle volumes for MDOT routes in the four major metro areas of Benton Harbor/St Joseph, Kalamazoo, Battle Creek, and Jackson. Other roadways within the study area with substantial commercial vehicle volumes include I-196, US-131, US-31 and US-127. The impact of an incident involving a commercial vehicle often has a greater effect on traffic flow than a non-commercial vehicle involved incident. Also, of incidents and closures on these key commercial vehicle routes has a negative impact on the regions economy. Many commercial vehicles that travel these roads carry goods associated with the automotive industry. With many automotive manufacturing plants using just-in-time manufacturing processes, commercial vehicle drivers need a route that can provide reliable and consistent travel times.
Figure 12 - Study Area Portion of 2006 Commercial Average Annual Daily Traffic Map
Source: MDOT
01/24/08 Southwest Region and Portions of University Region 14 Final Regional ITS Deployment Plan
Figure 13 - Benton Harbor/St Joseph Portion of 2006 Commercial Average Annual Daily Traffic Map
Source: MDOT
Figure 14 - Kalamazoo Portion of 2006 Commercial Average Annual Daily Traffic Map
Source: MDOT

01/24/08 Southwest Region and Portions of University Region 15 Final Regional ITS Deployment Plan
Figure 15 - Battle Creek Portion of 2006 Commercial Average Annual Daily Traffic Map
Source: MDOT
Figure 16 - Jackson Portion of 2006 Commercial Average Annual Daily Traffic Map
Source: MDOT

01/24/08 Southwest Region and Portions of University Region 16 Final Regional ITS Deployment Plan
The presence of commercial vehicles should be considered with the ITS deployment in this region. Stakeholders have noted a need for improved services for commercial vehicle parking. USDOT Rules for Hours of Service Limit specifies a maximum of 11 cumulative hours of driving after 10 consecutive hours off duty. To comply with this rule, commercial vehicle drives on I-94 need to find parking for extended periods of times. Currently the commercial vehicle drivers have a difficult time locating available parking within the Southwest Region. Stakeholders requested a system that can inform commercial vehicle drivers of current availability of parking at parking facilities to help the driver strategically plan where and when to stop. This system could provide an opportunity for public – private partnership.
Indiana’s I-80/I-90 Toll Road, and Ohio’s I-80/90 Ohio Turnpike is another major commercial vehicle route that runs just south of the entire southern Michigan state line. These portions of the I-80/I-90 corridor have commercial ADT volumes ranging from 7,500 to 15,000. This roadway connects the Chicago area to Toledo, which is approximately 60 miles south of Detroit. Indiana’s I-80/90 Toll Road has a total of 5 eastbound and 5 westbound travel plazas, and 2 eastbound and 2 westbound truck only parking facilities. Though not a part of this study area, it is important to recognize that large scale incidents on I-80/I-90 will have an impact on I-94 and I-69, and vice versa.
1.2.3 Safety
Safety is another key issue in the region. Severe winter weather is among the hazards that motorists in the region face on a regular basis. Also, with several routes in Southwest Michigan have high traffic volumes, work zone safety is also a significant issue for the region.
1.2.4 Public Transportation
Public transportation is an important component of providing transportation service options in the region. As shown in Table 2, there are 18 transit agencies in the region, most of which are County-based. Between them, they operate 300 vehicles, carry over 4.9 million passengers annually, and travel nearly 7 million miles. The total budget is approximately $28.6 million. These agencies provide transit services to approximately 1.2 million citizens in the region. Many of the agencies operate paratransit services to residents who are mobility impaired for either physical or economic reasons. Metro Transit in Kalamazoo is the largest transit authority in the region and provides fixed-route and paratransit service. Metro Transit carries roughly 57% of the transit riders in the region and takes approximately 40% of the budget. Many of the technology applications in transit have been focused on urban areas, including tracking of buses on high density fixed routes, electronic fare payment and CCTV for security. Applications in rural areas are more limited but Automatic Vehicle Location (AVL) technology does have the potential to improve efficiency, both through real-time tracking of vehicles and generation of data that can be analyzed to improve operating efficiency over time.

01/24/08 Southwest Region and Portions of University Region 17 Final Regional ITS Deployment Plan
Table 2 - Characteristics of Southwest and Portions of University Region Transit
Authorities - 2006
Agency Vehicles EmployeesVehicle Miles
Vehicle Hours Passengers Budget Cost/Pass
Allegan County Transportation 16 15 312,000 13,100 37,800 $626,200 $16.57Barry County Transit 12 15 170,500 12,600 70,900 $651,500 $9.19Battle Creek Transit 28 44 607,800 44,800 518,000 $3,355,000 $6.48Benton Harbor Dial-a-Ride Berrien Bus 25 23 531,000 73,400 134,300 $1,082,800 $8.06Branch Area Transit Authority 11 19 285,800 19,300 89,300 $1,092,800 $12.24Buchanan Dial-a-Ride 3 3 33,200 3,500 14,700 $144,300 $9.82Calhoun County Transit Cass County Transportation Authority 11 11 257,000 11,200 32,300 $523,800 $16.22DART (Dowagiac Dial-a-Ride) 3 3 46,300 4,500 29,700 $194,400 $6.55Interurban Transit Authority – Saugatuck/Douglas 7 12 125,200 10,100 52,200 $561,100 $10.75Jackson Transportation Authority 58 80 1,195,800 77,200 675,400 $4,972,700 $7.36Metro Transit - Kalamazoo 75 130 1,928,000 145,800 2,801,700 $11,520,300 $4.11Niles Dial-a-Ride 9 15 222,900 17,500 95,200 $596,700 $6.27Shiawassee Area Transportation Agency 15 14 351,200 22,000 80,300 $760,500 $9.47The Link - Marshall 5 8 75,700 8,800 45,200 $365,700 $8.09Twin Cities Area Transportation Authority – Benton Harbor / St Joseph 23 31 445,600 34,300 195,500 $1,558,900 $7.97Van Buren Public Transit 14 14 357,800 16,100 48,200 $605,100 $12.55Totals 315 437 6,945,800 514,200 4,920,700 $28,611,800 $9.48
Source: MDOT Transit Management System, 2007
1.3 Report Summary
MDOT and local transportation agencies are looking for ways to gain greater capacity out of existing facilities and to better “manage and operate” the system. As more ITS systems are deployed across the country and within Michigan, more information becomes available about the costs, benefits, and performance characteristics of these systems. This document focuses on the benefits and costs of various ITS deployments as they relate to overall system performance. This enables transportation agencies to make the most cost-effective use of limited available funds, coordinate ITS investment with normal road and bridge project decisions, and to evaluate ITS on the same footing as other transportation improvements. The tools being applied to this study will permit ITS to be “mainstreamed” into the day-to-day business of MDOT and other transportation agencies. This report presents the general process to develop an ITS Deployment Plan for the Southwest Region and portions of University Region.

01/24/08 Southwest Region and Portions of University Region 18 Final Regional ITS Deployment Plan
2. REGIONAL ITS ARCHITECTURE DEVELOPMENT PROCESS
2.1 Overview of Study Process
The purpose of the Southwest Region and portions of University Region ITS Deployment Plan is to identify feasible ITS projects that can meet the needs of the region’s stakeholders and develop a realistic plan to implement them. A key outcome of this process will allow the “mainstreaming” of ITS technologies, concepts and projects into the planning process and the project development process of MDOT and other key planning and transportation agencies in the region. In order to accomplish this objective, the process used to evaluate ITS projects must be compatible with that used to evaluate more traditional transportation projects. For example, ITS projects have been considered as alternatives to major roadway capital investment, or at least as a way to provide temporary relief until major capital investments can go through what is often a lengthy funding and approval process. In order to help make investment decisions, planners and engineers must have the tools and procedures to compare the benefits and costs of ITS investments and their impact on meeting agreed-to system performance goals with those of other projects. This process facilitates activities that will allow MDOT to better manage and indeed operate its transportation system assets and get the most from its transportation investment decisions. The process developed for this project was designed to address this objective.
Figure 17 provides a high-level overview of the process used to accomplish the study objectives. The primary feature of this approach is that it follows the process used to plan other types of transportation improvements. Steps included:
Review previous studies and documents including documentation of any existing ITS system and corridor studies which address ITS as a potential solution to transportation problems.
Define the transportation facilities and services to be included in the study. Collect and review planning level data to identify specific system problems. Sources
primarily included statewide and urban area transportation plans, traffic volumes, accident data and travel demand forecasts.
Develop and implement a stakeholder process to help identify transportation system needs and problems, and potential ITS solutions. Extensive meetings were held with a wide range of regional stakeholders.
Define and document transportation system problems and needs based on the information obtained from the above sources.
Develop a process for defining ITS alternatives and a set of alternatives. Conduct a benefit/cost analysis of the proposed alternatives, using the statewide travel
demand model as a basis. The ITS Deployment Analysis System (IDAS), a sketch-planning tool used to estimate the impact of ITS deployments, was used for this purpose.
Develop an implementation plan with funding options as a guide to help decision-makers prioritize ITS deployments.

01/24/08 Southwest Region and Portions of University Region 19 Final Regional ITS Deployment Plan
Figure 17 - Deployment Study Process Chart
Figure 18 provides a more detailed view of the process used to develop and evaluate ITS alternatives. Inputs used to develop the alternatives are shown in more detail and include:
Output of the regional ITS architecture process; Stakeholder input; and Review of transportation plans and studies for the study area.
Regional needs were identified using these inputs. Subsequently, the needs served as the base for the development of alternatives.
ProcessProcess OutputsOutputsEvaluationEvaluationInputsInputs
Iden
tify
Des
ired
ITS
Ser
vice
s
ITS Projects
Benefits• Travel time savings• Fuel/operating cost
reduction• Accident reduction• Air quality
improvements
Costs• Capital costs• Operations and
maintenance
Regional ITS Architectures
MDOT Long Range Plan
Corridors of Significance
Stakeholder Inputs
Integration with MDOT’s in 5 year
plan
Consistency with Long Range Plan
Prioritized ITS projects by
Region and State
Structured approach for ITS
expenditures

01/24/08 Southwest Region and Portions of University Region 20 Final Regional ITS Deployment Plan
Figure 18 - Process to Develop and Evaluate ITS Alternatives
Evaluation
ProcessInputs Outputs
Regional ITS Architecture
Regional ITS Architecture
Stakeholder Inputs
Stakeholder Inputs
Transportation Plans and StudiesTransportation
Plans and Studies
Categorize by Stakeholder and Market Package
Categorize by Stakeholder and Market Package
Categorize and Prioritize Stakeholder
Needs
Categorize and Prioritize Stakeholder
Needs
Quantify System Deficiencies
Quantify System Deficiencies
Perceived Deficiencies and Needs
Perceived Deficiencies and Needs
Market PackagesMarket Packages
ITS AlternativesITS Alternatives
Identify Desired ITS Services
Identify Desired ITS Services
Evaluation Criteria
Evaluation Criteria
IDAS Model Runs
IDAS Model Runs
The process shown graphically in the middle box includes four steps.
1. Categorize the output of the Southwest Region and portions of University Regional architecture projects by stakeholder and market package. This information is used to help identify ITS-related projects of interest to various stakeholders, and to assure that the ITS plan is compatible with the regional architecture.
2. Categorize and prioritize needs that were identified by stakeholders through meetings, reports and interviews. This information is used to help identify system problems and deficiencies, attitudes toward existing ITS services, and potential applications of ITS.
3. Identify perceived needs and deficiencies in terms of congestion, safety and other criteria.
4. Quantify system deficiencies and problems to the extent possible using the data described above and other data such as traffic volumes, existing and projected volume/capacity ratios and accident data.
The output of this process is used to identify ITS alternatives that address the needs identified. The process of defining and developing ITS alternatives is described in Sections 2.2 and 2.3. The ITS alternatives are then evaluated using the IDAS model. The model provides cost estimates in addition to benefit calculations related to travel time/mobility; accident reduction; fuel and operating cost savings; and air quality.
2.2 Needs Assessment
2.2.1 Inventory
The first step in the needs assessment process was to develop an inventory of existing ITS and ITS-related services in the study area. The needs assessment process was also used to identify agencies that may benefit from ITS solutions. There have been limited deployments in the region that have interconnected communication and operations between agencies. This

01/24/08 Southwest Region and Portions of University Region 21 Final Regional ITS Deployment Plan
section lists several types of systems that exist in the region and their intended purpose. The inventory created from the needs assessment will aid the stakeholders in learning about the operations and available information that is currently used throughout the region.
Advanced Traffic Management Systems (ATMS) in the study area include:
Approximately a 17 Permanent Traffic Recorder (PTR) stations are located across the region and are constantly monitored and the data is shared through an existing website.
Video imaging is used for presence detection at several intersections in the Kalamazoo, and Battle Creek Metro Areas.
MDOT and local agencies utilizes presence detectors at several traffic signals in the region.
There is 1 closed loop signal system in Benton Harbor / St Joseph, 12 closed loop systems in Kalamazoo metro area, 5 closed loop signal systems in Battle Creek, and 1 closed loop signal system in Marshall. Additional signal systems are planned for several corridors separate from this deployment plan.
Maintenance and Construction Management in the study area include:
An RWIS site is located on US-131 near the Allegan/Kent County line.
Currently, the National Weather Service (NWS) maintains 13 AWOS/ASOS sites in the region, which are primarily used for aviation. NOAA has a weather buoy system in the Great Lakes and weather cameras in the harbors.
Advanced Traveler Information Systems (ATIS) in the study area include:
The NWS regional website (http://nws.noaa.gov) covers the MDOT Southwest and University Region and shares forecasts, warnings radar and satellite information.
The Michigan State Police (MSP) in partnership with AAA has a website (http://www.autoclubgroup.com/michigan/autos/traffic) that provides general advisories for construction and incident information.
MDOT (http://www.michigan.gov/drive) and the City of Portage (http://www.portagemi.com/government/road_construction.asp?bhcp=1) provide construction and lane closure information on their agency’s website.
Incident Management initiatives in the study area include:
MDOT has developed and signed emergency routes along the entire stretch of I-94 in the Southwest Region and Portions of University Region study area.
MDOT has developed an incident management plan for the Southwest Region which identifies contacts, procedures, and strategies for incident management throughout the Region.
Advanced Public Transportation System (APTS) initiatives in the study area include:
Battle Creek Transit and Jackson Transportation Deployment Authority have existing AVL capacity. Metro Transit in Kalamazoo plans to have AVL capacity implemented in 2008, and Van Buren Transit anticipates AVL implementation within the next 5 years.

01/24/08 Southwest Region and Portions of University Region 22 Final Regional ITS Deployment Plan
The study area has a number of deployed ITS elements and planned system improvements that will provide the basis for a more coordinated system on a regional and statewide level. This coordination effort is critically dependent on clearly defined and well supported partnerships between MDOT, public safety agencies, and local transportation authorities. These partnerships will aid the region to effectively implement programs and technologies that can manage incidents; coordinate incident-related traffic; and improve the coordination of winter maintenance activities.
2.2.2 Stakeholder Feedback
Stakeholder feedback was the major input in identifying transportation needs of the region. Three different workshops provided contributions to this process. While the second meeting was specifically geared toward architecture development, it provided an opportunity for stakeholders to identify specific ideas and projects. Stakeholders were asked to identify other interested parties and to respond to ideas developed by the consultant team. The three meetings included:
February 27, 2007 – Stakeholder Kick-Off Meeting – Kalamazoo, Michigan
May 1, 2007 – Architecture Development Workshop – Kalamazoo, Michigan
August 21, 2007 – Deployment Plan Workshop – Kalamazoo, Michigan
Needs identified in the workshops are summarized below:
Traffic Management / Incident Management
A need for an improved traffic management system on major roads in the region was identified. The system will support incident management, traffic congestion resulting from incidents, peaks and severe weather. The system should use CCTV cameras, detection and improved interagency communications to obtain information on road conditions and respond to incidents. This system should consider the high volume of commercial vehicles that travel through the Southwest and University Regions. Information could be disseminated through DMS, HAR, the internet, 511 and in-vehicle devices. The traffic management system needs a central point of command and communication. The West Michigan TMC in Grand Rapids was identified for this purpose.
Winter weather conditions are one of the greatest transportation problems in the region. RWIS can provide MDOT with more detailed information on road conditions. The information can be used by the NWS and private providers of weather information to provide more detailed weather and pavement condition forecasts.
While there is limited video images of roadway conditions available in the region, CCTV camera deployments are anticipated to increase. Sharing of CCTV feeds between agencies, including MDOT, MSP, County Road Commissions and local transportation and public safety officials, can be helpful in responding more quickly to problems on the roadway.
Work zone management is a significant issue in the region. Due to the short construction season, major trunklines are subject to lane and shoulder closures

01/24/08 Southwest Region and Portions of University Region 23 Final Regional ITS Deployment Plan
during summer and fall seasons. These construction zones have dramatic effects on the economy due to the high volumes of commercial vehicles that travel through the region. Therefore, a need to more closely monitor work zone traffic impacts and communicate that information to the public was identified. “Smart work zone” technology is becoming increasingly available and affordable. These systems can include CCTV cameras and detector equipment to monitor queues and speeds. DMS can be used to provide traveler information or implement detour routes when necessary. Coordination of smart work zone installations through a TMC would enable MDOT to identify the cumulative impacts of work zone activity on major corridors.
Several major arterial corridors were identified that could benefit from upgrades of signal equipment.
Freeway Service Patrols, in Kalamazoo and Jackson were discussed as a way of improving incident response times during peak periods. Patrols would travel along the highway during peak travel times.
Stakeholders requested 2/10th mile markers particularly in urban areas to help locate incidents. This application is already under consideration for I-94 in the vicinity of Galesburg.
Maintenance Activities
There was a need cited for anti-icing installations co-located with RWIS on certain bridges that tend to freeze quickly. These locations were broken down in to high and medium deployments.
The RWIS site selection may benefit from thermal mapping, which is a process of mapping roadways based on temperature characteristics using sensors attached to probe vehicles. This information is used to identify areas which are subject to temperatures which vary from average and under what conditions those variances occur.
Deployment of an RWIS would have benefits for winter maintenance. It is important that real-time data on atmospheric conditions, pavement conditions and approaching weather be shared with MDOT personnel, County Road Commissions and others in order to achieve the maximum benefit.
Some stakeholders identified common radios as the most cost-effective method of improving the coordination of maintenance activities. Since most of the trunkline roads in the region are maintained under contract by County Road Commissions and local agencies, improved communication between MDOT and local agencies could have great benefits during snowstorms. 800 MHz radios are common between agencies, but they need to be programmed with common talk groups to facilitate interagency coordination.
Traveler Information
Stakeholders identified a need for DMS deployment on freeways in advanced of freeway to freeway interchanges and other major decision points.
DMS, HAR, and media alerts are methods of reaching travelers already on the road. MDOT is currently working on a plan to develop a statewide 511 system, but the

01/24/08 Southwest Region and Portions of University Region 24 Final Regional ITS Deployment Plan
implementation is dependent upon a viable funding source. MDOT is also in the process of procuring travel time data through cell phone probes. On-Star, satellite radio and other emerging in-vehicle technologies also could be used to transmit information to motorists. Options for delivering information off the roadway include internet sites, rest area and/or roadside kiosks and media outlets.
There are a number of emerging opportunities to improve the quality of weather information. The proposed RWIS system will represent a major advance in the availability and quality of road condition data. There are a number of other efforts underway through the NWS and private companies to enhance the detail and quality of weather data. The NWS is currently working with On-Star in the Detroit area to provide point weather information and specific forecasts based on car location. Another technological development is the NWS digital forecast database. MDOT is also initiating an RWIS deployment in the Superior Region and Concept of Operations for the North and the Grand Regions.
Public Transportation
Some transit authorities in the region have implemented AVL, and others are considered implementation of AVL systems to track vehicles.
2.2.3 Demand Model Projections
MDOT’s statewide travel demand model was used as the basis for the analysis of benefits and costs for the different ITS alternatives. The model uses average annual daily traffic (AADT). A short time frame, 2010, was selected for the analysis. The model was also used, along with data from the Statewide Long Range Transportation Plan, to identify congested areas.
2.3 Definition of Alternatives
2.3.1 Alternatives Definition Overview
One of the major challenges in the evaluation of ITS alternatives is the definition of those alternatives. Unlike roadway and public transportation improvements, ITS can include a wide range of technologies, packaged and implemented in different ways. One of the early efforts in this study was the development of a framework for evaluation of ITS alternatives. Several characteristics of ITS alternatives were established early in the process, including:
Timing/Phasing – Like other transportation improvements, ITS options need to be evaluated for a specific point in time, but the deployment can be phased in over a period of years with the most appropriate portion of the recommended solutions implemented to address the most pressing problems, and at the same time setting the technology framework for longer term investments. With limited funding available, projects need to be prioritized for implementation. While 2010 is used for the analysis, the presentation of specific alternatives in this report does not tie them to a specific year. This approach provides flexibility to implement portions of these plans and assess their effectiveness.
Geographic Coverage – Depending on the technology used, ITS alternatives can cover a specific facility, a corridor, or a region. Surveillance and management elements are tied to a specific corridor, while traveler information may be provided

01/24/08 Southwest Region and Portions of University Region 25 Final Regional ITS Deployment Plan
over a wide area. It is important that the geographic component of the ITS alternative be clearly defined. Some of the larger projects may be broken into segments and implemented in phases. Clear geographic limits also provide the opportunity to incorporate ITS projects into larger bridge or roadway reconstruction projects. It is also critical that statewide or inter-regional impacts or alternative deployments be considered.
Technology Component – ITS consists of a series of technology deployments that work together to meet safety and congestion-related objectives. It is this component that makes ITS more complex and therefore more difficult to define than physical improvements or additions to roadways or public transportation systems. Also, the level of ITS deployment can vary in intensity. On heavily congested urban freeways, for example, full coverage with cameras and detectors may be desirable. In less congested areas, coverage may be needed only at major interchanges and/or high accident locations. The following section addresses the methodology used to develop conceptual alternatives, and specifically appropriate levels of deployment. This serves not only as documentation for the study, but also as a template for future use by MDOT.
2.3.2 Alternatives Technology Definition
Some of the key concepts in defining ITS alternatives are:
Coverage of ITS Deployment is a collective term that represents the extent of ITS deployment in a region. It accounts for:
Number and length of routes covered;
Number of infrastructure facilities covered (for example, number of traffic signals in an arterial traffic management system);
The area covered, in the case of systems that have a network-wide impact (i.e. transit CAD and AVL);
Equipment; and
Overall geographical expanse of the ITS deployment including availability of traffic information.
ITS Deployment Intensity indicates the intensity of ITS deployment within the area of coverage which is a function of the quantity and quality of the ITS user services provided. There is no all-inclusive list of parameters that influence the deployment intensity, but typical examples of parameters that represent deployment intensity are:
Spacing of ITS equipment such as CCTV cameras, detectors, DMS;
Number of buses in an APTS that are equipped with CAD/AVL;
The hours of operation of a TMC or ATMS center; and
The hours of operation of an FSP.
Deployment intensity is different from coverage of deployment as it represents the degree of the ITS functionality of a deployment within the coverage area. Therefore, two similar ITS deployments can have the same coverage but differ in their deployment intensities. A typical example would be the case where there are two FSPs that cover the same roadway mileage,

01/24/08 Southwest Region and Portions of University Region 26 Final Regional ITS Deployment Plan
but one of them operates only during the peak hours and the other operates from sunrise to sunset. In this case, the deployment intensity of the latter FSP is higher, thereby resulting in a higher functionality than the other FSP.
Conventional ITS Applications collectively include ITS applications and services that have been deployed extensively in different metropolitan and rural areas in the United States, and have been in operation for a significant period of time. ITS applications, technologies and services that are still under development or testing, or those that are yet to achieve widespread market penetration, do not fall under this category. A majority of conventional ITS applications and services are public infrastructure oriented rather than private infrastructure or vehicle oriented. Examples include electronic DMS and surveillance cameras. The capital, deployment, and operating costs of conventional ITS applications and services have mostly been paid for by public agencies, although there are exceptions.
Emerging ITS Applications collectively include ITS applications, technologies, and services that are either in the process of development or testing, and have not achieved significant market penetration or have not been widely deployed in the United States as of date. A majority of emerging ITS applications and services are private infrastructure and vehicle oriented rather than public infrastructure oriented, with the Vehicle Infrastructure Integration (VII) project as a primary example. Private companies are paying many of the capital, deployment and operating costs of emerging ITS applications and services. These technologies will not only result in a shift of some services to the private sector, but will change the way that the transportation and public safety agencies in the public sector do their work. Once an ITS application achieves widespread usage and market penetration, it may be considered as conventional at that point in time.
2.3.3 Deployment Philosophy
One of the major objectives of the project is identifying the optimal level of investment in ITS. The results of the needs analysis indicated that the level and nature of ITS investment in the study area should be varied based on several variables. These included traffic volumes, projected congestion, safety and proximity to the existing ITS system.
The concept of deployment intensity is the method used to address these needs. Low-intensity deployments can be viewed as both a way to provide ITS coverage in areas of lesser need where only limited investment is justified, and as a first step toward higher intensity deployment. In this section, major ITS deployments are defined in terms of high and low density. These are flexible definitions and deployments are tailored to the specific system performance expectations of the region.
For purposes of display, individual technologies are sorted into several categories. In the architecture section of the report, these broad categories are tied to specific architecture packages.
Freeway Traffic Management;
Arterial Traffic Management;
Portable Traffic Management;
Advanced Traveler Information Systems;
Incident Management Systems;
01/24/08 Southwest Region and Portions of University Region 27 Final Regional ITS Deployment Plan
Advanced Infrastructure Based Warning Systems;
Advanced Public Transportation Systems;
Emergency Vehicle Dynamic Routing Systems;
Parking Management Systems;
Road Weather Information Systems; and
Advanced Vehicle Technology.
2.3.4 Deployment Packages
Core deployments represent the basic ITS services that are likely to be monitored or managed by MDOT. These generally include proven technologies that have been in operation for some time. The amount of deployment, level of monitoring, and the specific services provided on a given portion of the transportation system, depend on whether it is slated for high-intensity or low-intensity deployment. The exact technologies and packages are illustrated in Section 3 and the analysis of these technologies is presented in Section 4.
Freeway Traffic Management
The core grouping of freeway traffic management provides the basic monitoring, traveler assistance, and information feedback mechanisms for highway infrastructure. Together with arterial traffic management, freeway management functions provide the information skeleton on which additional services depend and build.

01/24/08 Southwest Region and Portions of University Region 28 Final Regional ITS Deployment Plan
Table 3 - Freeway Management Deployment Types
Function High-Intensity Deployment Low-Intensity Deployment Detection (Loop Detector, Microwave, Radar or
Imaging technology) 1 detector per mile average
Majority coverage (Loop Detector, Microwave, Radar or Imaging Technology) Detector on each segment
Surveillance/ Verification
100% roadway coverage (Streaming CCTV camera images able to view entire mileage) Fixed cameras at priority
locations; pan/tilt/zoom cameras at non-priority locations
Pan/tilt/zoom camera coverage of all interchanges
Priority coverage Major interchanges and other
priority locations have pan/tilt/zoom camera coverage
Freeway Service Patrol
Dedicated service to specific routes during peak periods
Deployed only during busiest travel days; applies primarily to recreational routes.
Highway Advisory Radio (HAR)
100% reception coverage Coupled with DMS at major interchanges
Announcement signs upon entering or leaving low-intensity coverage area
Will include roadway weather information where available
Dynamic Message Signs (DMS)
Approaching every interchange, at critical decision-making locations
On both surface road approaches to interchange (allowing sufficient time to change route)
At major regional decision points For specific safety warnings.
Cell phone probes for reporting travel times
Reporting of travel times using cell phone probes on all roads where service is available and traffic volumes provide an adequate sample
Reporting of travel time using cell phone probes on major trunkline routes
Arterial Traffic Management
Arterial traffic management caters to the unique needs of high-volume surface streets. Deployments must address additional delay and safety concerns, resulting from the presence of signalized intersections and railroad grade crossings. Implementation of formalized incident management strategies require that excess traffic resulting from freeway incidents or construction information be accommodated. Information must be provided to both agency personnel and the public on arterial conditions, and where possible, signal timing be adaptable to major change in traffic flow.

01/24/08 Southwest Region and Portions of University Region 29 Final Regional ITS Deployment Plan
Table 4 - Arterial Management Deployment Types
Function High-Intensity Deployment Low-Intensity Deployment Traffic Signal Coordination
Full signal coordination on all corridors identified as high-intensity, with “the bells and whistles” that go with it (actuation, coordination, control, traffic signal TOC, adaptation)
Traffic actuated signals isolated on an as needed basis; may be connected to TOC if needed for status determination purposes
Surveillance/ Verification
CCTV cameras deployed on an as needed basis at major locations, including: High accident, delay, or strategically
important intersections, segments, or railroad grade crossings
Key decision point for freeway/arterial incident management strategies
Can be pan/tilt/zoom or slow-scan fixed cameras
Can be combined with detection (in case of camera detection)
No CCTV cameras deployed except when needed to monitor isolated high accident/traffic locations
Tie existing detection data to TOC at specific locations
Signal Preemption for Emergency Vehicles
Deployed on an as needed basis, mainly in and around intersections/corridors such as: Intersections with high emergency
vehicle traffic (around hospitals, fire and police stations)
Densely developed areas (like central business districts)
Low capacity/long signal phasing/high accident intersections (typically single-lane approaches)
Generally, no signal preemption. However, individual intersections or corridors may be equipped on an as needed basis, using the high-intensity criteria
Rail Road Crossings
All railroad grade crossings on major arterials have advanced deployments, consisting of: Cross-bucks and flashing lights Quad-gates and incursion detection
systems Railroad signal preemption
At locations where major backups occur regularly and alternate routes are available: DMS, advanced warning/real-time
rerouting, and at-location status updates Speed-based gate timing
All rail grade crossings have standard deployments consisting of: Cross-bucks and flashing lights
Advanced deployments (listed under high-intensity) should be considered on an as needed basis for high rail traffic, accident, or delay locations.
Portable Traffic Management
Elements of a portable traffic management system work in tandem with both the freeway and arterial traffic management functions to cover activities likely to cause non-recurring congestion, such as roadway construction, major events, or interim traffic management. These functions extend the reach of the basic freeway and arterial management programs by giving the system the potential to temporarily increase the level of coverage and share specific local event and weather information on sections of the roadway network, without investing in permanent ITS infrastructure.

01/24/08 Southwest Region and Portions of University Region 30 Final Regional ITS Deployment Plan
Table 5 - Portable Traffic Management Deployment Types
Function High-Intensity Deployment Low-Intensity Deployment Portable detection Portable detection and information
equipment at construction sites along freeways and major trunklines, including: Portable DMS Detection equipment approaching
and within the impacted zone
Portable DMS with remote connection to TMC providing advanced warning of activity Depending on length of impacted roadway and duration of activity, portable detectors may be installed to track impact
Portable DMS Direct wireless communication between field equipment and TMC Wireless communication between detectors and DMS with pre programmed advance information
Advanced Traveler Information Systems (ATIS)
ATIS can be accomplished through public/private partnerships. Many agencies contract their ATIS function to a private contractor. MDOT, through the MITS Center, has participated in private partnerships. The private sector has, to date, shown interest primarily in major urban areas with high levels of congestion. Decisions regarding high and low-intensity deployment require assumptions about what services a private provider would be willing to offer, policies that a public agency could use to encourage particular service, and actions that a public agency should take to support full information provision. Some of the in-vehicle technologies being explored may enable traffic information to be obtained and disseminated to a larger number of rural roads.
Table 6 - ATIS Deployment Types
Function High-Intensity Deployment Low-Intensity Deployment Cellular phones, Pagers, Handheld devices
Complete broadcast coverage
Complete interactive, route-planning capabilities
Partial broadcast coverage Complete interactive, route-
planning capabilities, within coverage
Emphasis on real-time regional route choice information (for long-distance/intercity travelers)
Internet Network Coverage for all portions of system where information is available Route-planning services for
metropolitan areas focused more on disaggregated/ localized information
Availability of real-time TMC CCTV camera feeds and speed data
Network Coverage concentrated on major routes Route-planning services for
outlying areas focused on regional information
511 travel information service
Complete Coverage Coverage confined to major, high-intensity routes

01/24/08 Southwest Region and Portions of University Region 31 Final Regional ITS Deployment Plan
Incident Management – Freeway/Arterial Integration
Functions in this grouping are used to implement a defined incident management plan, to respond to major accidents or natural disasters. The functions help the designated relief arterials to accommodate increased traffic that has been rerouted off of impacted freeway segments. In high-intensity applications, active management of both freeway and arterial corridors is provided. In low-intensity applications, information is provided but proactive management of the arterial system is not.
Table 7 - Incident Management Deployment Types
Function High-Intensity Deployment Low-Intensity Deployment Incident freeway-arterial signal coordination
For freeway-alternate arterial pairs identified in a regional incident management plan. Arterial signals along alternate
corridor able to adjust for shifting traffic pattern
Can be either manual control between freeway TMC and signal coordination center, or seamless sensor-automated control
For freeway-alternate arterial pairs identified in a regional incident management plan. Information provided on freeway
through DMS Traffic monitored on parallel arterials
but no proactive management
Alternate route guidance (Trailblazer)
“Trailblazer” or similar dynamic route guidance signs deployed at all potential decision points along alternate arterial corridor
“Trailblazer” signs not deployed but portable DMS may be used in certain situations
01/24/08 Southwest Region and Portions of University Region 32 Final Regional ITS Deployment Plan
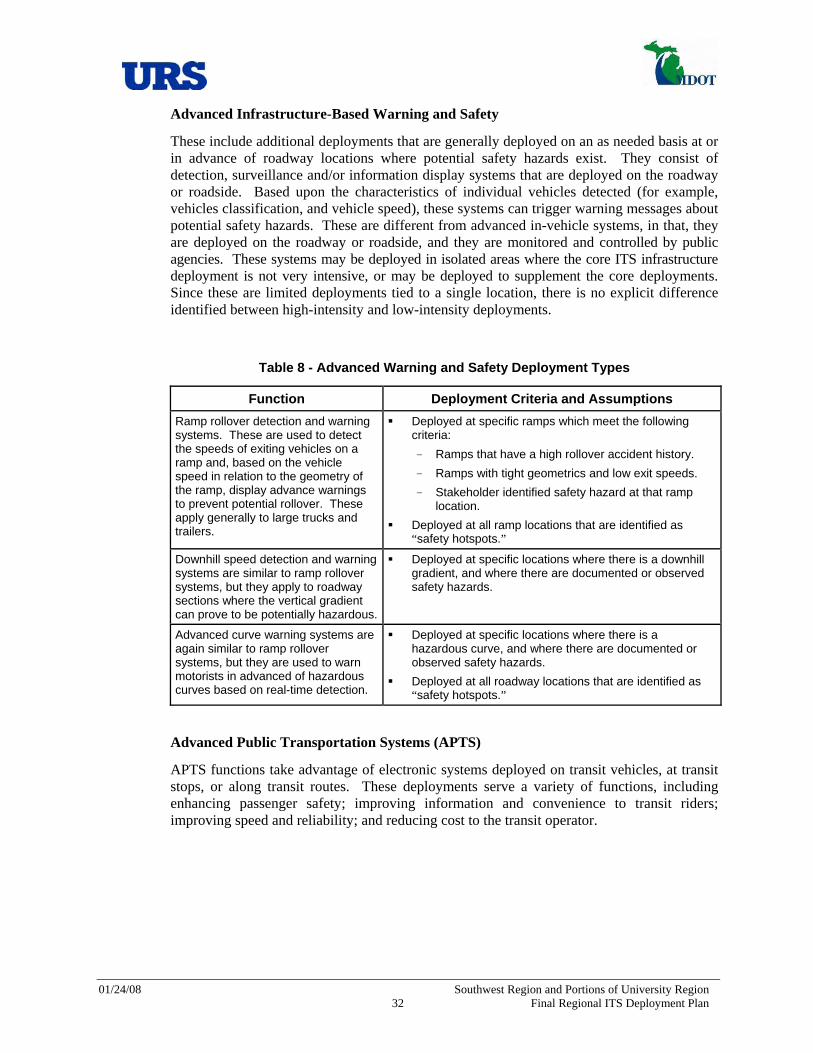
Advanced Infrastructure-Based Warning and Safety
These include additional deployments that are generally deployed on an as needed basis at or in advance of roadway locations where potential safety hazards exist. They consist of detection, surveillance and/or information display systems that are deployed on the roadway or roadside. Based upon the characteristics of individual vehicles detected (for example, vehicles classification, and vehicle speed), these systems can trigger warning messages about potential safety hazards. These are different from advanced in-vehicle systems, in that, they are deployed on the roadway or roadside, and they are monitored and controlled by public agencies. These systems may be deployed in isolated areas where the core ITS infrastructure deployment is not very intensive, or may be deployed to supplement the core deployments. Since these are limited deployments tied to a single location, there is no explicit difference identified between high-intensity and low-intensity deployments.
Table 8 - Advanced Warning and Safety Deployment Types
Function Deployment Criteria and Assumptions Ramp rollover detection and warning systems. These are used to detect the speeds of exiting vehicles on a ramp and, based on the vehicle speed in relation to the geometry of the ramp, display advance warnings to prevent potential rollover. These apply generally to large trucks and trailers.
Deployed at specific ramps which meet the following criteria: - Ramps that have a high rollover accident history. - Ramps with tight geometrics and low exit speeds. - Stakeholder identified safety hazard at that ramp
location. Deployed at all ramp locations that are identified as
“safety hotspots.”
Downhill speed detection and warning systems are similar to ramp rollover systems, but they apply to roadway sections where the vertical gradient can prove to be potentially hazardous.
Deployed at specific locations where there is a downhill gradient, and where there are documented or observed safety hazards.
Advanced curve warning systems are again similar to ramp rollover systems, but they are used to warn motorists in advanced of hazardous curves based on real-time detection.
Deployed at specific locations where there is a hazardous curve, and where there are documented or observed safety hazards.
Deployed at all roadway locations that are identified as “safety hotspots.”
Advanced Public Transportation Systems (APTS)
APTS functions take advantage of electronic systems deployed on transit vehicles, at transit stops, or along transit routes. These deployments serve a variety of functions, including enhancing passenger safety; improving information and convenience to transit riders; improving speed and reliability; and reducing cost to the transit operator.

01/24/08 Southwest Region and Portions of University Region 33 Final Regional ITS Deployment Plan
Table 9 - APTS Deployment Types
Function High-Intensity Deployment Low-Intensity Deployment Electronic fare payment
Fare card and readers deployed throughout system, can be connected to park-and-ride payment system or used to pay for other goods and services (Smart card)
Fare card and readers deployed throughout system
Automatic Vehicle Location (AVL)
All transit vehicles equipped with AVL. Vehicle locations monitored by central transit monitoring center. Communication links provided so that data can be used for traffic management system.
AVL used only on most heavily traveled routes or in largest divisions. Vehicle locations monitored by central transit monitoring center.
Transit safety systems
All transit vehicles equipped with incident monitors. Incidents detected by central transit monitoring center.
Incident monitors provided on new transit vehicles, or vehicles serving specific routes. Incidents detected by central transit monitoring center.
Advanced routing for demand responsive transit
Para-transit routing controlled in real-time by central AVL enhanced dispatching. Communication links provided so that data can be used for traffic management system
Para-transit routing controlled in real-time by central AVL enhanced dispatching. May be limited to certain routes and services.
Advanced transit vehicle monitoring/ maintenance
All transit vehicles equipped with vehicle status/driver condition monitors. Vehicle status monitored by central transit monitoring center.
Vehicle status/driver condition monitors limited to certain routes and services. Vehicle status monitored by central transit monitoring center.
Enhanced transit information
Real-time vehicle location and time to arrival provided both at stops and in-vehicle
Real-time vehicle location and time to arrival provided at a limited number of high-volume stops
Emergency/Service Vehicle Dynamic Routing
Functions in this grouping take advantage of AVL equipment and the availability of real-time traffic information to improve the dispatching – and hence arrival time, utilization, and level of service – of service and emergency vehicles. Since this technology would be applied to all vehicles in a fleet, or division, there is no distinction made between high-intensity and low-intensity deployment.
Table 10 - Emergency Vehicle Deployment Types
Function Deployment Emergency and service vehicle AVL
All emergency and service vehicles equipped with AVL devices.
Computer aided real-time dispatch
Vehicle location and status monitored to provide optimum real-time dispatching

01/24/08 Southwest Region and Portions of University Region 34 Final Regional ITS Deployment Plan
Parking Management Systems
In areas with pronounced peaks in demand for parking such as central business districts, park and ride facilities, universities, major medical centers, and sporting and entertainment venues, ITS technologies can provide information on parking cost and availability. Functions in this group help reduce congestion and delay associated with finding or paying for a parking space. It is anticipated that these systems will be implemented primarily through local authorities, financial institutions, and the private sector.
Table 11 - Advanced Parking Management Deployment Types
Function High-Intensity Deployment Low-Intensity Deployment Parking garage status monitoring
All participating garages equipped with occupancy sensors/vehicle counters to determine number and location of available spaces
Participating garages keep track of parking occupancy through sensors or other means and report to local control center
Regional parking availability information
Real-time information on parking status provided through varying channels: To dedicated parking
management DMS at major local decision points
Over Internet for pre-trip planning purposes
To in-vehicle information systems (if available)
Information provided regarding parking availability is static or based on historic data through means similar to those in high-intensity deployment Information delivery mechanisms similar to those used in high-intensity deployment
Automated payment
All participating garages equipped with electronic payment tag readers. Optional service for equipped
vehicles
Same as high-intensity deployment
Weather and Road Condition Monitoring/Management
Road condition monitoring and management functions help traffic managers detect potential weather-related problems and take appropriate measures to minimize the risks to travelers. One of the major benefits in a region such as Southwest is improved efficiency in winter maintenance. This includes both more efficient deployment of resources based on localized weather condition information and tracking and subsequent analysis of materials usage. These functions can be most useful on isolated roadway segments (where weather conditions are not reported as intensively, and response time and cost is greater), or segments with a history of weather-related accidents.

01/24/08 Southwest Region and Portions of University Region 35 Final Regional ITS Deployment Plan
Table 12 - Roadway Weather Information Deployment Types
Function High-Intensity Deployment Low-Intensity Deployment Roadway condition monitoring
Selected segments to be equipped with weather monitoring/forecasting deployments Regular spacing in isolated
areas Targeted monitors for
segments with a history of weather-related accidents
Selected segments to be equipped with weather monitoring/forecasting deployments Targeted monitors only for locations
with a history of weather-related accidents
Motorist warning systems
Selected facilities/segments equipped with DMS and/or Variable Speed Limit Signs to warn motorists of dangerous pavement conditions
Static warning signs or portable DMS used to warn motorists
Centrally controlled road closure gates and alternate route guidance
Remotely controlled barriers can close major ramps on selected isolated roadway segments. Accompanying DMS provide alternate route instructions.
Public safety officials notified through TMC when closure is warranted
Advanced In-Vehicle Technology
The advanced in-vehicle technology grouping takes advantage of assumed private-sector improvements in the passenger vehicle fleet over the project-planning horizon. While many technologies that enhance vehicle safety and functionality already exist in prototype form, modeling the impact of these technologies requires assumptions about the degree of market penetration into the overall passenger fleet. The deployment and market penetration of these advanced in-vehicle technologies is beyond the control of MDOT and other public agencies. However, they can incorporate provisions in their long-term plan to advocate implementation of suitable systems, particularly those related to public safety.

01/24/08 Southwest Region and Portions of University Region 36 Final Regional ITS Deployment Plan
Table 13 - Advanced In-vehicle Deployment Types
Function Deployment In-vehicle traveler information devices. (In the long term in-vehicles information may begin to phase-out traditional roadside information systems such as DMS or road signs.)
In-vehicle safety warnings to detect hazardous roadway/pavement conditions
Enhanced driver vision to enhance the driver’s view of the roadway, or potential obstacles
Driver condition monitoring to detect the driver’s ability to operate the vehicle safely
Collision avoidance systems to prevent longitudinal, lateral, and roadway departure collisions
In-vehicle mayday systems that either deploy automatically in case of an accident, or can be used to automatically notify public safety or emergency response agencies at the push of a button
Information collected by the public sector for traffic management can help support in-vehicle travel information services provided by private firms
Mayday system connected to public safety and transportation agencies can help to expedite response
2.4 Evaluation of Alternatives
2.4.1 Evaluation Criteria
Evaluation of the alternatives is based on several criteria, including:
Local Stakeholder Input
Experience with ITS deployments in rural areas and small cities is far less extensive than in congested urban areas. As a result, an understanding of local requirements and performance expectations becomes more critical to the evaluation of alternatives. As documented earlier in this section, an extensive stakeholder process was used to help identify needs, define projects, and determine priorities. The process was effective in bringing in a wide range of stakeholders. Through a series of meetings, stakeholders provided a clear set of priorities for the Southwest Region and portions of the University Region:
Traffic and Road Condition Information – This is a critical need for the economy of the region, particularly as it moves toward a more tourist-based economy and is very reliant on the trucking industry for basic delivery of everyday goods and services. Services that help clear incidents and provide information on traffic conditions and alternative routes are considered a high priority need. A variety of informational services have been identified to let the public know of dangerous conditions and unexpected delays. Many of these options build upon existing services.
Safety – Winter weather in the region is severe and can vary dramatically within a relatively small area. Improved weather information is considered essential to provide faster clearance of snow and ice, and to provide motorists with more detailed information on roadway weather conditions. Roadway closures are

01/24/08 Southwest Region and Portions of University Region 37 Final Regional ITS Deployment Plan
frequent in certain locations and it is critical to the safety of both travelers and employees that this information is provided as quickly as possible to the public.
Winter maintenance – The majority of MDOT’s regional maintenance budget is spent during the winter. Many MDOT roads are cleared by County Road Commissions and there is a need for better real-time coordination between MDOT and County maintenance crews. Improved information on pavement conditions is also considered a high priority.
Compatibility with MDOT Programs and Projects
One of MDOT’s objectives in developing regional ITS architectures and deployment plans was to provide a common framework across the State. In addition, projects will need to be compatible with the statewide ATMS software that is being developed under a separate contract. MDOT wants to assure that systems developed at the regional level are compatible with statewide requirements. There is also a need to coordinate projects between regions. Technologies and deployment intensity across the corridor should be similar in all regions.
With a limited budget available, projects that can be implemented as part of the overall capital program may receive a higher priority for implementation. These projects can be implemented more cost-effectively and possibly take advantage of other funding sources.
The budget of the ITS statewide program will have a major impact on project implementation. With a current budget of $12 million per year, initial capital costs as well as long term operation and maintenance requirements will have a major impact on feasibility. Larger projects will need to be phased in over a period of time, meaning that interim deployments should be able to show some benefit on their own.
Benefit/Cost Analysis
Using the IDAS model benefits and costs for various ITS deployments, “packages” have been developed. Detailed evaluation criteria include:
Benefits, including:
- Impacts on recurring and non-recurring congestion (mobility savings and travel time reliability savings);
- Safety (accident reduction);
- Operating costs (fuel and operating savings); and
- Emissions reductions.
Life-cycle costs, including capital and operating and maintenance (O&M) costs for both public and private sectors.
2.4.2 Technical Evaluation Process
This section describes the methodology used to conduct this technical evaluation which included several objectives:
To quantitatively assess the benefits and costs of each alternative;
To refine alternatives based on benefit-cost analysis;
To develop viable projects for implementation; and

01/24/08 Southwest Region and Portions of University Region 38 Final Regional ITS Deployment Plan
To provide guidance on deployment decisions.
The tools used also provide information that can be used to:
Estimate implementation timeframe and resource requirements; and
Documentation for transition into design and implementation.
2.4.2.1. IDAS Description
The most important quantitative tool used in the evaluation was the ITS Deployment Analysis System (IDAS). This software package was used to conduct the benefit-cost analysis of identified ITS improvements. IDAS is a sketch-planning software and analysis methodology developed by Cambridge Systematics for the Federal Highway Administration (FHWA).
IDAS was developed to assist state, regional, and local agencies in integrating ITS into the transportation planning process. Planners and others can use IDAS to calculate relative costs and benefits of ITS investments. IDAS currently predicts costs, benefits, and impacts for more than 60 types of ITS investments that are shown in Table 14. These ITS components can be deployed in combination or isolation.
In order to be consistent with current transportation planning processes, IDAS operates as a post-processor to travel demand models used by Metropolitan Planning Organizations (MPO) and by state DOTs. IDAS, although a sketch-planning tool, can implement the modal split and/or traffic assignment steps associated with a traditional planning model. These are key steps in estimating the changes in modal, route, and temporal decisions of travelers resulting from ITS technologies.
The checked items shown on Table 14 are those for which IDAS was applied during the project. Other projects, such as Advanced Vehicle Control and Safety Systems, are being developed at the statewide level as part of the VII program, but could not be analyzed with IDAS at the region al level. The 2010 MDOT Statewide Travel Demand model served as the basis for this analysis.
The set of impacts evaluated by IDAS included changes in user mobility, travel time/speed, travel time reliability, fuel costs, operating costs, accident costs, emissions, and noise. The performance of selected ITS options can be viewed by market sector, facility type, and district. The district function was used in this project to produce data for the study area sectors. Given the diverse types of performance measures that may be impacted by ITS and the desirability of providing a comprehensive analysis tool, IDAS is comprised of five different analysis modules as shown in Figure 19.

01/24/08 Southwest Region and Portions of University Region 39 Final Regional ITS Deployment Plan
Table 14 - ITS Components Assessed in IDAS
1. Arterial Traffic Management Systems Isolated Traffic Actuated Signals Preset Corridor Signal Coordination Actuated Corridor Signal Coordination Central Control Signal Coordination Emergency Vehicle Signal Priority Transit Vehicle Signal Priority
2. Ramp Control Freeway Management Systems
Preset Ramp Metering Traffic Actuated Ramp Metering Centrally Controlled Ramp Metering
3. Advanced Public Transit Systems
Fixed Route Transit – Automated Scheduling System
Fixed Route Transit – Automated Vehicle Location
Fixed Route Transit – Combination of Automated Scheduling System and Automated Vehicle Location
Fixed Route Transit – Security Systems Paratransit – Automated Scheduling System Paratransit – Automated Vehicle Location Paratransit – Combination of Automated
Scheduling System and Automated Vehicle Location
4. Incident Management Systems
Incident Detection/Verification Incident Response/Management Combination of Incident
Detection/Verification/Response/Management 5. Electronic Payment Collection Systems
Electronic Transit Fare Payment Basic Electronic Toll Collection
6. Railroad Grade Crossing Monitors
Railroad Grade Crossing Monitors 7. Emergency Management Services
Emergency Vehicle Control Service Emergency Vehicle Automated Vehicle
Location In-Vehicle Mayday System
8. Regional Multimodal Traveler Information Systems
Highway Advisory Radio Freeway Dynamic Message Sign Transit Dynamic Message Sign Telephone-Based Multimodal Traveler
Information System Web/Internet-Based Multimodal Traveler
Information System Kiosk with Multimodal Traveler Information Kiosk with Transit-Only Traveler Information Handheld Personal Device – Traveler
Information Only Handheld Personal Device – Traveler
Information with Centralized Route Guidance In-Vehicle – Traveler Information Only In-Vehicle – Traveler Information with
Centralized Route Guidance 9. Commercial Vehicle Operations
Electronic Screening Weigh-in-Motion Electronic Clearance – Credentials Electronic Clearance – Safety Inspection Combination Electronic Screening and
Clearance Safety Information Exchange On-Board Safety Monitoring Electronic Roadside Safety Inspection Hazardous Materials Incident Response
10. Advanced Vehicle Control and Safety Systems
Motorist Warning – Ramp Rollover Motorist Warning – Downhill Speed Longitudinal Collision Avoidance Lateral Collision Avoidance Intersection Collision Avoidance Vision Enhancement for Crashes Safety Readiness
11. Supporting Deployments
Traffic Management Center Transit Management Center Emergency Management Center Traffic Surveillance – CCTV Traffic Surveillance – Loop Detector System Traffic Surveillance – Probe System Basic Vehicle Communication Roadway Loop Detector Roadway Weather Information System Drawbridge Management System Parking Management System

01/24/08 Southwest Region and Portions of University Region 40 Final Regional ITS Deployment Plan
Figure 19 - IDAS Model Structure
Benefits Module
• IDAS control alternative assignment • Mode choice • Temporal choice • Induced/foregone demand
• IDAS ITS option assignment • Mode choice • Temporal choice • Induced/foregone demand
Travel Time/Throughput
Environment
Safety
D Traditional benefit measures D Non-traditional benefit measures
User Input
Alternatives Generator 4
Alternatives Comparison Module
Cost Module
Outputs
• Performance measures • Cost/benefit analysis • Sensitivity analysis • Ranking of ITS options • Risk analysis • Plots of link volumes
and speeds
6
7
5
5.2
5.3
5.4
Input/Output Interface 3
Travel Demand Model Data
Benefit Valuation
Travel Time Reliability 5.5

01/24/08 Southwest Region and Portions of University Region 41 Final Regional ITS Deployment Plan
2.4.2.2. IDAS Inputs and Default Values
Table 15 - Comparison of Impact Values Used for IDAS Analysis
Deployment Benefit Parameter Reduction in incident duration 20%
Reduction in fuel consumption 1%
Freeway Service Patrols
Reduction in fatality rate 1%
Traffic Signal Progression
Capacity improvement on impacted links 11%
Applied to only days with more than 1” of snow
27
Reduction in travel time 3%
Reduction in crashes 10%
Roadway Weather Information Systems
Reduction in winter maintenance costs 7% without AVL 10% with AVL
Amount of time useful information is displayed
10%
Percent of travelers responding to information
28%
Time saved per traveler 11 minutes
Smart Work Zones
Additional travel time impacts from rerouting of traffic due to work zone capacity reductions
Impacts dependent on
specific roadway volumes and
alternative routes
APTS CAD and AVL
Operating Cost Savings 5%
Table 16 includes the monetized values of the benefit parameters used in this analysis. The parameters were developed by FHWA in 1995 and have been inflated to 2010 using a 3% annual inflation rate. The one exception was the price of fuel, which significantly exceeded the 3% inflation rate. This cost was raised to $3/gallon.

01/24/08 Southwest Region and Portions of University Region 42 Final Regional ITS Deployment Plan
Table 16 - Monetary Values of IDAS Default Parameters
Benefit Parameters
Parameter Values
Number of travel days in a year 247
Year of $ values 2010
Inflation Rate 3%
Value of In-vehicle time $15.00
Value of In-vehicle time (commercial) $26.42
Value of Out-of-vehicle time (commercial) $26.49
Value of time multiplier for Emergency Vehicle 30.0
Value of Out-of-vehicle time $26.49
Value of reduced delay time $45.03 Fuel Costs (gallon) $3.00
Emissions Costs ($/ton)
HC/ROG $2,763.83
NOX $5,812.78
CO $6,058.94
PM10 $17,240.47
CO2 $5.55
SO2 $5.55 GW $0.00
Internal Fatality $3,610,430.58
Injury $79,082.43
Property damage $4,399.70
External Fatality $637,133.89
Injury $13,956.27
Property damage $775.87
Non-Fuel operating costs ($/mile) $0.10
Noise Damage Costs ($/mile) $0.0011
Other mileage based ($/mile) $0.00
Other non-mileage based ($/mile) $0.00
Accident Costs
Cost of winter Maintenance ($/mile) $2,000.00
Figure 20 shows how individual elements of the ITS systems are deployed on links of the network in IDAS. In this case, three phases of RWIS deployment in the Superior Region are shown. Other ITS deployments are added to the transportation network in this fashion in order to create an alternative that can be modeled in IDAS.

01/24/08 Southwest Region and Portions of University Region 43 Final Regional ITS Deployment Plan
Figure 20 - Sample IDAS Representation of RWIS Deployment
Once an alternative is defined, the analysis procedures are initiated to estimate the incremental costs and benefits of ITS improvements. These benefit-cost results can then be compared with other alternatives defined and analyzed in the IDAS software. Summaries of project benefits and costs for each deployment package are shown in Section 4. In order to simplify the results, impacts were collapsed into four categories for purposes of presentation. These are shown below in Table 17.
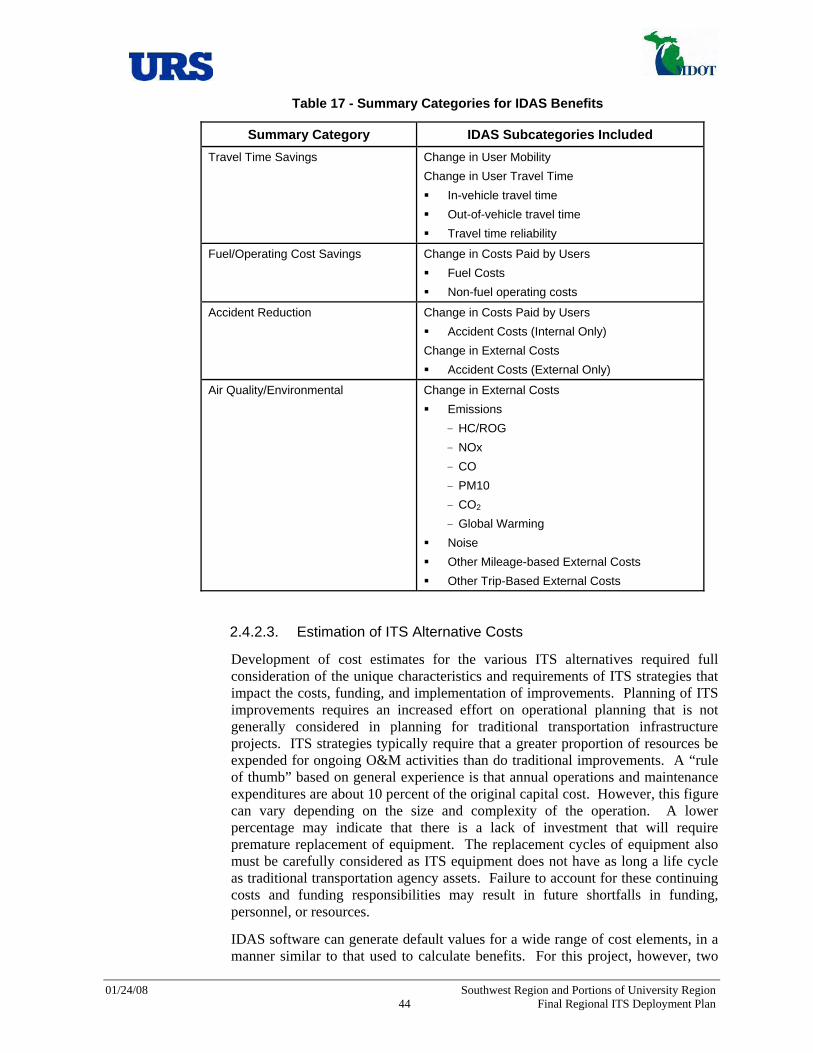
01/24/08 Southwest Region and Portions of University Region 44 Final Regional ITS Deployment Plan
Table 17 - Summary Categories for IDAS Benefits
Summary Category IDAS Subcategories Included Travel Time Savings Change in User Mobility
Change in User Travel Time In-vehicle travel time Out-of-vehicle travel time Travel time reliability
Fuel/Operating Cost Savings Change in Costs Paid by Users Fuel Costs Non-fuel operating costs
Accident Reduction Change in Costs Paid by Users Accident Costs (Internal Only)
Change in External Costs Accident Costs (External Only)
Air Quality/Environmental Change in External Costs Emissions
- HC/ROG - NOx - CO - PM10 - CO2 - Global Warming
Noise Other Mileage-based External Costs Other Trip-Based External Costs
2.4.2.3. Estimation of ITS Alternative Costs
Development of cost estimates for the various ITS alternatives required full consideration of the unique characteristics and requirements of ITS strategies that impact the costs, funding, and implementation of improvements. Planning of ITS improvements requires an increased effort on operational planning that is not generally considered in planning for traditional transportation infrastructure projects. ITS strategies typically require that a greater proportion of resources be expended for ongoing O&M activities than do traditional improvements. A “rule of thumb” based on general experience is that annual operations and maintenance expenditures are about 10 percent of the original capital cost. However, this figure can vary depending on the size and complexity of the operation. A lower percentage may indicate that there is a lack of investment that will require premature replacement of equipment. The replacement cycles of equipment also must be carefully considered as ITS equipment does not have as long a life cycle as traditional transportation agency assets. Failure to account for these continuing costs and funding responsibilities may result in future shortfalls in funding, personnel, or resources.
IDAS software can generate default values for a wide range of cost elements, in a manner similar to that used to calculate benefits. For this project, however, two