SOUTHERN RHODESIA ALONE? : A look at the economic consequences
20
SOUTHERN RHODESIA ALONE? A look at the economic consequences MICHAEL FABER THE PURPOSE OF this study is to estimate what the effects of a dissolution of the Federation of Rhodesia and Nyasaland would bc upon the economy of Southern Rhodesia. It should be stressed immediately that, although a great many figures are employed, this paper is not a statistical cxercise. It is an exercise in estimating hypothetical effects, whose magnitude can be indicated only by economic (as opposed to statistical) arguments. On such a controversial matter, it is not to be expected that these estimates will meet with unanimous acceptance. Nevertheless, the method outlined in this paper should still provide A relatively simple method of working out what the effect of any alternative estimates would be upon the posi- tion of “Southern Rhodesia Alone”. The method adopted is to identify what happened economically within Southern Rhodesia during 1959, to estimatc what would have happened had the territory seceded at the beginning of the year, and to exprcss the differences in ultimate output and incomes in terms of percentages. It is thereafter possible to consider whether tlie percentage effects would be substantially different or not if the hypo- thetical secession were to occur at the beginning of any other year. The problems encountered are of two main kinds. First, statistics for Southern Rhodesia are frequently not published (or even calculated) separately from those of the rest of the Federation, and therefore have to be estimated indirectly. Second, therc is no sure way of knowing what the precise reaction of foreign investors would be in the event of dissolution, nor of knowing what decisions would be reached by ncgotiation on such matters as the allocation of foreign exchange reserves and of Fedcral government Liabilities. The best that one can do on these issucs, thercfore, is to makc one’s own assumptions cxplicit, support them with reasons, and invite reasoned disagreement. The procedure employed is as follows. First an estimate is made of tlie situation on international current and capital account, with a view to finding out what contraction in imports will be required. Sccond, an estimate is made of the savings that would be available to finance investment. Third, an estimate is made of the government revenue that would be available for expenditure. When these three “subsidiary equations” have been estimated, it is possible to make estimates of what the domestic product and national income would be, and of the distribution of tila national income between different types of earners. 283
-
Upload
michael-faber -
Category
Documents
-
view
212 -
download
0
Transcript of SOUTHERN RHODESIA ALONE? : A look at the economic consequences
SOUTHERN RHODESIA ALONE? A look at the economic consequences
MICHAEL FABER
THE PURPOSE OF this study is to estimate what the effects of a dissolution of the Federation of Rhodesia and Nyasaland would bc upon the economy of Southern Rhodesia. I t should be stressed immediately that, although a great many figures are employed, this paper is not a statistical cxercise. It is an exercise in estimating hypothetical effects, whose magnitude can be indicated only by economic (as opposed to statistical) arguments. On such a controversial matter, it is not to be expected that these estimates will meet with unanimous acceptance. Nevertheless, the method outlined in this paper should still provide A relatively simple method of working out what the effect of any alternative estimates would be upon the posi- tion of “Southern Rhodesia Alone”.
The method adopted is to identify what happened economically within Southern Rhodesia during 1959, to estimatc what would have happened had the territory seceded at the beginning of the year, and to exprcss the differences in ultimate output and incomes in terms of percentages. It is thereafter possible to consider whether tlie percentage effects would be substantially different or not if the hypo- thetical secession were to occur at the beginning of any other year.
The problems encountered are of two main kinds. First, statistics for Southern Rhodesia are frequently not published (or even calculated) separately from those of the rest of the Federation, and therefore have to be estimated indirectly. Second, therc is no sure way of knowing what the precise reaction of foreign investors would be in the event of dissolution, nor of knowing what decisions would be reached by ncgotiation on such matters as the allocation of foreign exchange reserves and of Fedcral government Liabilities. The best that one can do on these issucs, thercfore, is to makc one’s own assumptions cxplicit, support them with reasons, and invite reasoned disagreement.
The procedure employed is as follows. First an estimate is made of tlie situation on international current and capital account, with a view to finding out what contraction in imports will be required. Sccond, an estimate is made of the savings that would be available to finance investment. Third, an estimate is made of the government revenue that would be available for expenditure. When these three “subsidiary equations” have been estimated, it is possible to make estimates of what the domestic product and national income would be, and of the distribution of tila national income between different types of earners.
283

T H E S O U T H A F R I C A N J O U R N A L O F ECONOMICS
Southern Rhodesia's earnings on international current account are made up of payments for goods and services exported, incomo receipts, and various transfers and remittances. Exports which left the Federal area, most of which were agri- culturol or mineral products, are easy to trace and identify. But if Southcrn Rho- dcsia wcre on its own, exports of manufactures and service earnings in Northern Rhodesia and Nyasaland would also count as foreign earnings. These are not separately identified in official trade figures, and they can only be estimated indi- rectly by refcrring to the trade figures of 1953, and then extrapolating from there by means of indirect indicators, and from a knowledge of what has been happening in the economies of the three territories. Table I (a) shows an estimate of Southern Rhodesia's export earnings as they were in 1953, and as thcy would have appeared, presented in the same manner, in 1959.
TABLE I (a): SOUTI~ERN RHODESIAN EXPORTS (Including exports to Northern Rhodesia and Nyasaland)
f million
1953 1959 Tobacco . . . . . . . . . . . . . . . . 18 32.0 Hides . . . . . . . . . . . . . . . . I 1.1 Maize . . . . . . . . . . . . . . . . - 1.6 Meat . . . . . . . . . . . . . . . . - 1.7 Wattle . . . . . . . . . . - -6 Other a&&ural p;oducc . . . . . . . . . . 1 - 5 Gold . . . . . . . . . . . . . . . . 6.5 6.9 Asbutor . . . . . . . . . . 6.5 7 -1 chrome and' icrrAiAme' . . . . . . . . . . . 3 4.9 coal . . . . . . . . . . . . . . . . I 1.3 Copper, tunmten, lithium, etc. . . . . . . . . . . I 2.5 Manufactures, ctc. . . . . . . . . . . . . 1s 27.0 (21)
TOTALVIUBUIEXPORTS . . . . . . 53 87.2 (81) - - -
Some justification is needed for the estimate of manufactured exports at f 27 million. In the years immediately before Federation, Southern Rhodesian exports of merchandise were becoming an increasingly important component of total Southern Rhodesian exports. At the same time, imports of merchandise from Southern Rhodesia were becoming an increasingly important component in total Northern Rhodesian imports, as is sliown by the fact that between 1949 and 1953, the total of Northern Rhodesian payments on international account rose by 215 per cent, while the value of merchandise imports from Southern Rhodesia rose by 250 per cent. It should be noted that the exports from Southern to Northern Rhodesia cited above include re-exports as well as Southern Rhodesian manufac- tures. Although Southern Rhodesian inanufactures may be assumed to have comprised an increasing proportion of these goods, they still formed little over 50 per cent by 1953, as is shown by the figures in Table I (b).
If we assume, as a hypothesis, that the percentage of Southern Rhodesian current receipts dcrived from exports of goods to Northern Rhodesia continued to
284

S O U T H E R N R H O D E S I A A L O N E - T H E E C O N O M I C C O N S K Q U E N C E S
increase at the rate of 1 per cent per annum, lhis source of earnings would have reached 22 per cent of total Southern Rhodesian current earnings by 1959. Anti- cipating our other tables, we would then find that El01 million represented 78 per cent of total Southcrn Rhodesian current earnings, and that the remaining 22 per cent would equal €28.5 million. If we make the further assumption that Southern Rhodesian manufactures had increased from just over half to just under three-quarters of these goods, we arrive at a first approximation of the value of Southern Rhodesian manufactures exported to Northern Rhodesia at €2 I .5 million. This is almost certainly somewhnt on the high side, not only because of the opti- mistic assumptions made above, but also because the Northern Rhodesian economy was expanding faster in the years immediately prcceding Federation than it has done in the years since.
TABLE I (b): NORTHERN RHODESIAN IMPORTS OF GOODS FROM %UTkIERN RHODESIA
1949 1950 1951 1952 1953 I . Merchandise imports (fm) . . . . 5.9 7.4 10.0 12.0 14.6 2. Percentage incrcase each year , . 25% 23% 20% 20% 3. Goods to N.R. as percentage of
tolalS.R.current recerpls .. .. 14% 13% 14% 15% 16% 4. S.R. manufactures only (h) . . 7.5
The same item can also be estimated as follows. Since Federation, Southern Rhodesian gross manufacturing output has increased in value at an average annual rate of 16 per cent. The common market created with Federation, combined with protective tariffs and other factors previously at work, may have allowed Southern Rhodesia to expand her manufactured exports to Northern Rhodesia faster than her supplies to tlie local market. On the other hand, Northern Rhodesian industrial output has grown even faster than Southern Rhodesia’s, and will have tended to replace goods previously imported from Southern Rhodesia. If we assume exports of manufactures to Northern Rhodesia to have increased since Federation at 16 per cent per annum, the multiple increase by 1959 would have been 2.2. If we assume an annual rate of increase of 20 per cent, then the multiple becomes apptox- imately 3.0. The first rate ofincrease would suggest a figure for 1959 of E16.5 million, and the second a figure of €22.5 million. Taking this method of approximation in conjunction with the previous method, it is suggested that a figure of €19.5 million is reasonable as ail estimate of Southern Rhodesian manufactures exported to Northern Rhodesia in 1959.
Prior to Federation, exports of goods from Southern Rhodesia to Nyasaland had been static at about El million for three years. Again, not more than half of these goods can be assumed to have been local manufactures. On tlie other hand, the extraction of Nyasaland from the provisions of the Congo Basin Treaty and the raising of protective tariffs have certainly led to a considerable substitution of Southern Rhodesian manufactured goods in the Nyasaland market for goods
285

THE S O U T H A F R I C A N J O U R N A L O F E C O N O M I C S
previously manufactured in India and Hong Kong. This substitution effect, taken in conjunction with the overall increase in personal incomes in Nyasnland, suggests that the value of Southern Rhodesian manufactures taken by Npitland in 1959 may have been approximately f 2 million. Manufactures exported to countries outside the Federation are identifinble from the trade figures and amounted to f3.5 million. Finally, in arriving at the total, a further item of f 2 million has been included to cover other goods exported to Northern Rhodesia and Nyasaland, not elsewhere specified.
The figure of f27 million thus obtained brings thc estimated earnings of South- ern Rhodesian exports in 1959 to just over f87 million. But if Southern Rhodesia left the Federation, export earnings would be affected in several ways. To begin with, the territory’s exports would no longer enjoy duty free entry into thc markets of Northern Rhodesia aiid Nyasaland, unless the structure of a free trade area was maintained while the political ties were dissolved, an arrangement that would be extremely unlikely to endure for long. Apart from that, some firms which manufacture mostly for the Southern Rhodesian homc market but which export marginally, would find theniselves forced to close down as a result of economic contraction within Southern Rhodesia, with a consequent loss of their contribution to exports. There might, on the other hand, be some few firins who found themselves in a position to export more as a result of contraction in home demand. And there might also be some extra assistance afforded to Southern Rhodesian industry for political reasons by the South African government. But the extent to which this could be done without harniing South Africa’s own industries is small.
Thero is no reason why Soutlicrn Rhodesia’s exports of agricultural and mineral products should be affected by secession, but manufactured exports to the present “northern territories” would be substantially reduced, even if there was no deli- berate boycott movement instituted. For the purpose of this study, it may be assunicd that exports to tlic “northern territories” would bc reduced by about 25 per cent (or f 6 million), with the reservation that - in the long run - this would almost certainly prove to be an under-estimate. As a result of this subtrac- tion, however, export earnings of “Southern Rhodesia Alone” are estimated at f 8 1 million.
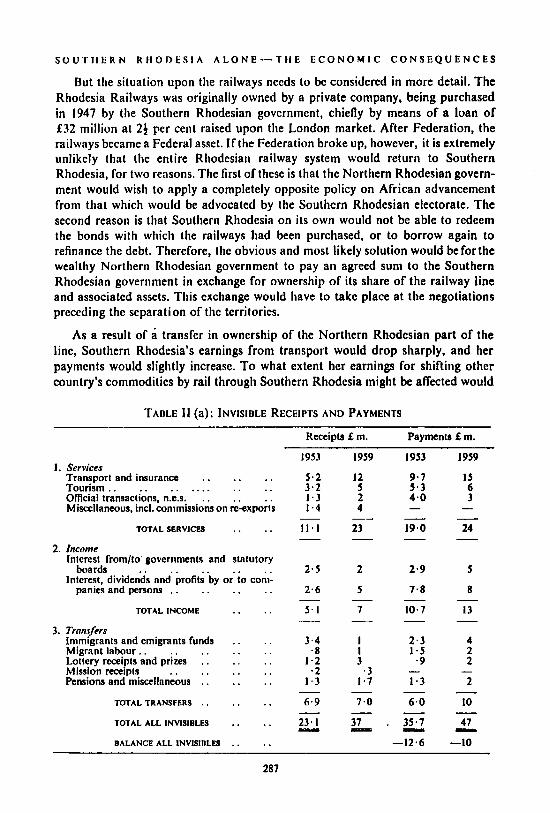
No estimates have been prepared covering “invisible” receipts and payments as they might have been presented in the accounts for Soullicrri Rhodesia in 1959, with the territory still a member of the Federation. Instead we have moved straight from the position as it was in 1953 to what it might have been in 1959 with Southern Rhodesia outside the Federation. I t will be seen that transport earnings have bccii estimated to have risen from f5.2 million to f12 million. The basis of this estimate rests partly in the great expansion of the insurance industry centred on Salisbury, partly on the great expansion of air travel (assuming Central Africa Airways to remain a Southern Rhodesian asset), but chiefly on the increase in cariiing power of the Rhodesian Railways, following the iiivestment that has gone into the service and the rise in the value of goods carried.
286
S O U T I I E R N R t i 0 D ES I A A L O N E - T t I E E C O N 0 M I C C O N S E Q U E N C E S
But the situation upon the railways needs to be considered in more detail. The Rhodesia Railways was originally owned by a private company, being purchased in 1947 by the Southern Rhodesian government, chiefly by means of a loan of f32 million at 24 per cent raised upon the London market. After Federation, the railways became a Federal asset. If the Federation broke up, however, it is extremely unlikely that the entire Rhodesian railway system would return to Southern Rhodesia, for two reasons. The first of these is that the Northern Rhodesian govern- ment would wish to apply a completely opposite policy on African advancement from that which would be advocated by the Southern Rhodesian electorate. The second reason is that Southern Rhodesia on its own would not be able to redeem the bonds with which the railways had been purchased, or to borrow again to refinance the debt. Therefore, the obvious and most likely solution would be for the wealthy Northern Rhodesian government to pay an agreed sum to the Southern Rhodesian government in exchange for ownership of its share of the railway line and associated assets. This exchange would have to take place at the negotiations preceding the separation of the territories.
As a result of a transfer in ownership of the Northern Rhodesian part of the line, Southern Rhodesia's earnings from transport would drop sharply, and her payments would slightly increase. To what extent her earnings for shifting other country's commodities by rail through Southern Rhodesia might be affected would
TADLE 11 (a): INVISIBLE RECEIPTS AND PAYMENTS
Scr vices Transport and insurance . . . . . . Tourism . . . . . . . . . . . . . . Official transaclions. n.e.s. . . . . . . Miscellaneous, incl. conimissions on rccxporls
TOTALSERVICES . . . . Income Interest frornlto. governments and statutory
boards Interest. dividends and profits 'by or'io con,:
panics and persons . . . . . . . . TOTAL INCOME . . . .
Trmsfers Immigrants and emigrants funds . . . . Migrant labour.. . . . . . . . . Lottery receipts and prizes . . . . . . Mission receipts . . . . . . . . Pensions and niiscellaneous . . . . . .
TOTALTRANSFERS . . . . . . TOTAL ALL INVISIBLES . . . . BALANCE ALL 1NVlSllILES . . . .
Receipts f m. Payments t m. 1953 1959 1953 I959
5 . 2 12 9.1 I5 3 . 2 5 5.3 6
4.0 3 1 .3 2 1.4 4
19.0 24 1 1 . 1 23
- - - - - --
- - - -
4 2 2
2
10
41
-I0
- - - p=c
281

T H E S O U T I I A F R I C A N J O U R N A L OF E C O N O M I C S
depend upon (a) whether Northern Rhodesia tried to divert a part of her copper shipments from Beira to Lobito Bay, and (b) whether the Northern Rhodesian government - which would soon be dominated by Africans, decided to implement a boycott of South African goods.
One other item under “Services” needs explanation. “Re-exports~’ have not been counted in the export totals, nor, in the import table, have goods imported through one territory but destined for another been included in the estimates of “retained imports”. Instead, an estimate for commissions earned on re-exports has been included in the service earnings. These commissions have been assumed to be 10 per cent, which would include warehousing and handling charges. Taking all service receipts and payments together, Table I1 (a) shows the deficit on service transactions to fall from f7.9 million in 1953 to only El million in 1959. In line with the assumptions manifested in the table, this conclusion must be considered rather an optimistic one from Southern Rhodesia’s viewpoint.
When we exaniine international income receipts and payments, especially those on public account, some similar problems are encountered. The Public Debt situation of the Federal Government, as at 30th June, 1960 is shown in Table I t (b).
TABLE I1 (b): SUMMARY OF FEDERAL GOVERNMENT PUBLIC DEBT
1. Federal Government Direct Borrowings (a) External funded . . . . . . (b) Internal funded . . . . . . (c) Kariba Project loans . . . . . . (d) Internal floating . . . . . .
2. Assumed from Southern Rhodesia Governmcnt (a) External funded . . . . . . (b) Internal funded . . . . . .
3. Assumed from Northern Rhodesia Government (a) External funded . . . . . . (b) Internal funded . . . . . . (a) External funded . . . . . .
Total . . . . . .
4. Assumed from Nyasnland Government
. . . . . . . . . . . . . . . .
. . . . . . . .
. . . . . . . .
. . . .
. . . .
.. .. .. * . .. .. .. .. .. ..
E million
. . . . 50.0 . . . . 49.2 . . . . 21.6 . . . . 23.1
. . . . 67. I . . . . 6.6
. . . . 19.3 . . . . 1 . 1
. . . . 5.3
. . . . 243.3 -
Of this debt, Southern Rhodesia might be expected to re-assume her own debts incurred prior to 1954, and on top of that her share of the Fcderal debt associated with asscts constructed within Southern Rhodesia. However the allocation of sucli debts (as well as the division of assets) would certainly be the object ofhard and bitter negotiation. We have already indicatcd that the railway line would probably be divided between Northern and Southern Rhodesia, with Northern Rhodesia taking over from Southern Rhodesia some of the debt incurred in the development of the line. The Kariba debt would have to be dealt with in a different way. This debt is guaranteed (as are all Federal debts) by the British government. The dis-
288

S O U T H E R N R H O D I l S I A A L O N E - T H E E C O N O M I C C O N S E Q U E N C E S
memberment of the Federation would most probably result in a solution which would leave the Kariba project to be operated by a Power Board upon which both Southern and Northern Rhodesian governments would be represented, with British representatives having the controlling votes. As the project was set up to be self-financing, with interest and amortization to be repaid from earnings, the Kariba dcbt would not have to be incurred by either government. Indeed, the Kariba project itself might well have to take over some of the debt previously financed by appropriations from the Federal government development account.
But even after re-allocating the railway debt, and placing the complete Kariba debt to a spccial account, the Southern Rhodesian share of the Federal Govern- ment debt incurred since 1954 would still amount to at least f45 million of the external and internal funded taken together, as well as the largest portion of the internal floating debt. It is usually reckoned that about 20 per cent of internal debt is owned by foreigncrs. But should Southern Rhodesia secede, this proportion would rise to over 50 per cent, since the bonds held by the Northern Rhodesian and Nyasaland governments would become foreign owned, as would those held by the copper companies or their affiliates, which would have no strong reason for rcmaining in Salisbury. It is to be anticipated too that tlie Federation’s internal money market, which has developed so spectacularly in the last few years, would contract equally spectacularly, or even collapse altogether. One result of this would be that the part of the f23 million floating dcbt which is deemed to be “permanently available” and therefore used on longer term finance, would have to be funded or repaid.
Without prctendirig that any exact calculation is possible, the total of debt assigned to the Southern Rhodesian governnient on the basis of pre-Federation liabilities and thc distribution of assets acquired since Federation, could scarcely be less than f I30 million. And at least f I 0 0 million of this would be owned outside the country. On this basis thc total public interest payments payable abroad, including those of other public authorities in Southern Rhodesia, has been estimated at €5 million. Payment of dividends, interest and profits by companies and persons has becn left more or less unchanged from 1953, at f 8 million. For this item, it is necessary to balance the increase in profits of mining and export agriculture (both representing earnings of assets a substantial proportion of which are owned abroad) against an anticipatcd reduction in the earnings of construction firms, secondary industries, and financial and comniercial institutions. As a consequence of these considerations, tlie deficit on “income” account is held to have risen from f5.6 million to €6 million.
The most important “transfer” payments and receipts arise from the remittance of immigrants’ and emigrants’ funds. Published figures suggest that the average sums brought into the Federation by intending immigrants varies around €200. The approximate sum taken out per emigrant, calculated from the same source has varied as follows:
1956: €180, 1957: f 166, 1958: f118. 289
T H E S O U T I I A F R I C A N J O U R N A L OF E C O N O M I C S
Not too much significance should be read into these estimates however, as they are bclieved to bc low for permanent, as opposcd to temporary emigrants. More- over, it can be argucd cithcr that the wealthier type of commercial man leaving the territory would tend lo increase the average sum, or that unemployed families with very little money would tend to dcprcss it.
The number of new immigrants coming into Southern Rhodesia would be negligible, comprising only a few who might return from Northern Rhodesia rather than face the prospect of living under an African government. (Most of these, Iiowevcr, would probably leap-frog Southern Rhodesia and return to the Union.) With a grave domestic unemployment problem, Southern Rhodesian immigration boards would anyway want to exclude most other intending immi- grants. Emigration would take place not only as a result of the contraction of the economy, but also as a result of the disbanding of the Fedcral Government (the Southern Rhodesian government could aflord to take back only a small proportion of the ex-Federal civil servants), and from the emigration of the big copper companies, along with several of the engineering and financial firms that operate in their wake. As a result, receipts from immigrants' remittances are esti- mated to drop from f3.4 million to fl million, and payments to increase from f2.3 million to f 4 million. Chiefly as a result of these changes, the balance on international transfers is estimated to change from a credit of f.9 million in 1953 to a deficit of f3 million in 1959.
Taking all invisible receipts and payments together, therefore, the estimated deficit is seen to change from f 12.6 million to f 10 million. This must be considered, if anything, something of an under-estimate.
D u t the amount that can be spent on goods and services, espccially in an under- developed country, depends not only upon export earnings, but also upon the supply of foreign loan and investment capital coming into the country. In the five years prior to Federation, capital inflows into Southern Rhodesia financed an averagc annual deficit on current account of f30 million. Since Federation the average annual level of foreign capital inflow has been even larger, at about f 3 5 million, the major part of which has gone into Southern Rhodesia.
Should Southern Rhodesia leave the Federation, this procession of capital inflows would not simply ccase. It would bc put sharply into reverse. There are several reasons for this. The lirst must be that capital that had come into Southern Rhodesia in the expectation that this territory would form the administrative, commercial, and manufiicturing centre of a fast growing country of eight million inhabitants, would find that the market served had shrunk to under three million, and that the local economy instead of expanding was contracting sharply. The second factor might well be political. Secession would not only be taken as a sign of political instability; there is also the likcliliood that it would be followed by the accession to power in Southern Rhodesia of a right-wing government, of a type whose policies are notoriously unpopular in British financial circles. Then again, finance ministers in the Federation used to claim that, because of a bctter political
290
S O U T H E R N R I I O D E S I A A L O N E - T I I E E C O N O M I C C O N S E Q U E N C E S
climate, they could afford to keep company taxes Is. 6d. in the pound higher than in the Union of South Africa, without repelling capital. But with the inevitable increase in speculation as to whether Southern Rhodesia could survive without attempting to join the Union, combined with a probable increase in taxes, this advantage would be lost. Finally, the probability must be faced that with the break-up of the Federation, the two copper mining houses would remove their headquarters from Salisbury and either establish new headquarters on the Copper- belt or in Lusaka, or else move back to Johannesburg or London. Many other consumer goods industries, espccially those operating in rented factories, might decidc to move further north to take advantage of the fast growing African con- sumer markct around the Copperbelt and Katanga, or else to retire back to the Union of South Africa, where production costs are generally lower.
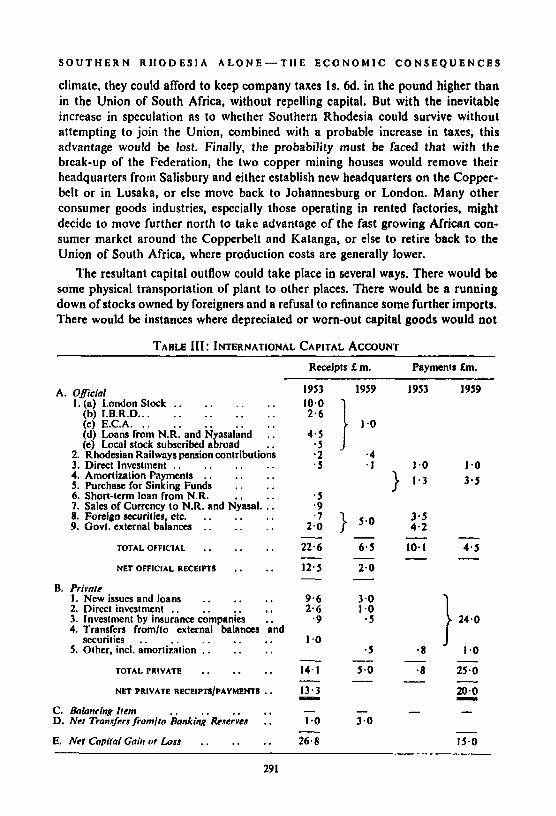
The resultant capital outflow could take place in several ways. There would be some physical transportation of plant to other places. There would be a running down of stocks owned by foreigners and a refusal to refinance some further imports. Thcre would be instances where depreciated or worn-out capital goods would not
TABLE 111: INTERNATIONAL CAPITAL ACCOUNT Rmipts f m. Payments fm.
A. Oflicial 1. (a) London Stock . . . . . . . .
(b) I.B.R.D. . . . . . . . . . . (c) E.C.A. .. .. (d) Loans from N.R: and Nyasalind . . (e) Local stock subscribed abroad . .
2. Rhodesian Railways pension contributions 3. Direct Investment . . . . . . . . 4. Amortization Payments . . . . . . 5. Purchase for Sinking Funds . . . . 6. Short-term loan from N.R. . . . . 7. Sales of Currency to N.R. and Nyasal. .. 8. Foreign securities, ctc. . . . . . . 9. Govt. external balances . . . . . .
TOTALOFFICIAL . . . . . . NET OFFICIAL RECEIPTS . . . .
9. Priwte 1. Ncw issucs and loans . . . . . . 2. Direct investment . . . . . . . . 3. Investment by insurance companies . . 4. Transfers fromlto externnl balanas and
securities . . . . . . . . . . 5. Other, incl. amortization . . . . . .
TOTALPRIVATE . . . . . . NET PRIVATE RECElPTS/PAYMEM8 . .
C. BnlanrinR Item . . . . . . D. Net Transfers fiortt/to knking Reserves . . E . Net Cnpital Gnin or Loss . . . . . .
1953 10.0 2 . 6
4.5 - 5 * 2 . 5
.5
.9
.7 2 . 0
22.6
12.5
- -
1959 1953
} 1.0
- 4 . I 1.0
} 1 .3
} 5.0 ::;
3.0 1.0
- 5
1959
1.0 3.5
} 24.0
1.0
25.0
20.0 - 15.0
29 I
T H E S O U T H A F R I C A N J O U R N A L O F E C O N O M I C S
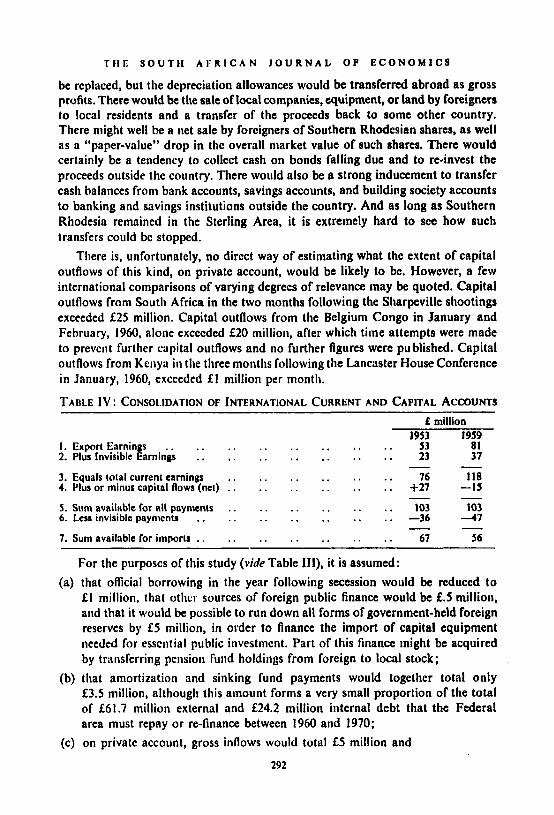
be replaced, but the depreciation allowances would be transferred abroad as gross profits. There would be the sale of local companies, equipment, or land by foreigners to local residents and a transfer of the proceeds back to some other country. There might well be a net sale by foreigners of Southern Rhodesian shares, as well as a “paper-value” drop in thc overall market value of such shares. There would certainly be a tendency to collcct cash on bonds falling due and to re-invest the proceeds outside the country. There would also be a strong inducement to transfer cash halances from bank accoiints, savings accounts, and building society accounts to banking and savings institutions outside the country. And as long as Southern Rhodesia remained in the Sterling Area, it is extremely hard to see how such transfers could be stopped.
There is, unfortunatcly, no direct way of estimating what the extent of capital outflows of this kind, on private account, would be likely to be. However, a few international comparisons of varying degrees of relevance may be quoted. Capital outflows from South Africa in the two months following the Sliarpeville shootings exceeded €25 million. Capital outflows from the Belgium Congo in January and February, 1960, alone exceeded €20 million, after which time attempts were made to prevent further capital outflows and no further figures were published. Capital outflows from Kenya in the three months following the Inncaster House Conference in January, 1960, exceeded f I million per month.
TABLE Iv : CONSO1.IDATION OF INTERNATIONAL CURRENT AND CAPITAL ACCOUNTS ~~~ ~ ~~~ ~~~ ~
f million 199 19J9
1. Export Earnings . . . . . . . . . . . . . . . . J3 81 2. Plus Invisible Earnings . . . . . . . . . . . . . . 23 37
3. Equals total current earnings . . . . . . . . . . . . 76 118 4. Plus or minus capital flows (net) . . . . . . . . . . . . +27 -I5
5. Sum avdrble for nll pnyments . . . . . . . . . . . . 103 103 6. Less invisible paymcnta . . . . . . . . . . . . . . -36 4 7
7. Sum available for imports . . . . . . . . . . . . . . 67 56
- -
- -
- -
For the purposes of this study (vide Table III), it is assumed: that official borrowing in the year following secession would be reduced to € 1 million, that othcr sources of foreign public finance would be f.5 million, and that it would be possible to run down all forms of government-held foreign reserves by f5 million, in order to finance the import of capital equipment needed for esscntial public investment. Part of this finance might be acquired by transferring pension fund holdings from foreign to local stock; that amortization and sinking fund payments would together total only €3.5 million, although this amount forms a very small proportion of the total of f61.7 million external and €24.2 million iiiternal debt that the Federal area must repay or re-finance betwecn 1960 and 1970; on private account, gross inflows would total €5 million and
292
S O U T H E R N R H O D E S I A A L O N E - - T H E E C O N O M I C C O N S E Q U @ N C E S
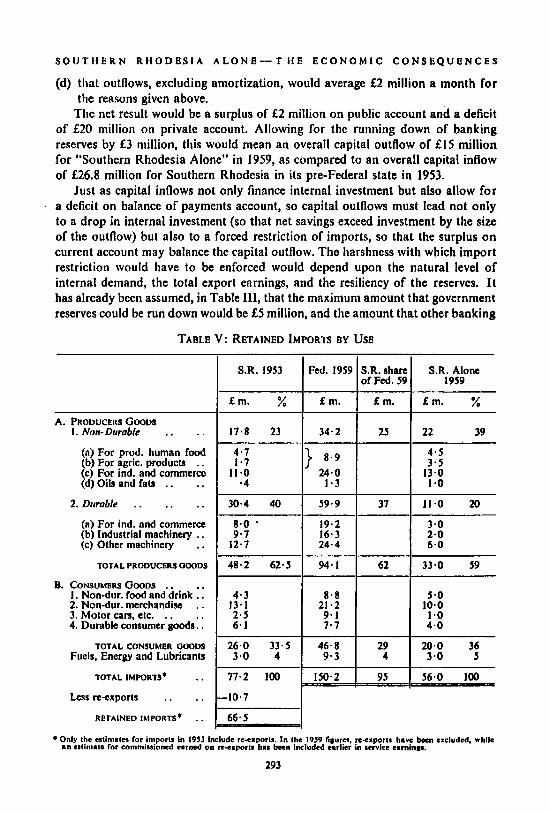
(d) that outflows, excluding amortization, would average €2 million a month for the reasons given above.
The net result would be a surplus of f 2 million on public account and a deficit of €20 million on private account. Allowing for the running down of banking reserves by €3 niillion, this would mean an overall capital outflow of €15 million for “Southern Rhodesia Alone” in 1959, as compared to an overall capital inflow of €26.8 million for Southern Rhodesia in its pre-Federal state in 1953.
Just as capital inflows not only finance internal investment but also allow for a deficit on balance of payments account, so capital outflows must lead not only to a drop in internal investment (so that net savings exceed investment by the size of the outflow) but also to a forced restriction of imports, so that the surplus on current account may balance the capital outflow. The harshness with which import restriction would have to be enforced would depend upon the natural level of internal demand, the total export earnings, and the resiliency of the reserves. It has already been assumed, in Table 111, that the maximum amount that government reserves could be run down would be €5 million, and the amount that other banking
TABLE v: RETAINED IMPORTS BY USE
I 48.2 62.5 I 94.1
S.R. 1953 Fed. 1959 S.R. share S.R. Alone 11. I 62 I 33.0 59
I 17.8 23 I 34.2 I 25 I 22 39 A. PRODUCERS GOODS
1. Non-Durable . . . . (a) For prod. human food (b) For agric. products . . (c) For ind. and commerce (d) Oils and fats . . . .
2. Durable . . . . . . (a) For ind. and commerce (b) Industrial machinery . . (c) Other machinery . .
m r A L PRODUCERS OOODS
B. CONSUMEMGOODS .. .. 1. Non-dur. food rnd drink . . 2. Non-dur. merchandise . . 3. Motor cars, etc. . . . . 4. Durable consumer goods. .
Fuels. Energy and Lubricants
TOTAL IMPORTS. . . Less retxports . . ..
RETAINED IMPORTS* . .
TOTAL CONSUMER OOODS
I 30.4 40 59.9 37 I 11.0 20
1 ::: 6.0
77.2 100
-10.7
66.5
29 4
95 -
5.0 10.0 1.0 4.0
20.0 36 3.0 5
56.0 100
Only the wtimatw for imports in 19S3 include rc-erporls. In the 1959 fisurer rc-zxporls have been excluded, rhlle an estimate for commissioned earned on re-exports has been included earlie; in service earninn.
293
T H E S O U T H A F R I C A N J O U R N A L O F E C O N O M I C S
reserves could be run down would be f3 million. This being the hypothesis, the amount of finance available for imports, determined by gross export earnings less net invisible payments, less capital outflows, would bc €56 million. In other words, the amount of imports that would be available to a European population in Southern Rhodesia one-third larger than it was in 1953 would be, in money terms, about f l l million less, and in real terms about one-third less than it was in the year immediately preceding Federation. Or, looked at another way, the import bill for a Southern Rhodesia outside the Federation in 1959 would have had to have been 41 per cent lower than it was for a Southern Rhodesia inside.
The basis for these last estimates is given in Table V, with Southern Rhodesia’s share of the total 1959 Federal imports being allocated partly on the basis of known investment and consumption patterns, and partly on the basis of pre-Federation import patterns. The pattern of “Southern Rhodesia Alone” imports has also been estimated, although such an estimate is not an essential part of the logic of this argument. I t will be seen that the most pronounced contraction takes place in the importation of durable producer goods, but that consumer imports are also sharply curtailed. The smallest reduction would take place in the import of pro- ducer non-durables, such as would be needed to maintain the output of the agri- cultural, the mining, and of the manufacturing scctor too, so far as demand made this possible.
A reduction in investment, which has an import content of about 60 per cent, a running down of imported stocks, and a natural decrease in consumed dis- posable incomes would all tend to produce a “natural” decrease in import demand. On the other hand, in order to divert as much demand as possible to local manu- facturers and to preserve foreign exchange reserves for the purchase of essential public investment goods, there would certainly have to be a stringent control on the import of all consumer goods, and of some producer goods the manufacture of which could be performed locally. It would thus be theoretically possible to
TABLE VI: FINANCE AVAILABLE FOR INVESTMENT (E M.)
1 f million
I I
Federation
1956 1957 1958 1959 S.R. 1952’
I
S.R. Alone 1959
I . Penonal savings .. 2. Government aurplusc;’ . . 3. Undistributed profits of com- . . 4. Depreciation . . . . . . 5. Net capital from abrond
panies and stat. bodies
INTERNAL FINANCE .. . . .
4.5 4 -3
8.0 10-0
26.8 41.3
23.3 29-1 24.9 31.4 28.5 33.7 23.1 17.0
32.7 -3.2 0 33.8 27.0 29.3 30.0 32.8
~~
111.5 88.9 77.9 114.9 31-1 74.5 62.9 18.9
5 11
2 20
38 -I5
I 23 TOTAL AVAILABLE FINANCE I 68’1 142.7 163.3 140.8 133.9 I
Fipum for 1953 arc not available
294
SO U T I I E R N R H 0 D E S I A A LO N E - T 1.1 E ECO N 0 M I C C O N S E Q U E NCES
accommodate a rcduction of consumer imports of 30 per cent or even higher with a considerably smaller proportionate reduction in consumer disposable income.
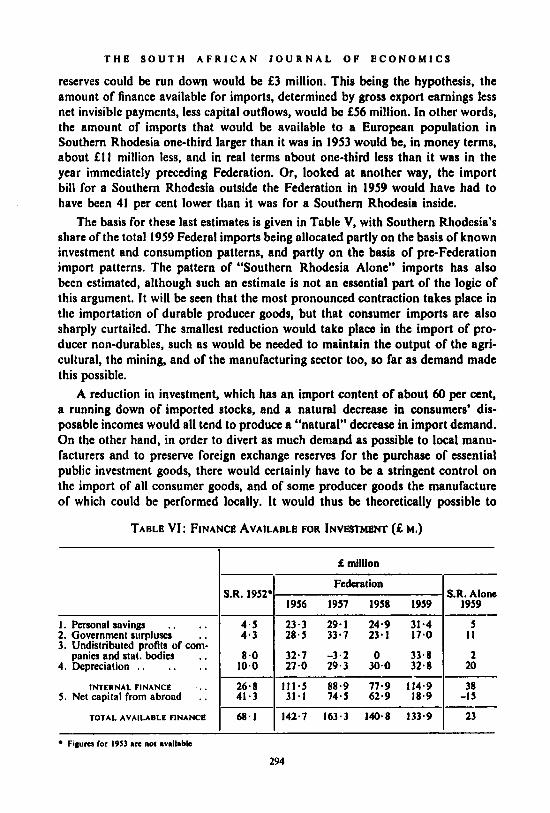
Table VI surveys the sums that would be available to finance investment, though once again the estiniales might prove to be on the high side, especially the estimate of government surpluses (including surpluses of local authorities) a t f I I million. This estimate has been made more on the basis of the minimum amount of development and public works expenditure that a Southern Rhodesian govern- ment could alTord to indulge in, rather than on a basis of the surpluses that would be achieved at current tax ratcs, if the existing level of public services were main- tained. It follows therefore that this surplus could only be achieved either by pruning government current services, or by increasing tax rates. From the point of view of the total effective internal demand, and therefore of employment and income generation, each of thcse steps might have a distinct and important internal effect. A pruning of government current services, whose import content is low, in favour of development expenditures, the import content of which tends to be high, would lead to a decrease in overall internal demand, unless such development work was concentrated upon projects that were labour-intensive. An increase in tax rates would serve to diminish the disposable income and the real standard of living of those in employment, but would tend to increase the level of employment by increasing the number of jobs that the government itself would be able to offer.
T A R L E v11: INVESTMENT PROJECTS (EXCLUDING KARIBA) IN S.R. (E M.)
1 . Fedcrol Govt. Capital Expenditure . . . . . . . . 2. Territorial Govt. Dev. Expenditure 3. Local Authorities . . . . . . . . . . . . 4. Railways, Stat. Boards; etc. . . . . . . . . . . . .
. . . . . . . .
TOTAL GOVT. INVESTMENT . . . . . . . . . . 5. S.R. Mines . . . . . . . . . . . . 6. Urban residential buiiing . . . . . . . . . . . . 7. Urban industrial building . . . . . . . . . . . . 8. Urban conimcrcial building, etc. . . . . . . . . . . 9. Agricultural equipment imported . . . . . . . .
10. Other machinery and equipment imported’ . . . . . . . I I . Othcr, incl. net changes in stocks . . . . . . . . . .
TOTAL PRIVATE INVESTMENT . . . . . . . . GROSS INVESTMENT . . . . . . . . . . . .
Less depreciation . . . . . . . . . . . . . . . . NET INVESTMENT (eXCl. Kariba) . . . . . . . .
With Fed I959 7 5
10 3.5 -
25.5
2.6 5.0 2 .4 7.0 3.0 7.0 5.0
32.0 - 57.5 20.4 - 37- I
S.R. Alone I959
} 9 4
j - 16 - 2 .0 2.0 1.5 2.0 2-5 3.0
-6.0
7 .0 - 23 20
3
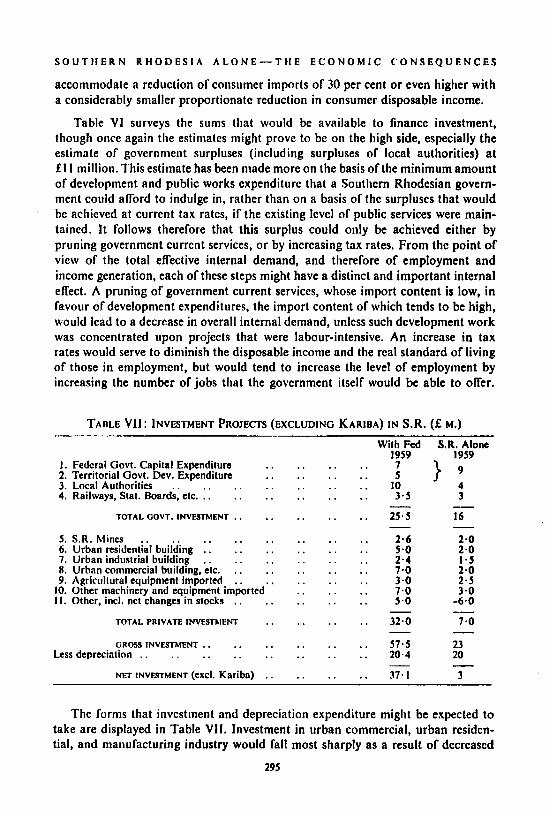
The forms that investment and depreciation expenditure might be expected to take are displayed in Table V11. Investment in urban commercial, urban residcn- tial, and manufacturing industry would fall most sharply as a result of decreased
295

T H E S O U T H A F R I C A N J O U R N A L O F E C O N O M I C S
profit expectation (is. the marginal efficiency of capital factor). Government investment would fall chiefly as a result of a shortage of finance. Investment in agricultural and niineral export industries would be least affected, although even here, as South African experience has shown, one of tho consequences of the political reshuffle would be a shortage of the necessary development finance. Gross investment, which is the more important from the point of view of employ- ment and income determination, is shown as falling 60 per cent, while net invest- ment is shown as falling by over 90 per cent, if indeed it remained positive at all. The most difficult item in the investment table to predict is the net change in the level of stocks. This is partly because estimates of current stocks and of past stock changes are extremely unreliable, and partly because, although wholesalers and retailers would clearly try to diminish stocks quite substantially, the extent to which they would succeed in doing so while sales themselves were falling is uncertain. There might even be a net involuntary increase in stocks of certain traditionally slow-selling lines.
TABLE Vl I I : GOVERNMENT REVENUE IN S.R., BY SOURCE
(At constant tax rates)
Federal Sources: I . Income Tax . . . . 2. Customs . . . . 3. Excise . . . . . . 4. Posta and Tel. .. 5. Recoveries . . . . 6. Other . . . . . .
I . Share of Income Tax 2. Income Tax rurchargo 3. Native Tax
(a) Indigenous .. (b) Nan-indigenous . .
4. Motor spirit . . . . 5. Vehicle . . . . . . 6. Drivers' . . . . 7. Stamp duties, etc. .. 8. Death duties . . . . 9. Entertainment.. ..
10. Dog and betting . . 11. Mine royalties .. 12. Interest 13. Pension contributions' ' 14. Rents . . . . . . 15. Lands . . . . . . 16. Water supply . . . . 17. Fines 18. k p t . a id rniskteilanedis
Territorial Sources:
TOTAL .. t lncludcr Khool and hospital Teas.
f million
1952-53 1958-59 1959 S.R. in Fed. S.R. Alone
. . . . . . . . 14.1 13.6 8.0 . . . . . . . . 4.2 7.3 5.4 . . . . . . . . 2.0 2-2 1 - 3 . . . . . . . . 1.7 3.4 3.0 . . . . . . . . -5 t 4.7 4.0 . . . . . . . . 1.8 1.5
. . . . . . . . . . . . . . . . 2.5 1.5 2-6 1.5
. . . . . . - 9 *9 . . . . . . . . *4 .3 . . . . . . . . 2.0 1.7 . . . . . . . . * 4 .9 *7
.' } *6
. . . . . . . . - 1 - 1 . . . . . . . . - 4 2.0 1.8 . . . . . . . . * 3 - 2 .2 . . . . * 2 * 2 .. .. ..
.. .. .. .. .. ..
. . . . . . . . . . . . -4
. . . . . . 2*7* . . . . . . - 2
. . . . . . * I . . . . . . * S
. . . . . . . . . . . .
. . . . . . - - - . . . . . . . . 28.5 49.2 35.9
tndudcr C.M.E.D. rcceiptr or 0 . 1 million.
296

S O U T H E R N R H 0 D ES I A A L O N E - T €1 E E C O N 0 MI C C O N S E Q Ut! N C E S
TABLE IX: DOMESTIC PRODUCT OF S.R., BY SOURCE (in Em)
1. Mineral Exports . . . . . . 2. Agricultural Exports . . . . . . 3. Manufactured Exports .. 4. Service Exports (excl. transpbrt) . . 5. Transport . . . . . . 6. Water and Elkiricity 7. Public Adm., Health, Educ. and De'fence 8. Gross Investment, Public and Private 9. Home-Consumed Agricultural Goods
10. Home-Consumed Manufactum . . I I . Home-Consumed Services, n.e.s. ..
OROJS DOMESTIC PRODUCC
Less depreciation . . . . . . . . NET WMeSTlC PRODUCT
. . . . . . . . . . . . . . . . . . . . . . . .
. . . . . . . . . . . . .. , I . . . .
. . . . ..
1959 in Fed.
17 '
23 I2 10 20 5 18 24 12 30 60
239 20
-
.. 219
Penxntap 1959
17 - 23 25 9 20 8 15 17
5 33 12 60 10 8 11 22 30 25 45
22 187 20
24 I67
drop S.R. Alone -
-
- -
- -
Table V l l l gives an estimate of government revenue at constant tax rater, showing a fall in revenues available for expenditure in Southern Rhodesia of 27 per cent. For the purposes of the following table it should be rcmarked that an extra €3 million is assumed to be appropriated to development account in order to maintain public investment at an acceptable minimum level, thus allowing public cxpenditure on administration, education, health, and defence to fall by a full 33 per cent. I t is not pretended that this fall would in eflect take place, for it would have to be countered by increasing tax rates. But for Table IX, and for the computation of domestic product by source, it is useful to distinguish capital expenditures from current expenditures, but unnecessary to make any rigid dis- tinction between effective demand causcd by government current expenditure and that causcd by private current expenditure.
Having therefore estimated the three subsidiary equations (foreign earnings minus capital outflows equals foreign expenditure, internal savings minus capital outflows equals net investment, and government net borrowings plus taxation revenues equals government expenditure on current and capital account), we are in a position to estimate the main domestic product and national income equations.
In Table IX, items 1 to 8 emerge from the estimates of the subsidiary equations. Taken together, these sectors generate approximately 54 per cent of the domestic product and a slightly smaller percentage of the national income. In aggregate, the drop of effective demand by companies, persons and government in these sectors amounts to 27 per cent. The remaining sectors (items 9, 10 and 11) as divided in Table IX represent sectors supplying exclusively home demand. The home demand for goods supplied by these sectors is itself generated partly by the earnings within these sectors themselves, and partly by the earnings of other sectors. Indeed, the division between these two sources of demand may be assumed to be approximately 50-50.
297
T H E S O U T H A F R I C A N J O U R N A L O F E C O N O M I C S
A fall in demand of the first-cited sectors would itself lead to a fall in the output of sectors 9-1 I , which would in turn lead to a further fall i n demand from the factors employed in these latter sectors. Indeed, the overall fall, in order to achieve an equilibrium position, would normally have to equal the full 27 per cent. However, as lias been inetitioned prcviously, it would be possible to effect some transfcrence froni foreign to home demand by increased tariffs, import restrictions, and a change in govrrnnient huying policies. Thcrcl'ore, the overall fall in produc- tion in, and demand generated by, these sectors has been estimated at 221, rather than 27 per cent.
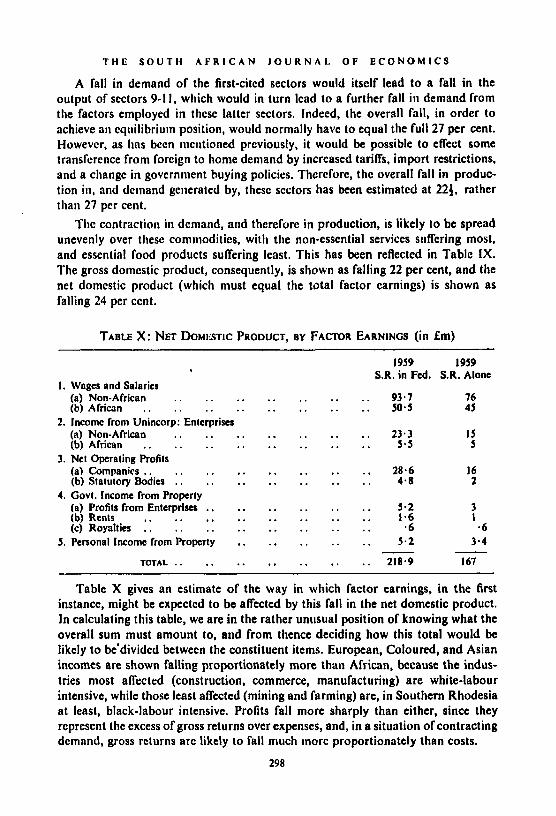
The contraction in demand, and therefore in production, is likely to be spread unevenly over these commodities, with the non-essential services suffering most, and essential food products suffering least. This has been reflected in Table IX. The gross domestic product, consequently, is shown as falling 22 per cent, and the net domestic product (which must equal the total factor carnings) is shown as falling 24 per cent.
TABLE X: NET DOMISTIC PRODUCT, BY FACTOR EARNINGS (in fm)
1959 I959 S.R. in Fed. S.R. Alone
1. Wages and Salaries (a) Non-African . . . . . . . . . . . . . . 93.7 76 (b) African . . . . . . . . . . . . . . . . 50.5 45
(a) Non-African . . . . . . . . . . . . . . 23.3 15 (b) Africnn . . . . . . . . . . . . . . . . 5 . 5 5
(a) Companies . . . . . . . . . . . . . . . . 28.6 16 (b) Statutory Bodies . . . . . . . . . . . . . . 4-8 2
(a) Profits from Enterprises . . . . . . . . . . . . 5 . 2 3 (b) Rents . . . . . . . . . . . . . . . . 1.6 I (c) Roynltia . . . . . . . . . . . . . . . . -6 - 6
5. Personal Income from Property . . . . . . . . . . 5 . 2 3.4
2. lncomc from Unincorp: Enterprises
3. Net Operating Profits
4. Govt. Income from Property
- - TOTAL . . . . . . . . . . . . . . 218.9 167
Table X gives an estimate of the way in which factor earnings, in the first instance, might be expected to be affected by this fall in the net domestic product. In calculating this table, we are in the rather unusual position of knowing what the overall sum must amount to, and from thence deciding how this total would be likely to be'dividcd between the constituent items. European, Coloured, and Asian incomes are shown falling proportionately more than African, because the indus- tries most affected (construction, commerce, manufacturing) are white-labour intensive, while those least affected (mining and farming) are, in Southern Rhodesia at least, black-labour intensive. Profits fall more sharply than either, since they represent the excess of gross returns over expenses, and. in a situation of contracting demand, gross rcturns are likely to fall much inore proportionately than costs.
298
S O U T H E R N R I i 0 D E S I A A L O N ti - TI1 E ECO N O M I C C O N S E Q U E N C 6 S
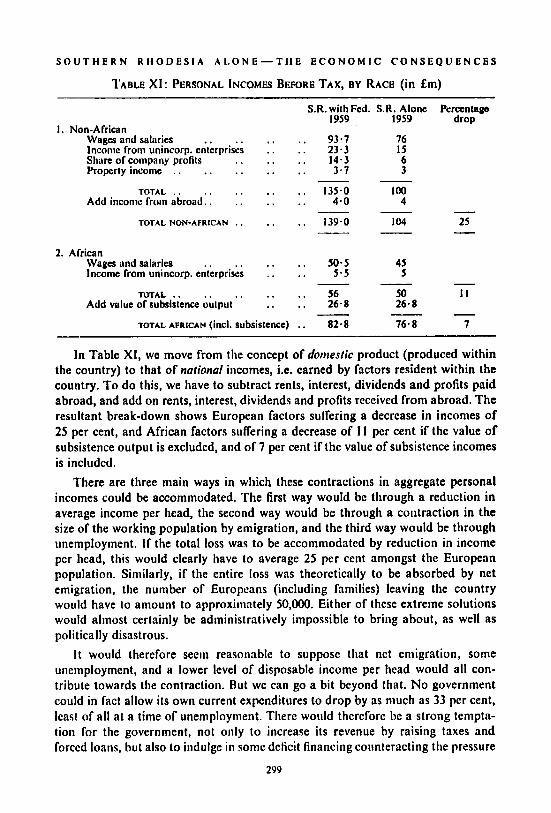
TABLE XI: PERSONAL INCOMES BEFORE TAX, BY RACE (in Em)
I. Non-African Wages and salaries . . . . lnconie from unincorp. enterprim Share of company profits .. Property inconie . . . . . .
Add TOTAL
inconie from . . . abroad.
TOTAL NON-AFRICAN
.. .. * . ..
S.R. with Fed. 1959
.. 93.1 .. 23.3 .. 14.3 .. 3.7
.. .. . . 135.0 .. 4.0
.. .. 139.0 --
S.R. Alone 1959
16 IS 6 3
100 4
104
-
-
Percen tape drop
- 25
2. African Wages and salaries . . . . . . . . 50.5 45 lnconie froin unincorp. enlerpriscs . . . . 5 . 5 5
Add value of subsistence output . . . . 26.8 26.8
- - - T O T A L . . . . . . . . . . 56 50 I I
TOTAL AFRICAN (incl. subsistence) . . 82.8 16.8 1 - - -
- In Table XI, we move from the concept of domestic product (produced within
the country) to that of nutionul incomes, i.e. earned by factors resident within the country. To do this, we have to subtract rents, interest, dividends and profits paid abroad, and add on rents, interest, dividends and profits received from abroad. The resultant break-down shows European factors suffering a decrcase in incomes of 25 per cent, and African factors suffering a decrease of I 1 per cent if the value of subsistence output is excluded, and of 7 per cent if the value of subsistence incomes is includcd.
There are three main ways in which these contractions in aggregate personal incomes could be accommodated. The first way would be through a reduction in average income per head, the second way would be through a coiltraction in the size of the working population by emigration, and the third way would be through unemployment. If the total loss was to be accommodated by reduction in income per head, this would clearly have to average 25 per cent amongst the European population. Similarly, if the entire loss was theorctically to be absorbed by net emigration, the number of Europeans (including families) leaving the country would have to amount to approximately 50,000. Either of these extreme solutions would almost certainly be administratively impossible to bring about, as well as politically disastrous.
I t would therefore secin reasonable to suppose that net emigration, some unemployment, and a lower level of disposable income per head would all con- tribute towards the contraction. Rut we can go a bit beyond that. No government could in fact allow its own current expenditures to drop by as much as 33 per cent, least of all at a time of unemployment. There would therefore be a strong tenipta- tion for the government, not only to increase its revenue by raising taxes and forced loans, but also to indulge in sonic deficit financing counteracting the pressure
299
T H E S O U T H A F R I C A N J O U R N A L 01: E C O N O M I C S
on reserves by controls on capital exports by residcnts, and by channelling home demand from imports to homc produced goods by nieans of increased tariffs and physical import restrictions.
If the reduction in the European working population was to be limited to, say, 10 per cent, the govertiment itself would have to create some of tho extra jobs. Thus the fall in averagc disposable income per pcrson employed would be occasion- ed more by a combination of tax increases and price rises (which would themselves reflcct the advent of a sales tax and increased tariffs) rather than by large scale reductions in wage or salary levels.
One further type of government action could safely be predicted. Dismember- ment of the Fedcration would lead, within Southern Rhodesia, to a demand for job reservation for whites that would be politically irresistible. Some then of the projccted fall in European employment would be avoidcd by political action which would lead to rcplacing Africans by Europeans in certain semi-skilled or even unskillcd jobs. And to the extent that this happened, the resultant contraction in European income will liavc been over-stated, and the contraction in African money incomes will have been under-stated.
The loss in African personal incomes might also be accomplished not chiefly through a reduction of wages, but by the exclusion of Portuguese and Nyasa labour. Thc cxclusion of 66,000 %on-indigenous natives” earning an average of €60 per head per annum, would decrease total African wagcs by f 4 million. The further reduction of €2 million could be brought about by a decrease in the average wages earncd by Africans from €80 per annum to €75 per annum, a drop of about 6 per cent. This drop would be caused not so much by a lowering of standard rates for African jobs, but rather by the abolition of many of the more lucrative commer- cial and industrial jobs, and the switch by Southern Rhodesian African labourers to more lowly paid jobs previously performed by Africans from Nyasaland and Mocambique. Any forced surrender of job-categories by Africans as a result of job reservatipn for whites would tend, of course, to make the net decrease in African disposable incomes somewhat larger.
I t remains to discuss whether the choice of 1959 is a suitable one from the point of vicw of mcasuring proportionate contractions in production and earnings, and whether any substantial modifications from the pattern of effects traced here could be expected in any future year in which secession might take place.
In three distinct ways, 1959 appears to have been rather an untypically favour- able year to have chosen as a model. 1. 1959 was the first year in which the distribution of Federal revenues and expen-
ditures had not resulted in revenues from the Northern Rhodesian copper mines covertly subsidising government expenditurc in Soutliern Rhodesia. The average annual transfer since Fedcration has becn approximately €6 million. Moreover there are likely to be similar transfers in the future though of a smaller order, once tax revcnues recover from the 1957-58 slump in the price of copper. The
300

S O U r H E R N R H O D E S I A A L O N E - T H E E C O N O M I C C O N S E Q U E N C E S
percentage drop in government expenditure at constant tax rates as represented in these calculations is thercfore less than it would have been in any other year since Federation.
2. 1959 saw tlic completion of thc major spending associatcd with the first stage of tlie Karibu project. Direct Koriba cxpenditurcs have been excluded nltogcther froin these calculations, sincc they would not be relevant to the act of secession in any future year. Nevertheless, the indirect (multiplier) result of Kariba spending, thougli admittedly small in relation to the size of the project because of the nianner i n whicli it had been planned, has still served to boost the demand for construction goods above what it might otherwise have been. The cessation of major expenditures on Kariba might thus be expccted to have a depressing effect upon production, independent of the effect of secession. This argument does not mean that the proportionate drop in any future year would be largcr, only that the absolute drop from 1959 might be.
3. The fact that Kariba power will in future be flowing to the copper mines will itself tend to diniinish coal exports to Northern Rhodesia, and transport earnings, even if the Northern Rhodesian section of the line were to remain in Southern Rhodesian hands. For this reason, and for the other reasons mentioned earlicr, it appears that the net deficit on invisible account has been considcrably under-stated cornpared with what it might be expcctcd to be in any future year. There miglit be sonic increase in coal exports to countries outside the Federation, but these would not be suficient to make up for the loss in purchases by the Northern Rhodesian mines. Is there. any rcason to believe that the drop might be less in future years than
it would have been in 19591 There is one. Both private and public capital inflows seem to be declining, as well as net gains From immigration and immigration rcmittances. Tlicsc factors will tend to slow down the rate of expansion of the Southern Rhodesian economy, and this slowing-down before any hypothctical secession would itself serve to diniinish slightly tlie contracting elkct of secession. On balance, tlicrcfore, i t seeins that the choice of the year 1959 is quite a fair one, with pcrliaps a slight tendency to understate the amount of contraction that secession would cause. (The saliie calculations were performed for the year 1958, and the resultant drops were found to be sorncwhat larger.)
Wlint would happen i n die ycars following scccssion? Capital outflows would slow down in tlic ncxt year, but the governmcnt would be unlikely to be able to afford the same mcasures of deficit finance. Net emigration would continuc, though at a lower rate, and internal invcstnicnt would Fall again, as earlier construction orders werc coniplctcd, stocks continucd to Fall, and a certain amount of capital depreciation was simply not made good by expenditure. The overall contraction in the size of the econoniy (as measurcd by domestic product) might be expected to be in the order of 10 per cent in the second yew following secession. In the next year, thcse same processes would continue but to a less marked degree, resulting in a contraction of perhaps 5 per cent, or even in a situation where there would
301
T H B S O U T H A F R I C A N J O U R N A L OF B C O N O M I C S
be neither contraction nor expansion. In the fourth or fifth year following secession, the process of growth and development might be expected to start again, but from a general level of economic activity about 40 per cent smaller than in the last year before the break-up of the Fedcration.
Bearing in mind the need to repay heavy foreign debts, and the unlikelihood of Southern Rhodesia on her own attracting much new foreign capital, we might assume a compound rate of growth of about 3 per ccnt per annum (in real terms) as being the maximum attainable. At this rate, it would take another seventeen years after the upturn for Southern Rhodesia to reach the level of economic activity enjoyed in the year before secession. Three or four years of quick contrac- tion would thus have to be followed by something like seventeen years of slow growth before the stalrcs quo (in terms of output and consumption) could be re- gained. Or, to put the matter in a single sentence, we might conclude that secession would set back Southern Rhodesia’s economy by about twenty years.
Cape Town.
302