Southern California’s Vulnerability to Climate...
14
10/20/11 1 Southern California’s Vulnerability to Climate Change October 20, 2011 Tony Haymet Director Thanks to Dr. Dan Cayan, Scripps Oceanography Sponsors: California Energy Commission, NOAA RISA program, USGS, DoE, California Department of Water Resources There is a high likelihood of substantial climate change in CA “Mediterranean” regions This pending change, coupled with population increase, land use, and other forces, places an imperative to measure, understand, plan for, and adapt to climate change impacts across the California landscape
-
Upload
nguyenphuc -
Category
Documents
-
view
219 -
download
1
Transcript of Southern California’s Vulnerability to Climate...

10/20/11
1
Southern California’s Vulnerability to Climate Change
October 20, 2011
Tony Haymet Director
Thanks to Dr. Dan Cayan, Scripps Oceanography Sponsors: California Energy Commission, NOAA RISA program,
USGS, DoE, California Department of Water Resources
There is a high likelihood of substantial climate change in CA
“Mediterranean” regions
This pending change, coupled with population increase, land use, and other forces,
places an imperative to measure, understand, plan for, and adapt to climate change impacts across the California
landscape
10/20/11
2
Outline
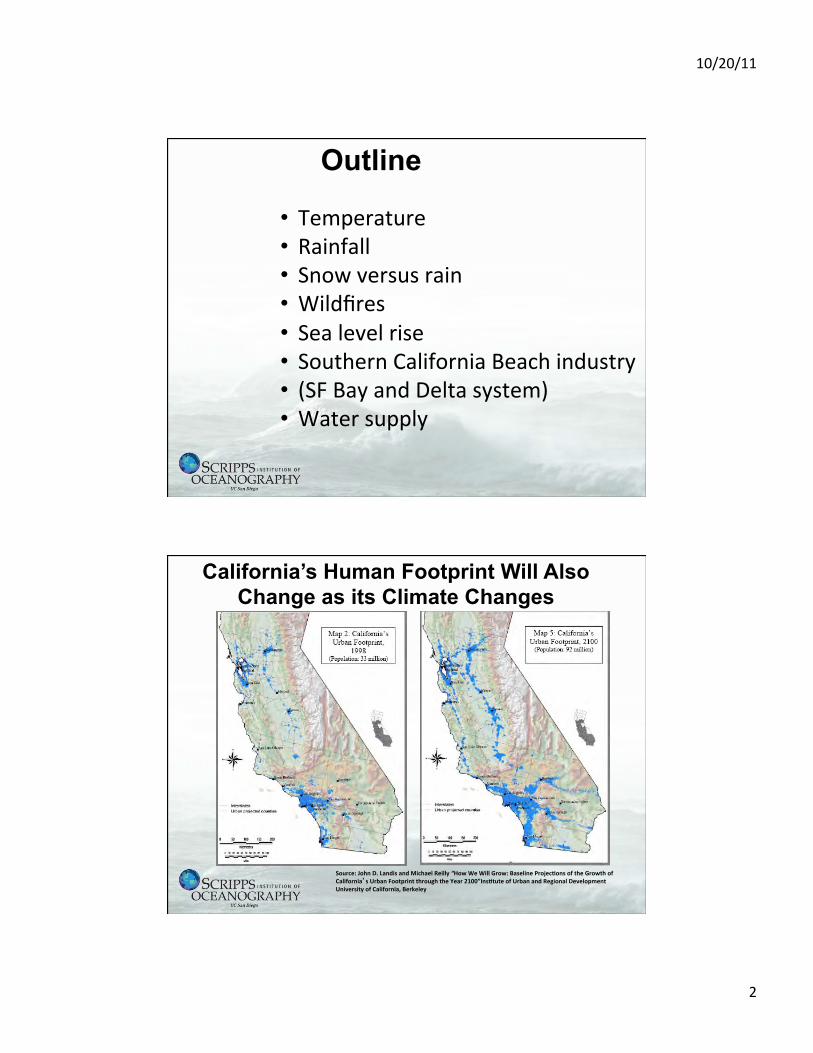
• Temperature • Rainfall • Snow versus rain • Wildfires • Sea level rise • Southern California Beach industry • (SF Bay and Delta system) • Water supply
Source: John D. Landis and Michael Reilly “How We Will Grow: Baseline Projec>ons of the Growth of California’s Urban Footprint through the Year 2100”Ins>tute of Urban and Regional Development University of California, Berkeley
California’s Human Footprint Will Also Change as its Climate Changes
10/20/11
3
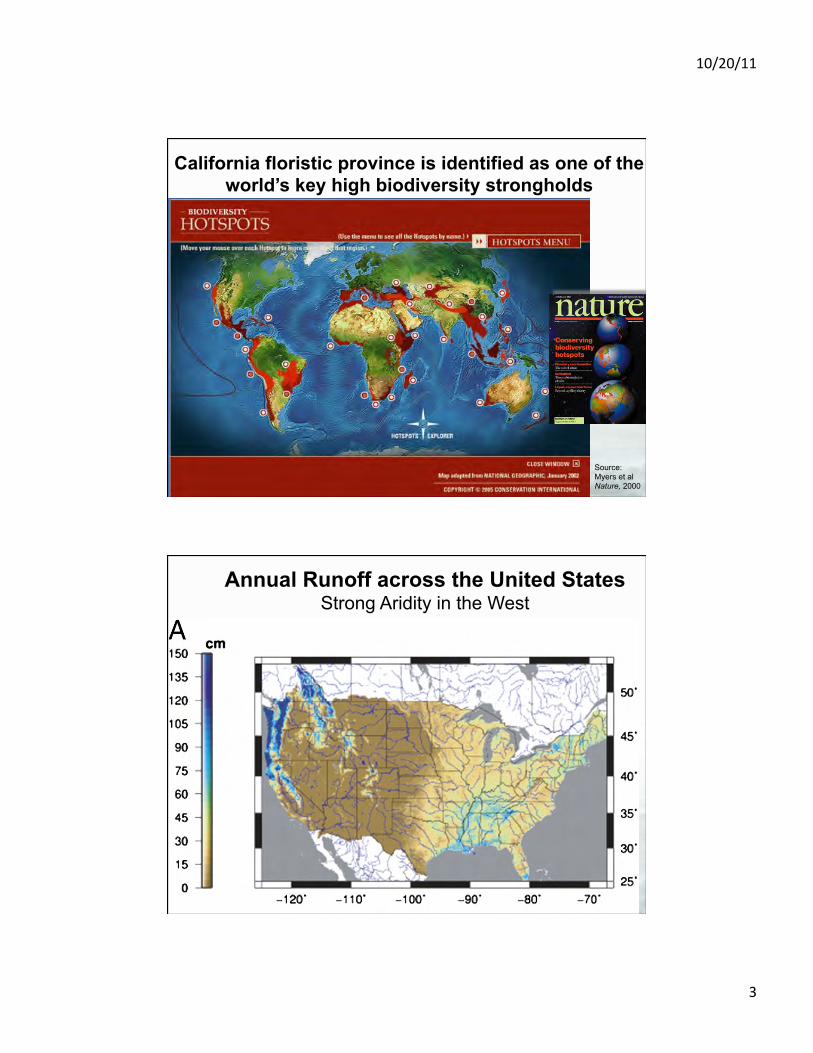
California floristic province is identified as one of the world’s key high biodiversity strongholds
Source: Myers et al Nature, 2000
Annual Runoff across the United States Strong Aridity in the West

10/20/11
4
Highly Variable: Yearly Precipitation in San Diego Region Ranges from ~33% to
280% of Average (water year is Oct. through Sept.)
Precipitation is Heavily Influenced by location in CA
• Range of precipitation in Calif. is 1 to 100 inches per year
• Volume of precipitation delivered to San Diego County is only enough to supply 5 to 10 percent of water consumed

10/20/11
5
Best Projections of Climate change impacts on California
warmer ?— yes, almost certainly drier ?— maybe
(not “predictions”; these are our best engineering estimates so we can invest our infrastructure funds as wisely as possible)
Now, six quick graphs on precipitation
Landscapes of the western United
States, such as the west slope of the Sierra Nevada,
have a significant fraction of their water budget
falling in a temperature zone that is vulnerable
to climate warming.
More vulnerable
Computed by Mike Dettinger from gridded historical US weather data (from Bates et al, 2006 WRR)
Less vulnerable
Rain versus Snow: what happens if we get warming of 3 Degrees C ?
10/20/11
6
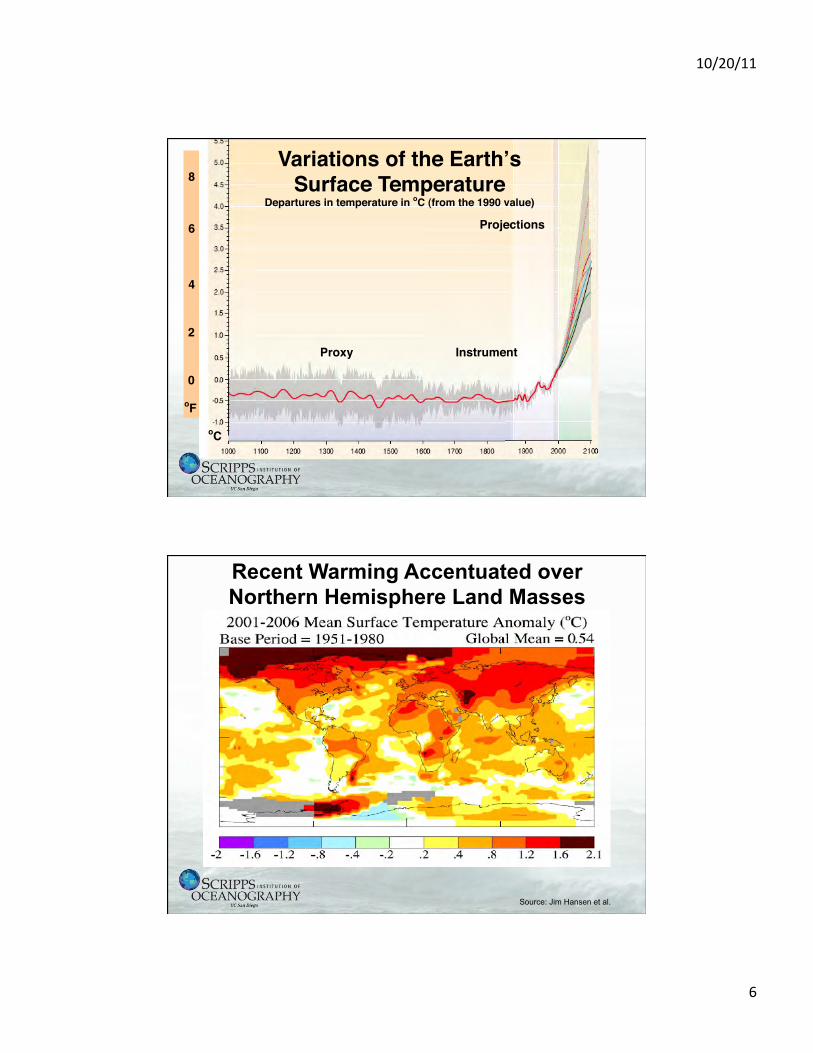
Variations of the Earthʼs Surface Temperature"
Departures in temperature in oC (from the 1990 value)"
Proxy" Instrument"
Projections"
oF"
oC"
0"
2"
4"
6"
8"
Source: Jim Hansen et al.
Recent Warming Accentuated over Northern Hemisphere Land Masses

10/20/11
7
Seasonally intensified warming? Recent models suggest amplified summer warming, which could produce serious impacts on California & Nevada ecosystems, energy, water and health
Estimated Present-day Historical July Average Daily Temperature Maximum
1km downscaled to 1km
Source: Hugo Hidalgo, Tapash Das, Mike Dettinger/Scripps Oceanography

10/20/11
8
One Climate Model Scenario of July Average Daily Maximum Temp mid 21st century
GFDL A2 1km downscaled to 1km
Source: Hugo Hidalgo, Tapash Das, Mike Dettinger/Scripps Oceanography
Sacramento Temperatures
10/20/11
9
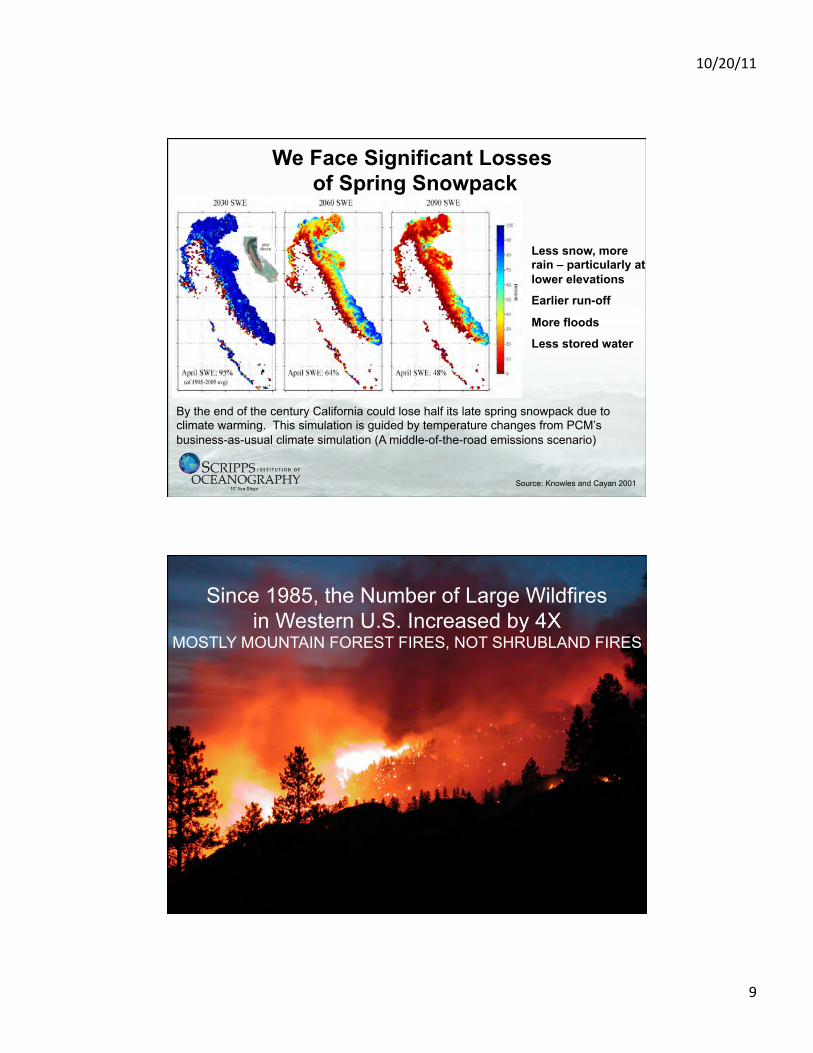
We Face Significant Losses of Spring Snowpack
By the end of the century California could lose half its late spring snowpack due to climate warming. This simulation is guided by temperature changes from PCM’s business-as-usual climate simulation (A middle-of-the-road emissions scenario)
Less snow, more rain – particularly at lower elevations
Earlier run-off
More floods
Less stored water
Source: Knowles and Cayan 2001
18
Since 1985, the Number of Large Wildfires in Western U.S. Increased by 4X
MOSTLY MOUNTAIN FOREST FIRES, NOT SHRUBLAND FIRES
Anthony Westerling et al. Science August 2006

10/20/11
10
October 26, 2003 13 major fires in Calif. and Mexico
> 300K hectares (750K acres)
24 lives lost
239 injured
4866 structures lost
> $2 billion in insured losses
$176 million in disaster relief
$116 million in suppression costs
Largest fire (Cedar) and largest fire siege in California history
Early Snowmelt Years
NPS, USFS & BIA Fires over 1,000 acres 1972 – 2003
Area burned is proportional to size of red dots. The warming and earlier springs during last few decades have extended and intensified the fire season in
mid-elevation forests
Late Snowmelt Years
Source: Tony Westerling, UC Merced Science 2006

10/20/11
11
Observed SFO (left) and modeled Global (right). Sea level rise estimates based upon an envelope of output from several GHG emission scenarios
Projected envelope of global SLR (2009)
Climate models only provide loose guidance on the amount of sea-level rise; full physics models are still
under development. But it is quite likely that rates will increase greatly in future decades.
Sea-Level Rise
During high sea levels, the sea is often not quiescent

10/20/11
12
Coincidence of Storms and High Tides in Winter 1983: Heavy Coastal Damage
High tide levels vary by about 1 meter Highest storm-forced level = 28 cm
Two high tides and two low daily tides, unequal in amplitude. Monthly tidal changes dominated by spring-neap cycle, with two periods of relatively high tides (springs) around full and new moon. One spring tide range per month is usually higher than the other on this coast. The highest monthly tides in the winter and summer months are higher than those in the spring and fall as a result of lunar and solar declination effects.
storms
24
Beach industry in California • A huge industry that brings in a lot of
money • In 1998, CA beaches brought $14B
in direct revenue California beaches alone have more tourist visits than combined visits to all 346 National Park Service properties including national seashores and monuments such as the Lincoln Memorial and Washington Monument.
• (King, P., 1999. The Fiscal Impact of Beaches in California, Public Research Institute, San Francisco State University, Report, 29 pp.)
•

10/20/11
13
California beaches: adapting to sea level rise
Ken Hively / Los Angeles Times / June 25, 2008 http://www.latimes.com/news/local/la-me-beach31-2008dec31,0,7928541.story
Malibu, Broad Beach Goleta Beach, Santa Barbara http://coastalcare.org/2010/07/goleta-beach-California
Difficult choices…
Armor the beaches? Sand replenishment?
The Impacts of Sea-Level Rise on the California Coast “In an analysis prepared for three California state agencies, the Pacific Institute estimates that 480,000 people; a wide range of critical infrastructure; vast areas of wetlands and other natural ecosystems; and nearly $100 billion in property along the California coast are at increased risk from flooding from a 1.4-meter sea-level rise – if no adaptation actions are taken.” “Approximately 1,100 miles of new or modified coastal protection structures – such as dikes and dunes, seawalls, and bulkheads – are needed on the Pacific Coast and San Francisco Bay to protect against coastal flooding from a 1.4 m sea-level rise. The cost of building new or upgrading existing structures is estimated to be at least $14 billion (in year 2000 dollars), with an additional $1.4 billion per year in maintenance costs. “ “An overwhelming two-thirds of that property is concentrated on San Francisco Bay.” Populations and critical infrastructure at risk are shown in detailed maps prepared by the Pacific Institute (and available at http://www.pacinst.org/reports/sea_level_rise/maps/). “ Pacific Institute Report commissioned by the Ocean Protection Council, the Public Interest Research Program of the California Energy Commission, and the California Department of Transportation
http://www.pacinst.org/press_center/press_releases/sea_level_rise_3_11_09.html

10/20/11
14
Summary Vulnerabilities in Southern California to climate changes include: • warmer temperature • reductions to precipitation and extended drought • change in mix of snow and rain • sea level rise Reasons for concern are adverse effects upon: • water supply and demand • ecosystems • wildfire • energy demand (air conditioning) and energy supply • human health • agriculture • beaches, coastal property, infrastructure, recreation
Conclusions
Weather, natural climate variability, and human-caused climate climate change are all drive climate impacts in California. Need no-regrets strategy to shield our region from impacts: • periodically assess vulnerabilities at regional and local levels • understand key processes • monitor the environment and the systems that may be affected • develop a knowledgeable and networked community of scientists, policy experts and decision makers. Understanding the climate and its impacts is not enough--- an equal challenge is solving the many societal and institutional barriers to adaptation to climate change Adaptation – the question is not
whether, but how soon, & how costly?