SOUTHERN BLUEFIN TUNA TRADE DATA: EXPLORATORY … · SOUTHERN BLUEFIN TUNA TRADE DATA: EXPLORATORY...
27
1 Commission for the Conservation of Southern Bluefin Tuna CCSBT-ESC/1208/10 (Rev.2) SOUTHERN BLUEFIN TUNA TRADE DATA: EXPLORATORY ANALYSES Executive Summary The 2011 meeting of the Compliance Committee (CC6) tasked the Extended Scientific Committee (ESC) with developing a methodology for using trade figures to analyse market trends. In order to assist the ESC, this document provides background and initial analyses of trade data the Secretariat has obtained from the Global Trade Atlas® (GTA) database for the 2009 - 2011 calendar years and for the first quarter of 2012 for two SBT commodity codes (fresh/chilled and frozen). Imports and exports associated with Non-cooperating Non-Members (NCNMs) are highlighted as they are most likely to be indicative of potential emerging markets. Trade database import/export weights are also compared and contrasted with import/export weights extracted from CCSBT Secretariat’s own Catch Documentation Scheme (CDS) database. Results extracted from the GTA and presented here should be considered with caution due to inherent limitations of the extracted data. For example, CCSBT’s subscription includes only a subset of all the GTA data available. In addition, some low unit price figures and unexpected import/export results, potentially indicate that some miscoding of commodity codes is present within data sourced by GTA, i.e. that some non-SBT product may have been erroneously recorded as SBT commodity codes in the GTA data sources. These data limitations should be taken into account when reviewing the results below. Trade database extracts indicated that a total of 26 NCNMs (American Samoa, Barbados, British Virgin Islands, Brunei Darussalam, Canada, Ceuta, China, Dominican Republic, Hong Kong, Jamaica, Jordan, Kuwait, Lebanon, Malaysia, Netherlands Antilles, Norway, Panama, Russia, Singapore, Sri Lanka, Switzerland, Thailand, Turkey, United Arab Emirates, USA and Zimbabwe) were recorded as importers or export destinations (and so by implication importers). One additional importing NCNM (Mauritius) was identified from CDS records, giving a grand total of 27 importing NCNMs. Many of these importers received SBT in small quantities. In addition, from combined GTA and CDS database extracts, a total of 11 NCNMs were recorded as exporters or implied exporters. A general inspection of the CDS and GTA data suggests that the main markets outside the current CDS coverage include Hong Kong, Singapore, USA and more recently China.
Transcript of SOUTHERN BLUEFIN TUNA TRADE DATA: EXPLORATORY … · SOUTHERN BLUEFIN TUNA TRADE DATA: EXPLORATORY...

1
Commission for the Conservation of Southern Bluefin Tuna
CCSBT-ESC/1208/10 (Rev.2)
SOUTHERN BLUEFIN TUNA TRADE DATA: EXPLORATORY ANALYSES
Executive Summary
The 2011 meeting of the Compliance Committee (CC6) tasked the Extended Scientific Committee (ESC) with developing a methodology for using trade figures to analyse market trends. In order to assist the ESC, this document provides background and initial analyses of trade data the Secretariat has obtained from the Global Trade Atlas® (GTA) database for the 2009 - 2011 calendar years and for the first quarter of 2012 for two SBT commodity codes (fresh/chilled and frozen).
Imports and exports associated with Non-cooperating Non-Members (NCNMs) are highlighted as they are most likely to be indicative of potential emerging markets. Trade database import/export weights are also compared and contrasted with import/export weights extracted from CCSBT Secretariat’s own Catch Documentation Scheme (CDS) database.
Results extracted from the GTA and presented here should be considered with caution due to inherent limitations of the extracted data. For example, CCSBT’s subscription includes only a subset of all the GTA data available. In addition, some low unit price figures and unexpected import/export results, potentially indicate that some miscoding of commodity codes is present within data sourced by GTA, i.e. that some non-SBT product may have been erroneously recorded as SBT commodity codes in the GTA data sources. These data limitations should be taken into account when reviewing the results below. Trade database extracts indicated that a total of 26 NCNMs (American Samoa, Barbados, British Virgin Islands, Brunei Darussalam, Canada, Ceuta, China, Dominican Republic, Hong Kong, Jamaica, Jordan, Kuwait, Lebanon, Malaysia, Netherlands Antilles, Norway, Panama, Russia, Singapore, Sri Lanka, Switzerland, Thailand, Turkey, United Arab Emirates, USA and Zimbabwe) were recorded as importers or export destinations (and so by implication importers). One additional importing NCNM (Mauritius) was identified from CDS records, giving a grand total of 27 importing NCNMs. Many of these importers received SBT in small quantities.
In addition, from combined GTA and CDS database extracts, a total of 11 NCNMs were recorded as exporters or implied exporters.
A general inspection of the CDS and GTA data suggests that the main markets outside the current CDS coverage include Hong Kong, Singapore, USA and more recently China.

2
Recommendations
The following recommendations are made to the ESC:
• That the list of States/entities subscribed to on the GTA trade database by the CCSBT Secretariat should be reviewed on an annual basis using global totals from the GTA and CDS.
• That the list of commodity codes currently subscribed to should be examined to determine whether they are sufficiently inclusive of SBT products, in particular SBT fillet products.
• That the ESC provides advice regarding what might be a useful threshold point in determining what price per kilogram for each of the two commodity codes presented here may indicate whether the product being traded could realistically have been SBT. For example, a price per kilogram of under US$3.00 per kilo for fresh/chilled commodity code 030236 might be sufficiently low to conclude that the product traded was not SBT.
• That the ESC provide suggestions regarding additional criteria that could be used to help verify whether product recorded under the two commodity codes presented here are likely to be species other than SBT. These could include criteria such as excluding exports of fresh product from States/entities in the northern hemisphere, or exports of fresh product from States/entities with only distant water SBT fishing fleets, because there is a relatively low possibility that such product could actually be SBT.
• That continued efforts are made to encourage any NCNMs that either import or export significant quantities of SBT to become OSECs in terms of the CCSBT Resolution on the CDS.

3
Table of Contents
1.0 BACKGROUND ................................................................................................................................... 4
2.0 METHODOLOGY ................................................................................................................................ 5
2.1 Trade Database - GTA .................................................................................................................... 5
2.2 CCSBT Catch Documentation Scheme (CDS) Database ................................................................. 6
2.3 Presentation of European Union Data .......................................................................................... 7
3.0 RESULTS ............................................................................................................................................. 7
3.1 Imports – Trade Database ............................................................................................................. 8
3.2 Exports – Trade Database ............................................................................................................ 11
3.3 Comparison of Imports and Export Weights Extracted from the Trade & CDS Databases ......... 15
4.0 CONCLUSIONS ................................................................................................................................. 20
4.1 Interpretation of the Data ....................................................................................................... 20
4.2 Importers ................................................................................................................................. 20
4.3 Exporters .................................................................................................................................. 21
4.4 Comparison of GTA Trade Database and CDS Quantities ........................................................ 22
Attachment 1 – GTA Trade Database - Subscription ........................................................................ 23
Attachment 2 – GTA Trade Database – Subscription States/ Entities ............................................... 27

4
1.0 BACKGROUND In October 2010, the Fifth Meeting of the Compliance Committee (CC5) noted that the increase in domestic consumption of SBT by some Members, and emerging markets for SBT warranted analysis of market and trade data to allow a comparison with reported catches and identify any catches or trade by Non-cooperating Non-Members (NCNMs), i.e. States and entities that are neither Members nor Cooperating Non-Members). The Extended Commission (EC) agreed that a Compliance Plan should be developed as recommended by CC5, and that the plan should place special emphasis on managing various compliance risks, including expanding and emerging markets which could potentially compromise the effectiveness of total allowable catch and the associated Catch Documentation Scheme (CDS).
In October 2011, the 6th Meeting of the Compliance Committee (CC6) also recommended that market analyses be conducted, and that a subscription to a trade database be taken out to allow these analyses to be undertaken. Further, CC6 recommended that the ESC be tasked with developing a methodology for using these trade figures to analyse market trends.
In addition, at CC6, Australia’s paper (CCSBT-CC/1110/BGD01) (originally presented as paper CCSBT-ESC/1107/22) on “Principles for an analysis of established, expanding and emerging markets” provided useful background information on sources of commercial trade data, and presented two options for examining trade statistics through on-line databases. One of the options suggested was that the CCSBT Secretariat subscribe to the Global Trade Atlas® (GTA) database.
Following on from these recommendations, the CCSBT Secretariat subscribed to the Global Trade Atlas® (GTA) online trade database administered by Global Trade Information Services (GTI) in January 2012.

5
2.0 METHODOLOGY The majority of the data presented here have been extracted from the GTA trade database. Data extracted from the Secretariat’s own CDS database are also presented for comparative purposes in Section 3.3.
More information about these two databases is provided below.
2.1 Trade Database - GTA The Secretariat commenced an initial annual subscription to the Global Trade Atlas® (GTA) trade database on 19 January 2012. The database application can be found at the following link: http://www.gtis.com/gta/. This database allows users to extract information on trade flows, i.e. imports, exports, trade balance and total trade for pre-specified States/ entities, commodity codes, time periods and units of value and weight. A more detailed description of the trade database, and the Secretariat’s rationale for the selection of its subscription parameters, is available at Attachment 1.
2.1.1 SUBSCRIPTION PARAMETERS When considering the results displayed in these tables, note that for cost-benefit reasons, the
Secretariat has subscribed to only a subset of the data available on the trade database, and that the results reported here are derived from that subset of data only. The Secretariat has subscribed to:
i) 45 of the 80-plus States/entities available (refer to Attachment 1), ii) Two of the many 6-digit Harmonised System (HS) commodity codes: HS 030236 and HS 030346, the first of which includes fresh/ chilled SBT, and the second which includes only frozen SBT, and iii) Currency and quantity information.
Note: Commodity codes HS 030236 and 030346 are the only two high-level HS codes in which SBT is separated from other tunas. However, neither of these commodity codes includes SBT fillet products which could also potentially be a significant SBT product type in emerging market trading.
Fresh/ Chilled Commodity - 030236: Southern Bluefin Tunas (Thunnus Maccoyii), Excluding Fillets, Livers & Roes; Fresh Or Chilled
Frozen Commodity - 030346: Southern Bluefin Tunas (Thunnus Maccoyii), Other Than Fillets, Livers & Roes And Fish Of Heading 0304, Frozen
However, there are additional commodity codes within the HS 030400 series which do include fillet product (refer to the table in Annex 1), and it might be useful to consider whether some country-specific fillet commodity codes within the HS 030400 series can/ should be added to the Secretariat’s subscription in future.

6
2.1.2 TIMEFRAME Data are presented for the years 2009 to 2011 inclusive and for the first quarter of 2012 as this is the most recent period for which complete datasets are available. Data were current at the time of extraction from the GTA trade database on 15 June 2012.
2.1.3 UNITS Data in Tables 1 – 9 are presented in both quantities (tonnes) and as unit prices (USD per kilo). The unit prices are presented to assist with consideration of whether the product being traded is likely to be SBT. Very low unit prices, for example USD $1/kilo for frozen SBT could imply that the product traded was unlikely to be SBT, i.e. that another species was potentially miscoded to an incorrect commodity code.
2.2 CCSBT Catch Documentation Scheme (CDS) Database The CCSBT Secretariat maintains a database that stores all CDS information submitted by Members and Cooperating Non-Members (CNMs). The CDS commenced on 1 January 20101. However, because there is a significant time-lag between the date of actual fishing and the date of submission and receipt of data by the Secretariat, full data sets are currently only available to be extracted from the CDS database from 1 January 2010 up until 31 December 2011.
All CCSBT Members and CNMs are required to adhere to the provisions of the CDS and submit CDS documents, including information detailing landed domestic product, exports, re-exports or imports, to the CCSBT Secretariat.
In addition, the provisions of the CDS Resolution apply to any ‘Other State/ Fishing Entity Cooperating in the CDS’ (OSEC), where an OSEC has expressed its commitment in writing to cooperate with the CDS resolution. However, there are currently no formally recognised OSECs in terms of the CDS Resolution, although Mauritius has agreed to cooperate (but has not yet submitted information on validation), and the USA has incorporated instructions about CCSBT CDS documentation into their Highly Migratory Species International Trade Permit Regulations.
In practice, this means that no CDS documents have been returned to the Secretariat by States/entities which may have imported or expected SBT product if they are a Non-cooperating Non-member (NCNM). Therefore, data extracted from the CDS system will not include any information received from NCNMs. However, the State/Fishing Entity of the intended export destination is required to be included on CDS Catch Monitoring Forms, and this can be used to provide information on intended export destinations which are NCNMs.
1 Resolution on the Implementation of a CCSBT Catch Documentation Scheme (modified 10 October 2010)

7
2.3 Presentation of European Union Data In the GTA trade database, trade figures can be extracted separately for each Member of the European Union (EU), where the EU consists of 27 Members in total. However, for the purposes of the summary tables presented in this paper, trade figures for members of the EU have been grouped together and presented as one trading block.
This approach was taken firstly, because the EU Members as a whole are a recognised CNM of CCSBT, and have a combined allocation of SBT of 10t. Secondly, there is significant trading between EU Members. Therefore, it could be misleading if a single aggregated total of EU import and export figures was presented, because this would almost certainly include SBT which had been traded and re-counted multiple times within the EU group within the same year.
Therefore, in order to distinguish between product entering and leaving the EU from/ to non-EU Member States, EU trade values are presented in two groupings: i) Imports/ exports that came from/went to another EU member,
ii) Imports/ exports that came from/went to a non-EU member.
3.0 RESULTS In the first part of this section data extracted from the GTA trade database are displayed in separate tables for each commodity code, fresh/ chilled (030236) or frozen (030346). Results are presented separately for the fresh/chilled and frozen commodities because they represent different market commodities for which different unit prices are paid.
Throughout the results section, a cell shaded as below indicates a:
Non-cooperating Non-member (NCNM). In addition, in import sources and export destinations tables, NCNMs are represented by text in red. In the second part of this section, import and export quantities extracted from the GTA database are compared to import/export quantities available from CCSBT’s Catch Documentation Scheme (CDS) where these are available.

8
3.1 Imports – Trade Database Tables 1 to 6 show the imported quantities and values for fresh/chilled (HS 030236) and frozen (HS 030346) SBT recorded in the database between 2009 and 2011, and for the first quarter of 2012 for States/entities included within the CCSBT subscription.
Commodity Code: 030236 (fresh/chilled) Table 1: Imports Between 2009 -2011 and the First Quarter of 2012 (for subscription states/ entities)
NA – A USD per kilo figure has not been displayed for the EU group because each EU Member had an individual USD per kilo figure and it would not have been representative to average these.
Table 2: Import Sources: 2009 -2011 and the First Quarter of 2012 (for subscription states/ entities)
Note: NCNMs are represented by the text in red

9
Table 3: Frozen Imports Between 2009 -2011 and the First Quarter of 2012 (for subscription states/ entities)
NA – A USD per kilo figure has not been displayed for the EU group because each EU Member had an individual USD per kilo figure and it would not have been representative to average these.
Table 4: Import Sources: 2009 -2011 and the First Quarter of 2012 (for subscription states/ entities)
Note: NCNMs are represented by the text in red

10
3.1.1 Non-Cooperating Non-Members as Importers of SBT For the past 3-4 years Tables 1 to 4 indicate that:
i) Fresh/Chilled SBT (Commodity Code: 030236)
• Fresh/ chilled SBT was imported by the NCNMs China, Hong Kong, Singapore, Thailand and the USA.
ii) Frozen SBT (Commodity Code: 030346)
• Frozen SBT was imported by the NCNMs China, Singapore, Sri Lanka, Thailand and the USA, with the USA having consistently imported the greatest quantities. The price per kilogram (US$2.00) for Sri Lanka’s imports of SBT product seem low, suggesting it’s possible that another species has been miscoded as SBT in error.
3.1.2 Non-Cooperating Non-Members as Import Sources of SBT For the past 3-4 years Tables 1-4 indicate that:
i) Fresh/Chilled SBT (Commodity Code: 030236)
• The European Union (EU) is reported as having imported fresh/chilled SBT from Morocco, Tunisia and the USA. Japan also appears to have imported fresh/chilled SBT from the USA. Singapore was reported as importing fresh/chilled SBT from Thailand.
• Despite the data extracted above, imports of fresh SBT from Morocco, Thailand, Tunisia and the USA seem unlikely2, and could potentially be explained by other fish species having been erroneously miscoded to SBT commodity codes.
ii) Frozen SBT (Commodity Code: 030346)
• According to extracts from the GTA, the European Union imported frozen SBT from Panama; Korea and Singapore imported frozen SBT from Turkey, and the USA imported frozen SBT from India. However, once again, while possible for frozen SBT, none of these imports from NCNMs seem likely. Potentially, miscoding of northern bluefin as SBT could represent a more plausible explanation – also refer to the following section 3.1.3.
3.1.3 Additional Notes on SBT Trading by the Members and CNMs For the past 3-4 years Tables 1 to 4 indicate that:
• There were significant imports of SBT (both fresh/chilled and frozen) from one EU Member State to another EU Member State. The level of these imports exceeded both the EU’s SBT allocation and the EU’s SBT imports from non-EU Members by a factor of greater than ten in each year.
2 It is not likely that these States/entities caught their own SBT; in addition their potential to re-export fresh SBT does not seem so feasible from a practical perspective

11
• Fresh/ chilled SBT are less likely to be readily available for trading amongst EU Members. Therefore, it’s possible that some recorded imports of fresh/ chilled SBT recorded within EU Member States could be attributed to miscoded commodity codes provided to the GTA trade database, i.e. the product traded may have been incorrectly coded as fresh/chilled SBT (HS 030236).
• For frozen SBT, other reasons3 could be considered for the relatively high levels of importing within EU Members. However, given the likelihood of miscoding of fresh/chilled SBT noted above, the potential for a commodity code miscoding error should also be considered here.
• The low price per kilogram (USD $1.79) for imports by South Africa (from Japan) in 2010 suggest that this could potentially be a commodity code miscoding error.
3.2 Exports – Trade Database Tables 5 to 8 show the exported quantities and values for fresh/ chilled (HS 030236) and frozen SBT (HS 030346) recorded in the trade database between 2009 and 2011, and for the first quarter of 2012 for States/entities included within the CCSBT subscription.
Table 5: Fresh/Chilled Exports Between 2009 -2011 and the First Quarter of 2012 (for subscription states/ entities)
NA – A USD per kilo figure has not been displayed for the EU group because each EU Member had an individual USD per kilo figure and it would not have been representative to average these.
3 Including potential under-reporting of EU SBT catch or under-reporting of SBT imports from non-EU Members.

12
Table 6: Export Destinations: 2009 -2011 and the First Quarter of 2012 (for subscription states/ entities)
Note: NCNMs are represented by the text in red
Table 7: Frozen Exports Between 2009 -2011 and the First Quarter of 2012 (for subscription states/ entities)
NA – A USD per kilo figure has not been displayed for the EU group because each EU Member had an individual USD per kilo figure and it would not have been representative to average these.

13
Table 8: Export Destinations: 2009 -2011 and the First Quarter of 2012 (for subscription states/ entities)
Note: NCNMs are represented by the text in red
3.2.1 Non-Cooperating Non-Members as Exporters For the past 3-4 years, Tables 5 to 8, showing data extracted from the GTA database, indicate that:
i) Fresh/Chilled SBT (Commodity Code: 030236)
• Fresh/chilled product has been exported by the USA over the past 3 years.
ii) Frozen SBT (Commodity Code: 030346)
• Frozen SBT was recorded as exported by Singapore, the United States, Vietnam and Yemen, with the largest regular exporter of frozen SBT having been Singapore.
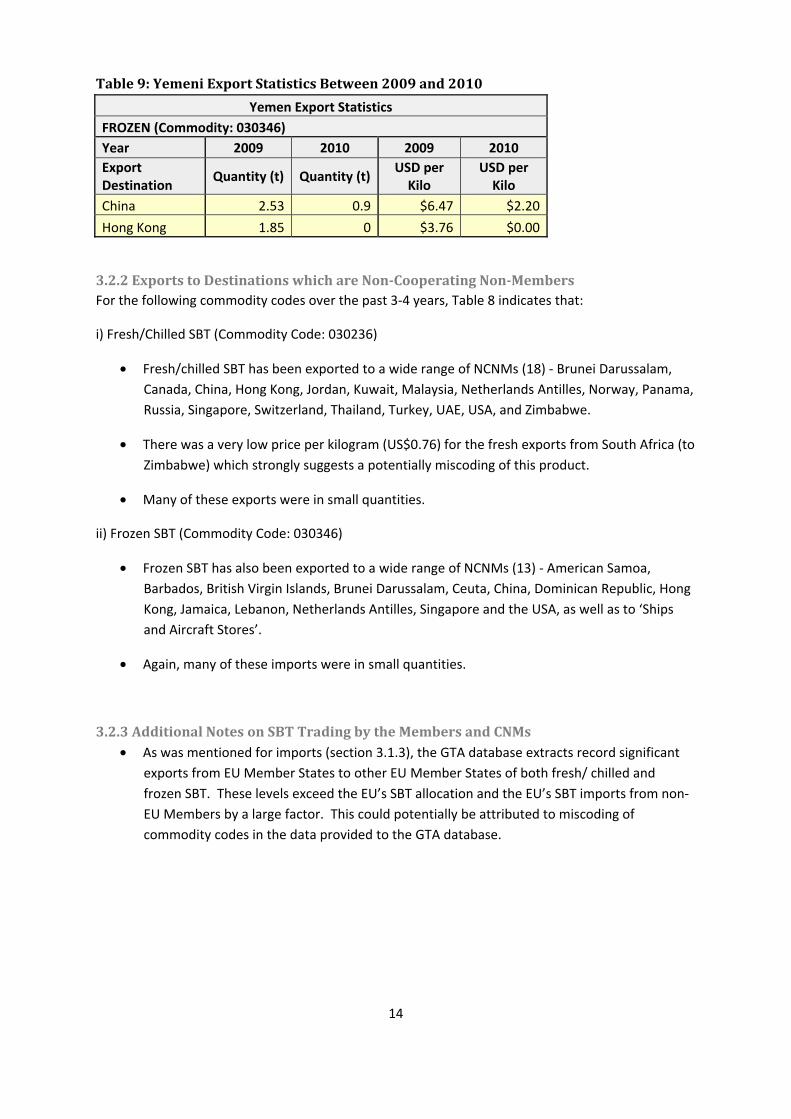
• According to figures extracted from the GTA trade database, Vietnam exported frozen SBT to the USA in 2010, and Yemen also exported frozen SBT in 2009 and 2010. Price per kilogram data are not available to assist with cross-checking the likelihood that Vietnam’s exports were in fact SBT. However, the price for the Yemen commodity is available was very low at least in the case of exports to China in 2010 (USD $2.20/kg), which could indicate that this product may not have been SBT (Table 9).
• If it seems plausible that Vietnam and/ or Yemen did in fact export frozen SBT, then the source of the Vietnamese and Yemeni frozen SBT should be checked in more detail,. Neither country was reported in GTA as having imported either fresh/chilled or frozen SBT (HS 030236, 030346) between 2009 and 2010, therefore potentially indicating that these countries may have caught their own SBT for export, although this seems unlikely for Vietnam.
14
Table 9: Yemeni Export Statistics Between 2009 and 2010 Yemen Export Statistics
FROZEN (Commodity: 030346) Year 2009 2010 2009 2010 Export Destination Quantity (t) Quantity (t) USD per
Kilo USD per
Kilo China 2.53 0.9 $6.47 $2.20Hong Kong 1.85 0 $3.76 $0.00
3.2.2 Exports to Destinations which are Non-Cooperating Non-Members For the following commodity codes over the past 3-4 years, Table 8 indicates that:
i) Fresh/Chilled SBT (Commodity Code: 030236)
• Fresh/chilled SBT has been exported to a wide range of NCNMs (18) - Brunei Darussalam, Canada, China, Hong Kong, Jordan, Kuwait, Malaysia, Netherlands Antilles, Norway, Panama, Russia, Singapore, Switzerland, Thailand, Turkey, UAE, USA, and Zimbabwe.
• There was a very low price per kilogram (US$0.76) for the fresh exports from South Africa (to Zimbabwe) which strongly suggests a potentially miscoding of this product.
• Many of these exports were in small quantities.
ii) Frozen SBT (Commodity Code: 030346)
• Frozen SBT has also been exported to a wide range of NCNMs (13) - American Samoa, Barbados, British Virgin Islands, Brunei Darussalam, Ceuta, China, Dominican Republic, Hong Kong, Jamaica, Lebanon, Netherlands Antilles, Singapore and the USA, as well as to ‘Ships and Aircraft Stores’.
• Again, many of these imports were in small quantities.
3.2.3 Additional Notes on SBT Trading by the Members and CNMs • As was mentioned for imports (section 3.1.3), the GTA database extracts record significant
exports from EU Member States to other EU Member States of both fresh/ chilled and frozen SBT. These levels exceed the EU’s SBT allocation and the EU’s SBT imports from non-EU Members by a large factor. This could potentially be attributed to miscoding of commodity codes in the data provided to the GTA database.

15
3.3 Comparison of Imports and Export Weights Extracted from the Trade & CDS Databases For this section, data are only available from the CDS database between January 2010 and December 2011.
3.3.1 Background Information CDS: Importers and Intended Export Destinations For the CDS database, SBT import destinations and quantities are normally derived from the import documentation of the importing State or entity. In some cases, data have not been received from the importer, but corresponding documentation has been received from the exporter. This is usually the case where importers are NCNMs. In these situations, the importing State/entity and quantity were assumed to equate to the intended export destination and quantity provided in the exporter documentation.
Also, because there are currently no OSECs party to the CDS Resolution, if no intended export destination was provided by the exporter, and the SBT was exported to a NCNM, then the import State or entity will not be available on the CDS database. However, this was the case for less than 0.5% of the CDS catch monitoring forms on which exports were recorded in 2010 and 2011.
CDS and GTA Database Product Types The CDS database reports on all SBT product types. The two commodity codes subscribed to in the GTA trade database include only SBT products other than fillets, livers and roes. Therefore, in some cases, SBT quantities extracted from the GTA trade database might be expected to be an underestimate of the total SBT exported or imported, because the GTA figures will not include any weights for fillet, liver or roe products.
CDS Quantity Information (tonnes) The weights reported here from the CDS database are actual weights of imports/exports which have had no conversion factors applied to them, i.e. there has been no attempt to convert values to total live weight values. This approach was taken to better facilitate direct comparisons with trade data figures.
Year of Import/ Export The import year for which these results are presented is the year in which SBT arrived in the importing State or entity. This may be a different year from which these same SBT were recorded as being exported, for example the fish may have been recorded as being exported in November 2010 by the exporter, but may not have reached the importer and been reported as an import until January 2011, etc. These differences between exporting year and importing year could potentially contribute to an apparent mismatch in exported versus imported quantities within any one year, when comparing annual quantities between the two databases.

16
Re-export Data
Re-exporting trade practices could potentially cause an apparent mismatch between the trade quantities extracted from the CDS database versus those extracted from the GTA trade database. For example, for import statistics, the source of the import usually refers to the initial ‘country of origin’ (not for example the re-exporting State/entity name), while for export statistics, export destination can refer to either the intermediary (re-exporting) or ‘Final destination’ of the export.
European Union Only the ‘EU – imported/exported to non-EU Members’ weights are considered for discussion in this section because the ‘EU – imported/exported to EU Members’ may include fish/SBT which has been imported and/or exported multiple times, as well as fish about which commodity code classification queries have already been raised (refer to sections 3.1.3 and 3.2.3). However, the ‘EU – imported/exported to EU Members’ data are included to ensure completeness of the datasets presented.
3.3.2 Comparison of Imported Weights
The following tables show the total weight of imports recorded by the CDS for 2010 and 2011, in comparison to the combined fresh/frozen weights for the two HS commodity codes 030236 and 030346 extracted from the GTA trade database.
Table 10: CDS Versus Trade Database Imported Weights: 2010
* These were the States/ entities listed as the intended export destinations in the CDS database, and so for the purposes of this table, assumed to be the importers of the SBT product

17
Table 11: CDS Versus Trade Database Imported Weights: 2011
* These were the States/ entities listed as the intended export destinations in the CDS database, and so for the purposes of this table, assumed to be the importers of the SBT product
Import Comparison Summary
2010 and 2011:
• Generally, for each State/entity, the CDS database extracts show higher levels of imports than extracted from the GTA trade database,
• For the EU (imports from non EU Members), Korea and Singapore in 2010 and 2011, and for China in 2011, the GTA trade database recorded higher levels of SBT imports than those extracted from the CDS database. For China and Singapore, this is most likely due to the fact that they are NCNMs, and so therefore unlikely to have all of their implied import information (implied from export destinations filled out by Members and NCNMs) available in the CDS database. The EU has not submitted any CDS documentation, which probably accounts for the EU (imported from non-EU Members) difference in the CDS (0) versus GTA quantities. NB: EU exports to EU Members are excluded from consideration here.
• For New Zealand in 2011, and Thailand in 2010 and 2011, slightly higher (less than 1 tonne) import quantities are recorded in the trade database than in the CDS database.

18
3.3.3 Comparison of Exported Weights The following tables show the total weight of exports recorded in the CDS database for 2010 and 2011, in comparison to the combined fresh/frozen totals for the two HS commodity codes 030236 and 030346 extracted from the GTA trade database. No export weights are available from the CDS database for NCNMs because they are not required to submit CDS documents to the Secretariat.
Note: For CDS total weights, both exports and re-exports of SBT are included within the total export weights.
Table 12: CDS Versus Trade Database Exported Weights: 2010
2010 Exporter CDS: Total Fresh +
Frozen Product Exported (t)
GTA: Total Fresh (030236) + Frozen (030346) Product
Exported (t)
Australia 6,616.27 6,099.76EU - Exported to non-EU members 0.00 0.00EU - Exported to EU members 0.00 359.00Indonesia 496.41 2.02Japan 116.93 28.60Korea 875.02 358.96New Zealand 479.14 318.80Philippines 37.00 0.00South Africa 22.51 0.18Taiwan4 968.66 642.32Singapore NA 20.83USA NA 4.80
Vietnam NAThere is not quantity value
available, only a total USD value of USD $73,089
Yemen NA 0.90
NA – There is no information available for these States/ entities in the CDS database as they are NCNMs which do not submit CDS documents to the Secretariat
4 The CDS database records show that Taiwan’s SBT are often caught in one year, and exported/received by the importer in the following year. This could be the reason for the large discrepancy shown between Taiwan’s weights recorded in the CDS system for 2010 ad 2011 versus the corresponding weights shown for the GTA trade database. If the recorded weights for the CDS are added together for the years 2010 and 2011, a total weight of 1429.18t is obtained. Similarly, if the recorded weights in the GTA trade database for 2010 and 2011 are summed, then a total of 1443.67t is obtained, i.e. both databases give very similar weights when the total weights for years 2010 and 2011 are combined.

19
Export Comparison Summary: 2010
• Generally, for each State/entity, the CDS database extracts show higher levels of exports than those extracted from the trade database,
• For the EU, all exports recorded in the trade database are recorded as taking place between EU Members only. NB: EU exports to EU Members are excluded from consideration here.
• No States/entities show higher levels of exports of SBT recorded in the GTA trade database than in the CDS database.
Table 13: CDS Versus Trade Database Exported Weights: 2011
2011 Exporter CDS: Total Fresh +
Frozen Product Exported (t)
GTA: Total Fresh (030236) + Frozen (030346) Product
Exported (t)
Australia 7,218.46 7,233.89EU - Exported to non-EU members 0.00 0.20EU - Exported to EU members 0.00 269.70Indonesia 619.93 37.92Japan 76.63 1.21Korea 769.15 316.84New Zealand 479.06 347.87Philippines 39.13 0.00South Africa 36.24 0.00Taiwan4 460.52 801.35Singapore NA 12.25
NA – There is no information available for this States/ entity in the CDS database as it is a NCNM which is not required submit CDS documents to the Secretariat
Export Comparison Summary: 2011
• Generally, for each State/entity, the CDS database extracts show higher levels of exports than those extracted from the trade database,
• For the EU, almost all exports recorded in the trade database are recorded as taking place between EU Members only, except for 0.2t of SBT, which is not recorded in the CDS database. NB: EU exports to EU Members are excluded from consideration here.
• Australian exports are recorded as slightly higher in the trade database than those recorded in the CDS database.
• Taiwan has a much greater export weight of SBT recorded in the trade database than recorded in the CDS database, however see footnote 4.

20
4.0 CONCLUSIONS
This report focuses on examining importing and exporting by Non-cooperating Non-Members (NCNMs) in terms of the CCSBT CDS Resolution.
4.1 Interpretation of the Data Care should be taken when interpreting data from the GTA trade database because the Secretariat’s subscription includes only a subset of the data, for example 45 out of 80+ possible States/ entities available.
Note that for section 4.2 below, only the following States/ entities are considered to be importers of the two SBT commodity codes: i) Those subscribed to on the trade database which imported SBT, ii) Those on the trade database listed as export destinations for SBT (can be extracted whether included as part of the subscription or not), iii) Those that have returned CDS import documentation, iv) Those for which no CDS import destination was received, but the intended export destination was supplied, and so this was assumed to represent the importer.
Note that for section 4.3 below, only the following States/ entities are considered to be exporters of the two SBT commodity codes: i) Those subscribed to on the trade database which exported SBT, ii) Those on the trade database which were indicated as import sources for one of the two SBT commodity codes (can be extracted whether included in the subscription or not), iii) Those which have returned CDS export documentation.
4.2 Importers
• SBT is imported by States/entities which are NCNMs, and examples of this trade are evident from both the CDS and trade databases.
• On the GTA database 5 NCNMs (China, Singapore, Sri Lanka, Thailand and the USA) were recorded as importers of SBT product between 2009 and the first quarter of 2012. However, the price per kg of the Sri Lankan product is very low, potentially indicating that the product was miscoded as SBT.
• An additional 21 NCNMs (American Samoa, Barbados, British Virgin Islands, Brunei Darussalam, Canada, Ceuta, Dominican Republic, Hong Kong, Jamaica, Jordan, Kuwait, Lebanon, Malaysia, Netherlands Antilles, Norway, Panama, Russia, Switzerland, Turkey, United Arab Emirates and Zimbabwe) were listed as export destinations (and by implication importers) of the two SBT commodity codes combined. 18 of these States/entities were destinations for fresh/chilled SBT and 13 for frozen SBT. Some frozen SBT also went to a destination described as ‘Ships and Aircraft stores’.
• One additional importing NCNM (Mauritius) was identified from CDS records.

21
• These results must be considered cautiously, as it’s possible that some non-SBT product may have been erroneously coded as SBT commodity codes.
• In comparison to data extracted from the GTA trade database, only 9 NCNMs (China, Hong Kong, Malaysia, Mauritius, Russian Federation, Singapore, Switzerland, Thailand, and the USA) were recorded as intended export destinations (and by implication importers) in the CDS database between 2010 and 2011. This shows that the GTA Trade database has potential to identify more SBT trade than is possible from the CDS.
4.3 Exporters • The majority of significant exporting States/entities obtained from the GTA trade database
were Members or CNMs of CCSBT. However, there was a total of 11 NCNMs listed as either exporters or exporters by implication.
• Of the States/entities subscribed to on the GTA trade database, only 1 NCNM, the USA, was recorded as having exported fresh/chilled SBT between 2009 and the first quarter of 2012, although again this could potentially be explained by miscoding of commodity codes.
• Of the States/entities subscribed to on the GTA trade database, 4 NCNMs were recorded as exporters of frozen SBT between 2009 and the first quarter of 2012 - Singapore, the USA, Vietnam and Yemen, with Singapore recorded as being the most significant exporter. However, the low value USD per kilo value of some of the Yemeni exports (2010) could potentially suggest that the product was miscoded as SBT.
• The only NCNMs (4) extracted from the trade database which were import sources (i.e. implied exporters) of fresh/ chilled SBT between 2009 and the first quarter of 2012 that were Morocco, Thailand, Tunisia and the USA, with unit prices varying between USD$4.11 per kilo to USD$12.73 per kilo.
• The only NCNMs (4) extracted from the trade database which were import sources (i.e. implied exporters) of frozen SBT between 2009 and the first quarter of 2012 were Hong Kong, India, Panama and Turkey, with unit prices varying between USD$2.00 per kilo to USD$44.26 per kilo. The lower unit prices may potentially indicate that the product traded was not actually SBT, and that it had been miscoded.
• By definition of the scheme, the CDS only holds export quantities for existing Members (6) and CNMs (3) of CCSBT, however no information on SBT exports has been submitted by the EU.

22
4.4 Comparison of GTA Trade Database and CDS Quantities • Where export/import quantities were available for both the CDS and GTA trade database,
quantities extracted from the GTA database might be expected to be an underestimate of SBT imported/exported in some cases. That is because for the GTA database, only data from 2 commodity codes were selected which didn’t include fillet, liver or roe products, whereas the CDS quantities included all product types.
• Generally, for Members and CNMs, the CDS extracts showed higher levels of import and export quantities than the quantities extracted from the GTA trade database. However, the EU showed higher levels of imports in the data extracted from the GTA trade database, as did Korea in 2010 and 2011.
Prepared by the Secretariat
23
Attachment 1
GTA Trade Database - Subscription
1. GTA Features
A subscription to the GTA trade database application was selected as this database has numerous advantageous features, including that:
• it collates trade data from a larger number of reporting States/ entities than can be accessed through individual trade data systems, and
• a long time series of historical data is available in one place.
2. GTA Subscription Parameters
At the time of subscription, the user must specify the following details:
• Commodity codes,
• The set of States/ entities of interest,
• The units in which the trade data are presented, i.e. in terms of US Dollar currency value and/or quantity (tonnes or kilograms).
The following paragraphs list the commodity codes, unit types, and States/ entities selected to form the basis of the Secretariat’s subscription, and some of the rationale behind these choices.
2.1 Commodity/ Product Codes There are a range of standard 6-digit Harmonised System (HS) codes which may be used to track southern bluefin tuna commodities/ products – some of these are presented in Table 1. These codes were internationally harmonised under the International Convention on the Harmonisation of Frontier Controls of Goods.

24
Commodity Code Descriptions
HS Commodity Code HS Commodity Description
HS 030195 Southern Bluefin Tunas (Thunnus maccoyii), Live
HS 030236 Southern Bluefin Tunas (Thunnus maccoyii), Excluding Fillets, Livers & Roes; Fresh Or Chilled
HS 030346 Southern Bluefin Tunas (Thunnus maccoyii), Other Than Fillets, Livers & Roes And Fish Of Heading 0304, Frozen
HS 030400 series Fish Fillets And Other Fish Meat (Whether Or Not Minced), Fresh, Chilled Or Frozen This series includes the codes listed below - HS030449, HS030420 and HS030487.
HS 030420 (part of HS 030400 series)
Fish Fillets, Frozen The HS 030420 code includes the more specific codes, for example the Japanese import code 030420094: Fillets of southern bluefin tunas, frozen
HS 030449 (part of HS 030400 series)
Fish Fillets, Fresh Or Chilled, not elsewhere specified or indicated The HS 030449 general code includes more specific codes, for example the Japanese import code 030449220: Fillets Of Southern Bluefin Tunas (Thunnus Maccoyii),Fresh Or Chilled, and the Japanese export code 030449100: Fillets of tunas fresh or chilled
HS 030487 (part of HS 030400 series)
Tuna (Of The Genus Thunnus), Skipjack Or Stripe-Bellied Bonito (Euthynnus(katsuwonus) pelamis) fillets, Frozen. The HS 030487 code includes the more specific codes, for example the Japanese import code 030487030: Frozen fillets of southern bluefin tunas (Thunnus Maccoyii),
2.1.1 Commodity Codes Subscribed to by the Secretariat
The two commodity codes that the Secretariat has chosen to subscribe to on the GTA database are the two codes highlighted in table above (HS 030236 and 030346). There is one fresh/chilled and one frozen commodity code. Note that neither code includes fillet, liver or roe products. a) HS 030236 Southern Bluefin Tunas (Thunnus maccoyii), Excluding Fillets, Livers & Roes; Fresh Or Chilled,

25
b) HS 030346 Southern Bluefin Tunas (Thunnus maccoyii), Other Than Fillets, Livers & Roes And Fish Of Heading 0304, Frozen. 2.1.2 Codes not Currently Subscribed to by the Secretariat a) HS 030195 This commodity code represents live SBT. This code has been excluded from the Secretariat’s subscription because no trade of live SBT is currently recognised. However, this situation should be reviewed in the future.
b) HS 030400 Series: 030449 & 030487 The Secretariat investigated subscribing to commodity codes HS 030449 and 030487 which include fillet products. However, these higher level commodity codes include a mix SBT and other tuna species fillet products and further processed states such as minced only fillet products. Therefore, the Secretariat decided not to subscribe to these fillet codes when taking out the initial subscription.
2.2 Units of Value/Weight The GTA application stores trade figures in terms of both currency value and quantity (weight in kg or tonnes). The Secretariat’s subscription includes trade summaries in all of these units. This was considered necessary, because in cases where unusual amounts of SBT trade are detected, price per kg can be a useful indicator for checking the validity of the data. For example, a significantly lower unit price ($ per kilogram) observed relative to regular SBT market prices could potentially indicate if the product traded was actually SBT, or whether perhaps an incorrect HS code may have been used.
2.3 States/Entities
The cost for access to trade data for all 80-plus States/entities available for monthly data for the two selected commodity codes was US$9,920 for a 12 month period which was outside the available budget. However, the cost for 25 States/entities was US $2,500 per annum, with a further reduction to $2300 per annum if more than 6 European Union (EU) members were selected. This is because once more than 6 European Union members are selected, then the remaining members are provided at no additional cost. Therefore, the Secretariat initially chose to subscribe to 25 States/entities. The following selection criteria were applied to identify which initial 25 States /entities should be included within the Secretariat’s subscription: a) CCSBT Members and CNMs
Australia, Indonesia, Japan, Korea, New Zealand, Taiwan, 2 main fishing states of the EU (i.e. Spain and Portugal), the Philippines, and South Africa (Total = 10).

26
b) States/ entities which were discussed at recent CCSBT meetings China, Hong Kong, Mauritius, Singapore, the USA and Vietnam (Total = 6)5.
c) States/ entities which have SBT catch records over the past 10 years6
No SBT catch records have been identified for States/ entities other than those of the CCSBT Members and CNMs , hence no additional States/ entities were added here (Total = 0).
d) States/ entities which have significant export or importing records for SBT over the past 3
years7 i) Potential SBT importing States/ entities 8 France (EU), Germany (EU), Italy (EU), Luxembourg (EU), the Netherlands (EU), the United Kingdom (EU), Sri Lanka, and Thailand (Total = 8). ii) Potential SBT exporting State/ entity Yemen9 (Total = 1).
Parts a) – d) above give a total of 25 States/ entities of which 8 are EU members. Because data for all of the European Union members have been provided at no extra charge, and data for the Russian Federation have now also been added (in effect to ‘replace’ Yemen as receipt of new data from Yemen is becoming problematical), the number of States/entries that are actually included within CCSBT’s subscription is currently 45. The complete current list of subscription States/entities is included at Attachment 2.
This subscription list should however be reviewed annually. To assist with this task, the Secretariat will seek to obtain a table of import and export totals for the two commodity codes for all States/Entities in the GTA database on an annual basis. With such a table, it would be possible to detect if a State/entity which is not part of the current CCSBT subscription starts to import or export SBT.
5 Namibia was discussed at CCSBT17 due to its potential involvement with SBT as a port state. However, Namibia’s trade data are not available from the GTA database. 6 Source: FAO Global Tuna Catches by Stock database. 7 GTI provided the trade data extracts from GTA to check imports/exports of SBT (for commodity codes HS 030236 and HS 030346) between 2008 - 2010 by State/ entity (refer to Appendices 1 and 2 of Australia’s paper CCSBT-CC/1110/BGD01). 8 The GTA trade extracts indicated SBT imports to Ghana (169t in 2010), Iran (55t in 2010) and Canada (25t in 2008). However, it was considered that the unit prices for these imports were too low to be SBT product (i.e. under USD 1.0/kg for frozen, under USD 3.0/kg for fresh or chilled) 9 Yemen is considered to be a potential SBT catching state because it borders the Indian Ocean and had records of some SBT exports (18t in 2008, 4.38t in 2009, 0.9t in 2010).

27
Attachment 2
GTA Trade Database – Subscription States/ Entities
Subscription List of Countries/ Entities
Australia China European Union (27) Hong Kong Indonesia Japan Mauritius New Zealand Philippines Russia Singapore South Africa Republic of Korea Sri Lanka Taiwan Thailand United States Vietnam Yemen Total: 18 (non-EU) + EU
European Union Members (27)
Austria Belgium Bulgaria Cyprus Czech Republic Denmark Estonia Finland France Germany Greece Hungary Ireland Italy Latvia Lithuania Luxembourg Malta Netherlands Poland Portugal Romania Slovakia Slovenia Spain Sweden United Kingdom Total: 27 (EU)