Southern Africa site visit
33
SOUTHERN AFRICA SITE VISIT 21 st November 2016 Jwaneng mine
-
Upload
anglo-american -
Category
Business
-
view
32 -
download
0
Transcript of Southern Africa site visit

SOUTHERN AFRICA SITE VISIT21st November 2016
Jwaneng mine

2
CAUTIONARY STATEMENTDisclaimer: This presentation has been prepared by Anglo American plc (“Anglo American”) and comprises the written materials/slides for a presentation concerning
Anglo American. By attending this presentation and/or reviewing the slides you agree to be bound by the following conditions.
This presentation is for information purposes only and does not constitute an offer to sell or the solicitation of an offer to buy shares in Anglo American. Further, it does not
constitute a recommendation by Anglo American or any other party to sell or buy shares in Anglo American or any other securit ies. All written or oral forward-looking statements
attributable to Anglo American or persons acting on their behalf are qualified in their entirety by these cautionary statements.
Forward-Looking Statements
This presentation includes forward-looking statements. All statements other than statements of historical facts included in this presentation, including, without limitation, those
regarding Anglo American’s financial position, business and acquisition strategy, plans and objectives of management for future operations (including development plans and
objectives relating to Anglo American’s products, production forecasts and reserve and resource positions), are forward-looking statements. By their nature, such forward-looking
statements involve known and unknown risks, uncertainties and other factors which may cause the actual results, performance or achievements of Anglo American, or industry
results, to be materially different from any future results, performance or achievements expressed or implied by such forward-looking statements.
Such forward-looking statements are based on numerous assumptions regarding Anglo American’s present and future business strateg ies and the environment in which
Anglo American will operate in the future. Important factors that could cause Anglo American’s actual results, performance or achievements to differ materially from those in the
forward-looking statements include, among others, levels of actual production during any period, levels of global demand and commodity market prices, mineral resource
exploration and development capabilities, recovery rates and other operational capabilities, the availability of mining and processing equipment, the ability to produce and
transport products profitably, the impact of foreign currency exchange rates on market prices and operating costs, the availability of sufficient credit, the effects of inflation, political
uncertainty and economic conditions in relevant areas of the world, the actions of competitors, activities by governmental authorities such as changes in taxation or safety, health,
environmental or other types of regulation in the countries where Anglo American operates, conflicts over land and resource ownership rights and such other risk factors identified
in Anglo American’s most recent Annual Report. Forward-looking statements should, therefore, be construed in light of such risk factors and undue reliance should not be placed
on forward-looking statements. These forward-looking statements speak only as of the date of this presentation. Anglo American expressly disclaims any obligation or undertaking
(except as required by applicable law, the City Code on Takeovers and Mergers (the “Takeover Code”), the UK Listing Rules, the Disclosure and Transparency Rules of the
Financial Conduct Authority, the Listings Requirements of the securities exchange of the JSE Limited in South Africa, the SWX Swiss Exchange, the Botswana Stock Exchange
and the Namibian Stock Exchange and any other applicable regulations) to release publicly any updates or revisions to any forward-looking statement contained herein to reflect
any change in Anglo American’s expectations with regard thereto or any change in events, conditions or circumstances on which any such statement is based.
Nothing in this presentation should be interpreted to mean that future earnings per share of Anglo American will necessarily match or exceed its historical published earnings
per share.
Certain statistical and other information about Anglo American included in this presentation is sourced from publicly available third party sources. As such it presents the views of
those third parties, but may not necessarily correspond to the views held by Anglo American.
No Investment Advice
This presentation has been prepared without reference to your particular investment objectives, financial situation, taxation position and particular needs. It is important that you
view this presentation in its entirety. If you are in any doubt in relation to these matters, you should consult your stockbroker, bank manager, solicitor, accountant, taxation adviser
or other independent financial adviser (where applicable, as authorised under the Financial Services and Markets Act 2000 in the UK, or in South Africa, under the Financial
Advisory and Intermediary Services Act 37 of 2002).

WELCOME AND AGENDAPaul Galloway
- Monday morning Introduction and business update
- Monday afternoon De Beers Global Sightholder Sales
- Monday evening De Beers management dinner
- Tuesday Jwaneng diamond mine
- Tuesday evening Platinum management dinner
- Wednesday Mogalakwena mine
- Wednesday evening Dinner with local management
- Thursday Platinum marketing /
Polokwane smelter
- Thursday afternoon Depart
Mogalakwena mine

4
WHAT YOU WILL SEE THIS WEEK
RESOURCE
ENDOWMENT
BUSINESS
PROCESSESINNOVATION
OUR RESOURCES
Jwaneng and Mogalakwena: World class endowments support the building of world class assets.
OUR BUSINESS PROCESSES
Operating Model: Provides the structure and discipline to build world class operations.
OUR APPROACH TO INNOVATION
Building the Future: Using technology and our innovation tools to drive sustainable performance improvement.
“Our Assets, Our Business Processes and Innovation support People driving
competitive advantage”
PEOPLE
DRIVING
COMPETITIVE
ADVANTAGE

5
Indexed commodity price (1 Jan 2016 = 1)
+40%
+21%
+249%
+73%
(5)%
+17%
2016
YTD
Var.1 Jan ‘16
Vs.
10 Nov ’16
Platinum(6)
Met Coal(2)
Iron ore(3)
Diamonds
Copper
(5)
0.6
0.8
1.0
1.2
1.4
1.6
1.8
2.0
2.2
2.4
2.6
2.8
3.0
3.2
3.4
3.6
01 Nov01 Sep 01 Oct01 Aug01 Jul01 May 01 Jun01 Feb01 Jan 01 Mar 01 Apr
+52%Thermal Coal(4)
(1) Price line is equivalent to weighted average daily revenue for Q3 YTD 2016 sales volumes
(2) Met coal price line based on HCC spot and API6 thermal coal
(3) Iron ore price line based on CFR China
(4) Coal RSA and Colombia
(5) Anglo American excludes Samancor, Niobium, Phosphates, Corporate and OMI. Includes Nickel, not shown on the graph
(6) Platinum basket price
Source: Thermal Coal - globalCOAL; Diamonds – De Beers Rough Price Index, Platinum, Copper & Nickel - London Metal Exchange; Met Coal - Platts Steel markets
daily; Iron Ore – Platts 62% CFR China has been used in this instance as a generic industry benchmark.
Indexed commodity prices1 (1 Jan 2016 = 1)
COMMODITY PRICES
6
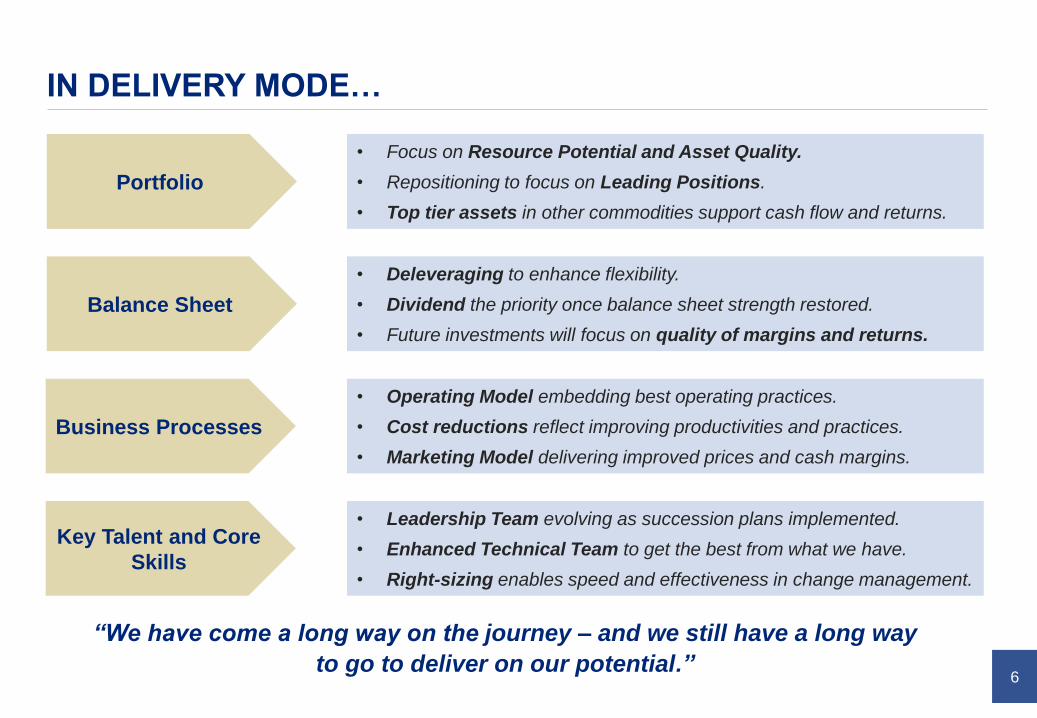
IN DELIVERY MODE…
“We have come a long way on the journey – and we still have a long way
to go to deliver on our potential.”
Portfolio
Balance Sheet
Business Processes
Key Talent and Core
Skills
• Focus on Resource Potential and Asset Quality.
• Repositioning to focus on Leading Positions.
• Top tier assets in other commodities support cash flow and returns.
• Deleveraging to enhance flexibility.
• Dividend the priority once balance sheet strength restored.
• Future investments will focus on quality of margins and returns.
• Operating Model embedding best operating practices.
• Cost reductions reflect improving productivities and practices.
• Marketing Model delivering improved prices and cash margins.
• Leadership Team evolving as succession plans implemented.
• Enhanced Technical Team to get the best from what we have.
• Right-sizing enables speed and effectiveness in change management.

7
SAFETY & ENVIRONMENT
SAFETY
Regrettably, 10 fatalities at end-October 2016.
Total recordable injuries rate and lost time injures
rate continue to improve – down 23% and 19%
respectively when compared to FY 2015.
All businesses are on the journey of “critical
controls management” and focus is on consistent
application of safe and efficient operating practices
at shop floor level.
ENVIRONMENT
Significant improvements in operational planning
with 50% improvement YTD 2016 compared to FY
2015.
Lower level incidents also show consistent
improvement – better control of unwanted events.
Focus on step change innovation to reduce water
and energy usage supports cost efficiencies.
Safety: Loss of life and TRCFR(1)
Group TRCFR
Environmental incidents (levels 3 to 5)(2)
(1) Total Recordable Cases Frequency Rate.
(2) Environmental incidents are classified in terms of a 5-level severity rating. Incidents with medium, high
and major impacts, as defined by standard internal definitions, are reported as level 3-5 incidents.
7 63 2
7
111
1
2
1
2
1
2
3
2 2
1 5
1.29
1.08
0.80.93
0.72
0
0.2
0.4
0.6
0.8
1
1.2
1.4
0
5
10
15
20
2012 2013 2014 2015 2016
0
10
20
30
2012 2013 2014 2015 2016
OMI Exploration Coal South AfricaCoal Australia - Canada IOB KIONNP Copper De BeersPlatinum
L3: 30
L3: 6
L3: 14
L4: 1
L3: 21
L4: 1
L3: 3
YTD

8
IN DELIVERY MODE…KEY MILESTONES
GAHCHO KUÉ COMMISSIONING
• On time and on budget.
BARRO ALTO RAMP-UP COMPLETE
• Nameplate capacity achieved in Q3.
DELIVERY OF GROSVENOR
• Ahead of schedule and under budget.
MINAS-RIO RAMP-UP PLAN
• Step 2 Licence received.
• On track for 2016 production delivery.
• Unit costs – $25/t FOB.
SISHEN
• Restructuring complete.
• 21.4% awarded with “as expected” conditions.
Grosvenor decline
Gahcho Kué
9
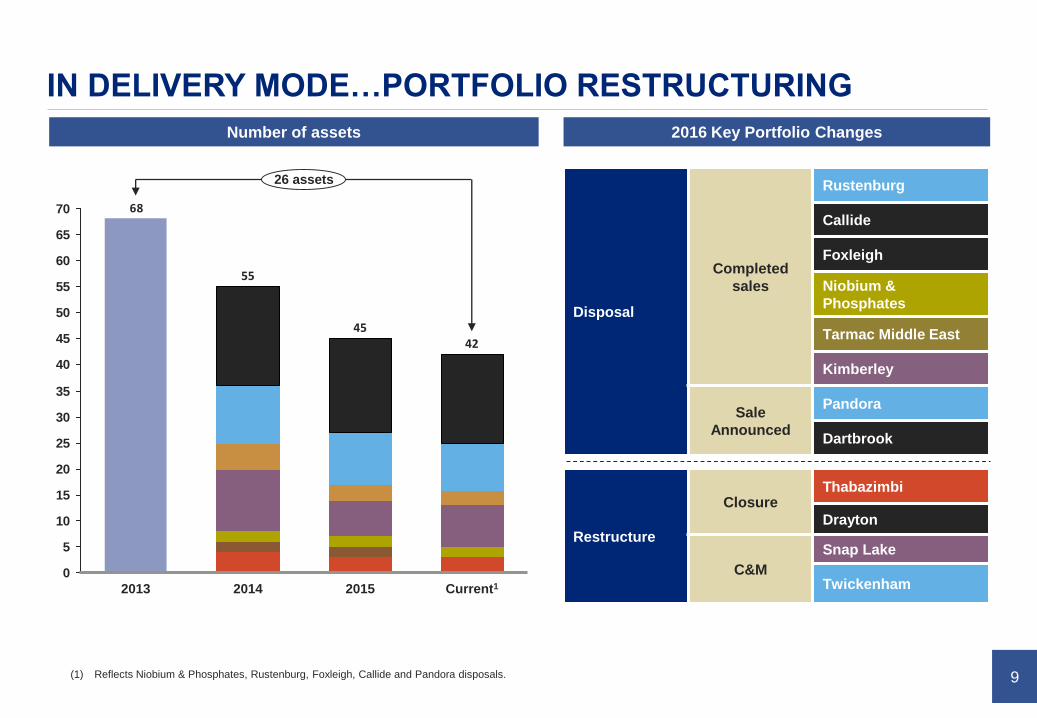
IN DELIVERY MODE…PORTFOLIO RESTRUCTURING
Number of assets
68
0
5
10
15
20
25
30
35
40
45
50
55
60
65
70
Current1
42
2015
45
55
2013
26 assets
2014
(1) Reflects Niobium & Phosphates, Rustenburg, Foxleigh, Callide and Pandora disposals.
Disposal
Completed
sales
Rustenburg
Callide
Foxleigh
Niobium &
Phosphates
Tarmac Middle East
Kimberley
Sale
Announced
Pandora
Dartbrook
2016 Key Portfolio Changes
Restructure
ClosureThabazimbi
Drayton
C&M
Snap Lake
Twickenham

10
IN DELIVERY MODE…ORGANISATION RESTRUCTURING
Employee and contractor numbers
13,000
11,50010,500
8,800
162,000
2016F
-41%
2014
128,000
2013
151,000
120,000
95,500
2016FH1 20162015
95,500
Coal
Copper
Platinum
Other
De Beers
Iron ore
Support Operations

11
IN DELIVERY MODE…THE IMPACT OF CHANGE

12
PORTFOLIO CHOICES DRIVEN BY ASSET POTENTIAL
De Beers
South
Africa
Mogalakwena
Amandelbult
• BRPM
• Mototolo
• Modikwa
Zimbabwe • Unki
Chile
Los Bronces
Collahuasi
Projects
• Quellaveco
• Sakatti
Botswana Jwaneng
Orapa
South Africa Venetia
• Voorspoed
Namibia• Debmarine
• Namdeb
Canada• Gahcho Kué
• Victor
Platinum Copper
Iron ore
and
manganese
• Kumba
• Minas-Rio
• Samancor
Coal• SA Thermal
• Australia Met
• Cerrejón
Nickel • Barro Alto
Bulks and Other Minerals
Managed for cash and
quality of returns.
Opportunistic investment to
enhance returns.
Disposed where value
accretive.
Our Focus – Leading Positions Quality Asset Holdings
Top priority is highest quality assets that will drive returns through the cycle.
Scalable assets that provide operational leverage and growth potential.
Global leadership positions and potential.
Geographic and commodity diversification maintained.
Portfolio streamlining allows rightsizing of overhead structures.

13
CAPITAL ALLOCATION
Cash flow from
operations
Balance sheet
flexibility
Critical sustaining
capex
Base dividend
Portfolio re-focus
Future growth options
• 2016 cost and volume savings of
$1.6bn targeted.
• Working capital improvement of
$0.5bn delivered in June.
• 2016 year end net debt <$10bn.
• 2016 year end net debt/EBITDA <2x.
• Investment grade rating targeted.
• Target to re-introduce dividend by
end 2017 (paid in H1 2018).
• Payout ratio to ensure
sustainability through the cycle.
• Total capex <$2.5bn in 2017.
• Sustainable total capex excluding
growth ~$2.5bn.
• Disposals must be for value.
• Discretionary capital focused on
Leading Positions (De Beers,
Platinum, Copper).
• Strict value criteria applied.
• Syndication considered on major
projects.
• No major project approval likely
before dividend reinstated.
“Disciplined capital planning to achieve our balance sheet objectives whilst
maximising the value of the business”

14
DELIVERING CHANGE TO UNLOCK OUR POTENTIAL
Key project delivery: Minas-Rio, Barro Alto, Gahcho Kué and Grosvenor.
Disposal programme continues to drive focus on highest priority assets.
Restructured with 41% fewer people and 26 fewer assets than 2013.
Repositioning Our
Portfolio
Driving
Operational
Improvement
Delivering Balance
Sheet Flexibility
Net debt below $10bn by year end.
Net debt to EBITDA less than 2x targeted in 2016.
Targeting investment grade rating and by end 2017 dividend re-introduction1.
Operating model roll out is driving operational improvements.
Unit costs down by 33% in CuEq terms since 2012.
Capex continues to reduce as major projects are delivered.
1
3
2
(1) Payable in H1 2018. Subject to commodity prices performance.

REDEFINING MINING
THROUGH OPERATING
BEST PRACTICE AND
INNOVATION

16
OPERATING MODEL – THE FOUNDATION
Doing the right work at the right time and in the right
way will deliver the required performance
Work that is planned, scheduled and properly
resourced ahead of execution will deliver consistently
and at lower cost
An engaged workforce will be the most productive
Three basic themes
1) Produce process stability
2) Reduce process variation
3) Provide clarity of purpose, conditions and roles
Operating Model is our operating and technical platform
3 essential components that are interlinked – initial focus on Work Management but key elements of Operational
Planning and Feedback now in place
Work Management ensures execution
Applying high capability technical expertise to better define the operating parameters and practices in the
business
Analysis and monitoring to measure and define the next level of improvements – resets the planning parameters
The theory behind the Operating Model

17
IMPLEMENTATION WELL UNDER WAY – MULTI-STAGE PROCESS
Iron ore
Platinum
De Beers
Copper
Work management continues with operational planning ramping up
Project
*WM = Work Management OP = Operational Planning

18
Shovels
(t/hr)
Trucks
(Ton-Km / hr)
1,427
11,887
1,672
12,192
2016 YTD
Shovel productivity
well above target
Truck productivity
above target
Loading cycle time
favourable to target
Loading
Cycle (min)4.6 3.6
Mining
Productivity2013
OPERATING MODEL – IMPACT SHOWING IN THE NUMBERS
Mining productivity benefits
already being realised through
the implementation process
Additional productivity benefits
expected after ramp-up and
stabilisation
Implementation provided stability in the process to
not only improve capability but also reduce the
variation
Results in increasing power capacity in the SAG mill
by 8-10%
Partial mitigation of the impacts of increasing
hardness of ore
Jwaneng - live in September 2016
Los Bronces – Confluencia SAG Power

19
Operating Model live in December 2015
To date it delivered:
• 26% increase in tonnage throughput from
2013
• 40koz increase in platinum produced from
2014 without an adverse effect on recovery
Avoided ~$200m in capital for De-Bottlenecking
project:
• Resets the parameters for any future
expansion
22.621.520.919.918.0
2014
+26%
Q2-Q3 2016Q1 201620152012
MOGALAKWENA NORTH CONCENTRATOR
Technical Expertise combined with the
Operating Model ImplementationTonnes Milled (daily average)
(Kt)

20
2/19/2016
UCL = 83.35
Mean = 70.36
LCL = 57.37
5 10 15 20 25 30 5 10 15 20 25 30 5 10 15 20 25 30 5 10 15 20 25 30 5 10 15 20 25 30 5 10 15 20 25 30 5 10 15
August September October November December January February
2015 2016
30
40
50
60
70
80
2/19/2016
UCL = 47.30
Mean = 38.80
LCL = 30.29
5 10 15 20 25 30 5 10 15 20 25 30 5 10 15 20 25 30 5 10 15 20 25 30 5 10 15 20 25 30 5 10 15 20 25 30 5 10 15
August September October November December January February
2015 2016
15
20
25
30
35
40
45
50
55
2/19/2016
UCL = 47.30
Mean = 38.80
LCL = 30.29
5 10 15 20 25 30 5 10 15 20 25 30 5 10 15 20 25 30 5 10 15 20 25 30 5 10 15 20 25 30 5 10 15 20 25 30 5 10 15
August September October November December January February
2015 2016
15
20
25
30
35
40
45
50
55
Ma
ss R
eco
ve
ry (
%)
February 2016January 2016December 2015November 2015
55
50
45
40
35
30
25
20
Mass Recovery (%)
Me
tallu
rgic
al R
eco
ve
ry (
%)
February 2016January 2016December 2015November 2015
90
80
70
60
50
40
Metallurgical Recovery (%)
2/19/2016
UCL = 83.35
Mean = 70.36
LCL = 57.37
5 10 15 20 25 30 5 10 15 20 25 30 5 10 15 20 25 30 5 10 15 20 25 30 5 10 15 20 25 30 5 10 15 20 25 30 5 10 15
August September October November December January February
2015 2016
30
40
50
60
70
80
Stability of processing plant and proper ore blending have led to recovery improvements
Defining the operating parameters, work management and monitoring have delivered the benefits
MINAS-RIO – BENEFITS OF STABILITY & ORE CONTROL
MEMORIA
Mass Recovery (%) Metallurgical Recovery (%)
Before
After
Before
After
Before
After
Before
After

Delivering our targets
FOCUS – CASH
GENERATION
Jwaneng mine

22
Processing “What good looks like”
Processing
stability
Adaptive processing to ensure
stability
Recovery
optimisation
Systems optimised to metallurgical
response
Asset Strategy “What good looks like”
Delivering
design OEE* Plant OEEs of 90-95%
Maintenance Active defect elimination process
Fuel efficiency Fuel consumption reduced by 3-7%
Geosciences “What good looks like”
Grade control
and
reconciliation
Fully-integrated grade control
system at all operations
End-value
estimation
approach
Recovered value rather than metal
content
Mining “What good looks like”
Drill & blast Mine-to-Plan compliance >90%
Load & haul Payloads consistently at 95-100%
of design
Fleet utilisation Shift changeover of <30mins
Fragmentation <2% of unloadable oversized
material
OPERATING PERFORMANCE
* OEE = Overall Equipment Efficiency = availability x utilisation x appropriate performance factor
In 2014 we highlighted “What good looks like”

23
Overview
Ore control determines ore destination (flotation,
leach, stockpile, waste)
Traditional grade control has been based on
copper grade only
Additional value now realised by taking into
account Molybdenum content, flotation and
leach recovery
Outcomes
The right minerals are sent to the right
processing destination
In 2015 an additional 25,000 tonnes of copper
added to leach
Estimated 2016/17 $20–60m in additional value
will be generated
No capex requirement
LOS BRONCES – END-VALUE ESTIMATION
Moving beyond ‘grade only’ to value based ore selection (VBOC)

24
COPPER IMPROVEMENT – RECOVERY OPTIMISATION
Over 40% improvement in molybdenum recovery
with a ‘back to good technical basics’ approach,
focussing on:
• Process Optimisation
• Process Efficiency
Molybdenum Recovery - Plant 2
49.844.143.0
35.5
+40%
Q4 2015-Q1 2016 Q2 2016Q1 2015 Q2 2015 -
Q3 2015
Recovery %

25
$700M increase in Discounted Cash Flow (+22%)
over 15 years
Phase 1 Project increased wall angles from 45 to
50 degrees
5 million tonnes less waste in 2017, and 15%
reduction over next 15 years
Waste to Ore stripping ratio reduced from 6.0 to 4.7
Allows pit designs for mine extensions and deeper
mining
PIT SLOPE OPTIMISATION – MOGALAKWENA MINE
50o wall
Slope design
45o wall
Slope design
Waste reduction
Additional ore

WHAT DOES THE
FUTURE LOOK LIKE
Redefining Mining
Polokwane smelter robotics

27
Gra
sp
Ch
alle
ng
es Use multiple
lenses
1. Sustainability
2. Processing
3. Mining
4. Energy
Ide
ate Internal
participation
External perspectives
Open & collaborative
Build Consortia
Co
nso
lida
te Valued defined
Internal customerfocused
Balance delivery over time
De
live
r Entrepreneurial
Operation focused
Learning plans
Minimum viable product
Rapid iterations
Stop or pivot
Cost effective
‘I can't understand why people are frightened of new ideas. I'm frightened of the old ones.'
John Cage
REDEFINING MINING INNOVATION – A FRESH APPROACH
Our opportunity is to aggressively move to leading edge performance with rapid adoption of
current / near technologies…
Consider entire
value chain
Open Forums Technology
Programmes
SmartPath

28
OUR OPEN FORUM – COLLABORATIVE IDEATION
Sustainability (Water)
Closed loop water system
Waterless Separation
Processing
Concentrating the mine
Modular Plant
Smart Intensifiers
System-Wide Enablers
Mining Mission Control: Big data, data science and machine learning
Mining
Alternate Transport
Modern Mine
Swarm Robotic Mining
~4500 ideas…
~50 themes
9 Programmes

29
STEP CHANGE IN CAPITAL EFFICIENCY - CONCENTRATE THE MINE
Objective and approach
Increase plant throughput by improved ore
fragmentation
Increase the effective head grade - early stage
waste rejection
Incorporate coarse particle recovery
Possible outcomes
Reduced cut-off grade
Reduced tailings waste generation
Reduced water usage and energy intensity
Increased productivity Concentrate the MineTM
Early stage waste
rejection
Coarse Particle
Recovery
Mine to Mill

30
Approach
Applying advanced blasting techniques
• High energy explosives (VOD ~6000 m/s)
• Short inter-hole delay timing to increase
explosive energy interaction
• Detailed timing sequence to encapsulate blast
volume and buffer vibration levels
• 25% improved energy distribution
Early Results
7% increase in throughput for hard ores
84% reduction in blast vibrations
38% reduction in fragmentation distribution
CONCENTRATE THE MINE – ADVANCED MINE TO MILL
Los Bronces
31
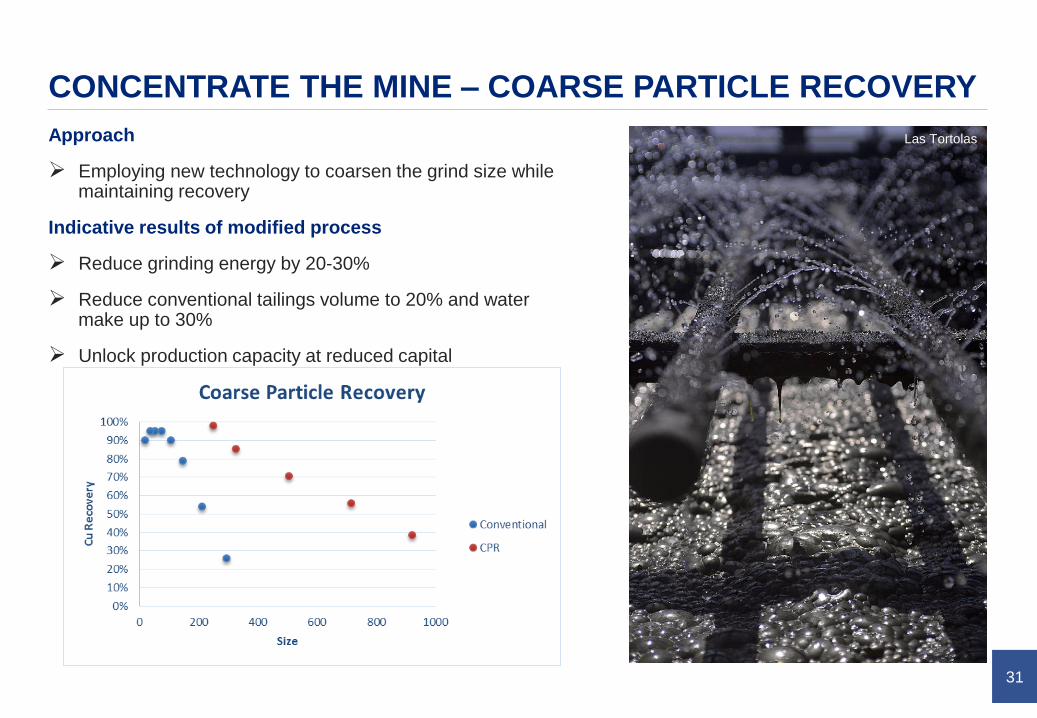
CONCENTRATE THE MINE – COARSE PARTICLE RECOVERY
Approach
Employing new technology to coarsen the grind size while maintaining recovery
Indicative results of modified process
Reduce grinding energy by 20-30%
Reduce conventional tailings volume to 20% and water make up to 30%
Unlock production capacity at reduced capital
Las Tortolas

32
OUR ASPIRATION – TOWARDS DRY TAILINGS
Water efficiency is a step-change opportunity
Efficiency enables increased throughput
Improves expansion opportunities to develop new mines in water-stressed areas
Reduces safety and environmental risks
Two approaches
1) Create less fines using coarse particle recovery
2) Remove interstitial water
Results
Increased water recycling
Ability to dry stack tailings (safer through stability)
Significant potential for smaller or no tailings dams
El Soldado tailings dam

QUESTIONS