SouthAfrica2006-ChallengesfortheFuture - Africa - Human …
22
South Africa 2006 – Challenges for the Future, page 1 Shared Interest 121 West 27 th Street, Suite 901, New York, NY 10001 (212) 337-8547 · [email protected] South Africa Delegation Briefing Paper November 2006 South Africa 2006: Challenges for the Future By Richard Knight South Africa is the most developed and modern country in Africa with extensive natural resources, a developed agricultural sector and significant manufacturing capacity. Gross Domestic Product (GDP) in 2005 was $214.7 billion – about 35% of total of Sub-Saharan Africa GDP. The ANC led government has achieved a significant turn around of the economy’s downward trajectory displayed in apartheid’s last years. Since 1995, real GDP annual growth has averaged 3.3%. Gross National Income (GNI) per capita is $3,630, more than 5 times the average for all of Sub-Saharan Africa. But averages can be deceptive and South Africa still has one of the largest domestic income disparities in the world. The country suffers from chronic unemployment and one the highest rates of HIV/AIDS in the world. Some 50% of South Africa’s people live in poverty; an estimated seven million people live in shacks, mostly in informal settlements. 1 Legacy of Apartheid In 1994 the newly elected democratic government, led by the African National Congress (ANC), inherited a country of gross racial inequities with structurally high unemployment. The apartheid system had been intentionally constructed to provide a steady stream of cheap black labor for all sectors of the white economy. Blacks were denied both political and economic rights: they were deprived of free occupation or ownership of their land, could not vote, were barred from moving about the country freely, and forced at all times to carry and produce on demand hated identity documents, known as passes. The job reservation system reserved skilled jobs for whites and the system of “Bantu Education” was purposely designed to direct Africans into unskilled jobs. Few blacks were in management positions. The apartheid economy was one of white wealth and black poverty, creating high structural unemployment for Africans. The Congress of South African Trade Unions (COSATU) noted in 1992: “While Africans make up 76% of the population, their share of income amounts to only 29% of the total. Whites, who make up less than 13% of the population, take away 58.5% of total income.” By the latter half of the 1980s several decades of growing white prosperity and economic expansion were slowed and then halted by the impact of the intensifying internal resistance to apartheid which was followed by mounting international pressures. Political Poverty in South Africa Race Classified As Poor Africans 61% Coloureds 38% Indians 5% Whites 1% Progress Report, Welfare, 1999 cited in National Report on Social Development 1995-2000
Transcript of SouthAfrica2006-ChallengesfortheFuture - Africa - Human …

South Africa 2006 – Challenges for the Future, page 1
Shared Interest 121 West 27
th Street, Suite 901, New York, NY 10001
(212) 337-8547 · [email protected]
South Africa Delegation Briefing Paper
November 2006
South Africa 2006: Challenges for the Future By Richard Knight
South Africa is the most developed and modern country in Africa with extensive natural resources, a developed agricultural sector and significant manufacturing capacity. Gross Domestic Product (GDP) in 2005 was $214.7 billion – about 35% of total of Sub-Saharan Africa GDP. The ANC led government has achieved a significant turn around of the economy’s downward trajectory displayed in apartheid’s last years. Since 1995, real GDP annual growth has averaged 3.3%. Gross National Income (GNI) per capita is $3,630, more than 5 times the average for all of Sub-Saharan Africa. But averages can be deceptive and South Africa still has one of the largest domestic income disparities in the world. The country suffers from chronic unemployment and one the highest rates of HIV/AIDS in the world. Some 50% of South Africa’s people live in poverty; an estimated seven million people live in shacks, mostly in informal settlements.1
Legacy of Apartheid In 1994 the newly elected democratic government, led by the African National Congress (ANC), inherited a country of gross racial inequities with structurally high unemployment. The apartheid system had been intentionally constructed to provide a steady stream of cheap black labor for all sectors of the white economy. Blacks were denied both political and economic rights: they were deprived of free occupation or ownership of their land, could not vote, were barred from moving about the country freely, and forced at all times to carry and produce on demand hated identity documents, known as passes. The job reservation system reserved skilled jobs for whites and the system of “Bantu Education” was purposely designed to direct Africans into unskilled jobs. Few blacks were in management positions. The apartheid economy was one of white wealth and black poverty, creating high structural unemployment for Africans. The Congress of South
African Trade Unions (COSATU) noted in 1992: “While Africans make up 76% of the population, their share of income amounts to only 29% of the total. Whites, who make up less than 13% of the population, take away 58.5% of total income.” By the latter half of the 1980s several decades of growing white prosperity and economic expansion were slowed and then halted by the impact of the intensifying internal
resistance to apartheid which was followed by mounting international pressures. Political
Poverty in South Africa
Race Classified
As Poor
Africans 61%
Coloureds 38%
Indians 5%
Whites 1% Progress Report, Welfare, 1999 cited in National Report on Social
Development 1995-2000

South Africa 2006 – Challenges for the Future, page 2
isolation, sanctions, and the cut off of international bank loans and disinvestment, including the outflow of foreign capital as companies withdrew, brought a political crisis and stagnant GDP growth with falling formal sector employment and a decline in total investment as a percent of GDP from nearly 26% in 1980 to about 15% in 1994, a rate that has remained fairly constant. Noting the challenges the Mandela government faced, South African government economist Alan Hirsch has observed: “The spectre of a shrinking economy imposed a terrifying parameter on the new government… the task of the new government was to bring the golden goose to health and simultaneously to meet the legitimate expectations of the newly enfranchised majority.”2
The Economy Today South Africa’s economy has seen positive economic growth every year since 1994. Real Gross Domestic Product (GDP) has averaged annual growth of over 3% since 1995. Because of its high Gross National Income (GNI) per capita, South Africa is classified by the World Bank as an upper middle income country. Real per capita growth has also been positive, meaning the average South African grew wealthier, although this benefit has not been evenly distributed. Significant progress has been made in education, health care, housing and providing basic services.
But as the government underscores in its review of the first post-apartheid decade, poverty continues to be widespread, unemployment remains high and many people lack necessities. The concentration of wealth is shown in the fact that in 1994 the top five banks represented 83.8% of the total assets of the banking sector, served only 20% of the population, most of whom were white.3 Income disparity remains - in 2000 the poorest 20% of households received 1.6% of total income, a smaller percentage than in 1995. Reviewing its successes and the challenges in Towards a Ten Year Review, the
“The spectre of a shrinking economy imposed a terrifying
parameter on the new government. ..... on average, South
Africans were 15% poorer in 1993 than in 1984, and the
recent years of the early 1990s showed the poorest
economic performance.
“Economic conservatives and representatives of business
frequently warned the ANC that it should not 'kill the
golden goose' in its efforts to rectify South Africa's
inequalities... But the golden goose was already rather
ill.... the task of the new government was to bring the
golden goose to health and simultaneously to meet the
legitimate expectations of the newly enfranchised
majority.” Season of Hope: Economic Reform Under Mandela
and Mbeki
by Alan Hirsch
GDP, 2004 ($ billions) $214.7
GNI per capita, 2004 $3,670
World Bank
Gross Domestic Product and Inflation
1999 2000 2001 2002 2003 2004 2005
GDP, current market
prices,
R millions
813,683 922,148 1,020,007 1,168,778 1,275,026 1,386,658 1,523,255
Real GDP
Growth
2.4% 4.2% 2.7% 3.7% 3.0% 4.5% 4.9%
GDP per capita, %
change
0.2% 2.1% 0.8% 1.9% 1.4% 3.0% 3.5%
Inflation 5.2% 5.4% 5.7% 9.2% 5.8% 1.4% 3.4% FY = Fiscal year. South African Reserve Bank, Statistic South Africa

South Africa 2006 – Challenges for the Future, page 3
government underscored a grim reality: “two economies” persist in the country. “The first is an advanced, sophisticated economy, based on skilled labour, which is becoming more globally competitive. The second is a mainly informal, marginalised, unskilled economy, populated by the unemployed and those unemployable in the formal sector.”4 The apartheid government had imposed inward-looking economic polices including protectionist policies aimed at limiting the impact of sanctions and promoting white business. When the democratic government came to power in 1994 it abandoned these policies. Tariffs were cut substantially and local businesses faced increasing exposure to foreign competition and the forces of globalization. The result was that local businesses either closed or had to modernize (improve business processes and introduce new technologies) and become more competitive – produce more goods with fewer workers. Employment
More than 1.1 million jobs have been created in the past five years, a 10% increase. In the formal sector, 960,000 more people were employed and in the informal sector 495,000 jobs were created.
Of those employed, 64.9% work in the formal sector (excluding agriculture). The formal sector includes all businesses that are registered. Some 20% of those employed work in the informal sector (excluding subsistence and small scale agriculture). The informal sector consists of those businesses that are unregistered. Most informal sector businesses are involved
with survivalist activities such as street sellers, are small with five or fewer employees, and are seldom run from business premises instead using homes, street pavements or other informal arrangements. There is considerable difference by race – virtually all whites work in the formal sector (including agriculture) compared to 60% of Africans. More then 25% of employed Africans work in the informal sector (excluding agriculture). About 7% of those employed work as domestics. Jobs are a major issue in South Africa. In its 2004 election manifesto the ANC promised by 2014 to reduce unemployment by half. Partly this will be achieved through an expanded public works program. The manifesto notes that the government can create some employment in the public service, public works programs and through
Key Labor Market Components & Unemployment
People – Thousand
Sept 01 Sept 02 Sept 03 Sept 04 Sept 05
Employed 11,181 11,296 11,424 11,643 12,301
Unemployed 4,655 4,936 4,434 4,135 4,487
Discouraged 2,994 3,194 3,773 3,948 3,312
NEA* 12,281 12,295 13,080 13,527 12,909 *NEA = Not Economically Active Statistic South Africa
Employment – September 2005 Thousand
Formal Sector (excluding agriculture) 7,987
Informal Sector (excluding agriculture) 2,462
Domestic workers 859
Agriculture 925
Unspecified 67
Total Employed 12,301 Statistics South Africa
Employment in the Formal and Informal Sector
Percentage
Sept 2001 Sept 2005
Formal Sector (excluding agriculture) 63.6% 64.9%
Informal Sector (excluding agriculture) 17.8% 20.0%
Domestic workers 8.0% 7.0%
Agriculture 10.7% 7.5%
Total 100.0% 100.0% Statistics South Africa
South Africa 2006 – Challenges for the Future, page 4
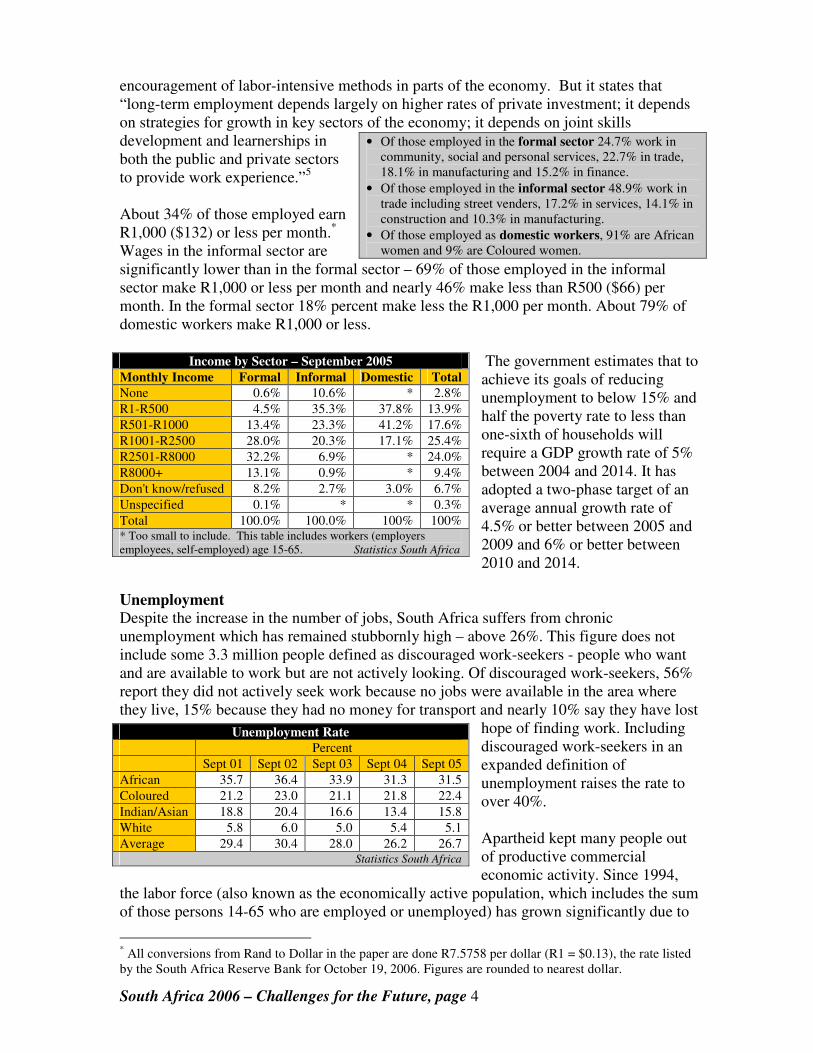
encouragement of labor-intensive methods in parts of the economy. But it states that “long-term employment depends largely on higher rates of private investment; it depends on strategies for growth in key sectors of the economy; it depends on joint skills development and learnerships in both the public and private sectors to provide work experience.”5 About 34% of those employed earn R1,000 ($132) or less per month.* Wages in the informal sector are significantly lower than in the formal sector – 69% of those employed in the informal sector make R1,000 or less per month and nearly 46% make less than R500 ($66) per month. In the formal sector 18% percent make less the R1,000 per month. About 79% of domestic workers make R1,000 or less.
The government estimates that to achieve its goals of reducing unemployment to below 15% and half the poverty rate to less than one-sixth of households will require a GDP growth rate of 5% between 2004 and 2014. It has adopted a two-phase target of an average annual growth rate of 4.5% or better between 2005 and 2009 and 6% or better between 2010 and 2014.
Unemployment
Despite the increase in the number of jobs, South Africa suffers from chronic unemployment which has remained stubbornly high – above 26%. This figure does not include some 3.3 million people defined as discouraged work-seekers - people who want and are available to work but are not actively looking. Of discouraged work-seekers, 56% report they did not actively seek work because no jobs were available in the area where they live, 15% because they had no money for transport and nearly 10% say they have lost
hope of finding work. Including discouraged work-seekers in an expanded definition of unemployment raises the rate to over 40%. Apartheid kept many people out of productive commercial economic activity. Since 1994,
the labor force (also known as the economically active population, which includes the sum of those persons 14-65 who are employed or unemployed) has grown significantly due to
* All conversions from Rand to Dollar in the paper are done R7.5758 per dollar (R1 = $0.13), the rate listed by the South Africa Reserve Bank for October 19, 2006. Figures are rounded to nearest dollar.
• Of those employed in the formal sector 24.7% work in community, social and personal services, 22.7% in trade, 18.1% in manufacturing and 15.2% in finance.
• Of those employed in the informal sector 48.9% work in trade including street venders, 17.2% in services, 14.1% in construction and 10.3% in manufacturing.
• Of those employed as domestic workers, 91% are African women and 9% are Coloured women.
Income by Sector – September 2005
Monthly Income Formal Informal Domestic Total
None 0.6% 10.6% * 2.8%
R1-R500 4.5% 35.3% 37.8% 13.9%
R501-R1000 13.4% 23.3% 41.2% 17.6%
R1001-R2500 28.0% 20.3% 17.1% 25.4%
R2501-R8000 32.2% 6.9% * 24.0%
R8000+ 13.1% 0.9% * 9.4%
Don't know/refused 8.2% 2.7% 3.0% 6.7%
Unspecified 0.1% * * 0.3%
Total 100.0% 100.0% 100% 100% * Too small to include. This table includes workers (employers employees, self-employed) age 15-65. Statistics South Africa
Unemployment Rate
Percent
Sept 01 Sept 02 Sept 03 Sept 04 Sept 05
African 35.7 36.4 33.9 31.3 31.5
Coloured 21.2 23.0 21.1 21.8 22.4
Indian/Asian 18.8 20.4 16.6 13.4 15.8
White 5.8 6.0 5.0 5.4 5.1
Average 29.4 30.4 28.0 26.2 26.7 Statistics South Africa
South Africa 2006 – Challenges for the Future, page 5
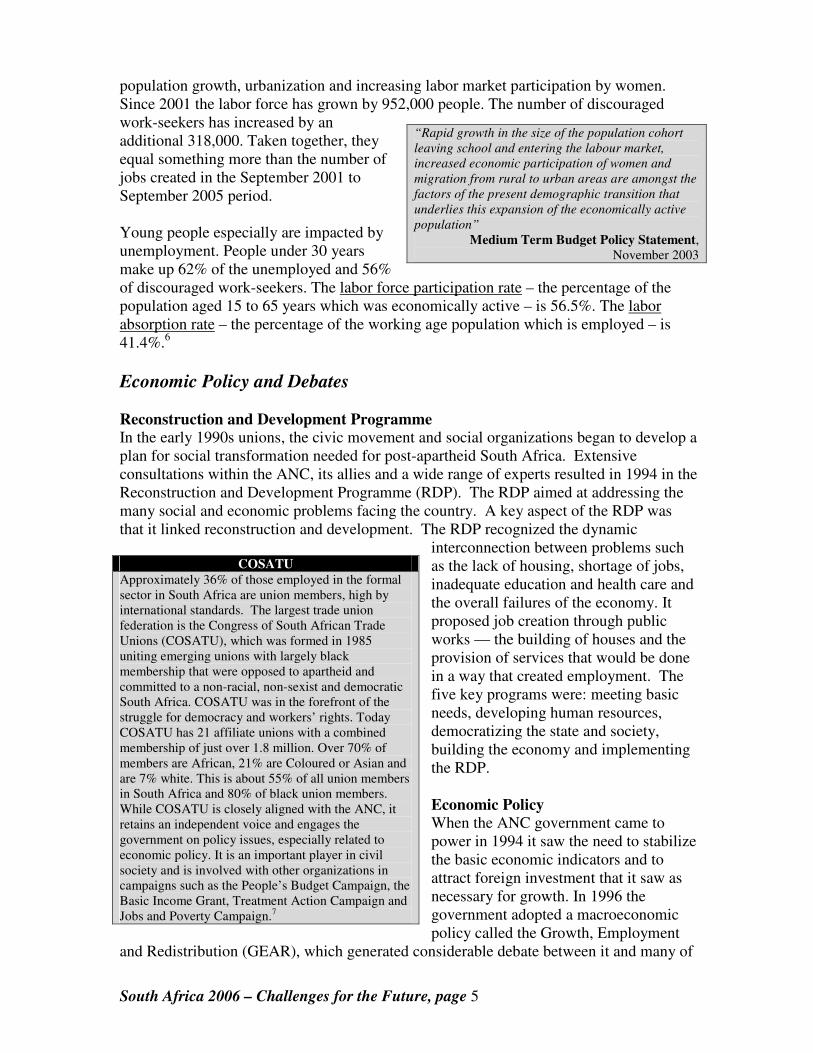
population growth, urbanization and increasing labor market participation by women. Since 2001 the labor force has grown by 952,000 people. The number of discouraged work-seekers has increased by an additional 318,000. Taken together, they equal something more than the number of jobs created in the September 2001 to September 2005 period. Young people especially are impacted by unemployment. People under 30 years make up 62% of the unemployed and 56% of discouraged work-seekers. The labor force participation rate – the percentage of the population aged 15 to 65 years which was economically active – is 56.5%. The labor absorption rate – the percentage of the working age population which is employed – is 41.4%.6
Economic Policy and Debates Reconstruction and Development Programme
In the early 1990s unions, the civic movement and social organizations began to develop a plan for social transformation needed for post-apartheid South Africa. Extensive consultations within the ANC, its allies and a wide range of experts resulted in 1994 in the Reconstruction and Development Programme (RDP). The RDP aimed at addressing the many social and economic problems facing the country. A key aspect of the RDP was that it linked reconstruction and development. The RDP recognized the dynamic
interconnection between problems such as the lack of housing, shortage of jobs, inadequate education and health care and the overall failures of the economy. It proposed job creation through public works — the building of houses and the provision of services that would be done in a way that created employment. The five key programs were: meeting basic needs, developing human resources, democratizing the state and society, building the economy and implementing the RDP. Economic Policy
When the ANC government came to power in 1994 it saw the need to stabilize the basic economic indicators and to attract foreign investment that it saw as necessary for growth. In 1996 the government adopted a macroeconomic policy called the Growth, Employment
and Redistribution (GEAR), which generated considerable debate between it and many of
“Rapid growth in the size of the population cohort
leaving school and entering the labour market,
increased economic participation of women and
migration from rural to urban areas are amongst the
factors of the present demographic transition that
underlies this expansion of the economically active
population”
Medium Term Budget Policy Statement, November 2003
COSATU
Approximately 36% of those employed in the formal sector in South Africa are union members, high by international standards. The largest trade union federation is the Congress of South African Trade Unions (COSATU), which was formed in 1985 uniting emerging unions with largely black membership that were opposed to apartheid and committed to a non-racial, non-sexist and democratic South Africa. COSATU was in the forefront of the struggle for democracy and workers’ rights. Today COSATU has 21 affiliate unions with a combined membership of just over 1.8 million. Over 70% of members are African, 21% are Coloured or Asian and are 7% white. This is about 55% of all union members in South Africa and 80% of black union members. While COSATU is closely aligned with the ANC, it retains an independent voice and engages the government on policy issues, especially related to economic policy. It is an important player in civil society and is involved with other organizations in campaigns such as the People’s Budget Campaign, the Basic Income Grant, Treatment Action Campaign and Jobs and Poverty Campaign.7
South Africa 2006 – Challenges for the Future, page 6
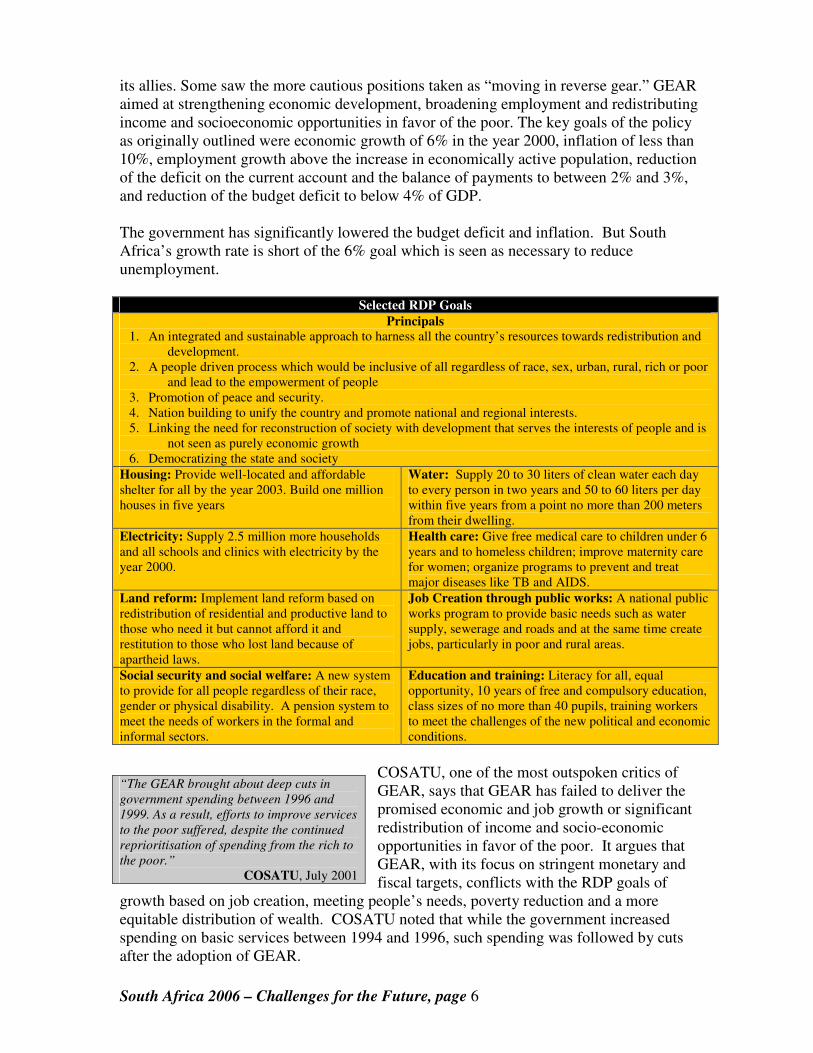
its allies. Some saw the more cautious positions taken as “moving in reverse gear.” GEAR aimed at strengthening economic development, broadening employment and redistributing income and socioeconomic opportunities in favor of the poor. The key goals of the policy as originally outlined were economic growth of 6% in the year 2000, inflation of less than 10%, employment growth above the increase in economically active population, reduction of the deficit on the current account and the balance of payments to between 2% and 3%, and reduction of the budget deficit to below 4% of GDP. The government has significantly lowered the budget deficit and inflation. But South Africa’s growth rate is short of the 6% goal which is seen as necessary to reduce unemployment.
Selected RDP Goals
Principals
1. An integrated and sustainable approach to harness all the country’s resources towards redistribution and development.
2. A people driven process which would be inclusive of all regardless of race, sex, urban, rural, rich or poor and lead to the empowerment of people
3. Promotion of peace and security. 4. Nation building to unify the country and promote national and regional interests. 5. Linking the need for reconstruction of society with development that serves the interests of people and is
not seen as purely economic growth 6. Democratizing the state and society
Housing: Provide well-located and affordable shelter for all by the year 2003. Build one million houses in five years
Water: Supply 20 to 30 liters of clean water each day to every person in two years and 50 to 60 liters per day within five years from a point no more than 200 meters from their dwelling.
Electricity: Supply 2.5 million more households and all schools and clinics with electricity by the year 2000.
Health care: Give free medical care to children under 6 years and to homeless children; improve maternity care for women; organize programs to prevent and treat major diseases like TB and AIDS.
Land reform: Implement land reform based on redistribution of residential and productive land to those who need it but cannot afford it and restitution to those who lost land because of apartheid laws.
Job Creation through public works: A national public works program to provide basic needs such as water supply, sewerage and roads and at the same time create jobs, particularly in poor and rural areas.
Social security and social welfare: A new system to provide for all people regardless of their race, gender or physical disability. A pension system to meet the needs of workers in the formal and informal sectors.
Education and training: Literacy for all, equal opportunity, 10 years of free and compulsory education, class sizes of no more than 40 pupils, training workers to meet the challenges of the new political and economic conditions.
COSATU, one of the most outspoken critics of GEAR, says that GEAR has failed to deliver the promised economic and job growth or significant redistribution of income and socio-economic opportunities in favor of the poor. It argues that GEAR, with its focus on stringent monetary and fiscal targets, conflicts with the RDP goals of
growth based on job creation, meeting people’s needs, poverty reduction and a more equitable distribution of wealth. COSATU noted that while the government increased spending on basic services between 1994 and 1996, such spending was followed by cuts after the adoption of GEAR.
“The GEAR brought about deep cuts in
government spending between 1996 and
1999. As a result, efforts to improve services
to the poor suffered, despite the continued
reprioritisation of spending from the rich to
the poor.”
COSATU, July 2001
South Africa 2006 – Challenges for the Future, page 7
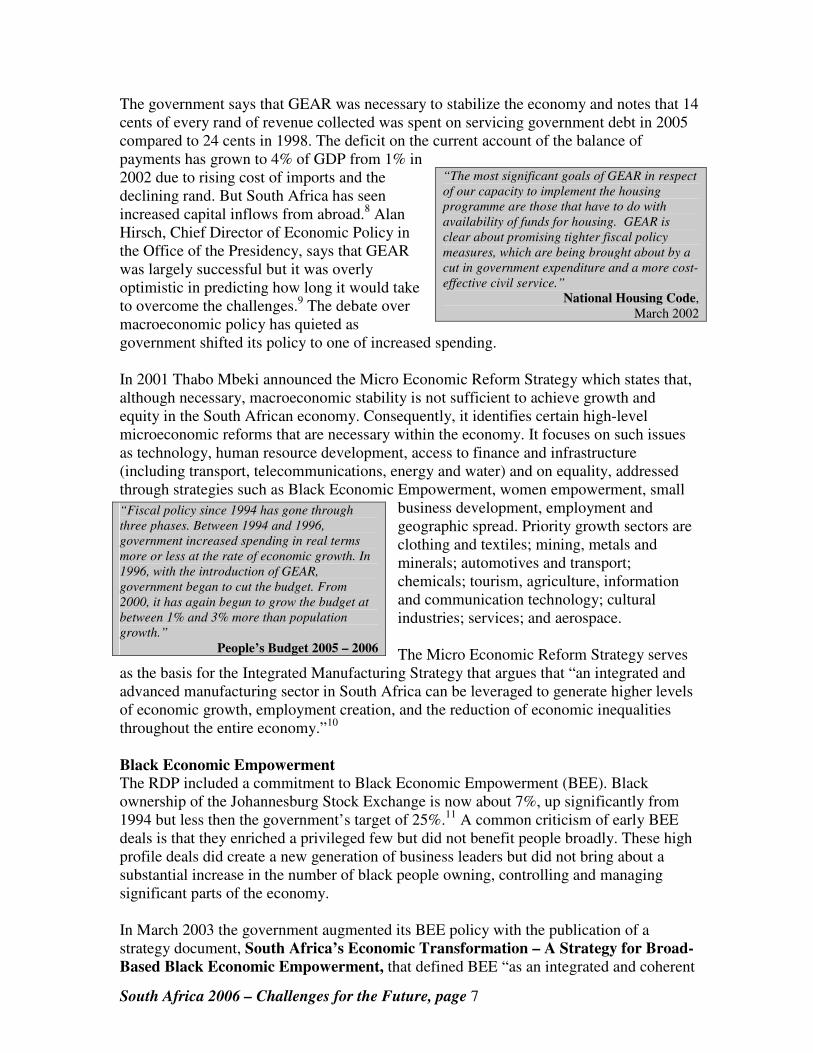
The government says that GEAR was necessary to stabilize the economy and notes that 14 cents of every rand of revenue collected was spent on servicing government debt in 2005 compared to 24 cents in 1998. The deficit on the current account of the balance of payments has grown to 4% of GDP from 1% in 2002 due to rising cost of imports and the declining rand. But South Africa has seen increased capital inflows from abroad.8 Alan Hirsch, Chief Director of Economic Policy in the Office of the Presidency, says that GEAR was largely successful but it was overly optimistic in predicting how long it would take to overcome the challenges.9 The debate over macroeconomic policy has quieted as government shifted its policy to one of increased spending. In 2001 Thabo Mbeki announced the Micro Economic Reform Strategy which states that, although necessary, macroeconomic stability is not sufficient to achieve growth and equity in the South African economy. Consequently, it identifies certain high-level microeconomic reforms that are necessary within the economy. It focuses on such issues as technology, human resource development, access to finance and infrastructure (including transport, telecommunications, energy and water) and on equality, addressed through strategies such as Black Economic Empowerment, women empowerment, small
business development, employment and geographic spread. Priority growth sectors are clothing and textiles; mining, metals and minerals; automotives and transport; chemicals; tourism, agriculture, information and communication technology; cultural industries; services; and aerospace. The Micro Economic Reform Strategy serves
as the basis for the Integrated Manufacturing Strategy that argues that “an integrated and advanced manufacturing sector in South Africa can be leveraged to generate higher levels of economic growth, employment creation, and the reduction of economic inequalities throughout the entire economy.”10 Black Economic Empowerment
The RDP included a commitment to Black Economic Empowerment (BEE). Black ownership of the Johannesburg Stock Exchange is now about 7%, up significantly from 1994 but less then the government’s target of 25%.11 A common criticism of early BEE deals is that they enriched a privileged few but did not benefit people broadly. These high profile deals did create a new generation of business leaders but did not bring about a substantial increase in the number of black people owning, controlling and managing significant parts of the economy. In March 2003 the government augmented its BEE policy with the publication of a strategy document, South Africa’s Economic Transformation – A Strategy for Broad-
Based Black Economic Empowerment, that defined BEE “as an integrated and coherent
“The most significant goals of GEAR in respect
of our capacity to implement the housing
programme are those that have to do with
availability of funds for housing. GEAR is
clear about promising tighter fiscal policy
measures, which are being brought about by a
cut in government expenditure and a more cost-
effective civil service.”
National Housing Code, March 2002
“Fiscal policy since 1994 has gone through
three phases. Between 1994 and 1996,
government increased spending in real terms
more or less at the rate of economic growth. In
1996, with the introduction of GEAR,
government began to cut the budget. From
2000, it has again begun to grow the budget at
between 1% and 3% more than population
growth.”
People’s Budget 2005 – 2006

South Africa 2006 – Challenges for the Future, page 8
socio-economic process that directly contributes to the economic transformation of South Africa and brings about significant increases in the numbers of black people that manage, own and control the country’s economy, as well as significant decreases in income inequalities.”12 The Broad-Based Black Economic Empowerment Act of 2003, signed into law in 2004, creates an enabling framework for the promotion of BEE. The Act formalizes broad-based BEE across industry sectors, including through empowerment charters in mining, energy and financial services. The Act establishes a legislative framework for the promotion of BEE; empowers the government to issue codes of good practices and to publish transformation charters; and establishes the Black Economic Empowerment Council.13 A scorecard measures the central elements of BEE: direct empowerment through ownership and control of enterprises and assets; human resource development and employment equity; indirect empowerment through preferential procurement and enterprise development.14
The government uses various tools to promote BEE, such as procurement, regulation, financing and institutional support. The Department of Trade and Industry provides a range of grants and incentives to enterprises. It also promotes supplier development, micro-enterprise development, support for skills development, and the acquisition and development of new technology.
Development Finance Institutions
South Africa currently has 13 government-owned development finance institutions (DFIs). The institutions include the Development Bank of Southern Africa, the Land Bank, the National Empowerment Fund, the South African Micro-finance Apex Fund and Khula Enterprise Finance Limited. Some of these existed in the apartheid era, others were established post-apartheid. There has been some criticism that these entities overlap and are poorly coordinated. Another criticism is that tend not to serve micro enterprises, including those in the informal sector, with micro-loans of R10,000 ($1,320) or less. The government has recently initiated a review to ensure the mandates and operations of the
“The Broad-Black Economic Empowerment strategy
is a necessary government intervention to address
the systematic exclusion of the majority of South
Africans from full participation in the economy. The
defining feature of Apartheid was the use of race to
restrict and severely control access to the economy
by black persons. The accumulation process was one
of restricted wealth creation and imposed
underdevelopment on black communities to ensure
that they were, in the main, suppliers of cheap
labour…
“Government’s strategy for broad-based black
economic empowerment looks beyond the redress of
past imbalances to situating BEE as a powerful tool
to broaden the country’s economic base and
accelerate growth, job creation and poverty
eradication.”
South Africa’s Economic Transformation – A
Strategy for Broad-Based Black Economic
Empowerment
Black Directors of Companies Listed on the
Johannesburg Stock Exchange
• 64% of companies listed on the Johannesburg Stock Exchange (JSE) have at least one black director, 36% do not.
• Currently 405 blacks hold 558 (18%) of the 3,125 directorship seats of JSE-listed companies. However, about 83% of these are non-executive positions. In 1980 there were no black directors on the boards of JSE-listed companies, increasing to 15 in 1993, to 98 in 1997 and 207 in 2003.
• A survey in 2005 by Empowerdex revealed only 15 JSE-listed companies had boards that were predominately black.15

South Africa 2006 – Challenges for the Future, page 9
DFIs are coordinated and that they utilize economic resources more effectively and with greater efficiency in support of the government’s policy objectives.16 South African Micro-finance Apex Fund (SAMAF): The recently established South African Micro-finance Apex Fund is specifically designed to address poverty alleviation and to provide sustained affordable access to financial services for the poor. A Micro-Credit Loan Fund will provide loans of up to R10,000 ($1,320) to households and micro entrepreneurs who depend on their micro enterprises for their livelihoods, providing micro-credit for micro-enterprise development and poverty alleviation funds for clients whose household incomes are less than R1,500 ($198) per month. The SAMAF is designed to address poverty and unemployment through access to affordable financial services, institutional and client capacity building, and savings mobilization through co-operatives and other formations such as burial societies and stokvels (informal group saving schemes). Launched in the provinces in 2005 and 2006, SAMAF works through partner organizations to carry out its mandate to reach the target at as close a local level as possible for impact and outreach. SAMAF will also work to build institutional capacity of partner organizations and their clients. It will support savings mobilization by promoting and encouraging the creation of financial co-operatives and other savings establishments such as stokvels and burial societies for the accumulation of locally owned and invested wealth. By September 2006 a commitment to 18 partner institutions in eight provinces equaled R23 million.17 Khula Enterprise Finance Ltd: Khula, an agency of the Department of Trade and Industry, was established in 1996 to facilitate access to credit by small, medium and micro enterprises (SMMEs). Khula is a wholesale operator established to make loans or to provide loan guarantees through intermediaries such as commercial banks, retail financial intermediaries and micro credit outlets that provide loans to SMMEs. Khula is expanding its disbursement of funds to R500 million a year, up from R280 million in 2003/04.18 The minimum investment by Khula is R10,000 ($1,320). In February 2006 Khula and the investment company Business Partners launched a R150 million start-up fund aimed at black-owned and managed SMEs, shifting their focus away from micro finance.19 Khula’s Thuso Mentorship Program provides skills transfer; before a loan is made it helps entrepreneurs develop a business plan and after a loan has been made helps in various aspects of management. However, Khula is confronting major cost recovery and delivery issues and is being redesigned. Khula is now preparing a business plan to transform itself into a direct retail lender, although it will still be capitalized by the government. “Working as a wholesaler through intermediaries is not enough. We cannot achieve our ambitious targets if we cannot go directly as an institution to the entrepreneur and if we have the size balance sheet we have,” said Khula managing director Xola Sithole. The R1.1 billion in assets of Khula was insufficient for retail finance and would have to be increased, said Sithole.20 National Endowment Fund (NEF): NEF, which falls under the Department of Trade and Industry, was established in 1998 to promote economic equality and transformation. The NEF assists with the financing of BEE transactions. It offers financing to historically
• Small and Medium Enterprises (SMEs) are generally defined as those with an annual turnover of R500,000 to R20 million ($66,000 to $2.7 million), have less than 200 employees per annum and operate in the formal sector.
• Micro enterprises are generally survivalist operations in the informal sector (companies are not registered) with five or fewer employees.
South Africa 2006 – Challenges for the Future, page 10
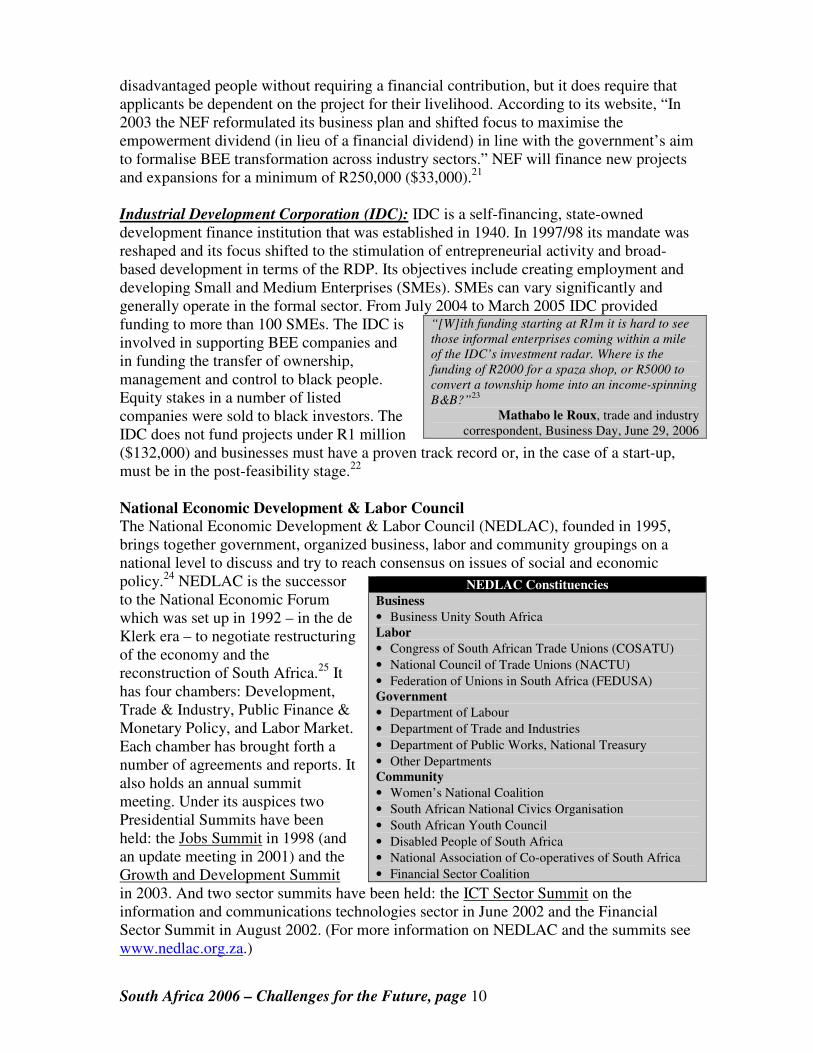
disadvantaged people without requiring a financial contribution, but it does require that applicants be dependent on the project for their livelihood. According to its website, “In 2003 the NEF reformulated its business plan and shifted focus to maximise the empowerment dividend (in lieu of a financial dividend) in line with the government’s aim to formalise BEE transformation across industry sectors.” NEF will finance new projects and expansions for a minimum of R250,000 ($33,000).21 Industrial Development Corporation (IDC): IDC is a self-financing, state-owned development finance institution that was established in 1940. In 1997/98 its mandate was reshaped and its focus shifted to the stimulation of entrepreneurial activity and broad-based development in terms of the RDP. Its objectives include creating employment and developing Small and Medium Enterprises (SMEs). SMEs can vary significantly and generally operate in the formal sector. From July 2004 to March 2005 IDC provided funding to more than 100 SMEs. The IDC is involved in supporting BEE companies and in funding the transfer of ownership, management and control to black people. Equity stakes in a number of listed companies were sold to black investors. The IDC does not fund projects under R1 million ($132,000) and businesses must have a proven track record or, in the case of a start-up, must be in the post-feasibility stage.22 National Economic Development & Labor Council
The National Economic Development & Labor Council (NEDLAC), founded in 1995, brings together government, organized business, labor and community groupings on a national level to discuss and try to reach consensus on issues of social and economic policy.24 NEDLAC is the successor to the National Economic Forum which was set up in 1992 – in the de Klerk era – to negotiate restructuring of the economy and the reconstruction of South Africa.25 It has four chambers: Development, Trade & Industry, Public Finance & Monetary Policy, and Labor Market. Each chamber has brought forth a number of agreements and reports. It also holds an annual summit meeting. Under its auspices two Presidential Summits have been held: the Jobs Summit in 1998 (and an update meeting in 2001) and the Growth and Development Summit in 2003. And two sector summits have been held: the ICT Sector Summit on the information and communications technologies sector in June 2002 and the Financial Sector Summit in August 2002. (For more information on NEDLAC and the summits see www.nedlac.org.za.)
“[W]ith funding starting at R1m it is hard to see
those informal enterprises coming within a mile
of the IDC’s investment radar. Where is the
funding of R2000 for a spaza shop, or R5000 to
convert a township home into an income-spinning
B&B?”23
Mathabo le Roux, trade and industry correspondent, Business Day, June 29, 2006
NEDLAC Constituencies
Business
• Business Unity South Africa Labor
• Congress of South African Trade Unions (COSATU)
• National Council of Trade Unions (NACTU)
• Federation of Unions in South Africa (FEDUSA) Government
• Department of Labour
• Department of Trade and Industries
• Department of Public Works, National Treasury
• Other Departments Community
• Women’s National Coalition
• South African National Civics Organisation
• South African Youth Council
• Disabled People of South Africa
• National Association of Co-operatives of South Africa
• Financial Sector Coalition
South Africa 2006 – Challenges for the Future, page 11
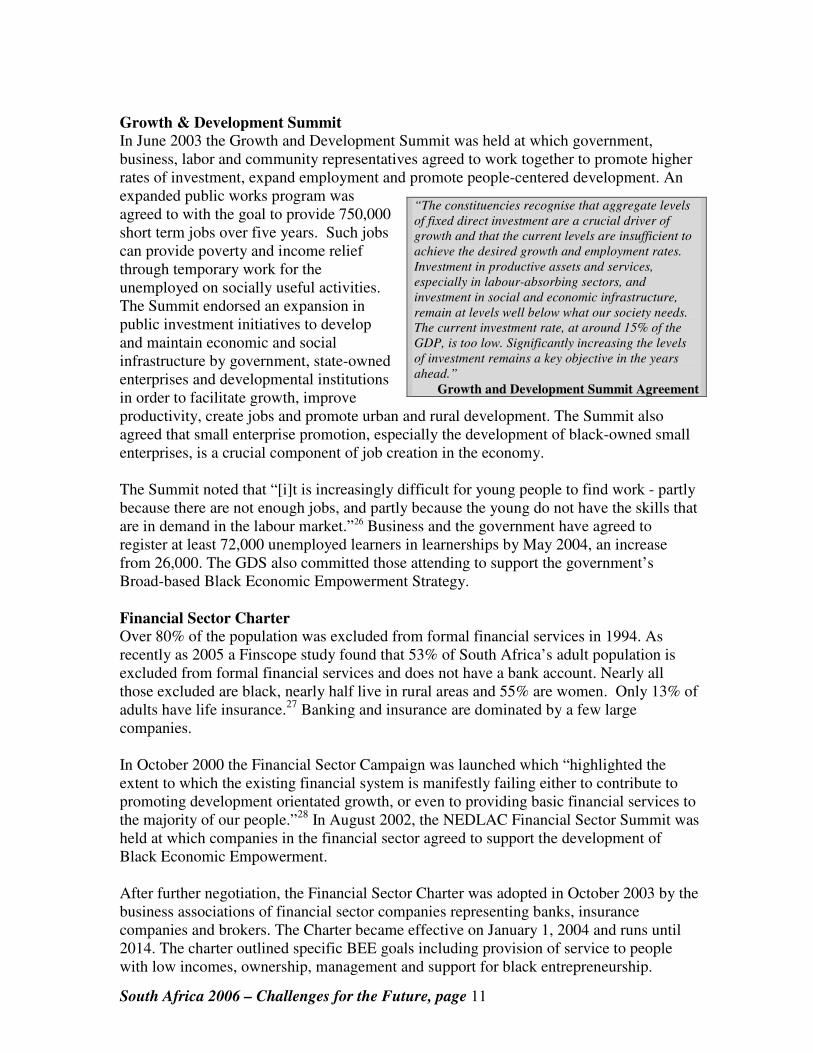
Growth & Development Summit
In June 2003 the Growth and Development Summit was held at which government, business, labor and community representatives agreed to work together to promote higher rates of investment, expand employment and promote people-centered development. An expanded public works program was agreed to with the goal to provide 750,000 short term jobs over five years. Such jobs can provide poverty and income relief through temporary work for the unemployed on socially useful activities. The Summit endorsed an expansion in public investment initiatives to develop and maintain economic and social infrastructure by government, state-owned enterprises and developmental institutions in order to facilitate growth, improve productivity, create jobs and promote urban and rural development. The Summit also agreed that small enterprise promotion, especially the development of black-owned small enterprises, is a crucial component of job creation in the economy.
The Summit noted that “[i]t is increasingly difficult for young people to find work - partly because there are not enough jobs, and partly because the young do not have the skills that are in demand in the labour market.”26 Business and the government have agreed to register at least 72,000 unemployed learners in learnerships by May 2004, an increase from 26,000. The GDS also committed those attending to support the government’s Broad-based Black Economic Empowerment Strategy.
Financial Sector Charter
Over 80% of the population was excluded from formal financial services in 1994. As recently as 2005 a Finscope study found that 53% of South Africa’s adult population is excluded from formal financial services and does not have a bank account. Nearly all those excluded are black, nearly half live in rural areas and 55% are women. Only 13% of adults have life insurance.27 Banking and insurance are dominated by a few large companies. In October 2000 the Financial Sector Campaign was launched which “highlighted the extent to which the existing financial system is manifestly failing either to contribute to promoting development orientated growth, or even to providing basic financial services to the majority of our people.”28 In August 2002, the NEDLAC Financial Sector Summit was held at which companies in the financial sector agreed to support the development of Black Economic Empowerment. After further negotiation, the Financial Sector Charter was adopted in October 2003 by the business associations of financial sector companies representing banks, insurance companies and brokers. The Charter became effective on January 1, 2004 and runs until 2014. The charter outlined specific BEE goals including provision of service to people with low incomes, ownership, management and support for black entrepreneurship.
“The constituencies recognise that aggregate levels
of fixed direct investment are a crucial driver of
growth and that the current levels are insufficient to
achieve the desired growth and employment rates.
Investment in productive assets and services,
especially in labour-absorbing sectors, and
investment in social and economic infrastructure,
remain at levels well below what our society needs.
The current investment rate, at around 15% of the
GDP, is too low. Significantly increasing the levels
of investment remains a key objective in the years
ahead.”
Growth and Development Summit Agreement
South Africa 2006 – Challenges for the Future, page 12
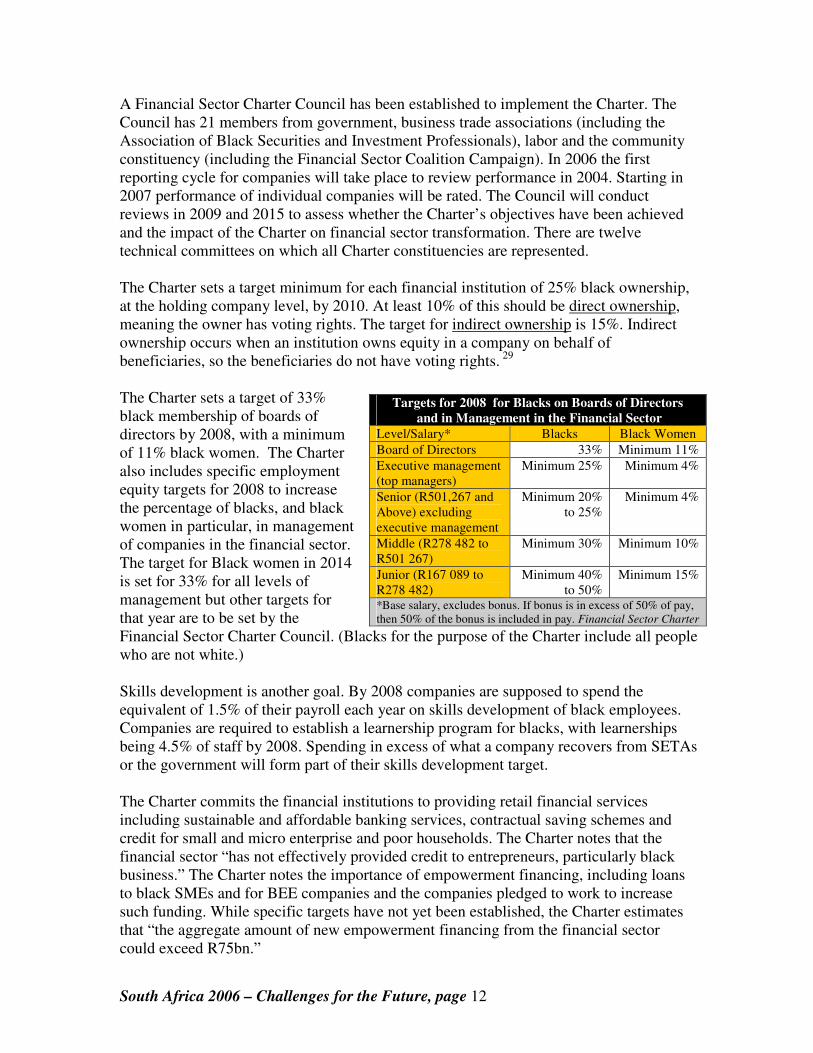
A Financial Sector Charter Council has been established to implement the Charter. The Council has 21 members from government, business trade associations (including the Association of Black Securities and Investment Professionals), labor and the community constituency (including the Financial Sector Coalition Campaign). In 2006 the first reporting cycle for companies will take place to review performance in 2004. Starting in 2007 performance of individual companies will be rated. The Council will conduct reviews in 2009 and 2015 to assess whether the Charter’s objectives have been achieved and the impact of the Charter on financial sector transformation. There are twelve technical committees on which all Charter constituencies are represented. The Charter sets a target minimum for each financial institution of 25% black ownership, at the holding company level, by 2010. At least 10% of this should be direct ownership, meaning the owner has voting rights. The target for indirect ownership is 15%. Indirect ownership occurs when an institution owns equity in a company on behalf of beneficiaries, so the beneficiaries do not have voting rights. 29 The Charter sets a target of 33% black membership of boards of directors by 2008, with a minimum of 11% black women. The Charter also includes specific employment equity targets for 2008 to increase the percentage of blacks, and black women in particular, in management of companies in the financial sector. The target for Black women in 2014 is set for 33% for all levels of management but other targets for that year are to be set by the Financial Sector Charter Council. (Blacks for the purpose of the Charter include all people who are not white.) Skills development is another goal. By 2008 companies are supposed to spend the equivalent of 1.5% of their payroll each year on skills development of black employees. Companies are required to establish a learnership program for blacks, with learnerships being 4.5% of staff by 2008. Spending in excess of what a company recovers from SETAs or the government will form part of their skills development target. The Charter commits the financial institutions to providing retail financial services including sustainable and affordable banking services, contractual saving schemes and credit for small and micro enterprise and poor households. The Charter notes that the financial sector “has not effectively provided credit to entrepreneurs, particularly black business.” The Charter notes the importance of empowerment financing, including loans to black SMEs and for BEE companies and the companies pledged to work to increase such funding. While specific targets have not yet been established, the Charter estimates that “the aggregate amount of new empowerment financing from the financial sector could exceed R75bn.”
Targets for 2008 for Blacks on Boards of Directors
and in Management in the Financial Sector Level/Salary* Blacks Black Women
Board of Directors 33% Minimum 11%
Executive management (top managers)
Minimum 25% Minimum 4%
Senior (R501,267 and Above) excluding executive management
Minimum 20% to 25%
Minimum 4%
Middle (R278 482 to R501 267)
Minimum 30% Minimum 10%
Junior (R167 089 to R278 482)
Minimum 40% to 50%
Minimum 15%
*Base salary, excludes bonus. If bonus is in excess of 50% of pay, then 50% of the bonus is included in pay. Financial Sector Charter
South Africa 2006 – Challenges for the Future, page 13
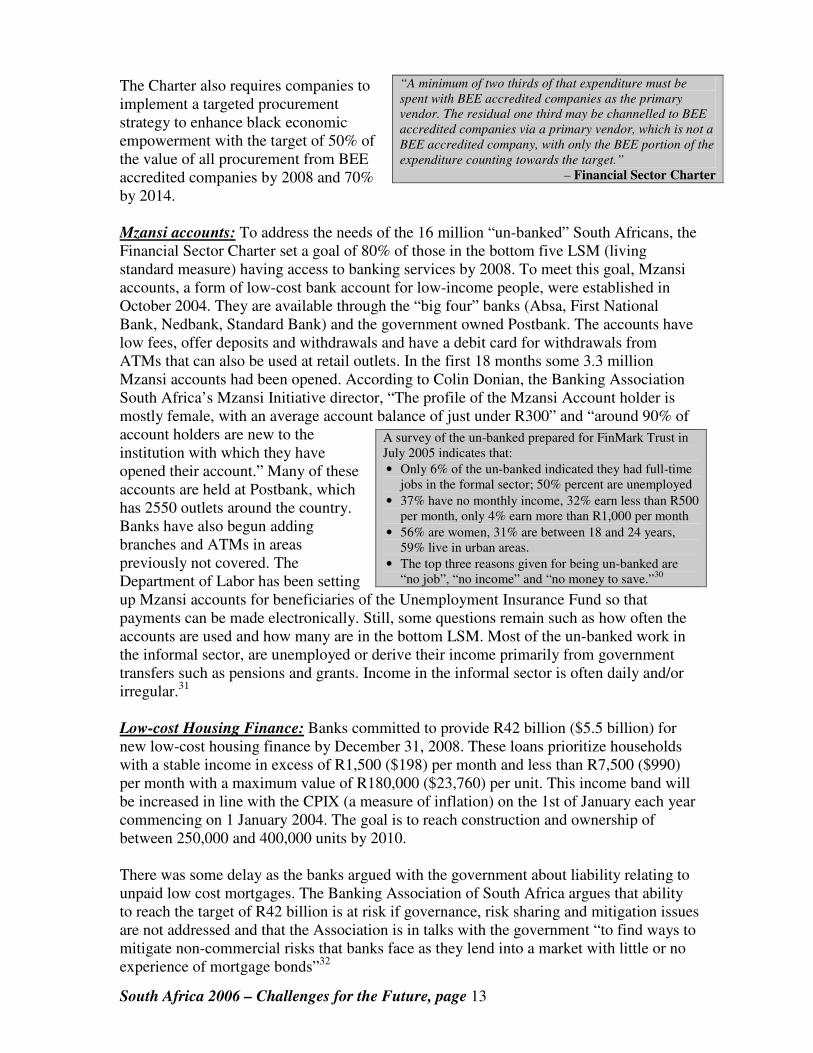
The Charter also requires companies to implement a targeted procurement strategy to enhance black economic empowerment with the target of 50% of the value of all procurement from BEE accredited companies by 2008 and 70% by 2014. Mzansi accounts: To address the needs of the 16 million “un-banked” South Africans, the Financial Sector Charter set a goal of 80% of those in the bottom five LSM (living standard measure) having access to banking services by 2008. To meet this goal, Mzansi accounts, a form of low-cost bank account for low-income people, were established in October 2004. They are available through the “big four” banks (Absa, First National Bank, Nedbank, Standard Bank) and the government owned Postbank. The accounts have low fees, offer deposits and withdrawals and have a debit card for withdrawals from ATMs that can also be used at retail outlets. In the first 18 months some 3.3 million Mzansi accounts had been opened. According to Colin Donian, the Banking Association South Africa’s Mzansi Initiative director, “The profile of the Mzansi Account holder is mostly female, with an average account balance of just under R300” and “around 90% of account holders are new to the institution with which they have opened their account.” Many of these accounts are held at Postbank, which has 2550 outlets around the country. Banks have also begun adding branches and ATMs in areas previously not covered. The Department of Labor has been setting up Mzansi accounts for beneficiaries of the Unemployment Insurance Fund so that payments can be made electronically. Still, some questions remain such as how often the accounts are used and how many are in the bottom LSM. Most of the un-banked work in the informal sector, are unemployed or derive their income primarily from government transfers such as pensions and grants. Income in the informal sector is often daily and/or irregular.31
Low-cost Housing Finance: Banks committed to provide R42 billion ($5.5 billion) for new low-cost housing finance by December 31, 2008. These loans prioritize households with a stable income in excess of R1,500 ($198) per month and less than R7,500 ($990) per month with a maximum value of R180,000 ($23,760) per unit. This income band will be increased in line with the CPIX (a measure of inflation) on the 1st of January each year commencing on 1 January 2004. The goal is to reach construction and ownership of between 250,000 and 400,000 units by 2010. There was some delay as the banks argued with the government about liability relating to unpaid low cost mortgages. The Banking Association of South Africa argues that ability to reach the target of R42 billion is at risk if governance, risk sharing and mitigation issues are not addressed and that the Association is in talks with the government “to find ways to mitigate non-commercial risks that banks face as they lend into a market with little or no experience of mortgage bonds”32
“A minimum of two thirds of that expenditure must be
spent with BEE accredited companies as the primary
vendor. The residual one third may be channelled to BEE
accredited companies via a primary vendor, which is not a
BEE accredited company, with only the BEE portion of the
expenditure counting towards the target.” – Financial Sector Charter
A survey of the un-banked prepared for FinMark Trust in July 2005 indicates that:
• Only 6% of the un-banked indicated they had full-time jobs in the formal sector; 50% percent are unemployed
• 37% have no monthly income, 32% earn less than R500 per month, only 4% earn more than R1,000 per month
• 56% are women, 31% are between 18 and 24 years, 59% live in urban areas.
• The top three reasons given for being un-banked are “no job”, “no income” and “no money to save.”30
South Africa 2006 – Challenges for the Future, page 14
But the banks have started to release the money; they claim to have spent R17 billion ($2.2 billion) so far.33 In April, First National Bank (FNB) announced a deal to build 3,000 houses in Soweto. In September it announced that more than 800 three-bedroom houses costing R168 000 ($22,176) each have been sold. Of these, more than 500 are 100% financed by the bank, while 68 combine FNB’s Smart Bond home loan and government subsidy. Applicants earning a gross monthly household income of not more than R3 500 ($462) qualify for a government subsidy. FNB has similar housing projects at Glenridge, Cosmo City near Kya Sands north of Johannesburg and N2 Gateway at the Joe Slovo settlement, part of Cape Town’s Langa township.34 While this is a start, the Banking Association of South Africa estimates that as of 2005, there is a housing shortage of 625,000 units for people in the R2500-R7500 ($330-$990) monthly income bracket. The Banking Association estimates that if the housing shortage is to be cut by 60% in the next five years (including the impact of increased demand due to population growth and urbanization) 135,000 units a year needed to be built. Currently only 15,000 houses are built for this market segment each year. The Banking Association says it will not be able to meet its R42 billion commitment if more houses are not built. Jan van Honschooten of the Banking Association noted “that there are just not enough units available” and warned that “if there are no more units to finance, we will have difficulty meeting the target.” Other problems cited by the Banking Association are that the government is not providing enough serviced land and the lack of local government capacity.35
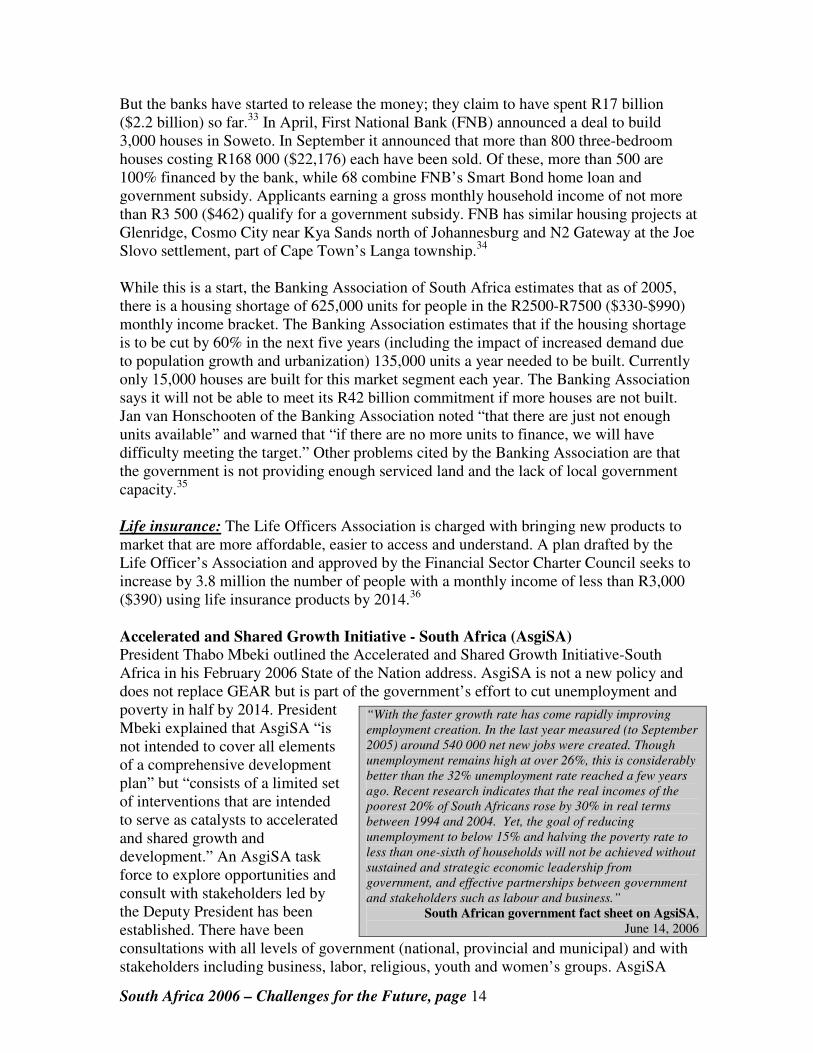
Life insurance: The Life Officers Association is charged with bringing new products to market that are more affordable, easier to access and understand. A plan drafted by the Life Officer’s Association and approved by the Financial Sector Charter Council seeks to increase by 3.8 million the number of people with a monthly income of less than R3,000 ($390) using life insurance products by 2014.36 Accelerated and Shared Growth Initiative - South Africa (AsgiSA)
President Thabo Mbeki outlined the Accelerated and Shared Growth Initiative-South Africa in his February 2006 State of the Nation address. AsgiSA is not a new policy and does not replace GEAR but is part of the government’s effort to cut unemployment and poverty in half by 2014. President Mbeki explained that AsgiSA “is not intended to cover all elements of a comprehensive development plan” but “consists of a limited set of interventions that are intended to serve as catalysts to accelerated and shared growth and development.” An AsgiSA task force to explore opportunities and consult with stakeholders led by the Deputy President has been established. There have been consultations with all levels of government (national, provincial and municipal) and with stakeholders including business, labor, religious, youth and women’s groups. AsgiSA
“With the faster growth rate has come rapidly improving
employment creation. In the last year measured (to September
2005) around 540 000 net new jobs were created. Though
unemployment remains high at over 26%, this is considerably
better than the 32% unemployment rate reached a few years
ago. Recent research indicates that the real incomes of the
poorest 20% of South Africans rose by 30% in real terms
between 1994 and 2004. Yet, the goal of reducing
unemployment to below 15% and halving the poverty rate to
less than one-sixth of households will not be achieved without
sustained and strategic economic leadership from
government, and effective partnerships between government
and stakeholders such as labour and business.” South African government fact sheet on AgsiSA,
June 14, 2006

South Africa 2006 – Challenges for the Future, page 15
seeks to remove constraints on the economy such as volatility and level of the currency, improved infrastructure (roads, ports, broadband internet access), increased investment, shortage of skilled labor, impact of apartheid spatial patterns and barriers to entry. An important focus of AsgiSA is increased public sector investment, which had fallen as low as 4% of GDP, but is now about 6%. The government plans to increase it to 8%, and to spend about R370 billion ($48.8 billion) between April 2005 and March 2008. About 40% of this will be spent by public enterprises such as Eskom and Transnet on power generation, power distribution, rail transport, harbors and an oil pipeline. Another 50% will be spent by the three levels of government (national, provincial, municipal) in such areas as roads, water infrastructure and supply, energy distribution, housing, schools and clinics, business centers, sport facilities and areas such as police stations, courts and correctional facilities. Sport facilities include building or improving 10 stadiums (and surrounding environs and access) for the 2010 FIFA World Cup. The government is seeking to promote private investment, especially in the sectors that are growing worldwide, are well suited to South Africa, are labor-intensive and open opportunities for Broad-Based Black Economic Empowerment. Areas in which the government hopes for progress include business processing outsourcing (including back-office activities and call centers), which the government says has attracted 5,000 jobs so far and has the potential for an additional 100,000 by 2009. Another sector is tourism which the government hopes to increase from 8% to 12% of GDP at the same time increasing employment by up to 400,000 people.37 Co-operatives Co-operatives are seen as a growing tool to reduce poverty and unemployment. Currently the subject of increasing government focus, and more then 1,000 co-ops already exist. The Growth and Development Summit made a commitment to support co-operatives. Responsibility for co-ops was transferred from the Department of Agriculture to the Department of Trade and Industry (DTI) to ensure that co-operatives are promoted as enterprises or businesses in all sectors of the economy, and not only in the agricultural sector as had been the case historically.39 In March 2005, DTI hosted a National Co-operatives Conference attended by more than 300 stakeholders, including representatives of both local and international co-operatives organizations as well as government, business and labor, non-government organizations and community. There is little data on co-ops. This was partly a problem of the legal framework – the Co-operatives Act of 1981 was focused on large, white-owned, commercial agriculture. Until recently, the register of co-ops was based in the Department of Agriculture, which collected very little information about the size and composition of co-ops. A study
Types of Co-operatives
• Worker co-operatives (an enterprise in which members are both workers and decision makers)
• Agricultural co-operatives (produces, processes and markets agricultural products; provides inputs to members)
• Housing co-operatives (providing housing to its members or technical services)
• Financial co-operatives (providing members with financial services such as banking, insurance or loans)
• Social co-operatives (providing services to members such as care to children, elderly and the sick)
• Services co-operatives (providing services such as housing, health care, child care, or transport to a community)38

South Africa 2006 – Challenges for the Future, page 16
published in early 2002 by the National Co-op Association of South Africa showed a wide range of emerging co-ops, many outside the agricultural sector. Most co-operatives in South Africa are small, survivalist enterprises typically with 15 members earning R1,600 ($211) each per year. Many co-ops in South Africa are not registered (sometimes called pre-co-ops). Some co-ops registered under other legislation such as the Companies Act, the Close Cooperation Act or the Mutual Banks Act, but these are also inappropriate as they do not give special recognition to co-ops.41 In 2005 the Co-operative Amendment Act was passed to promote the development of sustainable co-operatives. The Act provides a regulatory framework for diverse forms of co-ops, encourages persons who subscribe to co-operative principles to register, promotes equity and greater participation of black people and facilitates provision of support programs. The government has allocated R500 million to assist emerging black farmer co-operatives. The Department of Trade and Industry and the National Development Agency (NDA) have embarked on a program to bolster sustainable cooperative strategies that support local economic development and empowerment. NDA, which provides funding and expertise to civil organizations and businesses that work to eradicate poverty, will provide funding, training, project management and capacity building to co-operatives. The Small Enterprise Development Agency (SEDA) also supports co-operatives.42 Co-ops, often survivalist enterprises founded by people who are unemployed and have few business skills, face many challenges to becoming viable businesses. In the 1980s and 1990s there were a number of worker co-ops, including some sponsored by unions. Few have survived. They tend to be based in marginalized areas and the local market that they serve often consists of people who are themselves poor. Credit co-ops (including credit unions) are treated as small businesses and taxed at a rate of 30%, rather than as a not-for-profit business taxed at a rate of 15%. Skills Training
Another aspect of BEE is skills training, which is seen as necessary for economic growth and reducing unemployment. The economy needs more skilled workers in order to grow
and to reduce unemployment. In March 2006 the government initiated the Joint Initiative on Priority Skills Acquisition (JIPSA) headed by Deputy President Phumzile Mlambo-Ngcuka. JIPSA will identify skills needed and how the need can be met.
The Skills Development Act adopted in 1998 established 27 separate Sector Education and Training Authorities (SETAs), one for each economic sector. Members of SETAs include trade unions, government and barganing councils. Each SETA develops and implements a skills development plan and pays out development grants. Since April 2000
“What is critical is that because of the
overlapping needs of small businesses
and co-operatives, we are able to
utilise some SMME support
mechanisms to provide assistance to
co-operatives; co-operatives will
however need additional support.”
Mandisi Mpahlwa, Minister of Trade and Industry at the Co-operatives
Conference, March 2005.40
“It is difficult for individual emerging
farmers to survive in this industry. This is
why it is important for them to form
cooperatives to not only penetrate the
market but also be competitive.” Dirk deToit, Deputy Minister, Agriculture and Land Affairs,
September 200643
“A key point to note regarding the job
market is that while many unskilled
workers are unemployed, there is a
shortage of suitably skilled workers which
is a constraint on expansion.”
Towards A Ten Year Review
South Africa 2006 – Challenges for the Future, page 17
a levy of 1% of annual payroll has been imposed on all companies registered with the South African Revenue Service or having an annual payroll of more than R250,000 ($33,000). Of the money raised, 80% is distributed to the SETAs and 20% goes to the National Skills Fund, which develops projects that do not fall under SETAs. Social Grants
An important and successful tool for the government in reducing poverty is social grants. In 1994, racially based social grants inherited from the apartheid regime that totaled R10 billion were distributed to 2.6 million recipients. Of these over 1.6 million were older people and only 60,000 were children who were predominately from the white, Coloured, and Indian communities.
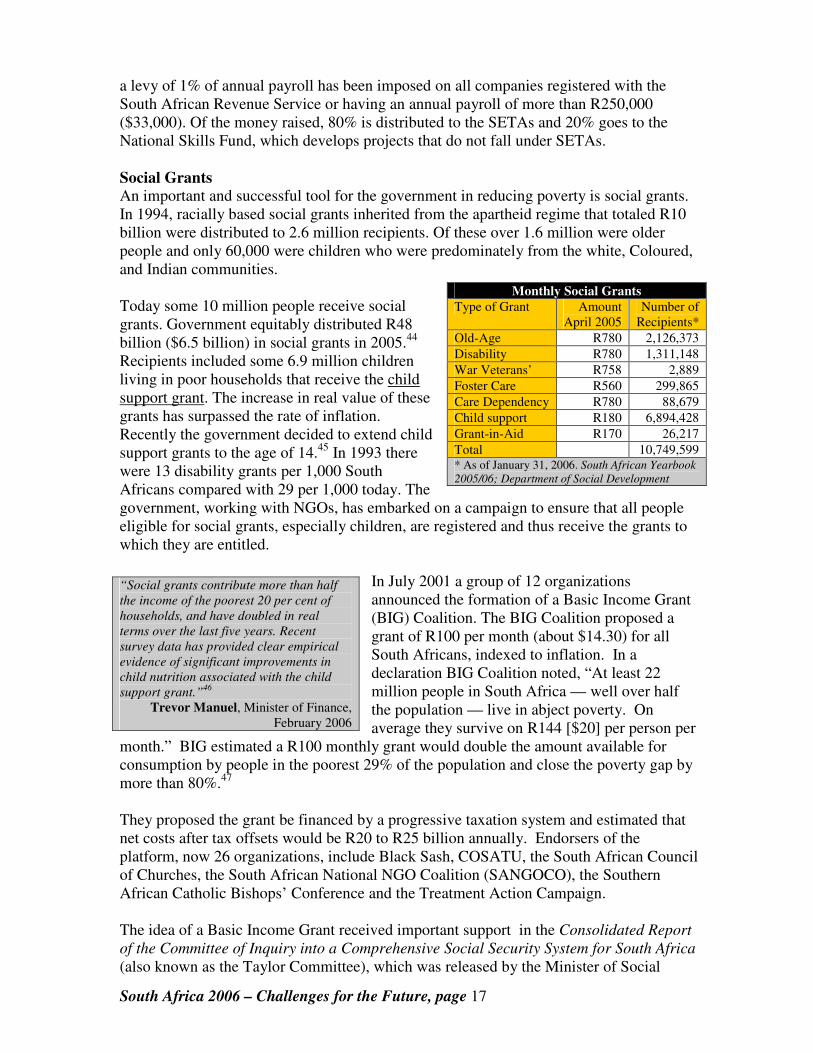
Today some 10 million people receive social grants. Government equitably distributed R48 billion ($6.5 billion) in social grants in 2005.44 Recipients included some 6.9 million children living in poor households that receive the child support grant. The increase in real value of these grants has surpassed the rate of inflation. Recently the government decided to extend child support grants to the age of 14.45 In 1993 there were 13 disability grants per 1,000 South Africans compared with 29 per 1,000 today. The government, working with NGOs, has embarked on a campaign to ensure that all people eligible for social grants, especially children, are registered and thus receive the grants to which they are entitled.
In July 2001 a group of 12 organizations announced the formation of a Basic Income Grant (BIG) Coalition. The BIG Coalition proposed a grant of R100 per month (about $14.30) for all South Africans, indexed to inflation. In a declaration BIG Coalition noted, “At least 22 million people in South Africa — well over half the population — live in abject poverty. On average they survive on R144 [$20] per person per
month.” BIG estimated a R100 monthly grant would double the amount available for consumption by people in the poorest 29% of the population and close the poverty gap by more than 80%.47 They proposed the grant be financed by a progressive taxation system and estimated that net costs after tax offsets would be R20 to R25 billion annually. Endorsers of the platform, now 26 organizations, include Black Sash, COSATU, the South African Council of Churches, the South African National NGO Coalition (SANGOCO), the Southern African Catholic Bishops’ Conference and the Treatment Action Campaign. The idea of a Basic Income Grant received important support in the Consolidated Report
of the Committee of Inquiry into a Comprehensive Social Security System for South Africa (also known as the Taylor Committee), which was released by the Minister of Social
Monthly Social Grants
Type of Grant Amount April 2005
Number of Recipients*
Old-Age R780 2,126,373
Disability R780 1,311,148
War Veterans’ R758 2,889
Foster Care R560 299,865
Care Dependency R780 88,679
Child support R180 6,894,428
Grant-in-Aid R170 26,217
Total 10,749,599 * As of January 31, 2006. South African Yearbook
2005/06; Department of Social Development
“Social grants contribute more than half
the income of the poorest 20 per cent of
households, and have doubled in real
terms over the last five years. Recent
survey data has provided clear empirical
evidence of significant improvements in
child nutrition associated with the child
support grant.”46
Trevor Manuel, Minister of Finance, February 2006
South Africa 2006 – Challenges for the Future, page 18
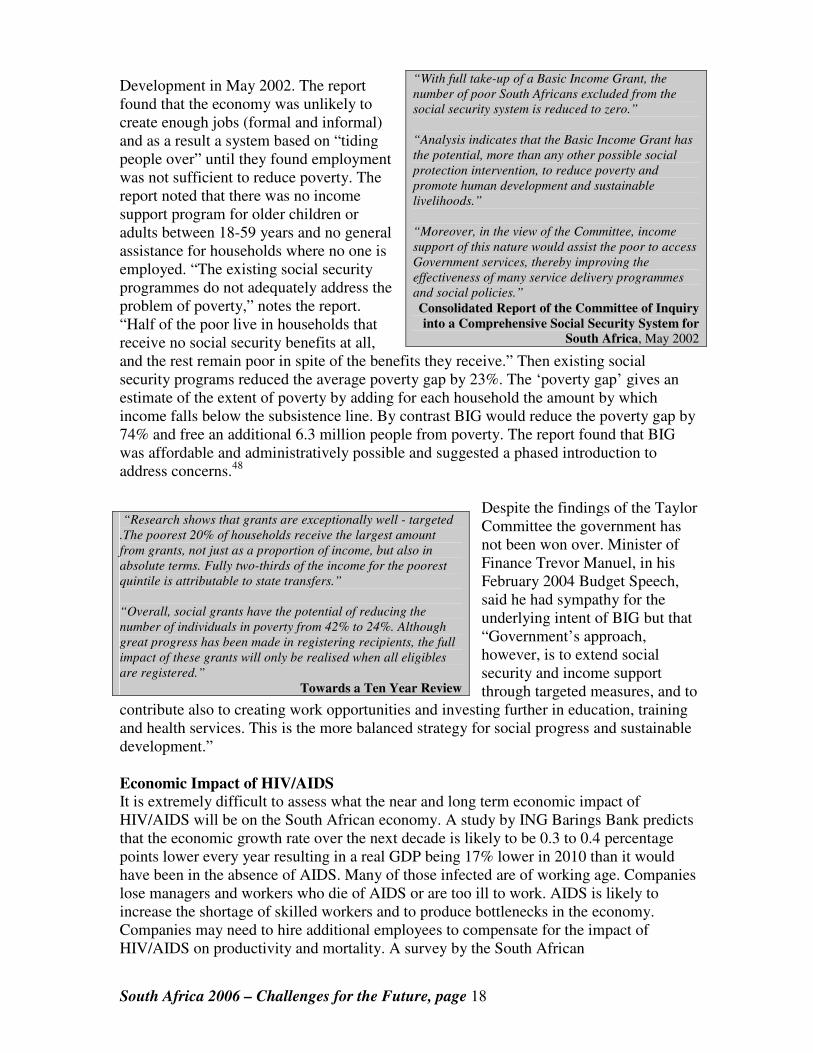
Development in May 2002. The report found that the economy was unlikely to create enough jobs (formal and informal) and as a result a system based on “tiding people over” until they found employment was not sufficient to reduce poverty. The report noted that there was no income support program for older children or adults between 18-59 years and no general assistance for households where no one is employed. “The existing social security programmes do not adequately address the problem of poverty,” notes the report. “Half of the poor live in households that receive no social security benefits at all, and the rest remain poor in spite of the benefits they receive.” Then existing social security programs reduced the average poverty gap by 23%. The ‘poverty gap’ gives an estimate of the extent of poverty by adding for each household the amount by which income falls below the subsistence line. By contrast BIG would reduce the poverty gap by 74% and free an additional 6.3 million people from poverty. The report found that BIG was affordable and administratively possible and suggested a phased introduction to address concerns.48
Despite the findings of the Taylor Committee the government has not been won over. Minister of Finance Trevor Manuel, in his February 2004 Budget Speech, said he had sympathy for the underlying intent of BIG but that “Government’s approach, however, is to extend social security and income support through targeted measures, and to
contribute also to creating work opportunities and investing further in education, training and health services. This is the more balanced strategy for social progress and sustainable development.” Economic Impact of HIV/AIDS
It is extremely difficult to assess what the near and long term economic impact of HIV/AIDS will be on the South African economy. A study by ING Barings Bank predicts that the economic growth rate over the next decade is likely to be 0.3 to 0.4 percentage points lower every year resulting in a real GDP being 17% lower in 2010 than it would have been in the absence of AIDS. Many of those infected are of working age. Companies lose managers and workers who die of AIDS or are too ill to work. AIDS is likely to increase the shortage of skilled workers and to produce bottlenecks in the economy. Companies may need to hire additional employees to compensate for the impact of HIV/AIDS on productivity and mortality. A survey by the South African
“With full take-up of a Basic Income Grant, the
number of poor South Africans excluded from the
social security system is reduced to zero.”
“Analysis indicates that the Basic Income Grant has
the potential, more than any other possible social
protection intervention, to reduce poverty and
promote human development and sustainable
livelihoods.”
“Moreover, in the view of the Committee, income
support of this nature would assist the poor to access
Government services, thereby improving the
effectiveness of many service delivery programmes
and social policies.”
Consolidated Report of the Committee of Inquiry
into a Comprehensive Social Security System for
South Africa, May 2002
“Research shows that grants are exceptionally well - targeted
.The poorest 20% of households receive the largest amount
from grants, not just as a proportion of income, but also in
absolute terms. Fully two-thirds of the income for the poorest
quintile is attributable to state transfers.”
“Overall, social grants have the potential of reducing the
number of individuals in poverty from 42% to 24%. Although
great progress has been made in registering recipients, the full
impact of these grants will only be realised when all eligibles
are registered.”
Towards a Ten Year Review
South Africa 2006 – Challenges for the Future, page 19
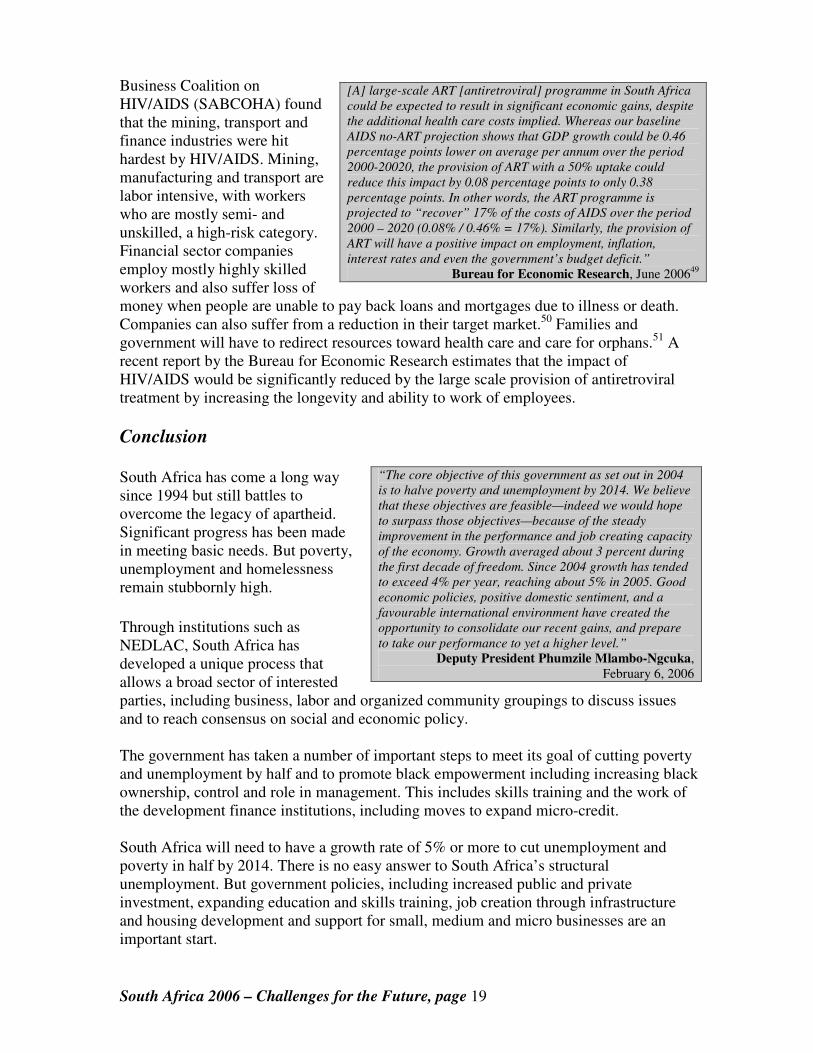
Business Coalition on HIV/AIDS (SABCOHA) found that the mining, transport and finance industries were hit hardest by HIV/AIDS. Mining, manufacturing and transport are labor intensive, with workers who are mostly semi- and unskilled, a high-risk category. Financial sector companies employ mostly highly skilled workers and also suffer loss of money when people are unable to pay back loans and mortgages due to illness or death. Companies can also suffer from a reduction in their target market.50 Families and government will have to redirect resources toward health care and care for orphans.51 A recent report by the Bureau for Economic Research estimates that the impact of HIV/AIDS would be significantly reduced by the large scale provision of antiretroviral treatment by increasing the longevity and ability to work of employees.
Conclusion South Africa has come a long way since 1994 but still battles to overcome the legacy of apartheid. Significant progress has been made in meeting basic needs. But poverty, unemployment and homelessness remain stubbornly high.
Through institutions such as NEDLAC, South Africa has developed a unique process that allows a broad sector of interested parties, including business, labor and organized community groupings to discuss issues and to reach consensus on social and economic policy. The government has taken a number of important steps to meet its goal of cutting poverty and unemployment by half and to promote black empowerment including increasing black ownership, control and role in management. This includes skills training and the work of the development finance institutions, including moves to expand micro-credit. South Africa will need to have a growth rate of 5% or more to cut unemployment and poverty in half by 2014. There is no easy answer to South Africa’s structural unemployment. But government policies, including increased public and private investment, expanding education and skills training, job creation through infrastructure and housing development and support for small, medium and micro businesses are an important start.
[A] large-scale ART [antiretroviral] programme in South Africa
could be expected to result in significant economic gains, despite
the additional health care costs implied. Whereas our baseline
AIDS no-ART projection shows that GDP growth could be 0.46
percentage points lower on average per annum over the period
2000-20020, the provision of ART with a 50% uptake could
reduce this impact by 0.08 percentage points to only 0.38
percentage points. In other words, the ART programme is
projected to “recover” 17% of the costs of AIDS over the period
2000 – 2020 (0.08% / 0.46% = 17%). Similarly, the provision of
ART will have a positive impact on employment, inflation,
interest rates and even the government’s budget deficit.”
Bureau for Economic Research, June 200649
“The core objective of this government as set out in 2004
is to halve poverty and unemployment by 2014. We believe
that these objectives are feasible—indeed we would hope
to surpass those objectives—because of the steady
improvement in the performance and job creating capacity
of the economy. Growth averaged about 3 percent during
the first decade of freedom. Since 2004 growth has tended
to exceed 4% per year, reaching about 5% in 2005. Good
economic policies, positive domestic sentiment, and a
favourable international environment have created the
opportunity to consolidate our recent gains, and prepare
to take our performance to yet a higher level.”
Deputy President Phumzile Mlambo-Ngcuka, February 6, 2006
South Africa 2006 – Challenges for the Future, page 20
Copyright 2006 Shared Interest and Richard Knight Richard Knight (www.richardknight.com) is a New York City based consultant and Project Director of the African Activist Archive Project (www.africanactivist.msu.edu). He previously worked at the American Committee on Africa/The Africa Fund.
Suggested Reading
Season of Hope: Economic Reform Under Mandela and Mbeki by Alan Hirsch, University of KwaZulu-Natal Press. The author is Chief Director of Economic Policy the Presidency. He previously served in the Department of Trade and Industry.
Population and use of racial classifications: The term Black in this paper is used to describe all those not classified as white. In terms of the use of racial classifications the following from Statistics South Africa should be borne in mind: “Statistics South Africa continues to classify people by population group, in order to monitor progress in moving away from the apartheid-based discrimination of the past. However membership of a population group is now based on self-perception and self-classification, not on a legal definition.”
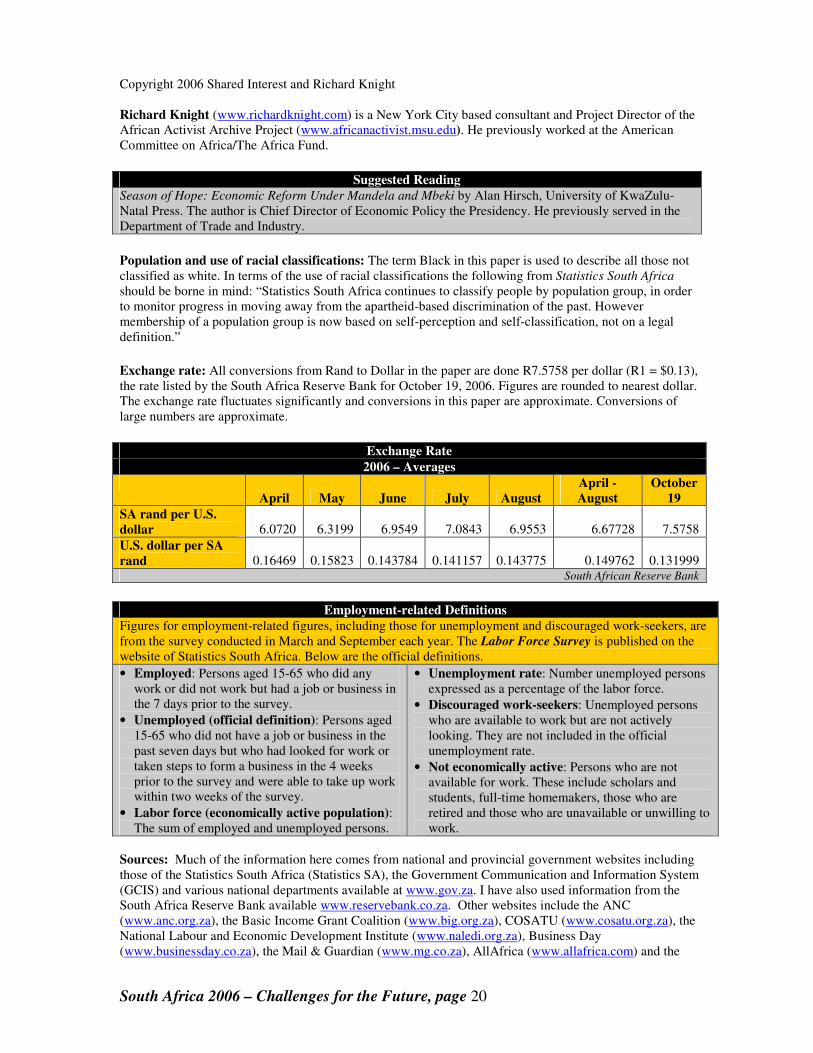
Exchange rate: All conversions from Rand to Dollar in the paper are done R7.5758 per dollar (R1 = $0.13), the rate listed by the South Africa Reserve Bank for October 19, 2006. Figures are rounded to nearest dollar. The exchange rate fluctuates significantly and conversions in this paper are approximate. Conversions of large numbers are approximate.
Exchange Rate
2006 – Averages
April May June July August
April -
August
October
19
SA rand per U.S.
dollar 6.0720 6.3199 6.9549 7.0843 6.9553 6.67728 7.5758
U.S. dollar per SA
rand 0.16469 0.15823 0.143784 0.141157 0.143775 0.149762 0.131999 South African Reserve Bank
Employment-related Definitions
Figures for employment-related figures, including those for unemployment and discouraged work-seekers, are from the survey conducted in March and September each year. The Labor Force Survey is published on the website of Statistics South Africa. Below are the official definitions.
• Employed: Persons aged 15-65 who did any work or did not work but had a job or business in the 7 days prior to the survey.
• Unemployed (official definition): Persons aged 15-65 who did not have a job or business in the past seven days but who had looked for work or taken steps to form a business in the 4 weeks prior to the survey and were able to take up work within two weeks of the survey.
• Labor force (economically active population): The sum of employed and unemployed persons.
• Unemployment rate: Number unemployed persons expressed as a percentage of the labor force.
• Discouraged work-seekers: Unemployed persons who are available to work but are not actively looking. They are not included in the official unemployment rate.
• Not economically active: Persons who are not available for work. These include scholars and students, full-time homemakers, those who are retired and those who are unavailable or unwilling to work.
Sources: Much of the information here comes from national and provincial government websites including those of the Statistics South Africa (Statistics SA), the Government Communication and Information System (GCIS) and various national departments available at www.gov.za. I have also used information from the South Africa Reserve Bank available www.reservebank.co.za. Other websites include the ANC (www.anc.org.za), the Basic Income Grant Coalition (www.big.org.za), COSATU (www.cosatu.org.za), the National Labour and Economic Development Institute (www.naledi.org.za), Business Day (www.businessday.co.za), the Mail & Guardian (www.mg.co.za), AllAfrica (www.allafrica.com) and the
South Africa 2006 – Challenges for the Future, page 21
websites cited in the footnotes. I have occasionally used sentences or phases without footing each or placing them in quotes, especially in descriptions based on government websites. Spelling: There are minor differences between South African English and U.S. spelling of words. In quotes of text and titles from South Africa the original spelling has been used.
1 GNI per capita is for 2004; source: World Bank. 2 Season of Hope: Economic Reform Under Mandela and Mbeki by Alan Hirsch, (University of Kwazulu Natal Press, 2005), p. 2. 3 “The South African banking sector – an overview of the past 10 years” by T. T. Mboweni, Governor of the South African Reserve Bank, Johannesburg, December 14, 2004 available at http://www.bis.org/review/r041231f.pdf. 4 Towards a Ten Year Review, Government Communication and Information System (GCIS) on behalf of The Presidency, October 2003 5 The ANC’s 2004 election manifesto is available at www.anc.org.za. 6 Unless otherwise noted, employment and unemployment numbers include workers aged 15-65. Statistics on employment and unemployment in this section come from Labour Force Survey, September 2005 (Statistics South Africa, January 2006) and Labour Force Survey, September 2000 to March 2005,
Historical series of revised estimates (Statistics South Africa, September 2005). 7 The State of COSATU, Phase One Report, National Labor & Economic Development Institute, August 2006 available at www.naledi.org.za; COSATU website www.cosatu.org.za; “COSATU Joins the nouveau riche” by Tumi Makgetla, Mail & Guardian, October 6, 1006; Labor Force Survey, September 2005, Statistics South Africa (January 2006). 8 “Budget Speech 2006” by Trevor Manuel, Minister of Finance, February 15, 2006 9 Season of Hope: Economic Reform Under Mandela and Mbeki by Alan Hirsch, Center for Conflict Resolution public seminar on book of the same title, March 15, 2006, see http://ccrweb.ccr.uct.ac.za/ 10 Medium Term Strategy Framework 2003-2006, Department of Trade & Industry. 11 BEE 2006: Charters and Deals, Business Map Foundation ,2006 12 South Africa’s Economic Transformation – A Strategy for Broad-Based Black Economic
Empowerment, Department of Trade and Industry, March 2003 available at www.dti.gov.za 13 Broad-Based Black Economic Empowerment Act, 2003. 14 South African Yearbook 2005/06, GCIS, Pretoria 15 “Black power still limited in boardrooms”, Mail & Guardian, September 23, 2006; “Rethink Methods” by Andrew McGregor, Whom Owns Whom, Business Day, August 25, 2006, “Black Power Still limited in boardrooms” Sapa, September 22, 2006; Empowerdex website www.empowerdex.co.za accessed October 17, 2006. 16 Government Tender Bulletin, July 21, 2006. 17 “Minister’s Speech-Apex Fund Gauteng Launch”, September 19, 2006 and www.thedti.gov.za/samaf/samaf.htm 18 Khula web site www.khula.org.za 19 “Fund to boost small business launched” by Siseko Njobeni, Business Day, February 8, 2006. 20“Khula business case examines entry into direct retail lending” by Linda Ensor, Business Day, August 11, 2006 21 National Empowerment Fund website www.nefcorp.co.za 22 The IDC Ten Year Review 1994 – 2003 (Industrial Development Corporation, April 2004); “The IDC and BEE” (Industrial Development Corporation) accessed from www.idc.co.za September 9, 2006 23 “Help is missing where it matters most” by Mathabo le Roux, trade and industry correspondent, Business Day, June 29, 2006 24 The National Economic Development and Labour Council Act was passed in 1994 and NEDLAC was established in February 1995. 25 Work in Progress, July 7, 1993. 26 Web page of NEDLAC www.nedlac.org.za and Medium Term Budget Policy Statement 2003 27 “Policy Initiatives to expand financial outreach in South Africa” by Marié Kirsten, Development Bank of Southern Africa, May 31, 2006 28 “Transform and Diversify the Financial Sector With and For the Workers and the Poor” by Blade Nzimande, address to the national summit on the financial sector hosted by NEDLAC, August 20, 2002. 29 Financial Sector Charter, 2003, available at www.fscharter.co.za.

South Africa 2006 – Challenges for the Future, page 22
30 The impact of the Dedicated Banks Bill on access to financial services, report prepared for The FinMark Trust by Penelope Hawkins and Andreas Bertoldi (FEASibility (Pty) Ltd, July 2005) available at www.finmarktrust.org.za. 31 “Mzansi: SA banking spreads its net” September 8, 2005 at http://www.southafrica.info/public_services/citizens/consumer_services/mzansi.htm accessed September 28, 2006; “Mzansi accounts balloon to 3.3m”, Business Day, August 30, 2006; “Postbank shows way on Mzansi”, Business Day, May 19, 2006; “UIF saves millions in bank charges”, Business Day, July 19, 2006 (www.businessday.co.za); FinMark News, Issue 48 (FinMark Trust, October 2006). 32 “The Role of the Banking Association” brochure published by the South African Banking Association, August 2006 33 “Banks warn of risk to low-income housing” by Linda Ensor, Business Day, September 20, 2006 34 “FNB distributes over R100-million to build houses in Soweto” First National Bank press release, September 11, 1006 available at www.fnb.co.za; “FNB in R500-million housing project in Soweto” Mail & Guardian Online, April 19, 2006; Banking on new foundations” Mail & Guardian Online, December 5, 2005; “Banks back off housing pledge” Mail & Guardian Online at www.mg.co.za 35 Final Report: Research, Findings and Conclusions by The Settlements Dynamics Project Shop and Matthew Neil & Associates (Banking Association of South Africa, December 2005) available at http://www.banking.org.za/documents/2005/DECEMBER/HousingSupFinal.pdf; Access Housing, No. 3 (FinMark Trust, August 2006) available at www.finmarktrust.org.za; “Banks back off housing pledge” op. cit. 36 “Insurance for low-income groups set to double”, Mail & Guardian Online, February 2006. 37 Accelerated and Shared Growth Initiative for South Africa (AsgiSA), fact sheet on the South African Government information website www.info.gov.za/asgisa/asgisa.htm accessed September 21, 2006. 38 These descriptions are taken from “Types of co-operatives” from the website of Small Enterprise Development Agency, the Department of Trade and Industry's agency for supporting small business in South Africa, www.seda.org.za accessed on September 24, 2006. 39 “Co-operatives in South Africa: Their Role in Job Creation and Poverty Reduction” by Kate Philip, October 2003; “Registrar of co-operatives moves to the dti”, press release, Department of Trade and Industry, April 1, 2005. 40 “Cooperatives Conference: Keynote address by Minister of Trade and Industry” by Mandisi Mpahlwa, March 14, 2005 41 Research Report – Youth participation in co-operatives in South Africa, UMSOBOMVU, 2003; Co-operatives in South Africa: Their Role in Job Creation and Poverty Reduction by Kate Philip, for the South African Foundation, 2003. 42 Engineering News at www.engineeringnews.co.za, accessed September 24, 2006. 43 “Emerging Farmers Urged to Form Cooperatives” by Lehuma Ntuame, BauNews, September 5, 2006. 44 South African Yearbook 2005/06, p. 543. 45 Speech By Dr Zola Skweyiya, Minister Of Social Development On The Occasion Of The Reading Of The Third Debate On The Social Assistance And The South African Social Security Agency Bills In The National Council Of Provinces, February 24, 2004 and Minister's Notes: Media Briefing on the National Social Security Agency and Social Assistance Bills to be tabled at the NCOP, February 25, 2004. 46 “Budget Speech 2006”, op. cit. 47 See the Basic Income Grant Coalition website www.big.org.za. 48 Consolidated Report of the Committee of Inquiry into a Comprehensive Social Security System for
South Africa, May 2002; Coalition Endorses Evolutionary Report's Big Anti-Poverty Plan and “The Basic Income Grant: Poverty, Politics and Policy-making” by Ravi Naidoo, October 31, 2002 and other documents on the BIG web site www.big.org.za. 49 The macroeconomic impact of HIV/AIDS under alternative intervention scenarios (with specific
reference for ART) on the South Africa economy (Bureau for Economic Research, University of Stellenbosch, June 2006) available at http://www.ber.sun.ac.za 50 “AIDS takes its toll on industry”, Mail & Guardian Online, October 2, 2006; Impact of HIV/AIDS on
Selected Business Sectors in South Africa, 2005, a survey conducted by the Bureau of Economic Research (BER) and funded by the South African Business Coalition on HIV & AIDS (SABCOHA), October 2005. 51 http://www.thebody.com/unaids/update/economic.html


![China in Africa[1].The Human Rights Impact.Final Draft · 2016-03-10 · China in Africa: the Human Rights Impact concludes that in order for human rights in Africa to be respected](https://static.fdocuments.us/doc/165x107/5e95aeca830747705d2389ef/china-in-africa1the-human-rights-draft-2016-03-10-china-in-africa-the-human.jpg)