South African Reserve Bank Working Paper Series WP/18/04 and Publications/Attachments... · ii....
30
i South African Reserve Bank Working Paper Series WP/18/04 Monetary Policy Credibility and Exchange Rate Pass- Through in South Africa Alain Kabundi and Montfort Mlachila Authorised for distribution by Chris Loewald August 2018
Transcript of South African Reserve Bank Working Paper Series WP/18/04 and Publications/Attachments... · ii....

i
South African Reserve Bank Working Paper Series
WP/18/04
Monetary Policy Credibility and Exchange Rate Pass-Through in South Africa
Alain Kabundi and Montfort Mlachila
Authorised for distribution by Chris Loewald
August 2018

i
South African Reserve Bank Working Papers are written by staff members of the South African Reserve Bank and on occasion by consultants under the auspices of the Bank. The papers deal with topical issues and describe preliminary research findings, and develop new analytical or empirical approaches in their analyses. They are solely intended to elicit comments and stimulate debate.
The views expressed in this Working Paper are those of the author(s) and do not necessarily represent those of the South African Reserve Bank or South African Reserve Bank policy. While every precaution is taken to ensure the accuracy of information, the South African Reserve Bank shall not be liable to any person for inaccurate information, omissions or opinions contained herein.
South African Reserve Bank Working Papers are externally refereed.
Information on South African Reserve Bank Working Papers can be found at http://www.resbank.co.za/Research/ResearchPapers/WorkingPapers/Pages/WorkingPapers-Home.aspx
Enquiries
Head: Economic Research and Statistics Department South African Reserve Bank P O Box 427 Pretoria 0001
Tel. no.: +27 12 313-3911 0861 12 SARB (0861 12 7272)
© South African Reserve Bank
All rights reserved. No part of this publication may be reproduced, stored in a retrieval system, or transmitted in any form or by any means without fully acknowledging the author(s) and this Working Paper as the source.
Monetary Policy Credibility and Exchange Rate Pass-Through in South
Africa Alain Kabundi and Montfort Mlachila1
August 2018
Abstract
This paper investigates the key factors that explain the documented decline in the exchange rate pass-through in South Africa over the past two decades, which coincides with the adoption of the inflation-targeting regime. The paper conjectures, in line with the literature, that this outcome is largely due to improved monetary policy credibility. To do this, it first documents the factors that explain monetary policy credibility. Using the standard deviation of individual inflation forecasts as a measure of monetary policy credibility, its shows that the latter is negatively affected by the level of inflation itself, monetary policy uncertainty, and a measure of the unobserved stochastic volatility of inflation. The second phase proceeds by analyzing the determinants of the pass-through using the monetary policy credibility index derived from the first phase. The paper confirms the remarkable achievement that, despite the many shocks that the economy has witnessed, the declining pass-through is indeed explained by the improving monetary policy credibility.
JEL Classification Numbers: E31, E52, E58
Keywords: monetary policy credibility, exchange rate pass-through, South Africa
Author’s E-Mail Address: [email protected] , [email protected]
1 We would like to thank, without implications, Ari Aisen, Axel Schimmelpfennig, Hoda Selim, Daan Steenkamp, and participants at the African Department Seminar series, SARB seminar series, Oxford University Conference on African Development and the bi-annual conference of the Economic Society of South Africa.
ii
Contents Page
I. INTRODUCTION ................................................................................................................4
II. RELATED LITERATURE ................................................................................................5
III. CHARACTERIZING MONETARY POLICY CREDIBILITY IN SOUTHAFRICA ....................................................................................................................................7
IV. EMPIRICAL STRATEGY AND FINDINGS...............................................................11Determinants of Monetary Policy Credibility....................................................................12 Monetary Policy Credibility and Exchange Rate Pass-Through .......................................20
V. ROBUSTNESS CHECKS ................................................................................................23
VI. CONCLUDING REMARKS ..........................................................................................23
Figures 1. Bank Transparency Index: South Africa and its Peers ..........................................................82. Time-Varying Exchange Rate Pass-Through ......................................................................123. Forecast Disagreements and Inflation ..................................................................................134. Deviation of Realized Inflation from Inflation Target .........................................................145. Forecast Disagreements and Inflation Volatility .................................................................156. Forecast Disagreements and Squared Change in the Repo Rate .........................................167. Inflation and Inflation Expectations.....................................................................................178. Forecast Disagreements and Output Gap .............................................................................199. Cumulative Credibility and Exchange Rate Pass-Through .................................................2110. Cumulative Credibility of Redl and Exchange Rate Pass-Through...................................21
Tables 1. Inflation Expectations: Pre-2009 .........................................................................................182. Inflation Expectations: Post-2009 ........................................................................................183 Determinants of Monetary Policy Credibility.......................................................................20 4. Credibility and Exchange Rate Pass-Through .....................................................................225. Robustness Checks Using Various Measures of Credibility ...............................................23
Appendix ..................................................................................................................................25
3
I. INTRODUCTION
Following the finding in Kabundi and Mbelu (2018) that exchange rate pass-through to consumer inflation has declined considerably in South Africa since the adoption of the inflation targeting framework in the early 2000, this paper proposes to examine the role of monetary policy credibility in explaining this outcome. There is growing literature which argues that this may be the case (Gagnon and Ihrig 2004; Aleem and Lahiani 2014; Carrière-Swallow et al. 2016). Understanding this phenomenon is important in assessing the effectiveness of monetary policy in South Africa. Specifically, forecasting of the effects changes in monetary policy on inflation has to incorporate the declining pass-through.
A proper understanding of exchange rate pass-through to inflation in an emerging market country like South Africa is important for policy makers. This is particularly the case since emerging markets and other developing countries are particularly prone to various economic shocks, which can have a material impact on inflation. Since the adoption of the inflation targeting framework in 2000, the central bank has allowed the rand to fluctuate with hardly any interventions. As a result, it has relatively little direct control over the impact of exchange rate fluctuations on inflation outcomes. A good degree of understanding of the degree of pass-through is therefore important since the monetary authorities can only affect the domestic component of price formation.
It is well documented that in South Africa—in line with other emerging markets—the pass-through has declined over the past fifteen years of so.2 In an assessment of the pass-through during the period 1994–2014, Kabundi and Mbelu (2018) document the decline by splitting the degree of pass-through in two phases. They show that in the first phase—the impact of exchange rate fluctuations on import prices—the pass-through is nearly complete. However, during the second phase—transmission of import prices to headline consumer prices—the pass-through is incomplete and has declined from about 70 percent in the late nineties to about 20 percent at the end of the period. In an important finding, they also show that there is a degree of asymmetry in the level of pass-through depending on the stage of the business cycle. Both the first- and second-stage level and speed of pass-through rise during cyclical upturn of the economy, and decline when the economy is weak.
This paper aims to analyze the key factors that explain the documented decline in the pass-through in South Africa. We conjecture, in line with the literature, e.g., Taylor (2000), that this outcome is largely due to improved monetary policy credibility.3 Monetary policy credibility is a key ingredient of monetary policy effectiveness, and can be described as the degree to which various economic agents believe that the central bank will act to ensure that it meets its key policy objective(s), especially inflation. Monetary policy credibility is unobservable in practice, and can only be inferred. Dovern, Fritsche and Slacalek (2012) argue that the degree of (dis)agreement among professional forecasters is a good proxy for
2 See for instance, Karoro et al. (2009), Parseley (2010), Aron et al. (2014), and Jooste and Jhaveri (2014). 3 It seems that agents perceive that the central bank can credibly commit to defend the implicit inflation target of 6 percent (although the official target range is 3–6 percent), as shown by Kabundi and Schaling (2013) and Kabundi, Schaling, and Some (2015).
4

policy credibility. Monetary policy transparency, predictability, and the perceived degree of central bank independence help coordinate forecasters’ inflation expectations.
When monetary policy is credible, there is less uncertainty surrounding both objectives and tools of monetary policy. Keeping inflation broadly within the target range, notwithstanding exogenous or unseen shocks to output, interest rates, and exchange rates obviously increases monetary policy credibility. Another way of measuring monetary policy credibility is therefore the degree to which the central bank meets its own inflation objective, controlling for shocks.
This paper contributes to the literature by conducting a detailed analysis of monetary policy credibility as a key explanatory factor in South Africa, something few other authors have done.4 To do this, it proceeds in two phases. First, it explores the degree to which monetary policy transparency has evolved in South Africa over the past two decades. It documents the factors that explain monetary policy credibility. Using the standard deviation or the coefficient of variation of individual inflation forecasts as a measure of monetary policy credibility in the baseline estimations, it shows that the latter is negatively affected by the level of inflation itself, monetary policy uncertainty (the degree to which interest rates fluctuate), and a measure of the unobserved stochastic volatility of inflation. The second phase proceeds by analyzing the determinants of the pass-through using the monetary policy credibility index derived from the first phase. The paper confirms that the declining pass-through is indeed explained by the improving monetary policy credibility. The results are confirmed by several robustness checks based on different measures of monetary policy credibility, and after controlling for possible endogeneity.
The rest of the paper is organized as follows. Section II discusses the literature review. We elaborate specification framework to evaluate monetary policy credibility in Section III. In addition, we present the appropriate model which serves in the analysis of the relationship between monetary policy credibility and the exchange rate pass-through in South Africa. Section IV discusses the empirical results, focusing first on determinants of monetary policy credibility, and then the relationship between monetary policy credibility and the exchange rate pass-through. Section V undertakes several robustness checks. Section 5 concludes the paper with some remarks.
II. RELATED LITERATURE
There is a long-standing conjecture in the literature that declines in exchange rate pass-through observed over the past two decades in many countries are due in part to improved monetary policy credibility. In a seminal paper Taylor (2000) advanced the conjecture that the decline in pass-through was due to the low inflation environment. For this, he proposed a microeconomic model of price setting to show that lower pass-through is caused by lower perceived persistence of cost changes. He provided evidence showing that inflation is positively correlated with its own persistence, suggesting that the low inflation itself has caused the low pass-through. To sum up, he conjectured that stronger monetary
4 Aron and Muellbauer (2007), based on their analysis of inflation expectations of different agents, conclude that the inflation targeting framework has improved the credibility and the effectiveness of monetary policy in South Africa.
5
policy—characterized by strong nominal anchors and low, stable inflation—leads to an endogenous decline in exchange rate pass-through.
Mankiw and Reis (2002) propose an alternative explanation by way of a sticky information model in which some people form expectations based on outdated information. Economic agents only update their expectations periodically because of costs related to the collecting and processing of information. Mankiw et al. (2003) provided empirical evidence for the sticky information model. They show that in the US the amount of disagreement is surprisingly substantial and that it varies over time in line with other macroeconomic aggregates.
In a comprehensive study covering about 70 countries over the period 1979–2000 Choudhri and Hakura (2006) provide robust evidence for a positive association between pass-through and the average rate of inflation. The inflation rate seems to dominate over other macroeconomic variables. More recent work has highlighted the importance of monetary policy credibility, especially in the context of the implementation of inflation-targeting framework, as a key explanatory variable for declining pass-through. For instance, Aleem and Lahiani (2014) show a decline in the exchange rate pass-through after the transition to inflation-targeting regimes, but that Latin American countries are characterized by higher pass-through than the East Asian countries. Gagnon and Ihrig (2004) also provide evidence on Taylor’s conjecture, and Dovern et al. (2012) confirm that credible monetary policy contributes to anchoring inflation expectations and interest rate. They argue that for inflation expectations to be well-anchored, their cross-sectional dispersion—disagreement among forecasters—needs to be reduced or disappear.
Similarly, Carrière-Swallow et al. (2016) directly test the hypothesis in a large sample of emerging and advanced economies—including South Africa—by looking at first- and second-round effects of currency movements on consumer prices. They find robust evidence in support of the conjecture that improvement of monetary policy frameworks by establishing strong nominal anchors has led to the reduction in pass-through over the past two decades. Price stability and central bank credibility are particularly important in reducing second round pass-through. The paper also confirms the finding in Choudhri and Hakura (2006) that the degree of pass-through depends on the level and variability of inflation.
While confirming that the adoption of IT frameworks reduces the degree of pass-through, Caselli and Roitman (2016) document non-linearities and asymmetries in the degree of pass-through. For instance, they find that higher degrees of depreciation lead to much greater and faster levels of pass-through than in the linear case. As a consequence, policymakers should be cognizant that the appropriate policy response should fully incorporate the non-linear nature underlying the dynamic response. In other words, the policy response should be state-contingent in order to better anchor inflation expectations.
Central banks typically build credibility over time. Central bank independence (CBI)—or at least autonomy—is the cornerstone of credibility. CBI is the ability of the central bank to formulate and implement monetary policy without undue influence of the government (Garriga 2016). In the literature, following a seminal paper by Cukierman, Webb and Neyapti
6

(1992), CBI is typically presented as a multidimensional phenomenon. There are typically four dimensions of CBI that are important (Crowe and Meade 2008, Dincer and Eichengreen 2014): (i) appointment procedures for central bank head; (ii) use of an explicit policy target, e.g., inflation; (ii) conflict resolution procedures between the central bank and thegovernment; and (iv) rules limiting lending to the government.
In practice, what matter in terms of a central bank’s effectiveness in achieving its inflation objective is the flipside of independence, central bank transparence (CBT). It is a key element of accountability (Dincer and Eichengreen 2014). Without transparency, the public cannot assess whether the actions of central bankers are consistent with their mandate. CBT is therefore a crucial factor for enhancing the credibility of the central bank’s commitment to its inflation objective.
As Dincer and Eichengreen (2014) explain, a central bank is more convincing when it explains in detail how and why its policies can deliver the target inflation rate. Once a central bank is credible, it has leeway to deviate from its typical policy settings when atypical conditions (shocks) arise. In this case, it will be clear to the public that the deviation is temporary, and that its longer-term pursuit of its target is not in doubt.
III. CHARACTERIZING MONETARY POLICY CREDIBILITY IN SOUTH AFRICA
In the case of South Africa, the central bank has a strong track record of independence, which was enshrined in the constitution in the mid-1990s, unlike the case of most central banks. Following the adoption of the inflation targeting regime in 2000, Aron and Muellbauer (2007) show that there was a clear structural break with a strong rise in transparency and accountability. In particular, survey data of inflation expectations provided evidence of a gain in credibility and the anchoring of inflation expectations. Dincer and Eichengreen (2014), using more recent data, confirm this. Using their CBT index, which ranges from 0 to 15, they show that CBT increased significantly from 5 to 8.5 during the period 1999–2001. South Africa compares favorably with its African, emerging market and BRICS peers (Figure 1). It scores highly at the same level as Chile, Hong Kong, and South Korea, but above Argentina, Brazil, India, Mexico, and Singapore. It is ranked just below Australia, Israel, and New Zealand.
Indeed, it is likely that there has been further improvement since 2012, notably due to a number of noteworthy improvements in the communication strategy by the central bank. These include the systematic publication of macroeconomic assumptions and forecasts after each monetary policy committee meeting and a press conference, complemented by a detailed analysis of prevailing macroeconomic conditions in its six-monthly monetary policy review. A further notable improvement has been the publication of its core Quarterly Projection Model in 2017, which gives the projected interest rate path.
7

Figure 1. Bank Transparency Index: South Africa and its Peers
Source: Authors’ calculations based on Dincer and Eichengreen (2014).
This is important because the literature has documented a close association between CBT and inflation. For instance, Siklos (2008), in a careful analysis of over 100 countries, provides compelling evidence that several elements of CBT do reduce inflation. Weber (2018) confirms this result, and extends the analysis to inflation volatility. He finds that CBT reduces both inflation and its volatility, and that CBT has a declining impact on volatility the lower the level of inflation.
While CBT is at the core of monetary policy credibility, it is a slow-moving variable. Its effective impact and transmission occurs through how economic agents form expectations, especially about inflation. In a single-country setting it is therefore empirically tractable to use variables that have a higher frequency and have a more direct impact on inflation. For this reason, in South Africa we proxy monetary policy credibility by a measure of forecast disagreement across forecasters of inflation based on the survey conducted Reuters. This measure represents uncertainty about inflation, which in turn is negatively correlated with the predictability of the central bank.
Dovern, Fritsche, and Slacalek (2012) find that disagreement about inflation is negatively correlated with the credibility and independence of central banks. It is worth noting that survey data used to construct these measures are subject to the common issue associated with fixed-event forecasts. We face the same challenge with Reuters’ survey data—the main source for this paper—in that the forecasting horizon changes from month to month. To address this issue, we adopt the approach proposed by Dovern, Fritsche, and Slacalek (2012), and construct the proxy for one-year-ahead forecast of inflation by taking a weighted moving average of fixed-event forecasts.
2
3
4
5
6
7
8
9
10
11
1998 2000 2002 2004 2006 2008 2010
AfricaSouth AfricaMauritiusNigeria
Central Bank Transparency in Selected African Countries(Unweighted), Indices Tange from 0 (lowest) to 15 (highest)
2
3
4
5
6
7
8
9
10
11
1998 2000 2002 2004 2006 2008 2010
South AfricaMexicoChileTurkeyBRIC
Central Bank Transparency in Selected Emerging Market Economies(Unweighted), Indices Tange from 0 (lowest) to 15 (highest)
8

𝜋𝜋�𝑡𝑡,𝑖𝑖 = 4−𝑞𝑞+14
𝜋𝜋𝑡𝑡,𝑖𝑖0 + 𝑞𝑞−1
4𝜋𝜋𝑡𝑡,𝑖𝑖1 (1)
where 𝑞𝑞 ∈ {1, … ,4} since Reuters’ surveys are expressed in quarterly frequency, 𝜋𝜋𝑡𝑡,𝑖𝑖0
is the forecast for inflation for the current calendar year made by the forecaster i at time t, and 𝜋𝜋𝑡𝑡,𝑖𝑖
1 is forecast for the next calendar year.
We then compute the measure of disagreement, 𝜎𝜎𝑡𝑡𝜋𝜋, as the standard deviation or interquartile range of inflation forecasts across individual forecasters at each point in time. Two measures are qualitatively similar, but the interquartile range as it is insensitive to outliers. Finally, we estimate the index of monetary policy credibility (𝛿𝛿𝑡𝑡) as the inverse of forecast disagreement:
𝛿𝛿𝑡𝑡 = 1𝜎𝜎𝑡𝑡𝜋𝜋 (2)
Less disagreement among forecasters reflects higher central bank credibility. In other words, credibility rises when inflation becomes more predictable by agents. A more credible central bank makes inflation easier to forecast. Conceptually, it is of course possible that inflation expectations can be well-anchored at levels that are much higher than the official target range. In such as context, the index would not be a good indicator of monetary credibility.5
Beyond the above baseline measure of monetary policy credibility, we explore two more measures. First, we examine the divergence between the central bank’s inflation target and actual observations. Second, we look at the divergence between the central bank’s inflation forecasts and those of the consensus from the Reuters survey.
Dovern, Fritsche, and Slacalek (2012) find that central bank credibility is explained by the level of inflation, inflation volatility, and uncertainty about monetary policy. This yields the following expression:
𝛿𝛿𝑡𝑡 = 𝛼𝛼0 + 𝛼𝛼1𝜋𝜋𝑡𝑡 + 𝛼𝛼2ℎ𝑡𝑡𝜋𝜋 + 𝛼𝛼3∆𝑖𝑖𝑡𝑡2 + 𝛼𝛼4𝑦𝑦𝑡𝑡 + 𝜀𝜀𝑡𝑡 (3)
where 𝜋𝜋𝑡𝑡 is the annual headline inflation rate, ℎ𝑡𝑡𝜋𝜋 is the permanent shock to inflation, ∆𝑖𝑖𝑡𝑡2 the uncertainty about monetary policy represented by the squared change in the interest rate, and 𝑦𝑦𝑡𝑡 the output gap obtained constructed by Anvari et al. (2014).
It is worth noting that the causality moves from these explanatory variables to disagreement among agents, and not the other way around. Periods of higher inflation tend to have a negative impact on central bank credibility, whereas low inflation improves it. We therefore expect a negative relation between the central bank credibility and inflation. Credibility of the central bank decreases with a rise in uncertainty about inflation. Finally, uncertainty about monetary policy affects the credibility of the central bank negatively. The central bank faces the tradeoff between being activist in its monetary policy stance—especially in a country hit by large and/or frequent shocks—or being more passive. In the latter case, policy
5 Fortunately, that is not the case in South Africa.
9

uncertainty would be minimized, but at the cost of greater inflation volatility. All in all, we expect all coefficients (except 𝛼𝛼3) to be negative.
From equation (3), we need to estimate the permanent shock to inflation, ℎ𝑡𝑡𝜋𝜋. We follow closely Chan, Koop, and Potter (2013) to estimate the permanent shock to inflation based on unobserved components stochastic volatility (UCSV) framework similar to Stock and Watson (2007). The main difference with the latter authors is that Chan, Koop, and Potter (2013) use the bounded random walk model which allows for the trend inflation to vary within a certain bound which consistent with the inflation objective of the central bank. In this case the band is set between 3 and 6 percent (the inflation target range for the SARB). Mathematically, the inflation gap can be expressed as a first-order autoregressive process of the form:
(𝜋𝜋𝑡𝑡 − 𝜏𝜏𝑡𝑡) = 𝜌𝜌𝑡𝑡(𝜋𝜋𝑡𝑡−1 − 𝜏𝜏𝑡𝑡−1) + 𝜖𝜖𝑡𝑡𝑒𝑒𝑒𝑒𝑒𝑒 �ℎ𝑡𝑡2� (4)
Where:
𝜏𝜏𝑡𝑡 = 𝜏𝜏𝑡𝑡−1 + 𝜖𝜖𝑡𝑡𝜏𝜏 (5)
ℎ𝑡𝑡 = ℎ𝑡𝑡−1 + 𝜖𝜖𝑡𝑡ℎ (6)
𝜌𝜌𝑡𝑡 = 𝜌𝜌𝑡𝑡−1 + 𝜖𝜖𝑡𝑡𝜌𝜌 (7)
where 𝜖𝜖𝑡𝑡~𝑁𝑁(0,1) and 𝜖𝜖𝑡𝑡ℎ~𝑁𝑁(0,𝜎𝜎ℎ2), 𝜏𝜏𝑡𝑡 is the trend inflation, which implies that (𝜋𝜋𝑡𝑡 − 𝜏𝜏𝑡𝑡) is the inflation gap, 𝜌𝜌𝑡𝑡 is inflation persistence, and ℎ𝑡𝑡 is the unobserved component stochastic volatility.
Like Chan, Koop, and Potter (2013), we assume the innovation of the bounded trend inflation has the following form:
𝜖𝜖𝑡𝑡𝜏𝜏~𝑇𝑇𝑁𝑁(𝑎𝑎 − 𝜏𝜏𝑡𝑡−1, 𝑏𝑏 − 𝜏𝜏𝑡𝑡−1; 𝜎𝜎𝜏𝜏2) (8)
where 𝑎𝑎 and 𝑏𝑏 are respectively the lower and the upper bound of the target band, T is the number of observations, and N is the number of explanatory variables.
This framework allows the trend inflation to gravitate within the constructed inflation band. Notice that this model is nested in Kabundi, Schaling, and Some (2016) in that the coefficient of the unemployment gap is set to be 0.6
We use the second-stage exchange rate pass-through (ERPT) estimation of Kabundi and Mbelu (2018) based on rolling-window regression as dependent variable of the pass-through model.
6 The time-varying Phillips curve of Kabundi, Schaling, and Some (2018) is (𝜋𝜋𝑡𝑡 − 𝜏𝜏𝑡𝑡) = 𝜌𝜌𝑡𝑡(𝜋𝜋𝑡𝑡−1 − 𝜏𝜏𝑡𝑡−1) +𝛼𝛼𝑡𝑡(𝑢𝑢𝑡𝑡 + 𝑢𝑢𝑡𝑡𝑛𝑛) + 𝜖𝜖𝑡𝑡𝑒𝑒𝑒𝑒𝑒𝑒 �
ℎ𝑡𝑡2�, where 𝑢𝑢𝑡𝑡 is the unemployment rate and 𝑢𝑢𝑡𝑡𝑛𝑛 the trend in the unemployment which follows a
random walk process, and 𝛼𝛼𝑡𝑡 is the slope of the Phillips curve. It is clear that this Phillips becomes equation (4) if 𝛼𝛼𝑡𝑡 = 0.
10

𝛾𝛾𝑡𝑡 = 𝛽𝛽0 + 𝛽𝛽1𝛿𝛿𝑡𝑡 + 𝜔𝜔′𝑍𝑍𝑡𝑡 + 𝜉𝜉𝑡𝑡 (9)
Where 𝛾𝛾𝑡𝑡 is second-stage exchange rate pass-through, and 𝑍𝑍𝑡𝑡 is a matrix of control variables. Carrière-Swallow et al. (2016) use the mean of inflation, the standard deviation of inflation, mean of nominal effective exchange rate, standard deviation of nominal effective exchange rate, and standard deviation of short-term forecasts as control variables. However, equation (3) includes the level of inflation and the variance of inflation. This suggests that having these variables again in equation (9) leads to multicollinearity. Hence, our model assumes 𝑍𝑍𝑡𝑡 = 0.
The time-varying parameters first-stage exchange rate pass-through are as follows:
𝑖𝑖𝑒𝑒𝑖𝑖𝑡𝑡 = 𝜅𝜅𝑡𝑡 + 𝜄𝜄𝑡𝑡𝑓𝑓𝑓𝑓𝑒𝑒𝑖𝑖𝑡𝑡 − 𝜃𝜃𝑡𝑡𝑛𝑛𝑒𝑒𝑒𝑒𝑛𝑛𝑡𝑡 + 𝜐𝜐𝑡𝑡 (10)
where κ, ι, and θ are coefficients; ipi, fwpi and neer represent logarithms of the domestic import price, the foreign wholesale price, and the nominal effective exchange rate, respectively. 𝜐𝜐𝑡𝑡 is the error term.
It follows that the import prices in (10) enter the second-stage expression as an independent variable. The second-stage exchange rate pass-through is based on the markup model of inflation where consumer inflation depends on import prices and unit labor costs (ulc). Hence, we obtain the following expression:
𝑐𝑐𝑒𝑒𝑖𝑖𝑡𝑡 = 𝜗𝜗𝑡𝑡 + 𝜑𝜑𝑡𝑡𝑢𝑢𝑢𝑢𝑐𝑐𝑡𝑡 + 𝛾𝛾𝑡𝑡𝑖𝑖𝑒𝑒𝑖𝑖𝑡𝑡 + 𝜒𝜒𝑡𝑡 (11)
where 𝜗𝜗, 𝜑𝜑, and 𝛾𝛾 are coefficients; cpi, ulc, and ipi are logarithms of the consumer price index, the unit labour cost, and the imported price index, respectively. 𝜒𝜒𝑡𝑡 is the error term.
IV. EMPIRICAL STRATEGY AND FINDINGS
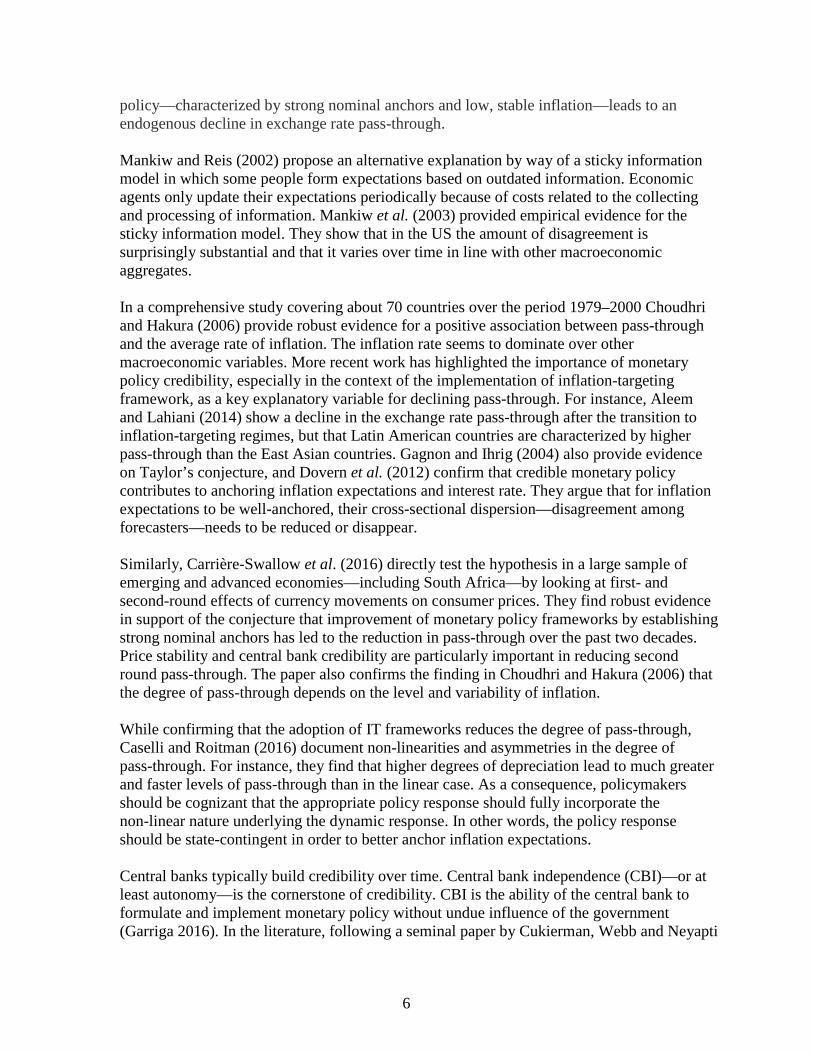
Following Kabundi and Mbelu (2018), we use quarterly data from South Africa, observed from 1980Q1 to 2015Q2 to obtain the time-varying ERPT based on a 10-year rolling window regression, specified in equations (10) and (11). Figure 2 depicts the extracted ERPT which shows a considerable decline from 50 percent in 1998 to 20 percent in 2002.7 Ever since the EPRT has been roughly stable between 20 percent and 30 percent. These authors attributed the decline in the ERPT to change in monetary policy, namely the adoption of inflation rate targeting (IT) as the basis of monetary policy. This paper intends to delve deeper by analyzing what actually makes the IT framework more credible, especially by lowering the pass-through.
7 It should be noted that the 1980s and early 1990s were marked by high domestically-driven inflation mainly due to a weak monetary stance characterized by high growth in broad money supply, rather than imported inflation from major trading partners who experienced a disinflation during the same period (Figure A3). As a result, there was low pass-through. This consistent with the findings of Jooste and Jhaveri (2014) who use a time-varying VAR approach and confirmed by Ricci (2005).
11
We construct the measure of forecast disagreement from Reuters’ survey on inflation, which is only available from 2002Q2. Reuters conducts a survey each month of professional forecasters about the state of the economy. The number of respondents was about 13 at the beginning of the sample, and reached a maximum of 25 respondents in September 2014. The starting point of the sample restricts the analysis to the post-IT period. However, for the pre-IT period we use measure of monetary policy credibility based on forecasting disagreement constructed by Redl (2015).8
Figure 2. Time-Varying Exchange Rate Pass-Through
Source: Kabundi and Mbelu (2018).
Determinants of Monetary Policy Credibility
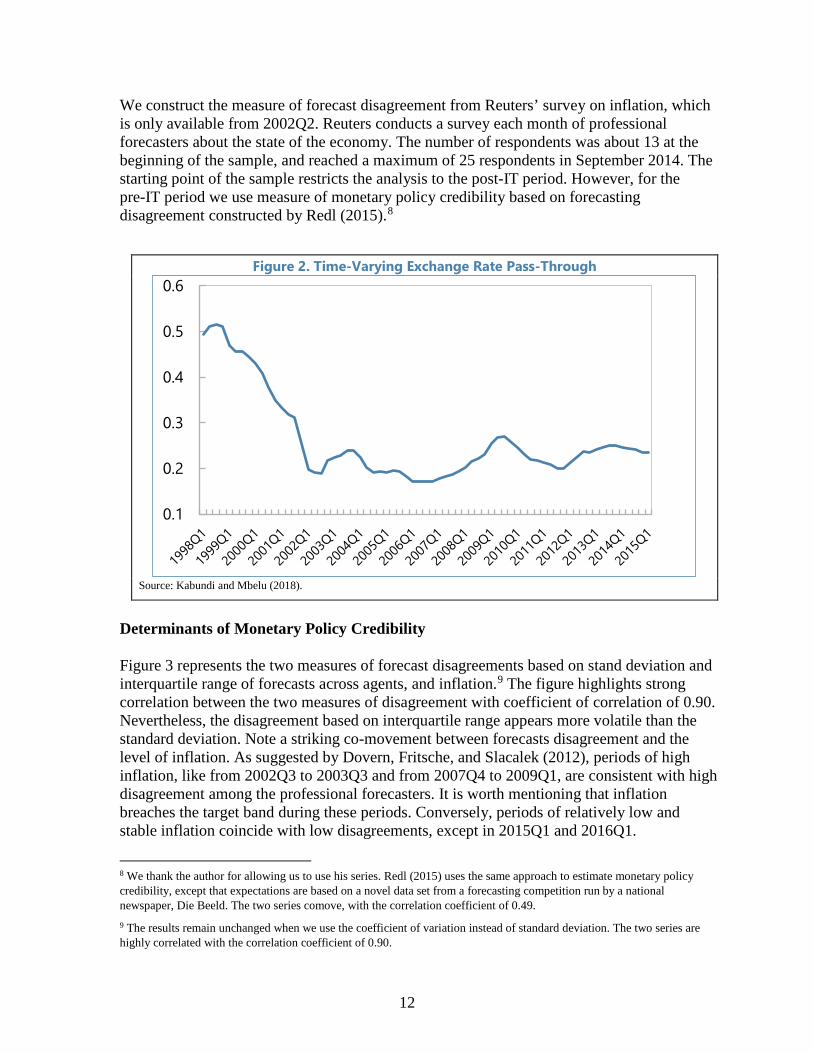
Figure 3 represents the two measures of forecast disagreements based on stand deviation and interquartile range of forecasts across agents, and inflation.9 The figure highlights strong correlation between the two measures of disagreement with coefficient of correlation of 0.90. Nevertheless, the disagreement based on interquartile range appears more volatile than the standard deviation. Note a striking co-movement between forecasts disagreement and the level of inflation. As suggested by Dovern, Fritsche, and Slacalek (2012), periods of high inflation, like from 2002Q3 to 2003Q3 and from 2007Q4 to 2009Q1, are consistent with high disagreement among the professional forecasters. It is worth mentioning that inflation breaches the target band during these periods. Conversely, periods of relatively low and stable inflation coincide with low disagreements, except in 2015Q1 and 2016Q1.
8 We thank the author for allowing us to use his series. Redl (2015) uses the same approach to estimate monetary policy credibility, except that expectations are based on a novel data set from a forecasting competition run by a national newspaper, Die Beeld. The two series comove, with the correlation coefficient of 0.49. 9 The results remain unchanged when we use the coefficient of variation instead of standard deviation. The two series are highly correlated with the correlation coefficient of 0.90.
0.1
0.2
0.3
0.4
0.5
0.6
12
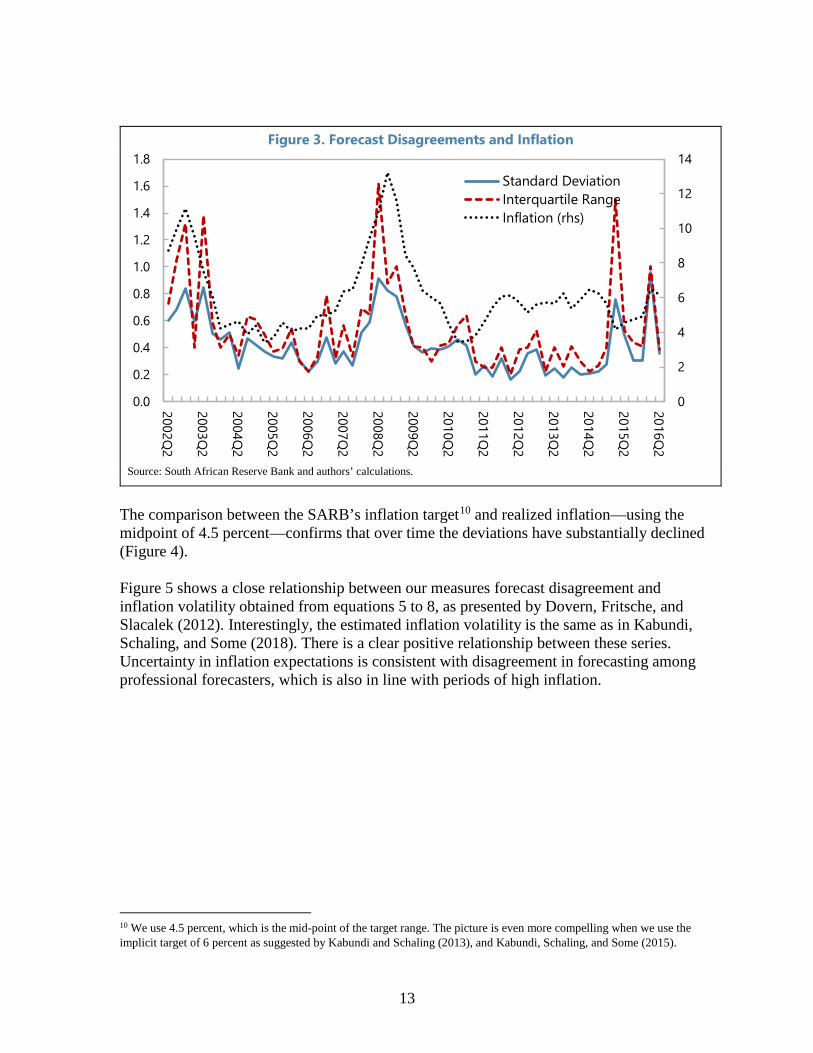
Figure 3. Forecast Disagreements and Inflation
Source: South African Reserve Bank and authors’ calculations.
The comparison between the SARB’s inflation target10 and realized inflation—using the midpoint of 4.5 percent—confirms that over time the deviations have substantially declined (Figure 4).
Figure 5 shows a close relationship between our measures forecast disagreement and inflation volatility obtained from equations 5 to 8, as presented by Dovern, Fritsche, and Slacalek (2012). Interestingly, the estimated inflation volatility is the same as in Kabundi, Schaling, and Some (2018). There is a clear positive relationship between these series. Uncertainty in inflation expectations is consistent with disagreement in forecasting among professional forecasters, which is also in line with periods of high inflation.
10 We use 4.5 percent, which is the mid-point of the target range. The picture is even more compelling when we use the implicit target of 6 percent as suggested by Kabundi and Schaling (2013), and Kabundi, Schaling, and Some (2015).
0
2
4
6
8
10
12
14
0.0
0.2
0.4
0.6
0.8
1.0
1.2
1.4
1.6
1.8
2002Q2
2003Q2
2004Q2
2005Q2
2006Q2
2007Q2
2008Q2
2009Q2
2010Q2
2011Q2
2012Q2
2013Q2
2014Q2
2015Q2
2016Q2
Standard DeviationInterquartile RangeInflation (rhs)
13

Figure 4. Deviation of Realized Inflation from Inflation Target (4.5. percent)
Source: Authors’ calculations.
Ball (1992) provides theoretical basis of empirical evidence of the link between the level of inflation and inflation uncertainty found by Ball and Cecchetti (1990), Cukierman and Meltzer (1986), and Devreux (1989). He argues that a rise in inflation raises uncertainty about future inflation because high inflation puts policymakers in a dilemma of either to accommodate the real economy and keep inflation high or to disinflate and face recession. Hence, agents are unsure about the preference of policymakers, which in turn generates disagreement in their forecasts. Even though inflation volatility is trending upward since 2014, the two spikes towards the end are outliers.
Istrefi and Piloiu (2014) show how monetary policy uncertainty affects both short- and long-term inflation expectations. Short-term inflation declines following a rise in monetary policy uncertainty, whereas long-term expectations tend to increase. These findings are consistent with the gradualist approach of monetary policy. Since macroeconomic variables are released with delay, policymakers do not have all information concerning the state of the economy when they make decisions. Hence, it is preferable to act less aggressively rather than following the so-called “cold turkey” approach. In so doing, the policy rate is smooth and less volatile. The opposite approach might result in severe effects in the real economy than intended.
-2-1012345678
2000Q4 2003Q3 2006Q2 2009Q1 2011Q4 2014Q3 2017Q2
π-4.5
14
Figure 5. Forecast Disagreements and Inflation Volatility
Source: South African Reserve Bank and authors’ calculations.
Figure 6 reveals periods of monetary policy uncertainty are also linked with instances of forecast disagreements. The two spikes observed in 2003–2004 and 2009 represent, respectively, the aggressive monetary policy followed by the SARB to curb inflation and deal with risk of recession caused by the GFC. From March to September 2002, the SARB hiked its policy rate (repo rate) by 300 basis points, and then reversed it by a 500 basis point cut from June to October 2003. Similarly, it decreased the repo rate by 500 basis points from December 2008 to August 2009. Besides these two outliers, the uncertainty about monetary policy has been low, which suggests that in general monetary policy has been smooth.
-1.2
-1.0
-0.8
-0.6
-0.4
-0.2
0.0
0.2
0.4
0.6
0.8
0.0
0.2
0.4
0.6
0.8
1.0
1.2
1.4
1.6
1.8
2002Q2
2003Q2
2004Q2
2005Q2
2006Q2
2007Q2
2008Q2
2009Q2
2010Q2
2011Q2
2012Q2
2013Q2
2014Q2
2015Q2
Standard DeviationInterquartile RangeInflation Volatility (rhs)
15

Figure 6. Forecast Disagreements and Squared Change in the Repo Rate
Sources: South African Reserve Bank and authors’ calculations.
Interestingly, the latter period of low inflation volatility, relatively stable inflation, low uncertainty about monetary policy, and low disagreement among forecasters coincide with periods of stable inflation expectations across all market participants (see Figure 7).11 Unlike Kabundi and Schaling (2013) and Kabundi, Schaling, and Some (2015), who find evidence that inflation expectations in South Africa are mainly adaptive, Figure 7 shows that this is true only from 2001 to 2009. However, from 2009 all three groups of agents are forward-looking, albeit with expectations closer to the upper bound of the official target band of 3 to 6 percent. It suggests an increase in monetary policy credibility. Note that the decline in inflation in 2004 to 2006 was followed by a decrease in expectations of all agents. However, expectations remain anchored at 6 percent even after a decrease from 6.4 percent in 2014Q2 to 4.1 percent in 2015Q2.
If we base the comparisons on core inflation, a similar outcome emerges (Figure A.2).
11 Figure 5 uses the two-year ahead inflation expectations survey data obtained from the Bureau of Economic Research. The variable “Total” refers to the simple average of expectations by different agents.
0
2
4
6
8
10
12
14
16
0.0
0.2
0.4
0.6
0.8
1.0
1.2
1.4
1.6
1.8
2002Q3
2003Q3
2004Q3
2005Q3
2006Q3
2007Q3
2008Q3
2009Q3
2010Q3
2011Q3
2012Q3
2013Q3
2014Q3
2015Q3Standard DeviationInterquartile RangeSquared Change Repo (rhs)repo
16

Figure 7. Inflation and Inflation Expectations
Source: Reuters and authors’ calculations.
Like Kabundi and Schaling (2013) and Kabundi, Schaling, and Some (2015), we assume the inflation expectations is a weighted average of past inflation and the inflation target:
𝜋𝜋𝑡𝑡𝑒𝑒 = 𝜌𝜌𝜋𝜋𝑡𝑡−1 + (1 − 𝜌𝜌)𝜋𝜋∗ + 𝜀𝜀𝑡𝑡 (12)
where 𝜋𝜋𝑡𝑡𝑒𝑒 is inflation expectations, 𝜋𝜋𝑡𝑡−1 is the lagged inflation, and 𝜋𝜋∗ is the inflation target set at 6 percent, 𝜀𝜀𝑡𝑡 is an iid error term with zero mean and constant variance.
This approach is commonly used in the literature, starting with King (1996). The same framework is used by Schaling and Hoeberichts (2010), Stock and Watson (2007); and Matheson and Stavrev (2013).
Tables 1 and 2 illustrate econometrically the observations in Figure 5. Unlike Kabundi and Schaling (2013) and Kabundi, Schaling, and Some (2015) who estimate Equation (12) using the full sample, we divide the sample into two, namely, before 2009 and after 2009. Table 1 depicts the results based on the estimation before 2009. In general, agents are somewhat backward looking since the coefficients of lagged inflation are statically significant 1 percent, except for the analysts where the coefficient is significant at 5 percent. These results are in line with Kabundi and Schaling (2013) and Kabundi, Schaling, and Some (2015).
Consistent with Figure 5, the expectations of analysts are well-anchored within the target band, and they are relatively flat, which suggests that they more forward looking. However, expectations of businesses and trade unions are backward looking. Notice that we do control for an autoregressive component to account for dynamic structure in expectations formation.
2
4
6
8
10
12
14
2001Q2
2002Q2
2003Q2
2004Q2
2005Q2
2006Q2
2007Q2
2008Q2
2009Q2
2010Q2
2011Q2
2012Q2
2013Q2
2014Q2
2015Q2
2016Q2
2017Q2
InflationTotalAnalystsBusinessTrade Unions
17

Interestingly, the results in Table 2 show a completely different picture. Expect for the analysts where the coefficient of the lagged inflation is significant at 10 percent, all other coefficients of lagged inflation are not different from zero. Consistent with our observation in Figure 5, all agents are forward-looking since 2009, with their expectations anchored at 6 percent. Wald test does not reject the hypothesis of coefficient of the target being one. Hence, central bank has significantly improved credibility since 2009.
Table 1. Inflation Expectations: Pre-2009
Total Analyst Business Trade Union Lagged Inflation 0.275*** 0.098** 0.306*** 0.452***
(0.072) (0.045) (0.087) (0.102) Target (6) 0.725*** 0.902*** 0.694*** 0.548***
(0.072) (0.045) (0.087) (0.102) AR(1) 0.771*** 0.927*** 0.780*** 0.594***
(0.120) (0.054) (0.119) (0.156) N 32 32 32 32 Adj R2 ARCH Heteroskedasticity D-W statistic
0.834 0.883 2.022
0.677 0.673 2.484
0.833 0.850 1.918
0.766 0.973 1.798
Note: ***p < 0.01 and **p < 0.05. Robust standard errors are in parentheses.
Table 2. Inflation Expectations: Post-2009Total Analyst Business Trade Union
Lagged Inflation -0.024 0.066* -0.087 -0.098 (0.055) (0.039) (0.087) (0.091)
Target (6) 1.024*** 0.934*** 1.087*** 1.098*** (0.055) (0.039) (0.087) (0.091)
AR(1) 0.732*** 0.947*** 0.828*** 0.619*** (0.063) (0.038) (0.062) (0.061)
N 33 33 33 33 Adj R2 ARCH Heteroskedasticity D-W statistic
0.820 0.025 2.730
0.361 0.716 1.805
0.772 0.047 2.276
0.725 0.254 2.608
Note: ***p < 0.01 and *p < 0.1. Robust standard errors are in parentheses.
Figure 8 illustrates the countercyclicality of disagreement about inflation. The negative output gap at the beginning of the sample is matched with a rise in disagreement across agents. Disagreement about inflation is low and stable when the economy experienced an economic boom, represented here by a substantial rise in the output gap above potential from 2003 to 2008. The global financial crisis, which resulted in the decline in global trade, put a downward pressure on the South African economy, leading to a sharp drop in the output gap, while at the same time the disagreement attained at its peak. Similarly, the two
18
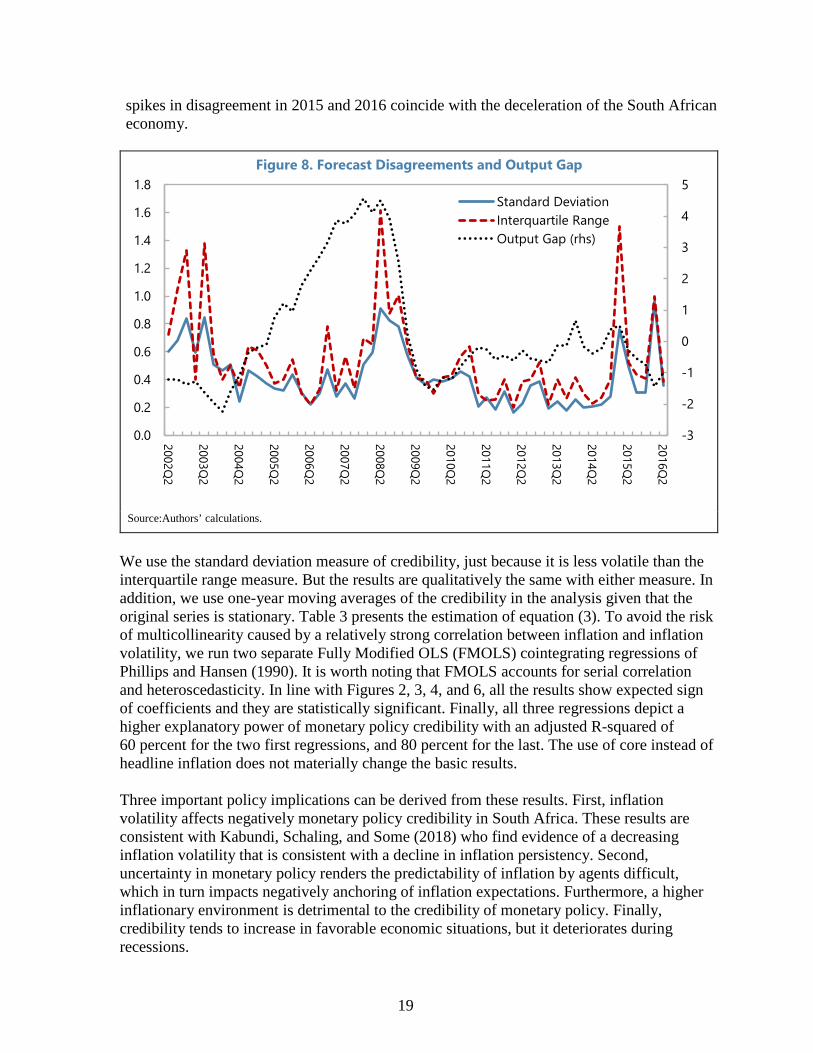
spikes in disagreement in 2015 and 2016 coincide with the deceleration of the South African economy.
Figure 8. Forecast Disagreements and Output Gap
Source:Authors’ calculations.
We use the standard deviation measure of credibility, just because it is less volatile than the interquartile range measure. But the results are qualitatively the same with either measure. In addition, we use one-year moving averages of the credibility in the analysis given that the original series is stationary. Table 3 presents the estimation of equation (3). To avoid the risk of multicollinearity caused by a relatively strong correlation between inflation and inflation volatility, we run two separate Fully Modified OLS (FMOLS) cointegrating regressions of Phillips and Hansen (1990). It is worth noting that FMOLS accounts for serial correlation and heteroscedasticity. In line with Figures 2, 3, 4, and 6, all the results show expected sign of coefficients and they are statistically significant. Finally, all three regressions depict a higher explanatory power of monetary policy credibility with an adjusted R-squared of 60 percent for the two first regressions, and 80 percent for the last. The use of core instead of headline inflation does not materially change the basic results.
Three important policy implications can be derived from these results. First, inflation volatility affects negatively monetary policy credibility in South Africa. These results are consistent with Kabundi, Schaling, and Some (2018) who find evidence of a decreasing inflation volatility that is consistent with a decline in inflation persistency. Second, uncertainty in monetary policy renders the predictability of inflation by agents difficult, which in turn impacts negatively anchoring of inflation expectations. Furthermore, a higher inflationary environment is detrimental to the credibility of monetary policy. Finally, credibility tends to increase in favorable economic situations, but it deteriorates during recessions.
-3
-2
-1
0
1
2
3
4
5
0.0
0.2
0.4
0.6
0.8
1.0
1.2
1.4
1.6
1.8
2002Q2
2003Q2
2004Q2
2005Q2
2006Q2
2007Q2
2008Q2
2009Q2
2010Q2
2011Q2
2012Q2
2013Q2
2014Q2
2015Q2
2016Q2
Standard DeviationInterquartile RangeOutput Gap (rhs)
19
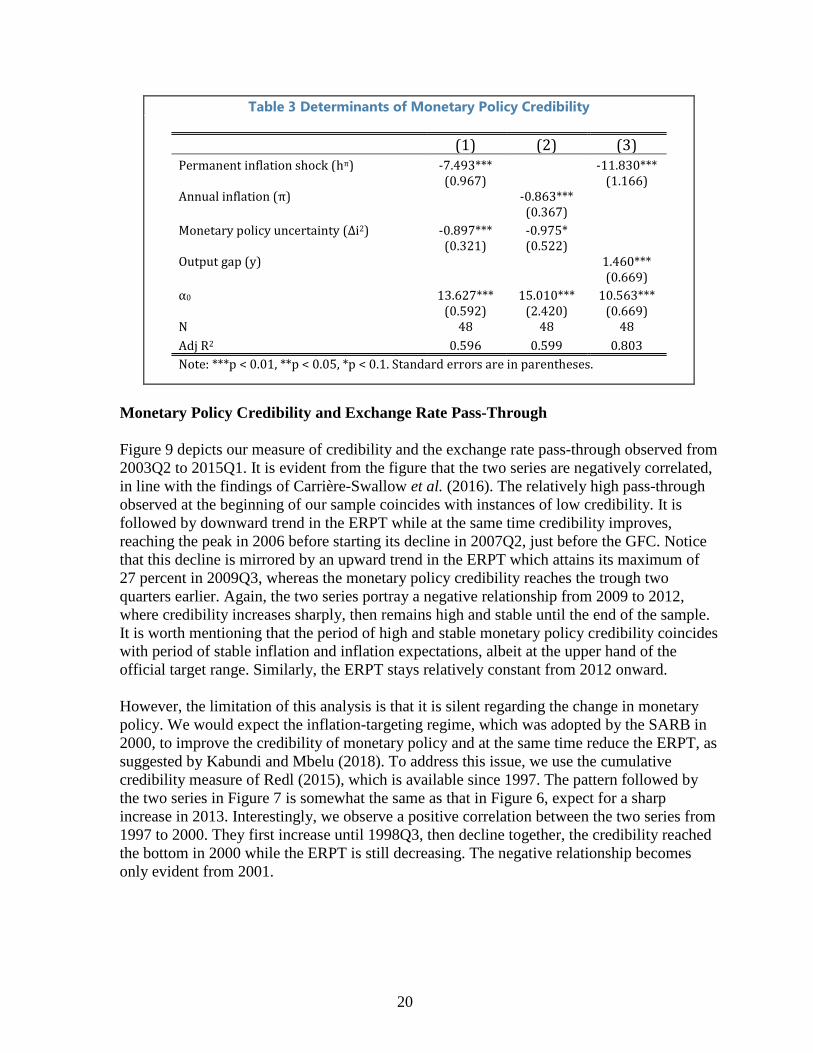
Table 3 Determinants of Monetary Policy Credibility
(1) (2) (3) Permanent inflation shock (hπ) -7.493*** -11.830***
(0.967) (1.166) Annual inflation (π) -0.863***
(0.367) Monetary policy uncertainty (Δi2) -0.897*** -0.975*
(0.321) (0.522) Output gap (y) 1.460***
(0.669) α0 13.627*** 15.010*** 10.563***
(0.592) (2.420) (0.669) N 48 48 48 Adj R2 0.596 0.599 0.803 Note: ***p < 0.01, **p < 0.05, *p < 0.1. Standard errors are in parentheses.
Monetary Policy Credibility and Exchange Rate Pass-Through
Figure 9 depicts our measure of credibility and the exchange rate pass-through observed from 2003Q2 to 2015Q1. It is evident from the figure that the two series are negatively correlated, in line with the findings of Carrière-Swallow et al. (2016). The relatively high pass-through observed at the beginning of our sample coincides with instances of low credibility. It is followed by downward trend in the ERPT while at the same time credibility improves, reaching the peak in 2006 before starting its decline in 2007Q2, just before the GFC. Notice that this decline is mirrored by an upward trend in the ERPT which attains its maximum of 27 percent in 2009Q3, whereas the monetary policy credibility reaches the trough two quarters earlier. Again, the two series portray a negative relationship from 2009 to 2012, where credibility increases sharply, then remains high and stable until the end of the sample. It is worth mentioning that the period of high and stable monetary policy credibility coincides with period of stable inflation and inflation expectations, albeit at the upper hand of the official target range. Similarly, the ERPT stays relatively constant from 2012 onward.
However, the limitation of this analysis is that it is silent regarding the change in monetary policy. We would expect the inflation-targeting regime, which was adopted by the SARB in 2000, to improve the credibility of monetary policy and at the same time reduce the ERPT, as suggested by Kabundi and Mbelu (2018). To address this issue, we use the cumulative credibility measure of Redl (2015), which is available since 1997. The pattern followed by the two series in Figure 7 is somewhat the same as that in Figure 6, expect for a sharp increase in 2013. Interestingly, we observe a positive correlation between the two series from 1997 to 2000. They first increase until 1998Q3, then decline together, the credibility reached the bottom in 2000 while the ERPT is still decreasing. The negative relationship becomes only evident from 2001.
20

Figure 9. Cumulative Credibility and Exchange Rate Pass-Through
Figure 10. Cumulative Credibility of Redl and Exchange Rate Pass-Through
Sources: Kabundi and Mbelu (2018) and authors’ calculations.
0
5
10
15
20
25
0.00
0.05
0.10
0.15
0.20
0.25
0.30
2003Q3
2004Q3
2005Q3
2006Q3
2007Q3
2008Q3
2009Q3
2010Q3
2011Q3
2012Q3
2013Q3
2014Q3
ERPTCredibility (rhs)
0
5
10
15
20
25
30
35
40
0.0
0.1
0.2
0.3
0.4
0.5
0.6
1997Q1
1998Q1
1999Q1
2000Q1
2001Q1
2002Q1
2003Q1
2004Q1
2005Q1
2006Q1
2007Q1
2008Q1
2009Q1
2010Q1
2011Q1
2012Q1
2013Q1
2014Q1
ERPT
Credibility (rhs)
21

The visual observation from Figures 9 and 10 is even clearer from results obtained in Table 4. Table 4 is based on the estimation of equation (9).12 Regression (1) is based on ourmeasure of credibility. Because of restrictions associated with data availability, the estimation includes only data from 2003Q2 to 2015Q1. While we use Redl’s credibility measure in regressions (2) and (3). The difference between the two last estimations is that (2) uses the entire sample, that is, from 1997 to 2014, whereas (3) is based on a short sample to account from change in the nature of relationship as discussed above. Hence, estimation (3) uses data from 2001 to 2014.
The results confirm the graphical observation of negative relationship between the two variables in (1). Notice that the coefficient is statistically significant at 1 percent level, and the explanatory power is quite high, with the R2 of 64 percent. However, using the sample from 1997, credibility does not explain movement in the ERPT. But recall that there is a positive relationship at the beginning of the sample, which is somewhat misleading. Regression (3) confirms the notion of changing relationship between monetary policy credibility and the ERPT.
The decline in credibility after 2007 is echoed by a remarkable surge in inflation. Like Figures 9 and 10, the two-series rally again from 2009 to the end of the sample. This last upward trend coincides with stability observed in inflation expectations, as depicted in Figure 5. Notice that the two series move closely together until 2011, then the measure of credibilitybased on expectations of the trade unions became steeper than that of businesses. Regression (1) uses the credibility measure of businesses whereas we use the credibility of trade unions in estimation (2). It is worth mentioning that credibility of business explains the movement in the ERPT, but the coefficient is statistically insignificant for the trade unions. This is mainly caused by the steeper rise in the credibility of the latter group from 2011. The coefficient moves from -0.005 to -0.016, and becomes significant at 1 per cent, when we estimate the model until 2011.
Table 4. Credibility and Exchange Rate Pass-Through
(1) (2) (3) Monetary policy credibility index (δ) -0.004*** 0.004 -0.002**
(0.001) (0.003) (0.001)
β0 0.225*** 0.343*** 0.178*** (0.014) (0.051) (0.017)
N 47 71 47
R2 0.638 0.468 0.430
Note: ***p < 0.01 and **p < 0.05. Standard errors are in parentheses.
12 We use lagged credibility to account for possibility of endogeneity which might arise from the reaction of monetary policy credibility to changes in the ERPT.
22
V. ROBUSTNESS CHECKS
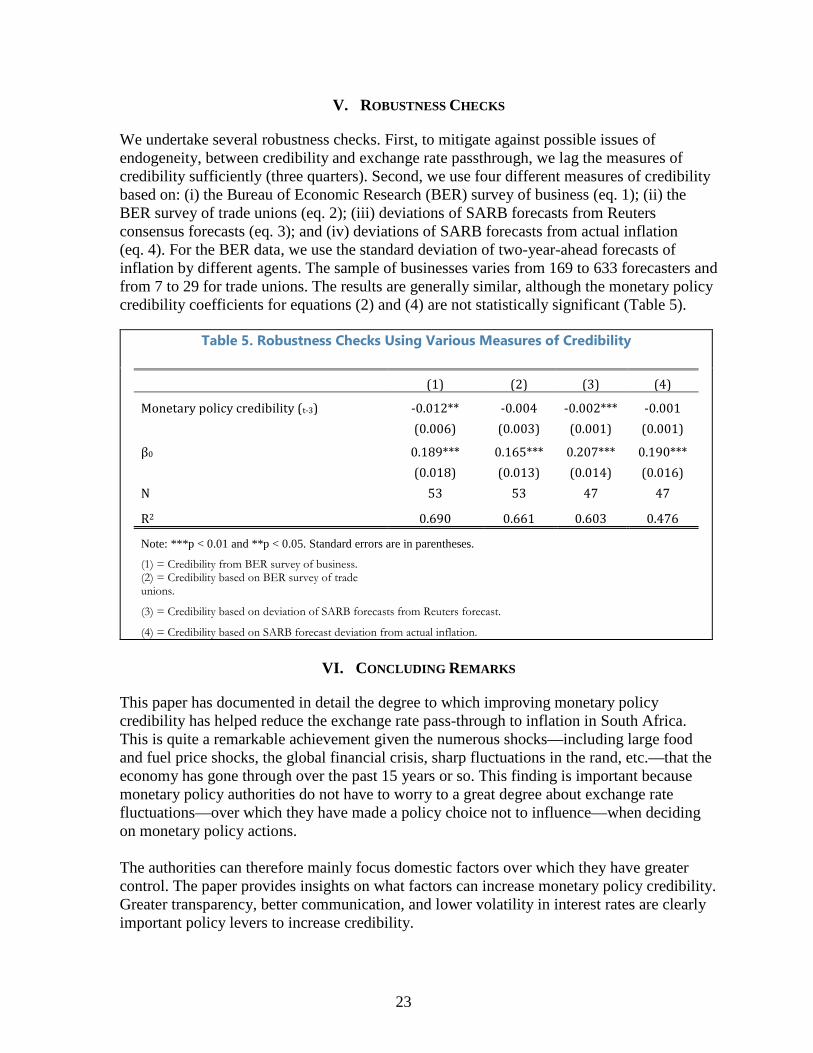
We undertake several robustness checks. First, to mitigate against possible issues of endogeneity, between credibility and exchange rate passthrough, we lag the measures of credibility sufficiently (three quarters). Second, we use four different measures of credibility based on: (i) the Bureau of Economic Research (BER) survey of business (eq. 1); (ii) the BER survey of trade unions (eq. 2); (iii) deviations of SARB forecasts from Reuters consensus forecasts (eq. 3); and (iv) deviations of SARB forecasts from actual inflation (eq. 4). For the BER data, we use the standard deviation of two-year-ahead forecasts of inflation by different agents. The sample of businesses varies from 169 to 633 forecasters and from 7 to 29 for trade unions. The results are generally similar, although the monetary policy credibility coefficients for equations (2) and (4) are not statistically significant (Table 5).
Table 5. Robustness Checks Using Various Measures of Credibility
(1) (2) (3) (4)
Monetary policy credibility (t-3) -0.012** -0.004 -0.002*** -0.001 (0.006) (0.003) (0.001) (0.001)
β0 0.189*** 0.165*** 0.207*** 0.190*** (0.018) (0.013) (0.014) (0.016)
N 53 53 47 47
R2 0.690 0.661 0.603 0.476
Note: ***p < 0.01 and **p < 0.05. Standard errors are in parentheses.
(1) = Credibility from BER survey of business. (2) = Credibility based on BER survey of trade unions.
(3) = Credibility based on deviation of SARB forecasts from Reuters forecast.
(4) = Credibility based on SARB forecast deviation from actual inflation.
VI. CONCLUDING REMARKS
This paper has documented in detail the degree to which improving monetary policy credibility has helped reduce the exchange rate pass-through to inflation in South Africa. This is quite a remarkable achievement given the numerous shocks—including large food and fuel price shocks, the global financial crisis, sharp fluctuations in the rand, etc.—that the economy has gone through over the past 15 years or so. This finding is important because monetary policy authorities do not have to worry to a great degree about exchange rate fluctuations—over which they have made a policy choice not to influence—when deciding on monetary policy actions.
The authorities can therefore mainly focus domestic factors over which they have greater control. The paper provides insights on what factors can increase monetary policy credibility. Greater transparency, better communication, and lower volatility in interest rates are clearly important policy levers to increase credibility.
23
One important issue that the paper does not deal with is the current policy debate in South Africa over lowering inflation expectations, which seem to be permanently stuck at the high end of the target range of 3–6 percent. Hitting the middle or lower end of the target has obvious advantages in improving external competitiveness since most of the country’s main trading partners have traditionally had lower inflation than South Africa. That said, it is uncertain whether improving monetary policy credibility alone would lower inflation expectations, or there is something more structural in nature. Some observers, like Klein (2011) and Fedderke et al. (2007), have conjectured that this may be related to the role played by market concentration in price formation, both among producers and trade unions. This is a worthy topic to investigate further.
24

Appendix
Figure A.1. Credibility Based on BER Survey Data
Source: BER survery and authors’ calculations.
Figure A.2. Core Inflation and Inflation Expectations
Source: BER survery and authors’ calculations.
0
2
4
6
8
10
12
14
2001Q2
2002Q2
2003Q2
2004Q2
2005Q2
2006Q2
2007Q2
2008Q2
2009Q2
2010Q2
2011Q2
2012Q2
2013Q2
2014Q2
2015Q2
Business
Unions
2
3
4
5
6
7
8
9
10
11
12
2001Q1
2002Q1
2003Q1
2004Q1
2005Q1
2006Q1
2007Q1
2008Q1
2009Q1
2010Q1
2011Q1
2012Q1
2013Q1
2014Q1
2015Q1
2016Q1
2017Q1
TotalAnalystsBusinessTrade UnionsCore Inflation
25
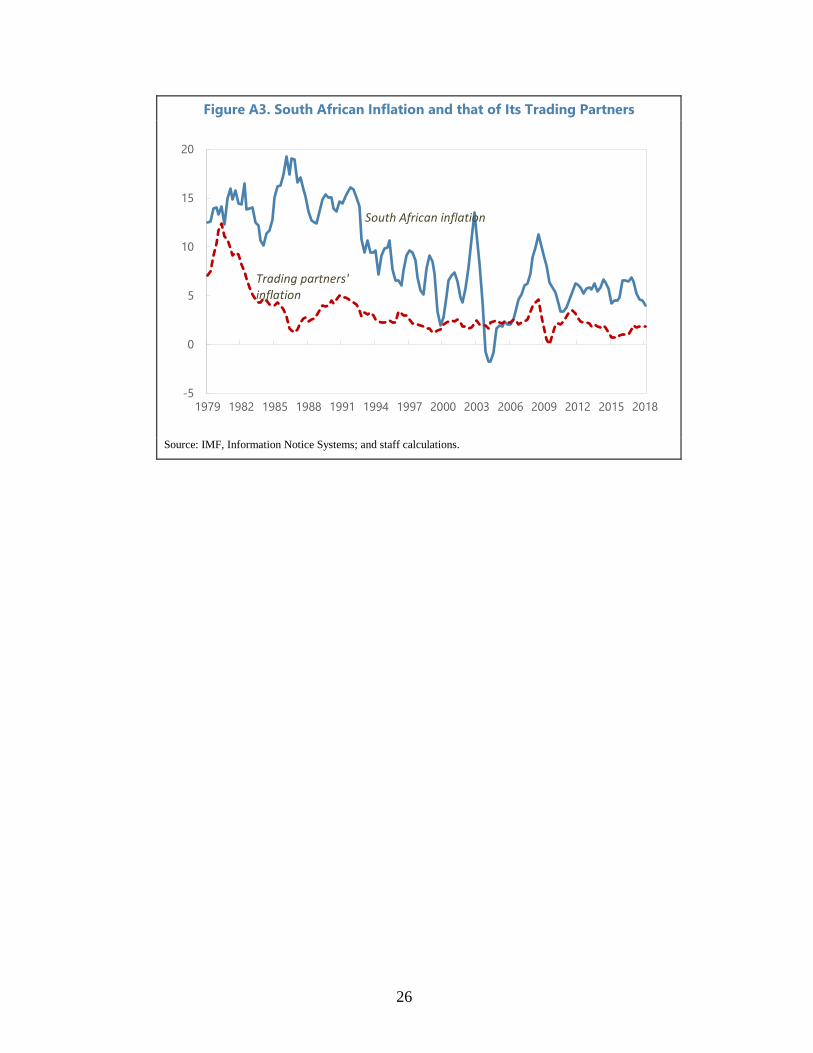
Figure A3. South African Inflation and that of Its Trading Partners
Source: IMF, Information Notice Systems; and staff calculations.
-5
0
5
10
15
20
1979 1982 1985 1988 1991 1994 1997 2000 2003 2006 2009 2012 2015 2018
South African inflation
Trading partners'inflation
26

References
Aleem, A. and A. Lahiani. 2014. “Monetary Policy Credibility and Exchange Rate Pass-Through: Some Evidence from Emerging Countries” Economic Modeling http://dx.doi.org/10.1016/j.econmod.2014.06.020
Aron, J., Farrell, G., Muellbauer, J., Sinclair, P. 2014. "Exchange rate pass-through to import prices, and monetary policy in South Africa," Journal of Development Studies, 50(1): 144–164.
Aron, J. and J . Muellbauer. 2007. “Review of Monetary Policy in South Africa,” Journal of African Economies, 16(5): 705–744.
Anvari, V., N. Elhers, and R. Steinbach. 2014. “A Semi-Structural Approach to Estimate South Africa’s Potential Output,” SARB Working Paper 14/08.
Ball, L. 1992. “Why Does High Inflation Raise Inflation Uncertainty?” Journal of Monetary Economics (29): 371–388.
Ball, L. and S. Cecchetti. 1990. “Inflation Uncertainty at Short and Long Horizons,” Brookings Papers on Economic Activity (1): 251–254.
Carrière-Swallow, Y., B. Gruss, N.E. Magud, and F. Valencia. 2016. Exchange Rate Pass-Through: First- vs. Second-Round Effects,” IMF Working Paper 16/240.
Casselli, F.G. and A. Roitman. 2016. “Non-Linear Exchange Rate Pass-Though in Emerging Markets,” IMF Working Paper 16/1.
Chan, J. C. C., G. Koop, and S. M. Potter. 2013. “A New Model of Trend Inflation,” Journal of Business and Economic Statistics, 31(1): 94–106.
Choudhri, E.U., and D.S. Hakura. 2006. “Exchange Rate Pass-Through to Domestic Prices: Does the Inflationary Environment Matter?” Journal of International Money and Finance, (25): 614–39.
Crowe, C. and E.E. Meade. 2008. “Central Bank Independence and Transparency: Evolution and Effectiveness,” IMF Working Paper 08/119.
Cukierman, A. and A. H. Meltzer. 1986. “A Theory of Ambiguity, Credibility, and Inflation under Discretion and Asymmetric Information,” Econometrica, 54(5): 1099–1128.
Cukierman, A., S. Webb, and B. Neyapti. 1992. “Measuring Independence of Central Banks and Its Effect on Policy Outcomes,” World Bank Economic Review, 6(3): 353–98.
Devereux, M. 1989. “A Positive Theory of Inflation and Inflation Variance,” Economic Inquiry, 27: 105–116.
27
Dincer N.N. and B. Eichengreen. 2014. “Central Bank Transparency and Independence: Updates and New Measure,” International Journal of Central Banking, 10(1): 189–259.
Dovern, J., U. Fritsche, J. Slacalek. 2012. “Disagreement Among Forecasters in G7 Countries”, The Review of Economics and Statistics, 94 (4): 1081–96.
Fedderke, J.W., Kularatne, C., and Mariotti, M. 2007. "Mark-up Pricing in South African Industry," Journal of African Economies, 16(1): 28–69.
Gagnon, J.E., and J. Ihrig. 2004. “Monetary Policy and Exchange Rate Pass-Through.” International Journal of Finance and Economics.
Gelos, G. and Y. Ustyugova.2017. Inflation Responses to Commodity Price Shocks – How and Why Co Countries Differ? Journal of International Money and Finance, (72): 28–47.
Istrefi, K. and A. Piloiu. 2014. “Economic Policy Uncertainty and Inflation Expectations,” Banque de France Working Papers 511.
Jooste, C., and Jhaveri, Y. 2014. "The Determinants of Time-Varying Exchange Rate Pass-through in South Africa," South African Journal of Economics, 82(4): 603–615.
Kabundi, A., and A. Mbelu. 2018. “Has the Exchange Rate Pass-Through Changed in South Africa”, forthcoming in South African Journal of Economics.
Kabundi, A., and E. Schaling. 2013. “Inflation and Inflation Expectations in South Africa: An Attempt at Explanation,” South African Journal of Economics, 81(3): 346–355.
Kabundi, A., E. Schaling, and M. Some. 2015. “Monetary Policy and Heterogeneous Inflation Expectations in South Africa,” Economic Modelling, (45): 109–117.
Kabundi, A., E. Schaling, and M. Some. 2018. “Estimating a Phillips Curve for South Africa: A Bounded Random Walk Approach,” forthcoming in International Journal of Central Banking.
King, M. 1996. “How Should Central Banks Reduce Inflation? Conceptual Issues.” Economic Review, Federal Reserve Bank of Kansas City, 81(4), 25.
Karoro, T.D., M.J., Aziakpono, and N. Cattaneo, 2009. "Exchange rate pass-through to import prices in South Africa: Is there asymmetry?" South African Journal of Economics, 77(3): 380–398.
Klein, N. 2011. "South Africa: The Capital Behavior of the Markups and its Implications for Monetary Policy," IMF Working Paper 11/204.
28
Mankiw, N.G., and R. Reis. 2002. “Sticky Information versus Sticky Prices: A Proposal to Replace the New Keynesian Phillips Curve,” Quarterly Journal of Economics 112 (4). 1295–1328.
Mankiw, N.G., R. Reis, and J. Wolfers. 2003. “Disagreement about Inflation Expectations”, NBER Macroeconomics Annual, Vol. 18.
Matheson, T., and E. Stavrev. 2013. "The Great Recession and the Inflation Puzzle," Economics Letters, (120): 468–472.
Parsley, D.C. 2010. "Exchange Rate Pass-through in South Africa: Panel Evidence from Individual Goods and Services," South African Reserve Bank, Working Paper 10/03.
Phillips, P., and B. Hansen. 1990. “Statistical Inference in Instrumental Variables Regression with I (1) Processes,” Review of Economic Studies, (57): 99–125.
Redl, C. 2015. “Macroeconomic Uncertainty in South Africa,” ERSA Working Paper 509.
Ricci, L.A. 2005. “Bringing Inflation under Control,” in M. Nowak and L.A. Ricci (eds). Post-Apartheid South Africa: The First Ten Years, Ch.12, IMF, Washington, DC.
Schaling, E., and M. Hoeberichts. 2010. “Why Speed Doesn’t Kill: Learning to Believe in Disinflation,” De Economist, 158(1), pp.23–42.
Siklos, P.L. 2008. “No Single Definition of Central Bank Independence is Right for All Countries,” European Journal of Political Economy,24: 302–16.
Stock, J. H., and M. W. Watson. 2007. “Why has U.S. Inflation Become Harder to Forecast?” Journal of Money Credit and Banking, 39: 3–33.
Weber, C.S. 2018. “Central Bank Transparency and Inflation (Volatility)—New Evidence,” International Economic Policy (15): 21–67.
29