South African Reserve Bank Occasional Paper Series and Publications/Attachments... · South African...
39
South African Reserve Bank Occasional Paper Series OP/17/01 Measuring shadow banking activities and exploring its interconnectedness with banks in South Africa Esti Kemp Authorised for distribution by Hendrik Nel December 2017 1. The author would like to thank staff from the South African Reserve Bank, the Financial Services Board and the National Treasury who provided insight and expertise that greatly assisted the research, especially Este Nagel, Dineo Mosime, Lourens Delport, Marius de Jongh and Shepherd Muzamba. Comments from Co-Pierre Georg (the Editor) and an anonymous reviewer at the ERSA Working Paper series are greatly appreciated.
-
Upload
truongphuc -
Category
Documents
-
view
223 -
download
0
Transcript of South African Reserve Bank Occasional Paper Series and Publications/Attachments... · South African...

1
South African Reserve Bank Occasional Paper Series
OP/17/01
Measuring shadow banking activities and exploring its interconnectedness with banks in South Africa
Esti Kemp
Authorised for distribution by Hendrik Nel
December 2017
1. The author would like to thank staff from the South African Reserve Bank, the Financial Services Board and the National Treasury who provided insight and expertise that greatly assisted the research, especially Este Nagel, Dineo Mosime, Lourens Delport, Marius de Jongh and Shepherd Muzamba. Comments from Co-Pierre Georg (the Editor) and an anonymous reviewer at the ERSA Working Paper series are greatly appreciated.
2
South African Reserve Bank Occasional Papers are written by staff members of the South African Reserve Bank and on occasion by consultants under the auspices of the Bank. The papers deal with topical issues and describe preliminary research findings. They are solely intended to elicit comments and stimulate debate. The views expressed in this Occasional Paper are those of the author(s) and do not necessarily represent those of the South African Reserve Bank or South African Reserve Bank policy. While every precaution is taken to ensure the accuracy of information, the South African Reserve Bank shall not be liable to any person for inaccurate information, omissions or opinions contained herein. South African Reserve Bank Occasional Papers are externally refereed. Information on South African Reserve Bank Occasional Papers can be found at http://www.resbank.co.za/Research/ResearchPapers/Pages/OccasionalPapers.aspx Enquiries Head: Research Department South African Reserve Bank P O Box 427 Pretoria 0001 Tel. no.: +27 12 313-3911
0861 12 SARB (0861 12 7272) © South African Reserve Bank All rights reserved. No part of this publication may be reproduced, stored in a retrieval system, or transmitted in any form or by any means without fully acknowledging the author(s) and this Occasional Paper as the source.

3
Measuring shadow banking activities and exploring its interconnectedness with banks in South Africa Esti Kemp1
Abstract
Shadow banking entities or activities and its interconnectedness with financial intermediaries raise important policy concerns. However, research in this area in South Africa remains limited. Accordingly this paper maps the financial landscape in South Africa, focusing on non-bank financial intermediaries as well as the narrower ‘shadow banking’ measure for South Africa, measured in line with guidance provided by the Financial Stability Board. The interconnectedness between financial intermediaries in South Africa is also explored and key financial stability risks in the South African financial system are highlighted. One of the most notable risks currently is the lack of data. Whilst the shadow banking system in South Africa remains relatively small when compared to global peers, its assets under management are growing at a faster pace than those of banks. Furthermore, banks in South Africa obtain a relatively large portion of their funding from non-bank financial intermediaries and generally interconnectedness among financial intermediaries in South Africa is relatively high.
1 The author would like to thank staff from the South African Reserve Bank, the Financial Services Board and the National Treasury for helpful discussions and comments, especially Este Nagel, Dineo Mosime, Lourens Delport, Marius de Jongh and Shepherd Muzamba.

4
1. Introduction Shadow banking, a term first used by Paul McCulley in 2007 (PIMCO, 2007), entails formal and informal lending activities, generally outside of the regular banking sector.2 Even though these entities conduct activities that involves risks similar to those of a bank, including credit intermediation, maturity transformation and leverage (Claessens et al, 2014), these financial intermediaries or activities are not subject to the same regulations nor do they have access to the same government safety nets as banks, such as deposit insurance and lender of last resort facilities by the central bank, to which banks have access.3
While there are various definitions for shadow banking, the comprehensive definition by the Financial Stability Board (FSB) is widely accepted and used. This definition, namely, “the system of credit intermediation involving entities and activities (fully or partly) outside of the regular banking system” (FSB, 2015), establishes that financial entities and activities that do not perform credit intermediation should not make up part of the shadow banking estimate. However, credit intermediation can occur in a complex chain of entities connected through markets and activities, and the focus should not only be on actual credit intermediation but also on its facilitation (e.g. the provision of guarantees and liquidity facilities). Furthermore, banks could also be involved in the complex credit intermediation chain, excluding traditional credit intermediation that is subject to prudential capital and liquidity regulation. Therefore it is important to keep in mind that not all activities of non-bank financial intermediaries are viewed as shadow banking activities, whilst some activities of banks can be regarded as shadow banking activities. It is also essential to note that the majority of shadow banking entities or activities in South Africa are regulated, however, the regulations and requirements that these entities or activities adhere to are different to those that banks adhere to whilst the activities themselves are similar to banks’ activities (See Annexure B for a discussion of the regulations that certain non-bank financial intermediaries in South Africa adhere to). This paper aims to shed light on the activities and entities that form a part of South Africa’s shadow banking system. The second section discusses the rise of shadow banking activities in the United States (US), which is followed by an overview of the importance of shadow banking. The fourth section provides a general overview of the composition of the shadow banking system and how it has evolved globally, applying the FSB approach. In the fifth section, the focus shifts from the global to the South African context, with a specific focus on how to measure shadow banking and its interconnectedness with the rest of the financial system, using the FSB approach, while also highlighting alternative approaches. 2 In this paper ‘shadow banking’ refer to entities or activities as measured by the Financial Stability Board approach, and in essence is a subset of non-bank financial intermediaries. and is also referred to as market-based finance of non-bank financial intermediation 3 Note that certain non-bank financial intermediaries have their own specific safety aspects, for instance investment funds’ obligations are matched by the full value of assets held in custody.

5
2. The rise of shadow banking
Shadow banks, made up of heterogeneous entities and activities, have existed long before the recent global financial crisis (Pozsar et al. 2010), although the term ‘shadow banking’ was only first used in 2007. Prior to 2007, these activities or entities might have been referred to as non-bank financial intermediation or market-based finance. Assets of non-bank financial intermediaries increased rapidly in the years leading up to the global financial crisis (FSB, 2012) and, following a brief contraction, assets of other financial intermediaries (financial intermediaries other than the central bank, banks, pension funds, insurance corporations, financial auxiliaries and public financial enterprises) continued to increase, albeit at a slower pace, after the crisis.
Given the role that shadow banking activities in the US played in the most recent global financial crisis, the rise of the shadow banking sector in the US is discussed below.
2.1 The rise of shadow banking in the United States
After runs on several banks, the US Federal Reserve (Fed) was created in 1913 to act as the lender of last resort, and the Glass–Steagall Act was passed by Congress in 1933, which established the Federal Deposit Insurance Corporation (FDIC) (Federal Reserve History, 2013). Deposit insurance meant that depositors no longer had to be the first in line to withdraw money from a bank if that particular bank ran into trouble, while the Fed would ensure that banks do not fail because of a liquidity crisis. With taxpayers’ money now at risk, Congress proceeded to restrict banks’ activities, in order to discourage excessive risk taking, furthermore the Fed capped the interest rates that banks could pay depositors with the ultimate aim of keeping institutions safe by ensuring that competition for deposits did not get out of hand. This rule, known as ‘Regulation Q’, was not perceived as a problem in a low-inflation environment; however, when inflation started increasing, investors started seeking alternatives to traditional deposit accounts.
According to the Financial Crisis Inquiry Commission Report (2011), in the late 1970s Merrill Lynch, Fidelity, Vanguard and others created money-market mutual funds (MMMFs) and attracted businesses and consumers away from banks by offering them higher returns. The MMMFs invested depositors’ money in short-term securities that were perceived to be safe, and which paid higher interest rates than banks. These funds functioned similar to bank accounts, except customers bought shares that were redeemable daily at a stable value. After Merrill Lynch introduced ‘cash management accounts’ in 1977, other MMMFs quickly followed. One of the most important distinctions between these funds and bank deposits was that they were not protected by FDIC deposit insurance. However, even without FDIC insurance, depositors considered these funds almost as safe as bank deposits. Furthermore, consumers enjoyed higher interest rates and the funds implicitly promised to maintain the full asset value of the shares. In the 1980s and 1990s the less-
6
regulated market for capital grew rapidly next to the traditional banking system.4 In the search for safe, high-quality assets, money-market funds (MMFs) developed an appetite for the ‘commercial paper’ and ‘repurchase’ (repo) markets. Regulatory arbitrage was possible because investment banks set up special purpose vehicles (SPVs) to do the actual securitization and endowed them with liquidity guarantees. Since these guarantees had much lower risk weights than the mortgages that were transferred to the SPVs, investment banks were able to leverage much more than otherwise possible. This led to a rapid expansion in non-bank financing activities, at the expense of traditional commercial banks, because financing was provided cheaper (with commercial paper and repos) and returns for investors (by MMMFs) were higher. Some regulators became concerned since it eroded the competitive positions of banks and left them vulnerable.5 Grievances were taken to Congress, and long-standing restrictions were slowly removed.6 US regulators generally supported and encouraged this shift toward deregulated financial markets, arguing that financial institutions had strong incentives to protect their shareholders and would therefore regulate themselves through improved risk management (Financial Crisis Inquiry Commission Report, 2011).
Following deregulations, banks in the US started to extend higher-risk loans with higher interest payments, and large commercial banks even lent money to companies and governments in emerging markets which resulted in higher profits, but added significantly to their risk profile. Amid the Savings and Loan crisis of the 1980s (Federal Deposit Insurance Corporation, 1997) the trend towards deregulation continued, focusing in part on the continued dismantling of regulations that limited depository institutions’ activities in capital markets. This resulted in two parallel financial intermediation systems of enormous scale, which lowered mortgage costs significantly. The funding available in the so-called shadow banking system7 in the US steadily gained ground on the traditional banking sector and surpassed the banking sector briefly in around 2000 and again between 2005 and 2007. In the Fed’s view, large commercial banks, believed to be well run, well capitalised and well regulated, would be able to provide support should any problems emerge in the shadow banking system.
4 Assets in MMMFs increased from US$3 billion in 1977 to more than US$740 billion in 1995 and US$1,8 trillion in 2000. 5 Alan Blinder, Vice Chairperson of the Federal Reserve (1994–1996), expressed concern regarding the competitive position of banks since competition was coming from a variety of non-bank institutions (mainly from Wall Street firms) that were receiving deposits and entering into the loan business. This was expected to decrease the competitiveness of banks and could ultimately threaten banks’ safety and soundness. 6 These reforms included the Depository Institutions Deregulation and Monetary Control Act (1980), which rescinded the limits on the interest rates that depository institutions could offer on deposits, as well as the Garn-St. Germain Act (1982), which broadened the types of loans and investments that banks could make and also gave broader scope in the mortgage market. 7 According to Flow of Funds Accounts data of the United States, shadow bank funding includes commercial paper and other short-term borrowing (bankers’ acceptances), repos, net securities loaned, liabilities of asset-backed securities issuers, and money-market mutual fund assets.
7
2.2 Shadow banking and the global financial crisis
The shadow banking system in the US, with relatively less supervision and regulation, grew to rival the commercial banking system. This system was fragile due to high leverage, risky assets, short-term funding, inadequate liquidity, and the lack of a Federal backstop.
When the US mortgage market collapsed and financial firms began to discard the commercial paper and repo lending markets, some institutions that relied on them for funding their operations failed or had to be rescued. Interconnections created contagion, and the crisis spread to markets and firms that had little or no direct exposure to the mortgage market (Financial Crisis Inquiry Commission, 2011).
It has been argued that among other factors, the failure of supervision was a contributory cause of the financial crisis (Llewellyn, 2009) and the Financial Crisis Inquiry Commission report (2011) itself argues that with the multitrillion-dollar repo lending market, off-balance-sheet entities and the use of over-the-counter derivatives, the US had a 21st-century financial system with 19th-century safeguards.
3. The importance of shadow banking activities Non-bank financial intermediaries, and thus also shadow banks, play an important role in the financial system, not only from a regulatory but also from an economic perspective. There are several reasons why it is important to be aware of the size and nature of the activities of these entities as well as their interconnectedness in the financial system. Some of these reasons are discussed in this section. i. Systemic risks Shadow banking activities could become a source of systemic risk for the financial system given that it can be intertwined with the operations of core regulated institutions such as banks or bank holding companies as well as insurance corporations (Adrian et al, 2016). In fact, the global financial crisis highlighted the prominence of interconnectedness as an important dimension of systemic risk. More specifically risks in the shadow banking system could be related to both interconnectedness (cross-sectional systemic risk) and the procyclicality dimension (time-serial systemic risk) (Dombret 2013). The financial system in South Africa is highly interconnected, with banks facing relatively high funding risk from non-bank financial intermediaries – see section 7 for further discussion. Furthermore, there is also high indirect interconnectedness or portfolio overlap, with MMFs’ portfolios, for example, being very similar. Against this backdrop, it is important to map the shadow banking system not only to measure it, but also to understand its evolution and interconnectedness with other financial intermediaries in South Africa. This is necessary to properly assess and mitigate potential risks as well as make informed policy decisions, keeping in mind the possible unintended spillovers of policy changes. In South Africa the size and activities of certain non-bank financial
8
intermediaries, including shadow banking activities, remains opaque and not fully understood due to data limitations. This could lead to systemic risks emerging unnoticed.
ii. Regulatory arbitrage could move risks to less-regulated/unregulated sectors Given that shadow banking entities often conduct activities that are similar to those of banks, but are not subject to the same level of regulation, and banks themselves operate in the shadow banking space, there is the potential for regulatory arbitrage. Note that shadow banking activities or entities are generally not unregulated (see Annexure B for more details specific to South Africa), however, the regulations differ to those regulations that banks adhere to. The increased cost of compliance for banks could provide opportunities for non-bank financial intermediaries to meet clients’ needs at more economical rates (see for example Duca, 2014; Acharya and Stefen, 2012 and Buchak et al, 2017). In turn, increased activity in the shadow banking system would transfer credit risk to the shadow banking industry. Furthermore, given that shadow banking activities are not regulated to the same extent as banks, if at all, there could be limitations on consumer protection. It is important for regulators to measure and be aware of such occurrences, as was the case in the US (discussed in section 2).
iii. Monetary policy transmission and decisions It is possible that as financing moves to the non-banking sector, the monetary policy transmission mechanism could become less effective, given that shadow banks do not have access to the loan facilities of the South African Reserve Bank (SARB) at the repo rate. However, according to the International Monetary Fund (IMF) (2016), an increase in non-bank financial intermediation actually strengthens the monetary policy transmission. A partial reason highlighted for this observation is the relationship between risk-taking and monetary policy – specifically for asset managers. Changes in the interest rate result in movements in bond yields and risk premiums, and thus affect the cost of borrowing and real activity. This implies that monetary policy might need to adapt to changes in the transmission mechanism as the non-bank financial sector becomes relatively larger. Therefore if credit intermediation outside of the regular banking sector is not measured properly the Monetary Policy Committee is unable to make well-informed policy decisions.
iv. Channel for capital flows Several shadow banking entities, specifically collective investment schemes (CISs), invest offshore or attract and accommodate foreign investors, making these non-bank entities an important channel for capital flows into and out of South Africa. These channels should be well understood and measured in order to evaluate the impact that the implementation of available policy tools could have.
v. Improve financial inclusion and competition for financial services Shadow banking can bring lenders and borrowers together outside of traditional banking channels. Non-bank products and services play an important role in increasing financial inclusion. In South Africa the sources of non-bank credit can contribute towards this goal seeing that only 77% of adults in South Africa have bank accounts (Finscope, 2016). By increasing the number of credit providers, shadow banks could also lower the lending rates due to higher competition, thereby

9
benefiting borrowers. A larger number of financial intermediaries would also imply that financial system risk would be split between a larger number of parties. Therefore, the beneficial role that shadow banking entities can play and are playing in increasing financial inclusion should not be ignored.
4. How to measure shadow banking: the Financial Stability Board’s approach
At the November 2010 Seoul Summit, the Group of Twenty (G-20) leaders identified certain unresolved issues of financial sector regulation. Given that following the global financial crisis new regulatory capital standards for banks were determined (Basel III), but not for shadow banks, G-20 leaders realised there was a potential threat that regulatory gaps might emerge from non-banking activities. It was requested that the FSB, in collaboration with other international standard-setting bodies, develop recommendations to strengthen the regulation and oversight of the shadow banking system. The objective of the FSB’s initiative was to ensure that shadow banking is subject to appropriate oversight and regulation to address bank-like risks to financial stability that could emerge outside of the regular banking system, while at the same time not preventing sustainable non-bank financing models that do not pose such risks (FSB, 2011).
In response, the FSB formed a task force to draft a scoping paper on shadow banking systems, with particular emphasis on (i) what is meant by ‘the shadow banking system’; (ii) potential approaches for a monitoring framework around shadow banking; and (iii) to develop options to discuss possible regulatory measures to address issues posed by shadow banking, including the possibility for both the regulation of shadow banking directly and the regulation of banks’ interactions with the shadow banking system. Furthermore the FSB has coordinated the development of policies to mitigate the possible systemic risks associated with shadow banking and to help to transform shadow banking into resilient market-based finance (FSB, 2011). Since 2011, the FSB has coordinated an annual global shadow banking monitoring exercise and formed several working groups in order to develop recommendations to strengthen the regulation and oversight of the shadow banking system.
The FSB’s (2016) global exercise consists of two steps; the first step entails ‘casting the net wide’, to observe all financial intermediaries, while in the second step this measure is narrowed down to arrive at a shadow banking activity measure. The narrowing down is focussed on risks and classifies shadow banking entities based on activities rather than entities. The monitoring universe of non-bank financial intermediaries (MUNFI) is the measure used to ‘cast the net wide’. This broad measure for shadow banking activities comprises all entities that are not the central bank, banks, financial auxiliaries or public financial institutions. The majority of shadow banking activities is captured in other financial intermediaries (OFIs), a sub-component of MUNFI, excluding pension funds and insurance corporations.

10
Figure 1 Assets of financial intermediaries participating* in the Financial Stability Board exercise
* 21 Jurisdictions and the euro area Source: Financial Stability Board, 2016 Figure 1 displays the distribution of financial assets among financial intermediaries comprising banks, pension funds and insurance corporations, central banks, public financial institutions, OFIs and financial auxiliaries (FSB, 2016). Globally, banks hold the largest amount of financial assets; however banks’ share of assets has declined since the onset of the global financial crisis (Figure 1, right-hand scale). The larger balance sheets of central banks can also be observed following the financial crisis. OFIs of 21 jurisdictions and the euro area hold a larger portion of financial assets than pension and insurance funds combined, and thus on a global level OFIs are an important component of the financial system. The second step of the exercise consists of narrowing down the MUNFI to a shadow banking estimate based on a risk-based activities approach. The approach involves the classification of non-bank entities into five economic functions (EFs), each of which involves non-bank credit intermediation and may pose shadow banking risks, including maturity/liquidity transformation and leverage (FSB, 2015). This classification framework allows the detection and assessment of the sources of financial stability risks from shadow banking in the non-bank financial space. The EFs are as follows: activities that are susceptible to runs (EF1), lending-dependent on short-term funding (EF2), market intermediation-dependent on short-term funding or the secured funding of client assets (EF3), facilitating credit creation (EF4), and securitisation-based intermediation (EF5). Classification is done without taking potential policy measures into account.
11
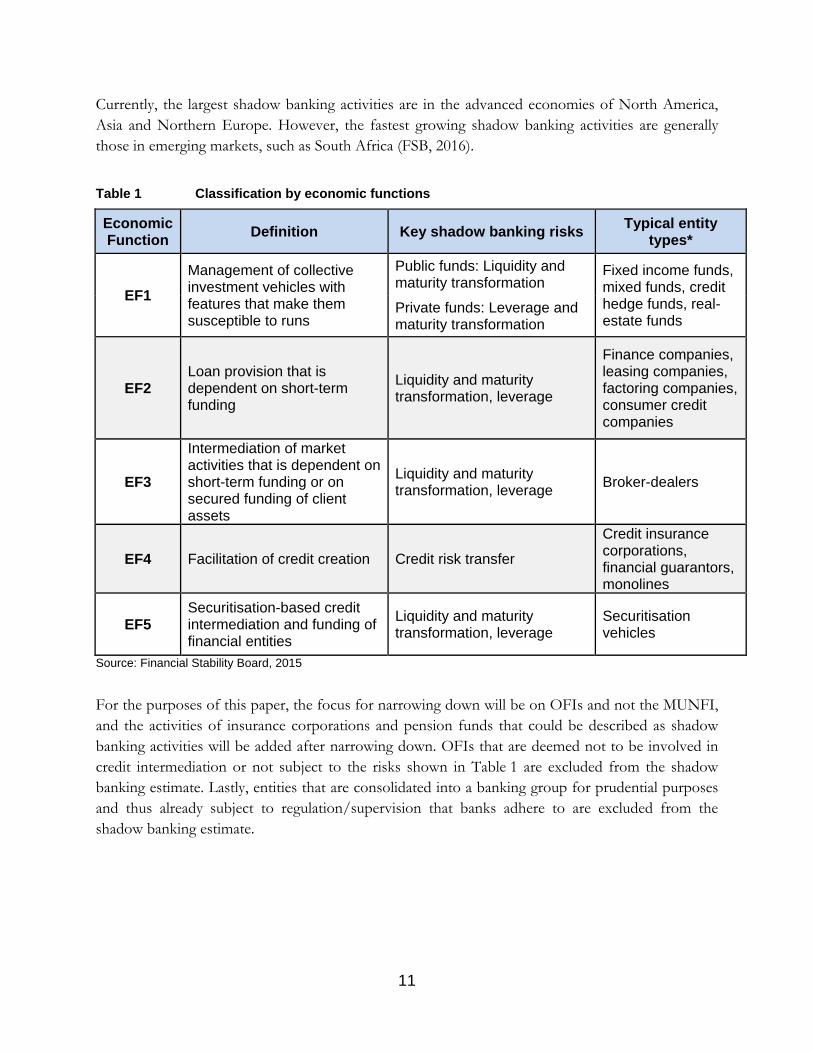
Currently, the largest shadow banking activities are in the advanced economies of North America, Asia and Northern Europe. However, the fastest growing shadow banking activities are generally those in emerging markets, such as South Africa (FSB, 2016).
Table 1 Classification by economic functions
Economic Function Definition Key shadow banking risks Typical entity
types*
EF1 Management of collective investment vehicles with features that make them susceptible to runs
Public funds: Liquidity and maturity transformation
Fixed income funds, mixed funds, credit hedge funds, real-estate funds
Private funds: Leverage and maturity transformation
EF2 Loan provision that is dependent on short-term funding
Liquidity and maturity transformation, leverage
Finance companies, leasing companies, factoring companies, consumer credit companies
EF3
Intermediation of market activities that is dependent on short-term funding or on secured funding of client assets
Liquidity and maturity transformation, leverage Broker-dealers
EF4 Facilitation of credit creation Credit risk transfer
Credit insurance corporations, financial guarantors, monolines
EF5 Securitisation-based credit intermediation and funding of financial entities
Liquidity and maturity transformation, leverage
Securitisation vehicles
Source: Financial Stability Board, 2015
For the purposes of this paper, the focus for narrowing down will be on OFIs and not the MUNFI, and the activities of insurance corporations and pension funds that could be described as shadow banking activities will be added after narrowing down. OFIs that are deemed not to be involved in credit intermediation or not subject to the risks shown in Table 1 are excluded from the shadow banking estimate. Lastly, entities that are consolidated into a banking group for prudential purposes and thus already subject to regulation/supervision that banks adhere to are excluded from the shadow banking estimate.

12
5. Measuring shadow banking in South Africa: applying the Financial Stability Board approach
South Africa has participated in the FSB’s annual shadow banking monitoring exercise since 2012. The discussion below is based on South Africa’s 2016 submission; but also contains more recent data. Step 1: Casting the net wide In line with the FSB’s approach to measuring shadow banking, the distribution of financial assets between financial intermediaries in South Africa is shown in Figure 2. Banks’ credit default swaps (CDSs) are also shown. Figure 2 Financial assets held and the distribution of financial assets between financial
intermediaries in South Africa and banks’ credit default swaps
Note: Financial assets were used where data were available. * Banks’ assets were compiled by aggregating individual South African-registered banks’ data (including local branches of international banks but excluding offshore branches and subsidiaries of South African banks, mutual banks and cooperative banks). Information therefore represents aggregated banks-solo information. Sources: Association for Savings and Investment South Africa (ASISA), Financial Services Board, Novare, SAREITs, JSE Limited and South African Reserve Bank Banks hold the largest share of financial assets in South Africa. In contrast to the aggregated global results shown in Figure 2, pension funds and insurance corporations in South Africa also hold a large share of financial assets and are thus displayed separately. After the onset of the global financial crisis, assets of OFIs increased at a faster pace than those of banks, resulting in a decrease in the share of banks’ assets as a percentage of total financial assets between 2008 and 2014. At the same time, the default risk for South African banks as a collective increased. This trend reversed in 2013,

13
and in 2014 and 2015 banks’ share of financial assets increased. Banks’ CDS has remained above pre-crisis levels. In South Africa’s case, OFIs are made up of CISs, finance companies, securitisation schemes, real-estate investment trusts (REITs), trust companies, stokvels and certain activities of brokers.8 As can be seen in Table 2, the assets under management in the OFI sector have increased steadily over the past decade. This growth is attributable to several factors including increased investment by pension funds and higher capital flows into South Africa against a global search-for-yield backdrop, in addition to valuation effects. Increased investment in CISs are generally the result of increased institutional investment, which would include insurance corporations and linked investment services providers, where the end product ends up in the hands of the public investor in any event. Table 2 Subcategories of other financial intermediaries over time (R millions)
Sources: South African Reserve Bank, Financial Services Board, Novare, Association for Savings and Investment South Africa (ASISA) and SA REITs. Between 2008 and 2013, the relatively faster growth in OFI’s assets under management compared to banks’ assets corresponds to the period of quantitative easing in the US and relatively low interest rates in several advanced economies which could have led to higher capital inflows. Despite the search for yield, the annual growth rates of the assets of most categories of OFIs, whilst higher than those of banks, have decreased since the global financial crisis, apart from CISs (excluding MMFs, hedge funds and participation bond schemes (PBSs)). The categories of OFIs are discussed in Annexure B. Step 2: Narrowing down - moving from OFIs to a shadow banking estimate
In order to more accurately measure shadow banking, activities that do not adhere to the FSB definition of shadow banking and cannot be classified into an economic function (Table 1) is removed from the OFI measure, while activities by pension funds and insurance corporations that are related to credit intermediation or the facilitation thereof is added. This narrowing down, according to economic functions, is done in order to identify risks in the non-banking sector. 8 Note that in the OFI measure, double-counting is involved and acknowledged because of attempting to measure the chain of credit intermediation.
OFIs
CISs excluding MMFs, hedge
funds and PBSs MMFs Hedge funds PBSsFinance
companiesTrust
companies REITsSecuritis
ation Brokers Stokvels
Peer to peer
lending2002 247 513 122 449 57 377 1 388 3 789 22 637 17 782 19 230 - 2 861 2008 1 104 505 447 161 214 041 30 274 3 419 116 077 33 125 95 000 125 781 39 627 2016Q3 3 315 975 2 078 658 293 263 68 600 1 345 265 660 60 234 357 000 58 537 83 600 49 000 78
2016Q22002-2007 37 19 31 108 -6 40 19 52 36 85 - -2008-2013 17 19 4 7 -18 12 9 19 -9 13 - -2014-2015 14 11 8 8 -1 9 26 6 5 8 - -
Size - Rand millions
Growth rates - Annual percentage change

14
Activities that are excluded from the shadow banking measure comprise mainly activities that do not participate in or facilitate credit intermediation and do not exhibit shadow banking risks; thus, they cannot be categorised into an economic function. If shadow banking activities are prudentially consolidated into a banking group and subject to Basel-like regulatory requirements, they are also excluded from the shadow banking measure. In South Africa, this results in equity funds, REITs, real-estate funds, trust companies, PBSs, stokvels, peer-to-peer lending platforms and banks’ investment in their own securitisation schemes being removed from the OFI measure in order to arrive at the narrow measure of shadow banking. The fund of funds’ investment into equity funds is also excluded. The reasons that these entities or activities are not included in the narrow measure of shadow banking are discussed below. Note that there is a case to be made to exclude a portion of the brokers’ activities given that most of these are banks; however, due to a lack of data and the conservative approach of the exercise the entire estimate is classified.
Figure 3 Moving from the OFIs to a shadow banking estimate
Equity funds is the largest OFI subcategory that is excluded from the shadow banking measure, given that investing in an equity fund involves no credit intermediation (i.e. there is no agreement to repay an investment into equities at a later date) and no maturity mismatch (these funds have a minimum of 80% of their total portfolio invested in equity). This is an example of a more risky investment, where investors could lose their entire investment, while at the same time also being exposed to the possibility of higher returns than with a traditional bank deposit. For the same reason, funds that invest in equity funds are excluded from the shadow banking measure. In
15
September 2016 equity funds held assets to the value of R479 billion under management, while funds that invested in equity funds amounted to R80 billion. Real-estate funds in South Africa invest predominantly in REITs,9 other equities and other property funds. Furthermore, all REITs in South Africa are equity REITs. Since equity REITs does not involve any credit intermediation (as in the case of mortgage REITs),10 REITs and real-estate funds are excluded from the shadow banking measure. In September 2016, REITs and real-estate funds in South Africa had approximately R357 billion and R79 billion assets under management respectively. The assets of trust companies are excluded from the shadow banking measure, since the primary goal of this type of company is the oversight of the administration of trust assets. Credit extended by trusts is made to trust beneficiaries. Therefore, this would be similar to borrowing against a pension fund investment. As the beneficiary is using his/her own assets, this is not seen as credit extension. Trust companies make up a much smaller part of OFIs, with assets amounting to R60 billion in September 2016. PBSs are involved in credit intermediation; however, there is no risk of a run on these funds given the regulations that are in place (see Annexure B for more details). Therefore, from the FSB’s perspective, PBSs are not included in the narrow measure of shadow banking. Assets of PBSs have declined over time and at the end of the third quarter of 2016 amounted to R1.3 billion. Banks’ investments into securitisation activities are also excluded from the narrow shadow banking measure, given that banks invest in their own securitisation products, and capital is then held against these investments. As at September 2016, this amounted to R22.7 billion (out of the R58.5 billion of total securitisation activities). A stokvel, or a savings club, is an association of individuals who make regular contributions to a common pool of savings. This pool of savings is generally distributed (fully or partially) to each contributor on a rotational basis. Traditionally, stokvel contributions were collected physically and also distributed to members in the same manner. However, members have started to deposit their contributions into a bank account and other investment instruments. The aim of these savings clubs can vary from buying groceries in bulk at reduced prices or assistance with funeral costs. According to African Response (2014), there are different types of stokvels, with stokvels aimed at saving for funerals (i.e. burial societies) by far the most popular segment of the stokvel universe in South Africa (65%). Stokvels aimed at saving represents roughly 30% and groceries 21%, while stokvels formed
9 REITs that real-estate funds invest in include domestic and foreign REITs. 10 See the Annexure B for a more detailed discussion on equity and mortgage REITs.

16
for investment purposes represent only 4% of the stokvel industry.11 Stokvel segments with the aim of pooling together money to save are not regarded as shadow banking, given that there is no credit intermediation that takes place. An argument can be made to include stokvels in the shadow banking measure, if there is credit extension to non-members, and loans of a longer maturity are based on short-term funding. However, currently stokvels are not included in South Africa’s shadow banking measure, given the general lack of data indicating credit intermediation or maturity transformation. If the nature of these savings clubs changes, or if more disaggregated data becomes available, this stance should be reconsidered. The assets of insurance corporations that are involved in the insurance of credit extension, thus making up part of the chain of credit facilitation, are added to the shadow banking measure because it facilitates credit. Pension funds also provide credit insurance, but the underlying loans are granted by banks, and therefore the credit guarantees do not form part of the shadow banking system. Credit insurance by registered insurance corporations amounted to an estimated R9,8 billion in September 2016. Peer-to-peer (P2P) lending platforms provide consumers with an alternative funding source to bank loans and at the same time provide net savers with additional investment opportunities. While in certain instances the shadow banking label is appropriate for P2P lending platforms, some of these entities do not have any maturity or liquidity mismatches or leverage (at least not for on-balance sheet activities). If, however, P2P vehicles obtain (part of) their funding through securitisation, these activities could be classified into EF5 (securitisation-based credit intermediation and funding of financial entities). In South Africa’s case, P2P lending activities remain fairly small with an estimated R78 million worth of assets under management. However, its growth is recognised and the market conduct regulator might soon consider regulatory options. Currently P2P lending platforms are not included in South Africa’s shadow banking measure when following the FSB approach. Detailed data on the operations of P2P lending platforms are limited. Thus, shadow banking entities or activities in South Africa comprise MMFs, multi-asset funds, fixed-income funds, hedge funds, fund of funds, finance companies, activities of brokers, securitisation schemes (excluding securitisation that banks invest in) and credit insurance. The shadow banking measure amounted to R2 208 billion in the third quarter of 2016.
11 Note that members can belong to more than one type of stokvel, thus the percentages across the various stokvel types add up to over 100 per cent.

17
Figure 4 Shadow banking activities/entities, September 2016 – R millions
Note: Blue areas indicate activities/entities that can be classified into EF1 according to the Financial Stability Board approach; green indicates EF2; orange indicates EF3; red indicates EF4; and purple indicates EF5. CISs, of the types indicated in blue in Figure 4, make up the largest portion of the shadow banking measure, amounting to just over 80% of the shadow banking estimate. Thus, according to the FSB approach, the largest part of South Africa’s shadow banking system can be classified into EF1 and is regarded as possibly being susceptible to runs. As mentioned previously, classification into EFs is done without taking policy tools available into account. However, it should be noted that these funds are regulated by the Financial Services Board, and suspensions and a form of gating is accommodated in the regulations. Furthermore, in the current regulatory framework the regulator additionally essentially has the powers to declare any tool to be used on an ad hoc basis and the conditions under which it may/must be used. Therefore it can be argued that the tools exist to mitigate potential risks. Risks could be described as less severe than abroad given that the majority of CISs in South Africa are not leveraged. Also it is worth noting that currently the instruments invested by MMFs tend to be more vanilla-type than those used in more advanced economies and that the focus of MMFs, and their managers, is not on funding but rather on providing a competitive interest-earning vehicle – the managers have a fiduciary duty to seek the best rates. However, it should be emphasized that whilst these funds are regulated from a micro perspective, currently there is no regulation mandating a regulator to conduct macroprudential supervision. This

18
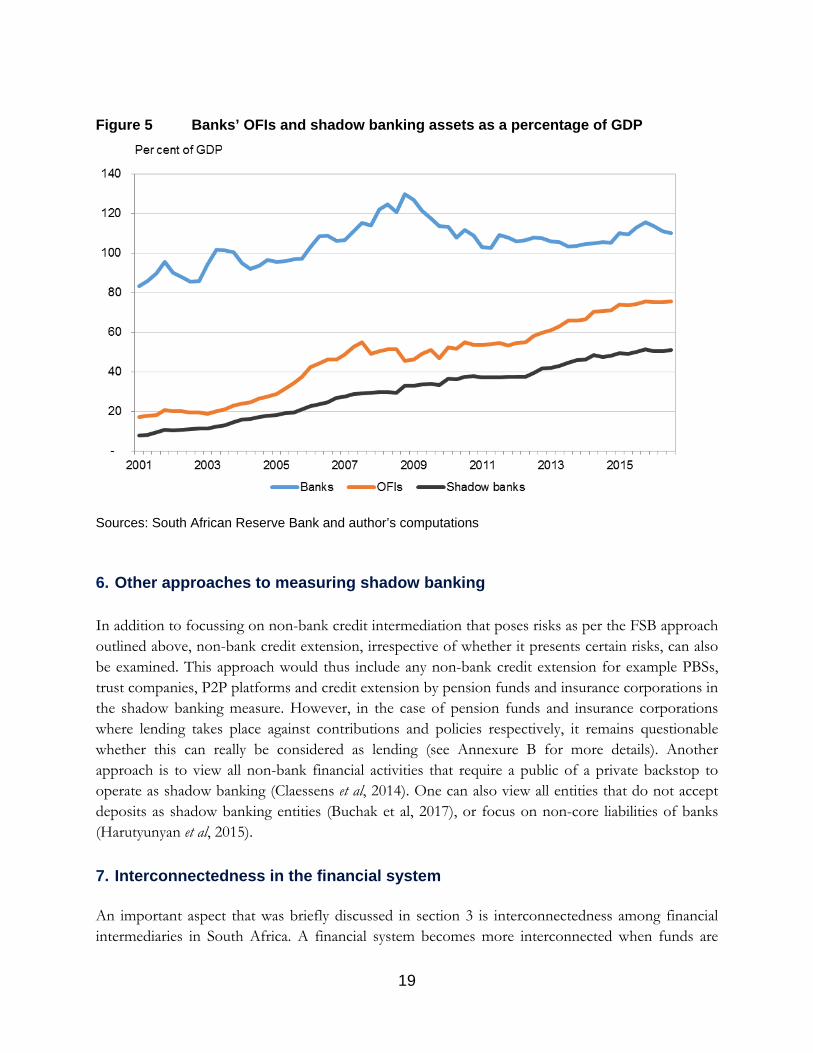
is expected to be addressed, at least partially, with the introduction of the Twin Peaks regulatory framework.12 Finance companies (12% of shadow banking activities) are classified into EF2 (loan provision that is dependent on short-term financing) and are only regulated from a market conduct perspective by the National Credit Regulator. Generally these companies extend credit and an argument can be made that they thus compete with banks, without being regulated to the same extent. This situation could result in regulatory arbitrage in addition to encouraging banks to start operating in the shadow banking space themselves. In SA the services offered to hedge funds to facilitate their daily business operations, including covering short positions and leverage / gearing requirements are included in EF3. Generally these loans are made against the hedge funds’ portfolio of assets. The data for these types of transactions are not easily available over time and are currently estimated to amount to roughly R83,6 billion or 4% of shadow banking activities.13 The insurance of credit extension amounts to less than 1% of the shadow banking estimate. This includes companies supervised by the Financial Services Board that are involved in the facilitation of credit, and thus classified as EF4. Securitisation activities, amounting to 2% of shadow banking assets, are classified as EF5 (securitisation-based credit intermediation). These activities are generally unregulated given that there are currently no tools in place to limit financial stability risks apart from the listing requirements from the JSE Limited (JSE). For example, there is no limit or prescriptions on the types of assets that may be securitised. The JSE is currently working on proposals for risk retention by the issuers for inclusion on the exchange. When measured as a percentage of GDP, the increase in assets under management of OFIs and shadow banking entities since the global financial crisis can be observed in Figure 5. Even though the shadow banking sector is currently less than half the size of the banking sector in South Africa, shadow banking assets amount to 50% of gross domestic product (GDP) and therefore turmoil in this sector could impact on financial stability in South Africa.
12 The Financial Sector Regulation Bill was signed into law in August 2017. 13 According to the Novare survey, there is an average gearing of 167 per cent among hedge funds, which amounts to R82,6 billion. This is an area where data gaps exist.
19
Figure 5 Banks’ OFIs and shadow banking assets as a percentage of GDP
Sources: South African Reserve Bank and author’s computations 6. Other approaches to measuring shadow banking In addition to focussing on non-bank credit intermediation that poses risks as per the FSB approach outlined above, non-bank credit extension, irrespective of whether it presents certain risks, can also be examined. This approach would thus include any non-bank credit extension for example PBSs, trust companies, P2P platforms and credit extension by pension funds and insurance corporations in the shadow banking measure. However, in the case of pension funds and insurance corporations where lending takes place against contributions and policies respectively, it remains questionable whether this can really be considered as lending (see Annexure B for more details). Another approach is to view all non-bank financial activities that require a public of a private backstop to operate as shadow banking (Claessens et al, 2014). One can also view all entities that do not accept deposits as shadow banking entities (Buchak et al, 2017), or focus on non-core liabilities of banks (Harutyunyan et al, 2015). 7. Interconnectedness in the financial system An important aspect that was briefly discussed in section 3 is interconnectedness among financial intermediaries in South Africa. A financial system becomes more interconnected when funds are

20
invested across financial institutions and when there is a high level of common exposures to the same counterparties (see Annexure A for more details). While there are various investment options available to South Africans, the financial system remains relatively small and interconnected with shadow banking activities being an important source of funding for the South African economy and for banks. In total, the funding that banks obtain from OFIs in South Africa amounts to just under 15% of banks’ assets. When comparing South Africa to other jurisdictions that participated in the monitoring exercise (FSB, 2016), globally this is the third-highest percentage of banks’ funding obtained from OFIs. With a limited number of investment options and a relatively small number of banks, it is not surprising that interconnectedness in the system is high. It is, however, not only banks and OFIs that are interconnected. As alluded to earlier, pension funds and insurance corporations also share high interconnectedness in the South African financial system. This can be explained by the relatively high share of assets held by both insurance corporations and pension funds when compared to the global distribution of financial assets. Data available on the asset allocation of pension funds registered with the Financial Services Board show that assets invested in CISs increased from 7% in 2008 to 12% in 2014. OFIs and pension funds are also indirectly connected because of common exposures - pension funds invest in the same equities, bonds, other securities and other OFIs that OFIs invest in. In the section that follows, specific exposures of various financial intermediaries will be discussed in detail, focusing on the exposures of MMFs (12% of shadow banking assets), CISs excluding hedge funds and PBSs (70% of shadow banking assets) and finance companies (12% of shadow banking assets).
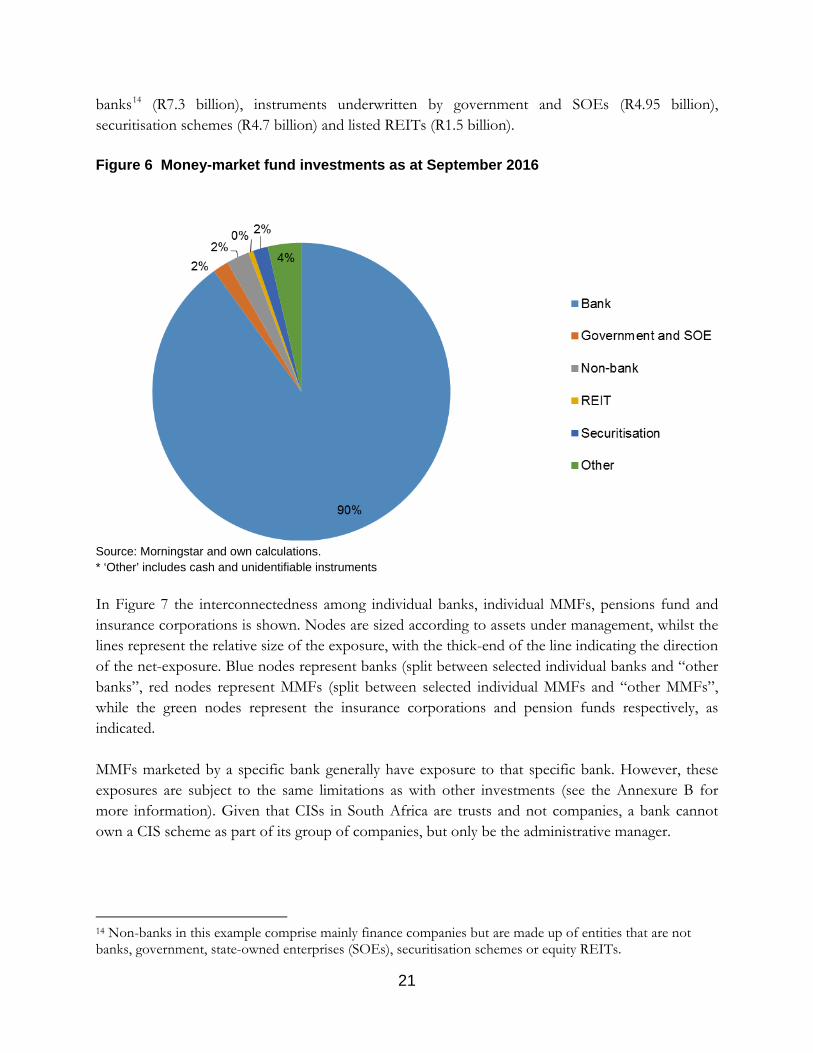
(i) Money-market fund investments MMFs play an important role in the South African economy by providing short-term finance for banks and other businesses. They also provide retail and institutional investors with a low-cost investment vehicle for their liquidity needs. As at September 2016 89% of MMFs’ assets were invested in instruments issued by the five largest banks (Figure 7). MMFs also had exposures to the other banks amounting to 1%, therefor the total exposure to the banking sector amounted to 90% of MMFs total assets under management (R236 billion). This represents 5.4% of the banking sector’s assets and highlights the important role that MMFs play in providing short-term liquidity to banks while confirming the interconnectedness between MMFs and banks in South Africa. MMFs also invest in instruments underwritten by non-
21
banks14 (R7.3 billion), instruments underwritten by government and SOEs (R4.95 billion), securitisation schemes (R4.7 billion) and listed REITs (R1.5 billion). Figure 6 Money-market fund investments as at September 2016
Source: Morningstar and own calculations. * ‘Other’ includes cash and unidentifiable instruments In Figure 7 the interconnectedness among individual banks, individual MMFs, pensions fund and insurance corporations is shown. Nodes are sized according to assets under management, whilst the lines represent the relative size of the exposure, with the thick-end of the line indicating the direction of the net-exposure. Blue nodes represent banks (split between selected individual banks and “other banks”, red nodes represent MMFs (split between selected individual MMFs and “other MMFs”, while the green nodes represent the insurance corporations and pension funds respectively, as indicated. MMFs marketed by a specific bank generally have exposure to that specific bank. However, these exposures are subject to the same limitations as with other investments (see the Annexure B for more information). Given that CISs in South Africa are trusts and not companies, a bank cannot own a CIS scheme as part of its group of companies, but only be the administrative manager.
14 Non-banks in this example comprise mainly finance companies but are made up of entities that are not banks, government, state-owned enterprises (SOEs), securitisation schemes or equity REITs.

22
Figure 7 Interconnectedness* among MMFs, banks, insurance corporations and pension funds
* Only on-balance sheet exposures and investments are into account, as at September 2016. Sources: Morningstar, South African Reserve Bank and own calculations Whilst MMFs have large exposure to the banking sector, the funding to banks from pension funds and insurance corporations is also significant.

23
Other Collective investment schemes
Roughly 37% of CIS assets - excluding MMFs, hedge funds and PBSs - are invested in domestic equities, 13% in domestic bonds and 18% of the assets under management are invested in domestic funds (invested in another fund). The largest portion of domestic equities that CISs invest in is issued by non-bank entities and banks. Furthermore, the largest portion of bonds that CISs invest in is issued by banks and the government. Money-market instruments that CISs invest in are also mostly issued by banks. In aggregate, 18% of CIS assets are invested in instruments underwritten by banks and, as at September 2016, this amounted to R376 billion (8% of bank assets). These figures exclude investments made into the funds that are managed/marketed by banks.
Table 3: Holdings of other CISs, excluding MMFs, hedge funds and PBSs*
* In order to analyse the holdings of CISs in South Africa, data from Morningstar were used. Similar to ASISA data, hedge funds and PBSs are not included in the data, while certain Exchange Traded Funds were included, but Exchange Traded Notes are not included. Source: Morningstar
Over 16% of local CISs are invested in CISs with foreign exposure, with a further 4% invested in foreign equities and 0.4% in other foreign instruments, bringing the total foreign exposure to just over 20%. The CIS industry also invests 4% of assets in REITs. The remaining 15% captured under ‘other’ includes cash investments and other investments in instruments that could not be categorised or identified.
(ii) Finance companies
Finance companies are also interconnected with the rest of the financial system. Certain finance companies are fully or partially owned by banks or banking conglomerates, which implies that capital could be held by banks against these exposures. Finance companies are also connected to the rest of the financial system due to their funding sources, which include borrowing from banks or parent companies; issuing equity, bonds, debentures or notes (hence funding from capital markets); or by establishing special purpose vehicles (SPVs) to facilitate the securitisation of loans.15 In South Africa, finance companies extend credit in various sectors, including the retail and the real-estate sectors.
15 Banks can also be the arranger of securitisation schemes that finance companies use to raise funds.
Percentage of total R millions Bank Non-bank Government SOE REIT Other
Another fund domestic 18 374 669 - - - - - - Another fund foreign 16 344 306 - - - - - - Bond - domestic 13 268 265 110 572 36 861 96 222 12 923 10 912 775 Bond - foreign 0 160 - - - - - 160 Cash and interest 3 58 774 28 688 - - - - 30 086 Cash-foreign (foreign cash) 0 7 711 - - - - - 7 711 Equity - domestic (including equity options) 37 771 145 103 733 577 619 - 3 969 85 563 260 Equity - foreign (foreign equity) 4 79 248 - - - - - 79 248 MMF instrument - ZAR and other 8 157 020 128 266 15 448 1 007 5 608 2 415 4 276 Other 1 30 582 4 824 - - - - - TOTAL 2 091 880 Percentage of total 18% 30% 5% 1% 5% 6%

24
Figure 8: Liabilities of finance companies
Source: South African Reserve Bank
Finance companies in South Africa obtain the majority of their funding from loans originated by non-bank financial institutions or from market-based financing by, for example, issuing commercial paper (see Figure 8). Among other things, CISs also invest in these instruments.
8. Risks in the shadow banking industry
Shadow banking activities amount to roughly 50 per cent of GDP in South Africa and could become a risk to the financial system if not properly measured and understood. Currently, one of the biggest concerns is data limitations. These gaps include the lack of comprehensive data on finance companies, hedge funds, P2P lending platforms, limited data on securitisation schemes and limited broker-dealer and securities financing data. There are also limited information and data available on the less formal sectors, for example stokvels.
South Africa’s financial system is unique in several important ways, two of which include (i) pension funds and insurance corporations hold a relatively larger share of financial assets; and (ii) banks are more dependent on OFIs for funding. These characteristics should be taken into account prior to introducing regulations designed for countries lacking these characteristics.

25
Furthermore, while this paper is not aimed at exploring the question of whether shadow banking activities should be regulated to the same extent as banks, it does highlight that there is currently room for regulatory arbitrage in South Africa and it is possible that additional regulation in the banking sector could result in increased non-bank financial intermediation, possibly even by encouraging banks to operate in the shadow banking space. Specifically, given the structural small retail deposit base and difficulty in obtaining long-term funding from the capital markets, challenges remain for South African banks to fully comply with the minimum net-stable funding ratio (NSFR), which will be effective from 2018. According to the IMF (2015), banks noted that in order to meet the NSFR they might have to reduce long-term assets, while the IMF stated that they could raise interest offered (to attract more retail deposits and obtain more funding with a maturity beyond one year). Unintended consequences of this implementation could include lower economic growth due to banks having to curtail (long-term) credit extension, and an increase in the cost of funding, which translates to a higher cost of lending. This could also result in increased credit extension by non-bank financial intermediaries or more operations by banks in the shadow banking space.
Despite having the potential to create and amplify risks to financial stability, shadow banking can provide useful and legitimate financial intermediation throughout economic fluctuations. In a relatively small open economy with a concentrated financial sector, such as South Africa, shadow banks have a role to play in improving liquidity and possibly even increasing competition between financial intermediaries. It is therefore worth noting that when considering regulatory responses to shadow banking, the expected cost and benefits of potential policy interventions should be taken into account. 9. Conclusion This paper aims to take the first step towards measuring the shadow banking sector and highlighting the interconnectedness between some CISs and the banking sector. It is shown that the assets under the management of shadow banks and OFIs are increasing at a faster pace than those of banks. Furthermore, the paper highlights that financial intermediaries in South Africa are very interconnected directly (due to high net exposures) and indirectly (due to common exposures). This paper is not advocating increasing regulation in the non-banking sector but instead, it suggests that as a first step increased focus should be placed on measuring the activities and risks appropriately and ensuring that risk management practices are in place. Furthermore any policy decision should take the high interconnectedness among financial intermediaries into account into account. It should be noted that shadow banking activities, vehicles and entities are constantly evolving (Adrian et al, 2016) and the monitoring and measuring thereof will have to be done on a continuous basis. Several data gaps remain and South Africa’s shadow banking measure can also be improved in several ways. The first is by casting the net wider, that is, by including additional entities or activities in the OFI measure. For example, measures of securities financing transactions and repo transactions, derivatives as well as private equity that are not captured in the OFIs measure can be included. Furthermore, the activities of CCPs can be evaluated and included if applicable. The role
26
of virtual currencies and fintech should also be explored, specifically when credit intermediation is present. Secondly, the shadow banking measure can be improved by focusing on the narrowing down process to arrive at the measure of shadow banking activities, for example detailed data on finance companies that are consolidated into banking groups would result in fewer finance companies being included in the narrow measure. As explained above, depending on whether a risk-based approach is taken, certain activities will be included in the measure, while they will be excluded if an approach of pure credit intermediation fully or partially outside of the banking system is taken. In addition to improving the shadow banking measure, further research should focus on determining the systemic risk that shadow banking activities pose to the financial system.
27
References
Adrian, T. Ashcraft, A. B. and Cetorelli, N. 2013. Shadow Bank Monitoring (September 1, 2013). FRB of New York Staff Report No. 638. Available at SSRN: https://ssrn.com/abstract=2334918 or http://dx.doi.org/10.2139/ssrn.2334918
Adrian, T., Ashcraft, A. B. 2016. Banking Crisis. Chapter: Shadow banking: a review of the literature Available online: https://link.springer.com/book/10.1057/9781137553799.
Acharya, V. V. and S. Stefen (2012) Analyzing Systemic Risk of the European Banking Sector.
Handbook on Systemic Risk, J.-P. Fouque and J. Langsam (Editors), Cambridge University Press.
African Response. 2014. ‘Latest stats on stokvels’. Available online: http://www.africanresponse.co.za/press.html.
Buchak, G., Matvos, G. Piskorski, T. Seru, A. 2017. “Fintech, Regulatory Arbitrage, and the Rise of Shadow Banks” Working Paper 23288 Available at: http://www.nber.org/papers/w23288
Claessens, S and Ratnovski, L. 2014. 2014. ‘What Is Shadow Banking?’. IMF working paper, February 2014. Available online https://papers.ssrn.com/sol3/papers.cfm?abstract_id=2559504.
Dombret, A. 2013. Speech by Dr Andreas Dombret, Member of the Executive Board of the Deutsche Bundesbank, at the Salzburg Global Seminar titled ‘Out of the shadows: should non-banking financial institutions be regulated?’. Salzburg, 20 August 2013. Available at: http://www.bis.org/review/ r130821a.pdf.
Duca, J. V. 2014. “What Drives the Shadow Banking System in the Short and Long Run?” FRB Dallas Working Paper 1401, Federal Reserve Bank of Dallas, Dallas. Available at: https://www.dallasfed.org/assets/documents/research/papers/2014/wp1401.pdf
Federal Reserve History. 2013. Banking Act of 1933, commonly called Glass-Steagall. Available at: http://www.federalreservehistory.org/Events/DetailView/25.
Federal Deposit Insurance Corporation, 1997. ‘History of the Eighties - Lessons for the Future’. Available at: https://www.fdic.gov/bank/historical/history/167_188.pdf.
Financial Crisis Inquiry Commission. 2011. Available at: http://fcic-static.law.stanford.edu/cdn_media/fcic-reports/fcic_final_report_full.pdf.
Financial Stability Board. 2016. ‘Global Shadow Banking Monitoring Report 2016’. Available at: http://www.fsb.org/wp-content/uploads/global-shadow-banking-monitoring-report-2016.pdf
Financial Stability Board. 2015. ‘Global Shadow Banking Monitoring Report 2015’. Available at: http://www.fsb.org/2015/11/global-shadow-banking-monitoring-report-2015/.
Financial Stability Board, 2011. ‘FSB recommendations to strengthen oversight and regulation of shadow banking’. Available at: http://www.fsb.org/wp-content/uploads/r_111027a.pdf

28
Finscope. 2016. South African 2016 Survey on Financial Inclusion.
Harutyunyan, A. Massara,A. Ugazio, G. Amidzic, G, Walton, R. 2015. Shedding Light on Shadow Banking. IMF working paper, January 2015. Available online: https://www.imf.org/external/pubs/ft/wp/2015/wp1501.pdf
International Monetary Fund. 2015. South Africa, Financial Sector Assessment Program. IMF Country Report No. 15/54. March 2015. Available online: https://www.imf.org/external/pubs/ft/scr/2015/cr1554.pdf.
International Monetary Fund. 2016. ‘Monetary policy and the rise of non-bank finance’. Global Financial Stability Report, October 2016. Available online https://www.imf.org/external/pubs/ft/gfsr/2016/02/index.htm.
Llewellyn, D.T.2009. Financial innovation and a new economics of banking: Lessons from the financial crisis. Available online: http://frank-oertel-math.de/Financial_crisis_and_new_economics_of_banking_Aug_2009.pdf
Novare. 2016. ‘Hedge fund survey 2016’. Available online: http://www.novare.com/hedge-fund-survey/?#6
Pimco, 2007. Teton Reflections. ‘There is a mighty gulf between the Fed's cup and the shadow banking system's parched liquidity lips’. Available at: https://www.pimco.com/insights/economic-and-market-commentary/global-central-bank-focus/teton-reflections.
Pozsar, Z, Adrian, T, Ashcraft, A and Boesky, H. 2010. ‘Shadow banking’. Available at: http://ssrn.com/abstract=1640545 or http://dx.doi.org/10.2139/ssrn.1640545.

29
Annexure A
The flow of money between savers and borrowers A saver, on one hand, can deposit money at a bank, invest in securities directly, or obtain more exposure and spread risk by investing in a collective investment scheme (CIS). Money can also be invested in pension funds which, in turn, can be invested in CISs or directly in various securities. CISs invest in a portfolio of assets, including equities, bonds and other more complicated security types. These securities are issued by banks, non-banks or the government (not shown in Figure A). Recently, peer-to-peer (P2P) lending platforms, where savers can extend loans directly to borrowers by using a platform, also became available in South Africa.
Figure A: Interconnectedness among financial intermediaries
Figure A is a simplified representation (no distinction is made between local and foreign investments) of the flow of money between ultimate savers and ultimate borrowers.
A borrower, on the other hand, can obtain funding by means of a loan from a bank or by issuing various types of securities or debt instruments. Financial intermediaries can also securitise assets

30
(including loans) by using special purpose instruments (SPIs) in order to raise funds or increase liquidity. Banks obtain funding from deposits, but also by issuing securities or using securitisation vehicles. In fact, several of the securities and debt instruments that individuals and CISs invest in are issued by banks. These securities include equities, bonds and money-market instruments.
In the traditional banking system, by accepting deposits and extending loans, banks engage in maturity, liquidity and credit transformation (see blue areas in Figure A). Traditionally this risk transformation occurs on a single balance sheet, however shadow banking activities transform risks using several balance sheets or mechanisms. Shadow banks engage in activities that are similar to those of banks and also involve maturity, liquidity and credit transformation, however these entities or activities are not regulated to the same extent.
Annexure B Components of OFIs
Collective investment schemes
In South Africa, CISs are regulated by the Financial Services Board16 in terms of the Collective Investment Schemes Control Act 45 of 2002 (CISCA). The Financial Services Board has the primary mandate to protect the interests of South African investors in the CIS industry and to promote a sound, transparent, efficient and fair CIS industry. However, the regulations do not aim to guarantee an investment and any investment is still subject to market losses. Instead, these regulations prescribe the asset holdings of a particular fund according to the type of fund it is registered as. According to CISCA, CISs can currently be categorised as (MMFs), participation bond schemes (PBSs), hedge funds and other collective investment schemes. Given that resources are pooled together by the CISs to purchase underlying assets with different maturities while generally investments into the CIS are regarded as liquid, these funds could be subject to runs. The Registrar of CISs from the Financial Services Board has the powers to declare any tool to be used on an ad hoc basis and the conditions under which it may be used, including side pocketing, redemption gates and imposition of redemption fees. In the case of distress, the application of these tools could limit a run on CISs.
16 The Collective Investment Schemes Control Act 45 of 2002 (CISCA) regulates and controls the establishment and administration of CISs in South Africa. A list of approved schemes is available from the Financial Services Board at https://www.fsb.co.za/Departments/cis/Pages/approvedSchemes.aspx.

31
i. Money-market funds MMFs became available in South Africa in 1995. Since then the sector has grown to have assets under management (AUM) of R293 billion in the third quarter of 2016, which amounts to roughly 10% of OFI assets. The largest MMFs in South Africa are managed by companies owned by banks. Even though some investors could be under the impression that the associated bank will stand behind the fund in times of distress, the bank it is not legally required to do so. The aftermath of African Bank Limited being placed under curatorship in 2014 is an example where investors in MMFs that had exposure to money-market instruments issued by African Bank made ‘unexpected’ losses because the MMFs were marketed by banks and also perceived to be safe.17 Several MMFs in South Africa ‘broke the buck’ for a day, which means the income for the day was negative – only one fund experienced negative income against the previous twelve days accumulated income - and, following redemptions, the Registrar of CISs intervened and authorised the creation of new funds, called ‘side pockets’ in which to keep African Bank Limited’s debt instruments.18 These interventions by the Financial Services Board avoided a possible run on MMFs.
CISCA Notice 90 of 2014 restricts the money-market instruments that a fund manager may invest in, in terms of maturity of the investments in addition to the exposure to a counterparty (inclusion limits). The weighted average legal maturity of the fund may not exceed 120 days, while the weighted average duration of the money-market instruments may not exceed 90 days. No single instrument that MMFs invest in may have a maturity exceeding 13 months. The regulations also limit the exposure in terms of the maximum percentage of the aggregate market value of the portfolio. These limitations include a 30% maximum exposure to MMF instruments issued by local or foreign banks (registered in South Africa) of which the holding company is listed on the exchange if the market capitalisation of the listed group holding company exceeds R20 billion, and to 20% if the market capitalisation of the listed group holding company is between R2 billion and R20 billion. Some MMFs are also compliant with Regulation 28 of the Pension Funds Act, which makes these funds eligible investments for South African pension funds.19 MMFs can also invest in money market instruments issued by any local or foreign entity which is listed on an exchange. This exposure is limited to 10% per issuer.
17 Since several MMFs had been marketed by a commercial bank, they were seen to be ‘safe’ for deposits and hence not subject to losses. 18 This segregated the less-liquid African Bank instruments from the remaining assets in the respective MMF portfolios, and ensured that new investors were not exposed to African Bank debt. 19 Regulation 28 to the Pension Funds Act limits the investments of retirement funds with the aim of protecting funds against making imprudent investments once the requirement to invest in prescribed assets had fallen away. See https://www.fsb.co.za/Departments/communications/Documents/Memorandum%20to%20explain% 20the%20revised%20regulation%2028.pdf.

32
ii. Hedge funds
Hedge funds in South Africa started in 1995 and, to date, have not become as popular as hedge funds internationally, with R68,6 billion20 worth of assets under management in 2016 – roughly 2% of OFI assets. Even though the hedge fund industry in South Africa is not large enough to present systemic risk to the local financial system, it has shown significant growth over time. A possible driver could be regulatory change, specifically the amendment to Regulation 28 of the Pension Funds Act 24 of 1956. Under the amendment, pension funds can invest up to 10% of their assets into hedge funds, whereas previously hedge funds formed part of the ‘other’ category with a limit of 2.5% on everything except equities, cash, bonds, property and Krugerrands.
Hedge funds can invest in a wider range of financial instruments than other CISs, and are also allowed to employ different investment strategies and use leverage and short selling. More than half of the assets under management of hedge funds are equity long-short strategies.21 Hedge funds are allowed to gear or use leverage, although a Retail Hedge Fund may not have a potential loss of more than 20% of the net asset value of the portfolio, subject to a strict daily exposure risk measure of absolute Value at Risk (aVaR) and if negative losses should ever survive it cannot be recovered from the investor. It is estimated that over 60% of funds have gross exposure of between 150% and 300%.
In 2007 the Financial Services Board started regulating hedge fund managers (requiring that they hold a CAT II A license). After the proposed framework for regulating hedge funds in South Africa was released in 2014, National Treasury and the Financial Services Board released a regulation in 2015, which created a separate pillar for hedge funds under CISCA and hedge funds became classified as CISs in South Africa. As such, the oversight and supervision of these funds are placed with the Financial Services Board. Since then, all hedge funds have been registering in terms of CISCA, and existing funds had to convert to CIS funds 12 months after registration. The Financial Services Board approved the first two hedge fund investment schemes in the first quarter of 2016.22 The regulation established two types of hedge funds, one for qualified investors and another for retail investors. The regulations that the two types of funds have to adhere to differ, with the Retail Investor Hedge Fund (RIHF) regulated more stringently than the Qualified Investor Hedge Fund (QIHF). Currently, most existing hedge funds have been registered at the Financial Services Board, but data reporting will only become due in approximately 1 years’ time. Therefore, for the time being, there are still potential data gaps when measuring hedge funds.
20 According to survey data published by Novare (2015), given that no other aggregated data for hedge funds are currently available. 21 According to a report by Novare, who surveys the industry annually. 22 See http://www.iol.co.za/business/personal-finance/financial-planning/investments/83-hedge-funds-to-become-collective-schemes-2015989.

33
iii. Participation bond schemes
Participation bond schemes are currently the smallest of the available CISs in South Africa, with R1.2 billion assets under management in March 2016 – less than 0.1% of OFI assets. These schemes are similar to a closed-end fund with these licensed schemes pooling money from investors and lending it to institutions/individuals in order to develop or purchase property. A mortgage bond is registered over the property, making the property the security for the loan. This implies that if the property developer does not repay the loan according to the agreement with the scheme, the scheme can take over the property and sell it. The money from the sale can be used to pay back investors. There is no capital growth on the amount invested. Participation bond schemes, normally considered low-risk investments, are also governed by CISCA, with the investment into a participation bond scheme fixed for a minimum period of five years; thus, an investor cannot cancel an investment before five years have passed. In addition, even after five years, an investor can only recuperate an investment when the scheme finds a new investor in its place. However, where possible (mainly in terms of liquidity) and subject to the discretion of the manager, he may retain a basket of participatory interest that may be traded intra the 5-year period.
iv. Other collective investment schemes (excluding money-market funds, hedge funds and participation bond schemes)
The remaining CISs hold the largest amount of assets, and amounted to R1 710 billion in March 2016 – roughly 64% of OFI assets. In order to facilitate analyses, these can be categorised, using their portfolio holdings as a basis, into fixed-income funds, equity funds, real-estate funds, multi-asset funds and fund of funds.23
The fastest growing CIS category is multi-asset funds, which hold 50% of the total CISs assets. Growth of multi-asset funds is supported by both valuation effects and increased inflows, especially since 2011. Multi-asset funds that are regulation 28-compliant, in particular, have grown in popularity since compliant funds can be used for pension savings in vehicles such as retirement annuities. No leveraging is permitted in MMFs, but the other funds displayed in Figure B may use standard listed futures and options for hedging purposes, efficient portfolio management and enhanced returns, but without leveraging the portfolio (subject to regulations).
23 According to the ASISA classification. Note that ETFs are included in ASISA data but categorised according to the securities that the ETF is related to.
34
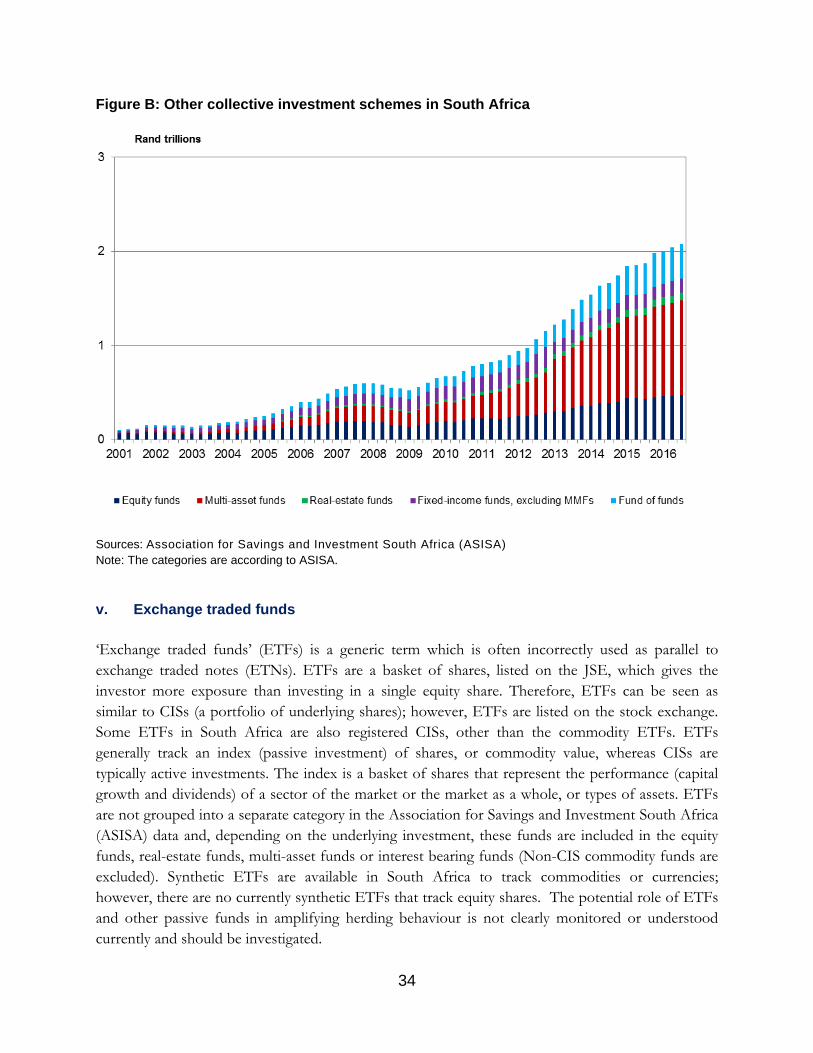
Figure B: Other collective investment schemes in South Africa
Sources: Association for Savings and Investment South Africa (ASISA) Note: The categories are according to ASISA.
v. Exchange traded funds
‘Exchange traded funds’ (ETFs) is a generic term which is often incorrectly used as parallel to exchange traded notes (ETNs). ETFs are a basket of shares, listed on the JSE, which gives the investor more exposure than investing in a single equity share. Therefore, ETFs can be seen as similar to CISs (a portfolio of underlying shares); however, ETFs are listed on the stock exchange. Some ETFs in South Africa are also registered CISs, other than the commodity ETFs. ETFs generally track an index (passive investment) of shares, or commodity value, whereas CISs are typically active investments. The index is a basket of shares that represent the performance (capital growth and dividends) of a sector of the market or the market as a whole, or types of assets. ETFs are not grouped into a separate category in the Association for Savings and Investment South Africa (ASISA) data and, depending on the underlying investment, these funds are included in the equity funds, real-estate funds, multi-asset funds or interest bearing funds (Non-CIS commodity funds are excluded). Synthetic ETFs are available in South Africa to track commodities or currencies; however, there are no currently synthetic ETFs that track equity shares. The potential role of ETFs and other passive funds in amplifying herding behaviour is not clearly monitored or understood currently and should be investigated.

35
The six commodity ETFs in South Africa physically hold bullion in custody to cover 100% of their liabilities, but are not recognised under the CISs as they only track a single asset. In addition, commodities are not recognised as an asset class by CISCA. Similarly, listed ETNs may only be permissible depending on the counterparty quality of the issuer and if the underlying physical assets are those permitted under CISCA. ETNs are not recognised as an asset class by CISCA. Synthetic ETNs would not be permissible. Finance companies Finance companies are non-bank financial intermediaries established in terms of the Companies Act 71 of 2008 with the specific purpose of obtaining funds in various forms and the sole objective of lending or investing these funds again. Microlenders (if incorporated) are also included in this category. This is a diverse group of companies with the maturities of loans extended ranging from a few months (credit extended for retail purchases) to several years (vehicle finance and mortgages). The assets of finance companies have increased over the past decade and at June 2016 the assets amounted to R261 billion. These data were also obtained using surveys and thus there is a potential data gap when measuring assets of finance companies. Given that finance companies extend credit, they are regulated by the National Credit Regulator (NCR) from a market conduct perspective. However, finance companies do not accept deposits and therefore they are not regulated from a macroprudential perspective like banks are, even though the business they conduct possibly involves maturity and liquidity transformation. This creates the opportunity for regulatory arbitrage given that these finance companies do not have to hold capital or adhere to any other of the regulations that banks have to adhere to, apart from being registered as a credit provider. Securitisation Securitisation is used by various bank and non-bank financial intermediaries (including finance companies) in South Africa to increase liquidity and/or reduce the capital requirement. Banks use securitisation to obtain additional funding by selling certain loans to a special purpose vehicle (SPV). Different securitisation structures exist, but generally a basket of loans is sold to an SPV at the purchase price of the loan, and the SPV becomes the registered credit provider under the credit agreement. Payments made by the borrowers are owned by the SPV. Currently the issuance of commercial paper are seen as taking deposits for the general public and therefore all securitisation schemes have to be approved by the South African Reserve Bank (SARB),24 and if the scheme is to be listed, it has to adhere to the listing requirements of the JSE Limited (JSE). The Financial Services
24 Exemption Notice on Securitisation Schemes, Government Gazette No. 30628 dated 1 January 2008, available at: http://www.resbank.co.za/Lists/News%20and%20Publications/Attachments/2734/30628%20sec% 20schemes%202008.pdf.
36
Board guides the JSE on what listing requirements should be included in terms of the Financial Markets Act No 19 of 2012 (section 6).
In order to obtain funding, an SPV issues notes, for example, commercial paper. Generally, these notes are tradable in the capital markets. Securitisation activities in South Africa have decreased over time, with the assets of securitisation instruments traded on the JSE decreasing from R125.7 billion in 2008 to R59 billion in the third quarter of 2016.
Banks also invest in securitisation schemes, often in the assets that the bank themselves have securitised. The amount that banks invested in their own securitisation has increased over time, possibly indicating that there is a limited demand in the market for these schemes In 2008 banks invested in R38 billion worth of securitisation securities, R7.8 billion of which were issues by the same respective bank. In 2015 banks invested R25 billion in securitisation assets, R17 billion of which were their own assets.
Real-estate investment trusts
A real-estate investment trust (REIT) is a term used globally for real-estate investment vehicles. In South Africa, REITs comprise both company REITs (formerly known as property loans stocks) and trust REITs (formerly known as property unit trusts). These trusts use funds, which are raised by issuing investment securities to the public, to purchase real-estate properties and/or real-estate mortgages. South African REITs also invests in offshore commercial properties and are listed on the JSE. Depending on the activities of a REIT, it can be classified as either an equity REIT or a mortgage REIT. An equity REIT invests in and owns mostly commercial real-estate properties, while a mortgage REIT invests in mortgages or mortgage-backed securities, thus either extending credit directly to real-estate owners or indirectly through the acquisition of loans or mortgage-backed securities.25 In South Africa, currently all REITs are equity REITs – effectively companies that own a portfolio of properties, including office buildings, shopping centres and industrial parks. These properties are rented out, and expenses such as maintenance, repairs, rates and taxes are paid from the rental income. If other debt was incurred (e.g. bonds issued) to fund the properties, interest payments are also subtracted from the rental income, which is then distributed among investors. Notwithstanding the JSE Listing Authority, REITs are subject to the REIT legislation particular to the country in which the company is incorporated, the Companies Act as well as their own Articles of Association or the Collective Investment Schemes Control Act. The price of these securities is determined by the forces of demand and supply. Thus, investors are exposed to market risk as well as other risk factors specific to immovable property.
25 SA REITs. For more information see: http://www.sareit.com/

37
Trust companies Trust companies are corporations whose main function is that of trustee administration of trust assets; however, these companies may also extend credit. These loans are mainly in the form of investments in participation mortgage bond schemes and loans extended to, or taken by, beneficiaries of the trusts. Assets under management increased from roughly R18 billion in 2002 to over R63 billion in 2016. Credit extended is only a small percentage of total assets, amounting to R1.4 billion in 2016. These loans are mainly in the form of investment in participation mortgage bond schemes or loans extended to trust beneficiaries. Stokvels A stokvel is a savings club or an association of individuals who make regular contributions to a common pool of savings. This pool of savings is generally then given (fully or partially) to each contributor on a rotational basis. The aim of these savings clubs can vary from buying groceries in bulk at reduced prices or assistance with funeral costs. Generally, stokvels are formed between people with a social connection. Even though stokvels accept monetary investments in a manner similar to banks, stokvels are excluded from the shadow banking measure because they are seen as a savings vehicle (there is an agreement to repay an amount in future). Stokvels are not defined as institutions that grant credit, hence they are not credit intermediaries and therefore this industry does not form part of the shadow banking industry. Furthermore, according to the industry, stokvels often invest in ETFs or interest-bearing CISs, and these funds are already included in the shadow banking measure. Granular data, including the activities and size of stokvels in South Africa over time, are currently not available.
Other forms of non-bank financial intermediation The FSB measures shadow banking according to risks. However, another approach would be to determine how much financial intermediation is occurring outside of the regular banking system irrespective of what kind of risk exists. In South Africa’s case, credit extended by different non-banks (e.g. pension funds, stokvels and PBSs) could be compared to credit extended by banks. Pension funds Pension funds extend credit to their members in the form of savers borrowing against their pension funds. Even though this is a form of credit intermediation, this type of credit extension is not included in the shadow banking measure because it is the saver’s own funds that he/she borrows. This credit extension could, however, be taken into account when measuring the credit extension done by banks versus non-banks.
38
Foreign domiciled CISs Foreign-based CISs have to be approved by the Financial Services Board before they are allowed to solicit business from South Africans. Once approved, these foreign funds may be marketed, promoted and advertised in South Africa subject to South African regulations pertaining to disclosure, marketing and advertising. However, South Africans are free to invest in any CISs domiciled abroad of their own volition and provided that their investment has not been solicited by an unapproved fund. South Africans’ investments into foreign-based CISs are not included in this study.
Cooperative banks There are two cooperative banks registered in South Africa with outstanding loans amounting to roughly R60 million (which grew from approximately R10 million in the past 10 years). Other large cooperative banks that qualify to register, but have not yet, have loans of R140 million outstanding, but these cooperative banks are regulated and hence do not form part of the shadow banking system.

39
Abbreviations
ASISA Association for Savings and Investment South Africa
CDS credit default swap
CIS collective investment scheme
CISCA Collective Investment Schemes Control Act 45 of 2002
EF economic function
ETF exchange traded fund
ETN exchange traded note
FDIC Federal Deposit Insurance Corporation
Fed US Federal Reserve
FSB Financial Stability Board
G-20 Group of Twenty
IMF International Monetary Fund
JSE JSE Limited
MMF money-market fund
MMMF money-market mutual fund
MUNFI monitoring universe of non-bank financial intermediaries
NSFR net stable funding ratio
OFI other financial intermediary
P2P peer-to-peer
PA Prudential Authority
PBS participation bond scheme
REIT real-estate investment trust
repo repurchase
SARB South African Reserve Bank
SPI special purpose instrument
SPV special purpose vehicle
US United States