SOUTH AFRICAN BUREAU OF STANDARDS · SOUTH AFRICAN BUREAU OF STANDARDS 2014/15 Q4 Report to the...
25
SOUTH AFRICAN BUREAU OF STANDARDS 2014/15 Q4 Report to the Parliamentary Portfolio Committee on Trade & Industry 18 th August 2015 CELEBRATING 70 YEARS OF QUALITY ASSURANCE
-
Upload
duonghuong -
Category
Documents
-
view
222 -
download
0
Transcript of SOUTH AFRICAN BUREAU OF STANDARDS · SOUTH AFRICAN BUREAU OF STANDARDS 2014/15 Q4 Report to the...

SOUTH AFRICAN BUREAU OF STANDARDS 2014/15 Q4 Report to the Parliamentary Portfolio Committee on
Trade & Industry 18th August 2015
CELEBRATING 70 YEARS OF QUALITY ASSURANCE

1. INTRODUCTION
2. OPERATIONAL HIGHLIGHTS 2014/15
3. PERFORMANCE VS PREDETERMINED OBJECTIVES
4. FINANCIAL PERFORMANCE
CONTENTS
Q4 REPORT 2014/15
CELEBRATING 70 YEARS OF QUALITY ASSURANCE

SABS CONFIDENTIAL
RENEWAL AFTER 65 YEARS OF REGULATORY • The SABS was established in terms of the Standards Act, 1945 (Act
No. 24 of 1945) • In 2008, the regulatory function of the SABS was removed -
Standards Act No. 8 of 2008 and NRCS Act of 2008

Sub headline
~1100 Employees
~130 Standards Development
~400 Laboratories
~350 Certification
~50 Training & Design Institute
~150 Corporate Services
SOLID FOUNDATION : 70 YEARS
~ 100 Contract Employees


Sub headline
Roles – International Platforms
SABS has customers in many countries and has key stakeholders that span the region, continent and the world.

Government
Services
Design Institute
Standards
Development
Training
Testing
Certification
75% - Services income 25% - Gov. Grant
FULL VALUE CHAIN OF SERVICES

Sub headline
ISO Council
New CASCO Chair
ARSO Council
IEC Council SADCSTAN Secretariat ISO TMB
Roles – International Platforms

OPERATIONAL INDICATORS Q4 REPORT 2014/15
CELEBRATING 70 YEARS OF QUALITY ASSURANCE

AUDITOR GENERAL’S REPORT Q4 REPORT 2014/15
CELEBRATING 70 YEARS OF QUALITY ASSURANCE
THE SABS HAS ACHIEVED A CLEAN AUDIT FOR THE 2014/15 PERFORMANCE YEAR
FOR
THE THIRD CONSECUTIVE YEAR

Annual growth in revenue increased by 8% compared to only 6% in the previous year
Expenditure increased by 5% as compared to the increase of 10% in the previous year
OPERATIONAL INDICATORS Q4 REPORT 2014/15
CELEBRATING 70 YEARS OF QUALITY ASSURANCE
8%
6%
5%
10%
0%
2%
4%
6%
8%
10%
12%
2014/15 2013/14
Revenue Expenditure

Number of SMME beneficiaries of the Design Institute programme
Published home- grown standards
OPERATIONAL INDICATORS Q4 REPORT 2014/15
CELEBRATING 70 YEARS OF QUALITY ASSURANCE
20
45
25
58
0
10
20
30
40
50
60
70
2013/14 2014/15
Target Achieved
179
225 219 232
0
50
100
150
200
250
2013/14 2014/15
Target Achieved

PERFORMANCE VS PREDETERMINED
OBJECTIVES Q4 REPORT 2014/15
CELEBRATING 70 YEARS OF QUALITY ASSURANCE

An overall achievement of 81% (13 out of 16) of performance indicators in the business plan
OPERATIONAL INDICATORS Q4 REPORT 2014/15
CELEBRATING 70 YEARS OF QUALITY ASSURANCE

STRATEGIC OBJECTIVE: GROWTH Q4 REPORT 2014/15
CELEBRATING 70 YEARS OF QUALITY ASSURANCE
OUTPUT INDICATOR (S) 2014/15
Target Actual Comment on variance
Revenue Sales revenue (million)
Operating profit
580.2
3.7%
569.1
2.4%
Lower volumes (except Certification)
Revenue shortfall exerted
dampening effect
New Certification scheme
2 New schemes by
year end
Two
Two
Target met
New Training courses
3 New courses by
year end
Three
Three
Target met
Home Grown Standards
Number published
225
232
Target exceeded

STRATEGIC OBJECTIVE: PRODUCTIVITY Q4 REPORT 2014/15
CELEBRATING 70 YEARS OF QUALITY ASSURANCE
Output Indicator (s)
2014/15
Target Actual Comment on variance
Increase in compulsory specifications that can be
tested at SABS
Percentage that can be tested fully
80% 80% Target met
Implementation of Laboratory Information Management
System (LIMS)
Percentage of
laboratories (36) on LIMS
100%
86%
Technical problems,
particularly in remote
laboratories
Reduced time for publication of standards
Number of days required
< 400
398
Target exceeded
Modernisation of laboratory facilities
Number of laboratories that are fully functional in the
new building
9
9
Target met

STRATEGIC OBJECTIVE: CUSTOMER/ STAKEHOLDER Q4 REPORT 2014/15
CELEBRATING 70 YEARS OF QUALITY ASSURANCE
Output Indicator (s)
2014/15
Target Actual Comment on variance
An improvement in customer and stakeholder relations
Implementation of the actions in the customer & brand surveys Number of laboratories on the new CRM platform
80%
10
90%
15
Target exceeded Target exceeded
Development of SMMEs Number of SMMEs for whom projects were developed and implemented
25
58
Target exceeded
E-Committees that fully use the installed modules of the e-committee portal
Number of committees 80%
83%
Target exceeded

STRATEGIC OBJECTIVES: COMPETENT & EMPOWERED EMPLOYEES
CELEBRATING 70 YEARS OF QUALITY ASSURANCE
Output Indicator (s)
2014/15
Target Actual Comment on variance
Graduate & student internship programmes
Number of graduates/ students on the internship programme intake
10
11
Target exceeded
Leadership development programmes
Number of managers who successfully complete a leadership development programme
50
59
Target exceeded
Workforce capacity Vacancy rate of identified critical positions (out of total employee complement)
< 7%
< 3.4%
Target exceeded

FINANCIAL PERFORMANCE Q4 REPORT 2014/15
CELEBRATING 70 YEARS OF QUALITY ASSURANCE

Revenue growth 8% for the full year
Total Expenses increased by 5% for the year
Employee benefits increased by 12% for the year as result of the three year NEHAWU agreement
Net profit of R32.2 million, 48% higher than prior year
Total assets increased by R44 million
Property, Plant and Equipment increased by R15 million
FINANCIAL OVERVIEW Q4 REPORT 2014/15
CELEBRATING 70 YEARS OF QUALITY ASSURANCE

INCOME STATEMENT Q4 REPORT 2014/15
CELEBRATING 70 YEARS OF QUALITY ASSURANCE
SABS GROUP
ACTUAL PRIOR YEAR
Var to
LYR DIVISIONAL INCOME STATEMENT ACTUAL PRIOR YEAR
Var to
LYR
Rm Rm % Month: MARCH 2015 Rm Rm %
172.2 160.3 7% Revenue 569.1 523.5 9%
51.8 44.8 16% Tests and services 178.2 173.1 3%
5.3 -0.6 -939% Rental Income 10.8 6.7 62%
3.6 4.1 -13% Training 13.8 16.1 -15%
91.9 88.8 4% Product and system certification 325.3 289.4 12%
11.7 15.1 -22% Design Institute Services 15.5 15.1 3%
7.9 8.2 -4% Sale of publications 25.5 23.1 11%
48.3 44.9 7% Core funding 193.1 179.8 7%
4.4 14.2 -69% Other income 14.8 25.2 -41%
224.9 219.5 2% Total income 777.0 728.4 7%
-199.5 -190.3 -5% Total Expenses -766.8 -730.2 -5%
-125.6 -105.7 -19% Employee Costs -474.0 -422.9 -12%
-64.0 -74.0 13% Other Expenses -255.4 -276.7 8%
-12.8 -13.5 5% Depreciation -47.9 -42.2 14%
2.9 2.9 3% Government grants in respenct of assets 10.5 11.6 -10%
25.4 29.2 Profit/ (loss) before interest and tax 10.2 -1.8
5.4 7.2 -25% Investment income 22.5 23.2 -3%
30.8 36.4 -15% Profit/ (loss) before corporate charges and tax 32.7 21.3 53%
-0.5 0.4 -222% Taxation -0.5 0.4 -222%
30.3 36.8 -18% Net profit/ (loss) for the period 32.2 21.7 48%
QUARTER YTD
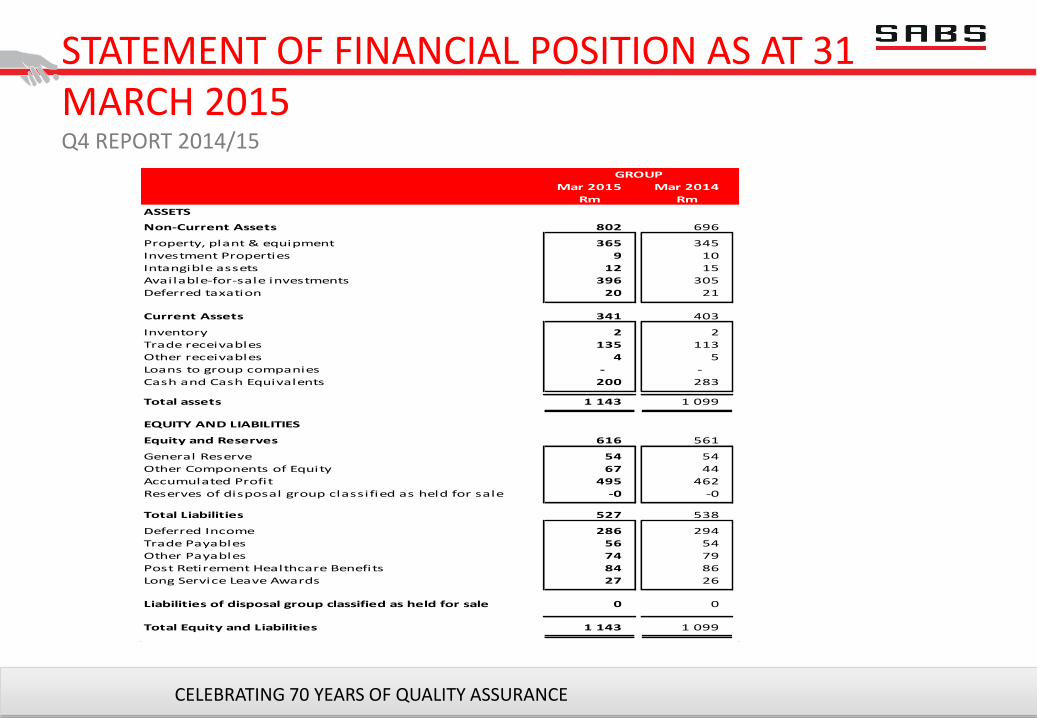
STATEMENT OF FINANCIAL POSITION AS AT 31 MARCH 2015 Q4 REPORT 2014/15
CELEBRATING 70 YEARS OF QUALITY ASSURANCE
Mar 2015 Mar 2014
Rm Rm
ASSETS
Non-Current Assets 802 696
Property, plant & equipment 365 345
Investment Properties 9 10
Intangible assets 12 15
Available-for-sale investments 396 305
Deferred taxation 20 21
Current Assets 341 403
Inventory 2 2
Trade receivables 135 113
Other receivables 4 5
Loans to group companies - -
Cash and Cash Equivalents 200 283
Total assets 1 143 1 099
EQUITY AND LIABILITIES
Equity and Reserves 616 561
General Reserve 54 54
Other Components of Equity 67 44
Accumulated Profit 495 462
-0 -0
Total Liabilities 527 538
Deferred Income 286 294
Trade Payables 56 54
Other Payables 74 79
Post Retirement Healthcare Benefits 84 86
Long Service Leave Awards 27 26
0 0
Total Equity and Liabilities 1 143 1 099
GROUP
Reserves of disposal group classified as held for sale
Liabilities of disposal group classified as held for sale

CHALLENGES Q4 REPORT 2014/15
CELEBRATING 70 YEARS OF QUALITY ASSURANCE
Risk of Treasury MTEF reduction in future
0
200
400
600
800
1000
1200
2014/15 2015/16 2016/17 2017/18
R m
illio
n
Grant Total Income Employee benefits
25% 23% 21% 24% 600
650
700
750
800
850
900
2012/13Actual
2013/14Actual
2014/15Forecast
2015/16Budget
R m
illio
n
SABS Income and Expense - 4 year Trend
Total Income Total Expenses
Revenue growth has been slow. With increases in expenses (especially employee benefits), the revenue gap widens
Baseline cut

Role of the National Standards Bodies Q4 REPORT 2014/15
CELEBRATING 70 YEARS OF QUALITY ASSURANCE
Are we optimally used in the economy?

THANK YOU
70 YEARS – GIVING YOU THE QUALITY EDGE