SOURCES, PATHWAYS, AND RELATIVE RISKS OF … · sources, pathways, and relative risks of...
142
SOURCES, PATHWAYS, AND RELATIVE RISKS OF CONTAMINANTS IN SURFACE WATER AND GROUNDWATER: A PERSPECTIVE PREPARED FOR THE WALKERTON INQUIRY Len Ritter, Keith Solomon, Paul Sibley Centre for Toxicology, Canadian Network of Toxicology Centres, and Department of Environmental Biology, University of Guelph, Guelph, Ontario, Canada Ken Hall, Patricia Keen, Gevan Mattu Institute for Resources and Environment, The University of British Columbia, Vancouver, British Columbia, Canada Beth Linton Biology Department, University of Waterloo, Waterloo, Ontario, Canada On a global scale, pathogenic contamination of drinking water poses the most signifi- cant health risk to humans, and there have been countless numbers of disease out- breaks and poisonings throughout history resulting from exposure to untreated or poorly treated drinking water. However, significant risks to human health may also result from exposure to nonpathogenic, toxic contaminants that are often globally ubiquitous in waters from which drinking water is derived. With this latter point in mind, the objec- tive of this commission paper is to discuss the primary sources of toxic contaminants in surface waters and groundwater, the pathways through which they move in aquatic environments, factors that affect their concentration and structure along the many trans- port flow paths, and the relative risks that these contaminants pose to human and envi- ronmental health. In assessing the relative risk of toxic contaminants in drinking water to humans, we have organized our discussion to follow the classical risk assessment paradigm, with emphasis placed on risk characterization (see Figure 1). In doing so, we have focused predominantly on toxic contaminants that have had a demonstrated or potential effect on human health via exposure through drinking water. In the risk assessment process, understanding the sources and pathways for contaminants in the environment is a cru- cial step in addressing (and reducing) uncertainty associated with estimating the likeli- hood of exposure to contaminants in drinking water. More importantly, understanding the sources and pathways of contaminants strengthens our ability to quantify effects through accurate measurement and testing, or to predict the likelihood of effects based on empirical models. Understanding the sources, fate, and concentrations of chemicals in water, in conjunction with assessment of effects, not only forms the basis of risk char- acterization, but also provides critical information required to render decisions regard- ing regulatory initiatives, remediation, monitoring, and management. 1 Journal of Toxicology and Environmental Health, Part A, 65:1–142, 2002 Copyright© 2002 Taylor & Francis 1528-7394 /02 $12.00 + .00 The authors extend sincere appreciation to Hugh Scobie, Stacey Smith, and Erin Smith for con- tributions to writing, editing, and construction of graphs and tables. Address correspondence to Paul K. Sibley, Department of Environmental Biology, University of Guelph, Guelph, ON, Canada N1G 2W1. E-mail: [email protected]
Transcript of SOURCES, PATHWAYS, AND RELATIVE RISKS OF … · sources, pathways, and relative risks of...

SOURCES, PATHWAYS, AND RELATIVE RISKS OF CONTAMINANTS IN SURFACE WATER AND GROUNDWATER: A PERSPECTIVE PREPARED FOR THE WALKERTON INQUIRY
Len Ritter, Keith Solomon, Paul Sibley
Centre for Toxicology, Canadian Network of Toxicology Centres, andDepartment of Environmental Biology, University of Guelph, Guelph,Ontario, Canada
Ken Hall, Patricia Keen, Gevan Mattu
Institute for Resources and Environment, The University of BritishColumbia, Vancouver, British Columbia, Canada
Beth Linton
Biology Department, University of Waterloo, Waterloo, Ontario, Canada
On a global scale, pathogenic contamination of drinking water poses the most signifi-cant health risk to humans, and there have been countless numbers of disease out-breaks and poisonings throughout history resulting from exposure to untreated or poorlytreated drinking water. However, significant risks to human health may also result fromexposure to nonpathogenic, toxic contaminants that are often globally ubiquitous inwaters from which drinking water is derived. With this latter point in mind, the objec-tive of this commission paper is to discuss the primary sources of toxic contaminants insurface waters and groundwater, the pathways through which they move in aquaticenvironments, factors that affect their concentration and structure along the many trans-port flow paths, and the relative risks that these contaminants pose to human and envi-ronmental health.
In assessing the relative risk of toxic contaminants in drinking water to humans,we have organized our discussion to follow the classical risk assessment paradigm, withemphasis placed on risk characterization ( see Figure 1) . In doing so, we have focusedpredominantly on toxic contaminants that have had a demonstrated or potential effecton human health via exposure through drinking water. In the risk assessment process,understanding the sources and pathways for contaminants in the environment is a cru-cial step in addressing (and reducing) uncertainty associated with estimating the likeli-hood of exposure to contaminants in drinking water. More importantly, understandingthe sources and pathways of contaminants strengthens our ability to quantify effectsthrough accurate measurement and testing, or to predict the likelihood of effects basedon empirical models. Understanding the sources, fate, and concentrations of chemicalsin water, in conjunction with assessment of effects, not only forms the basis of risk char-acterization, but also provides critical information required to render decisions regard-ing regulatory initiatives, remediation, monitoring, and management.
1
Journal of Toxicology and Environmental Health, Part A, 65:1–142, 2002Copyright© 2002 Taylor & Francis1528-7394 /02 $12.00 + .00
The authors extend sincere appreciation to Hugh Scobie, Stacey Smith, and Erin Smith for con-tributions to writing, editing, and construction of graphs and tables.
Address correspondence to Paul K. Sibley, Department of Environmental Biology, University ofGuelph, Guelph, ON, Canada N1G 2W1. E-mail: [email protected]

Our discussion is divided into two primary themes. First we discuss the majorsources of contaminants from anthropogenic activities to aquatic surface and groundwaterand the pathways along which these contaminants move to become incorporated intodrinking water supplies. Second, we assess the health significance of the contaminantsreported and identify uncertainties associated with exposures and potential effects.
Loading of contaminants to surface waters, groundwater, sediments, and drinkingwater occurs via two primary routes: (1) point-source pollution and (2) non-point-sourcepollution. Point-source pollution originates from discrete sources whose inputs intoaquatic systems can often be defined in a spatially explicit manner. Examples of point-source pollution include industrial effluents (pulp and paper mills, steel plants, food pro-cessing plants) , municipal sewage treatment plants and combined sewage–storm-wateroverflows, resource extraction (mining) , and land disposal sites ( landfill sites, industrialimpoundments) . Non-point-source pollution, in contrast, originates from poorly defined,diffuse sources that typically occur over broad geographical scales. Examples of non-point-source pollution include agricultural runoff (pesticides, pathogens, and fertilizers) ,storm-water and urban runoff, and atmospheric deposition (wet and dry deposition ofpersistent organic pollutants such as polychlorinated biphenyls [PCBs] and mercury) .
Within each source, we identify the most important contaminants that have eitherbeen demonstrated to pose significant risks to human health and/ or aquatic ecosystemintegrity, or which are suspected of posing such risks. Examples include nutrients, metals,pesticides, persistent organic pollutants (POPs) , chlorination by-products, and pharma-ceuticals. Due to the significant number of toxic contaminants in the environment, wehave necessarily restricted our discussion to those chemicals that pose risks to humanhealth via exposure through drinking water. A comprehensive and judicious considerationof the full range of contaminants that occur in surface waters, sediments, and drinkingwater would be a large undertaking and clearly beyond the scope of this article. How-ever, where available, we have provided references to relevant literature to assist thereader in undertaking a detailed investigation of their own.
The information collected on specific chemicals within major contaminant classeswas used to determine their relative risk using the hazard quotient (HQ) approach.Hazard quotients are the most widely used method of assessing risk in which the expo-sure concentration of a stressor, either measured or estimated, is compared to an effectconcentration (e.g., no-observed-effect concentration or NOEC) . A key goal of this assess-ment was to develop a perspective on the relative risks associated with toxic contaminantsthat occur in drinking water. Data used in this assessment were collected from literaturesources and from the Drinking Water Surveillance Program (DWSP) of Ontario. For manycommon contaminants, there was insufficient environmental exposure (concentration) in-formation in Ontario drinking water and groundwater. Hence, our assessment was limitedto specific compounds within major contaminant classes including metals, disinfection by-products, pesticides, and nitrates. For each contaminant, the HQ was estimated by ex-pressing the maximum concentration recorded in drinking water as a function of the waterquality guideline for that compound.
There are limitations to using the hazard quotient approach of risk characterization.For example, HQs frequently make use of worst-case data and are thus designed to beprotective of almost all possible situations that may occur. However, reduction of theprobability of a type II error ( false negative) through the use of very conservative applica-tion factors and assumptions can lead to the implementation of expensive measures ofmitigation for stressors that may pose little threat to humans or the environment. It is im-portant to realize that our goal was not to conduct a comprehensive, in-depth assessmentof risk for each chemical; more comprehensive assessments of managing risks associatedwith drinking water are addressed in a separate issue paper by Krewski et al. (2001a) .Rather, our goal was to provide the reader with an indication of the relative risk of majorcontaminant classes as a basis for understanding the risks associated with the myriadforms of toxic pollutants in aquatic systems and drinking water.
2 L. RITTER ET AL.

For most compounds, the estimated HQs were <1. This indicates that there is littlerisk associated with exposure from drinking water to the compounds tested. There weresome exceptions. For example, nitrates were found to commonly yield HQ values wellabove 1 in many rural areas. Further, lead, total trihalomethanes, and trichloroacetic acidyielded HQs >1 in some treated distribution waters (water distributed to households) .These latter compounds were further assessed using a probabilistic approach; theseassessments indicated that the maximum allowable concentrations (MAC) or interimMACs for the respective compounds were exceeded <5% of the time. In other words, theprobability of finding these compounds in drinking water at levels that pose risk tohumans through ingestion of drinking water is low.
Our review has been carried out in accordance with the conventional principlesof risk assessment. Application of the risk assessment paradigm requires rigorous dataon both exposure and toxicity in order to adequately characterize potential risks of con-taminants to human health and ecological integrity. Weakness rendered by poor data,or lack of data, in either the exposure or effects stages of the risk assessment processsignificantly reduces the confidence that can be placed in the overall risk assessment.
Overall, while our review suggested selected instances of potential risks to humanhealth from exposure to contaminants in drinking water, we also noted a distinct paucityof information on exposure levels for many contaminants in this matrix. We suggest thatthis represents a significant limitation to conducting sound risk assessments and intro-duces considerable uncertainty with respect to the management of water quality. In thiscontext, future research must place greater emphasis on targeted monitoring and assess-ment of specific contaminants (e.g., pharmaceuticals) in drinking water for which thereis currently little information. This could be conducted using a tiered risk approach,beginning with, for example, a hazard quotient assessment. Potentially problematiccompounds identified in these preliminary assessments would then be subjected tomore comprehensive risk assessments using probabilistic methods, if sufficient data existto do so. On this latter point, adequate assessment of potential risks for many contami-nants in drinking water is currently limited by a paucity of toxicological information.Generating this important information is a critical research need and would reduce theuncertainty associated with conducting risk assessments.
When contamination of water supplies leads to tragic events as it did inWalkerton, Ontario, we are reminded of the complacency with which weview and treat our water. Of all the natural resources necessary to ensurehuman health and civilization, water is one of the most important (Gibbons,1986). Yet astonishingly, in North America we have a remarkable history oftaking both the supply and quality of water for granted. For example, withthe exception of trihalomethanes and important pathogenic organisms suchas Escherichia coli, the monitoring of chemicals in drinking water suppliesin Ontario and Canada varies considerably from municipality to municipal-ity, and many chemicals, such as pesticides are monitored very infrequently,often as little as once per year (Government of Canada, 1991). At present,there is no coordinated monitoring program for private wells in Ontario;monitoring of private wells for pollutants is left entirely up to the home-owner.
The importance and seriousness of our present situation with respectto issues surrounding the management of both water quality and quantitywere recently emphasized in the publication of the agenda-setting bookThe Freshwater Imperative (Naiman et al., 1995):
SOURCES, PATHWAYS, AND RISKS OF CONTAMINANTS IN WATER 3

Changes in the distribution, abundance, and quality of water and fresh-water resources in this century represent a strategic threat to the qualityof human life, the environmental sustainability of the biosphere, and theviability of human cultures. The United States is facing, in a real sense, afreshwater imperative. (p. 1)
Although this quote makes reference to state of water resources in theUnited States, its disposition, sense of urgency, and implications for thefuture research and management of water resources are equally applica-ble for Canada and other countries of the world. Indeed, it is probablyfair to suggest that jurisdictional and economic issues pertaining to waterquantity and quality will demand global attention in the 21st century in amanner and intensity greater than those induced by petroleum productsin the 20th century.
Most Canadians perceive Canada as a land with an abundant supply offresh water, and this perception is reflected in our daily use patterns. Interms of total water use, the average Canadian drew approximately 4500 Lper person per day; in terms of personal use, we drew 340 L per person perday (Government of Canada, 1996). On a global basis, we rank secondonly to the United States in our per capita use of water for all purposes. Incomparison, per capita water use by Europeans is approximately half thatof Canadians. Approximately three-quarters of water used for drinking pur-poses in Canada and Ontario originates from surface waters. With a fewnotable exceptions (e.g., Kitchener–Waterloo, Ontario), drinking water inurban and suburban centers originates almost exclusively from treated sur-face water. Groundwater serves as the primary source of drinking water forapproximately 7.9 million people (about 26%) of Canadians, with approxi-mately two-thirds (5 million) living in rural areas (Environment Canada,2000a). In Ontario, close to 30% of residents rely on groundwater as asource of drinking water (Goss et al., 1998). Groundwater not only servesas the primary source of drinking water in rural areas but is also used exten-sively for important agricultural practices such as irrigation and livestockwatering.
We have been charged with the task of identifying and describing thesources and pathways of toxic contaminants in surface water and ground-water and providing perspective on the relative risks that these compoundspose to human health and ecosystem integrity. This is a significant under-taking in light of the large number of toxic contaminants known to occur insurface water and groundwater.
Why examine issues of water contamination by toxic chemicals whenthe tragic events of Walkerton occurred as a result of pathogenic contami-nation? Pathogenic contamination of water arguably represents the mostsignificant risk to human health on a global scale, and there have beencountless numbers of poisonings and disease outbreaks throughout historyresulting from poorly treated or untreated water. Issues surrounding the his-
4 L. RITTER ET AL.

tory of disease outbreaks in Ontario are discussed in a separate issuepaper by Krewski et al. (2001b).* However, significant risks to humanhealth may also result from exposure to nonpathogenic, toxic contami-nants in drinking water. Indeed, many chemicals have been identifiedfrom surface and groundwater resources that serve as the primary sourceof drinking water throughout North America and Canada (Larson et al.,1997; Nowell et al., 1999; Allen et al., 1993; Gustafson, 1993). Many ofthese chemicals occur at low levels and do not pose significant risks tohuman health. However, others are known or suspected carcinogens andsome have been implicated as causative agents of endocrine disruption,potentially causing developmental and reproductive problems in humansand aquatic organisms (National Research Council [NRC], 1999). Aquaticecosystem integrity may also be significantly compromised by the occur-rence of toxic pollutants in surface waters and sediments. Viewed in thiscontext, the scientific and philosophical implications of the WalkertonInquiry for water quality issues in Ontario and other jurisdictions extendfar beyond the catalyst issue of pathogenic contamination and its associ-ated risks to human health. In short, the Walkerton Inquiry provides anexcellent opportunity to discuss all issues pertaining to water quality inOntario and, in doing so, to provide a more holistic perspective on thiscritical subject.
An important theme throughout the ensuing discussion is our consid-eration of both human and environmental health issues; these must betreated in full recognition of their intimate connectivity, not as separateentities. For example, many of the sources and pathways of chemicalsthat have the potential to compromise human health are the same as, orshared with, those that compromise the health of aquatic ecosystems. Infact, many parallels have been drawn between human and ecosystemhealth with respect to diagnosis and risk assessment (Schaeffer et al., 1988;Rapport, 1989), even though the merits of doing so have been debated atlength (Suter, 1993; Lancaster, 2000). If nothing else, the debate hasbrought much needed attention to the intimate relationship that existsbetween the state of our environment and the relative health of humansand ecosystems, to the extent that we must concede that a stressed envi-ronment is much more likely to be manifest in the poor condition of itsinhabitants than a healthy one.
The list of substances that have been identified from surface waters,groundwater, and sediments of North America is long. For many chemicals(e.g., DDT, polychlorinated biphenyls [PCBs]), the sources, environmentalchemodynamics, and toxicological implications for human and aquaticecological health have been well studied, although not necessarily wellunderstood. Through numerous pathways, many of these chemicals find
SOURCES, PATHWAYS, AND RISKS OF CONTAMINANTS IN WATER 5
*Commissioned issue papers for the Walkerton Inquiry can be viewed and downloaded from theofficial Walkerton Inquiry web site at www.walkertoninquiry.com.

there way into drinking water. A list of the toxic chemicals identified inCanadian drinking water is presented in Table A1 (Appendix), along withdescriptions of their uses, sources, and toxicity. This list is not complete.Information for many chemicals is lacking, and old chemicals may be“rediscovered” when they are found to pose risks in new ways. This is illus-trated by the emergence of the endocrine disruption hypothesis, in which ithas been hypothesized that many well-studied chemicals, under appropri-ate conditions of exposure, can cause developmental and reproductiveproblems in wildlife and humans (Colborn et al., 1996). Moreover, newcontaminants continue to appear, presenting new problems for which datamust be collected. For example, pharmaceuticals have been discharged toaquatic environments in sewage effluents for many years, but only recentlyhave their environmental fate, distribution, and potential risks to humansand ecosystems begun to receive scientific scrutiny (Daughton & Ternes,1999). A similar scenario exists for fluorinated surfactants, a large class ofcompounds that are common constituents of many consumer products.Like pharmaceuticals, these compounds have existed for many years, butonly recently, following the discovery that some members of this class arehighly persistent, have they attracted the attention of environmental scien-tists with respect to distribution and environmental toxicity. Compounds inthese novel classes are not currently monitored in drinking water, so poten-tial human exposure from this route is unknown.
Gaining an adequate understanding of the risks to human health andecosystem integrity associated with impaired water quality requires a thor-ough consideration of the spectrum of pollutants that contaminate water,including pathogens. Bringing light to this fact is one of the goals of thisarticle. However, it must also be kept in mind that the number of chemi-cals that have been identified from aquatic environments and drinkingwater is large, such that a detailed consideration of the sources, pathways,and potential risks for each is not possible. Thus, to facilitate a focused re-view, we restrict our discussion primarily to toxic contaminants that havehad a demonstrated or potential effect on humans through drinking water.Some of these are listed in Table A1. In doing so, we only briefly considersources and pathways and relative risks of pathogens originating in water,as these are addressed in greater detail in separate papers submitted to thecommission (Goss et al., 2001; Reilly, 2001). In addition, apart from someexamples for selected contaminant classes, we do not address issues ofcontaminant remediation and management. While we recognize that thisis a critical aspect of the risk assessment process, it is a substantive subjectthat itself could form the basis of a commission paper. Interested readerscan obtain information on remediation and management technologiesfrom U.S. Environmental Protection Agency (EPA) (2000b).
In assessing the sources, pathways, and relative risks of the various toxiccontaminants that occur in drinking water, we follow the classical risk
6 L. RITTER ET AL.
assessment framework outlined in Figure 1. This model is widely acceptedinternationally as the basis for the expression of risk and informed decisionmaking on a wide array of chemicals such as pesticides, metals, therapeu-tic drugs, and other environmental contaminants (National Academy ofSciences, 1983). The key components of this risk-assessment frameworkare hazard identification, dose-response (effects) evaluation, exposure(sources/pathways) evaluation, and risk characterization. The last step isimportant as it brings together information from the three preceding stepsto determine the probability of an adverse effect under defined exposureconditions.
SOURCES, PATHWAYS, AND RISKS OF CONTAMINANTS IN WATER 7
FIGURE 1. Risk assessment framework developed by National Academy of Sciences (1983).

8 L. RITTER ET AL.
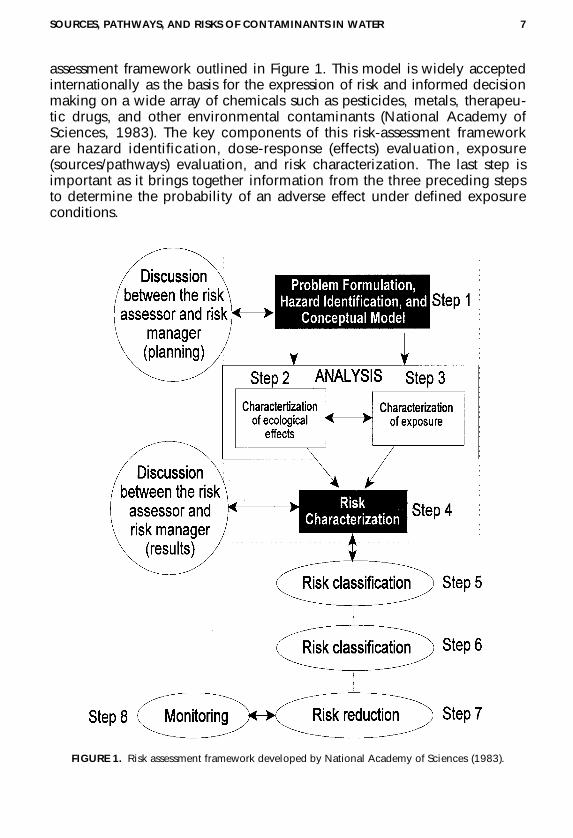
TABLE 1. Major Point Sources and Nonpoint-Sources of Contaminants to Surface Waters, Ground-water, and Sediments
Source Explanation Types of contaminants
Point sources
Industrial Process effluents from pulp Organochlorines, metals, dyes, and paper mills, chemical BODmanufacturers, steel and metal product manufacturers, textile manufacturers, food processing plants
Municipal (sewage Publicly owned sewage Metals, pharmaceuticals, treatment plants) treatment plants that may antimicrobials, nutrients
receive indirect discharges from industrial facilities or businesses
Combined sewer overflows Sewage treatment facilities or Pathogens, metals, polycyclicsingle facilities that treat both aromatic hydrocarbons storm water and sanitary (PAHs), sedimentsewage, which may become overloaded during storm events and discharge untreated wastes into surface waters
Resource extraction Mining, petroleum drilling, Metals, PAHs, acidityrunoff from mine tailing sites
Land disposal Leachate or discharge from Pathogens, nitrates, hazardousseptic tanks, landfills, chemicalsindustrial impoundments, and hazardous waste sites
Nonpoint sources
Agricultural Crop production, pastures, Pesticides, nutrients, pathogens, rangeland, feedlots, animal sedimentoperations
Storm sewers/urban runoff Runoff from impervious PAHs, sediments, pesticides, surfaces including streets, pathogens, metalsparking lots, buildings, roof, and other paved areas
Silvicultural/forestry Forest, crop, and pest Pesticides, sedimentationmanagement, tree harvesting, logging, road construction
Atmospheric deposition Emissions from industrial stacks Persistent organic (lipophilic) and municipal incinerators, and polar pollutants (POPs pesticide applications and PPOPs), metals
Other sources
Construction Land development, road Export of sediment/soils and construction nutrients
OBJECTIVES
With this background and associated caveats in mind, the objectivesof our issue paper are:
1. To identify and describe key point and nonpoint sources (environmen-tal loading) of contaminants to surface waters, the environmentalpathways through which contaminants move in aquatic environments(surface water and groundwater), and the mechanisms that act to mod-ify their concentration or chemical structure as they are transportedalong these flow paths. A key goal in this discussion is to identify thetypes of toxic contaminants in drinking water and to describe howthey came to be present in this matrix.
2. To assess the probability of exposure to the various contaminant classesby humans and aquatic biota in relation to the sources/pathways.
3. To assess the relative risk of selected contaminants that have had ademonstrated or potential effect on human health via drinking waterusing the hazard quotient approach.
4. To identify important information gaps and research needs and pro-vide prioritized recommendations for future research and managementof toxic contaminants in Canada’s water resources.
SOURCES AND PATHWAYS OF CONTAMINANTS IN AQUATIC SYSTEMS AND DRINKING WATERAnthropogenic and natural contaminants that occur in surface waters,
groundwater, sediments, and ultimately in drinking water originate fromtwo primary source categories: (1) point-source pollution and (2) non-point-source pollution (Table 1). Point-source contributions of contaminants origi-nate from discrete sources whose inputs into aquatic systems and can often
SOURCES, PATHWAYS, AND RISKS OF CONTAMINANTS IN WATER 9
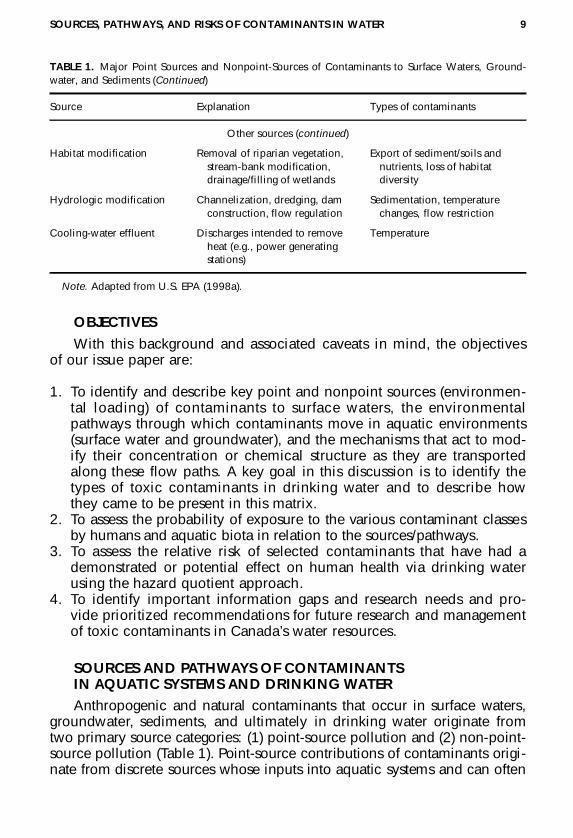
TABLE 1. Major Point Sources and Nonpoint-Sources of Contaminants to Surface Waters, Ground-water, and Sediments (Continued)
Source Explanation Types of contaminants
Other sources (continued)
Habitat modification Removal of riparian vegetation, Export of sediment/soils and stream-bank modification, nutrients, loss of habitat drainage/filling of wetlands diversity
Hydrologic modification Channelization, dredging, dam Sedimentation, temperature construction, flow regulation changes, flow restriction
Cooling-water effluent Discharges intended to remove Temperatureheat (e.g., power generating stations)
Note. Adapted from U.S. EPA (1998a).

be defined in a spatially explicit manner through measurement of chemicalresidues (in water, sediments, or affected species) and/or epidemiologicalfactors associated with varying incidences of morbidity, mortality, or com-munity disruption (Kleinow & Goodrich, 1994). Examples of point-sourcepollution include industrial effluents (pulp and paper mills, steel plants,food processing plants), municipal sewage treatment plants and combinedsewage–storm-water overflows, resource extraction (mining), and land dis-posal sites (landfill sites, industrial impoundments).
Non-point-source pollution, in contrast, is diffuse by nature, occurringover broad geographical scales. Because of its diffuse nature, non-point-source pollution typically yields relatively uniform environmental concentra-tions of contaminants in surface waters, sediments, and groundwater. From arisk assessment perspective, non-point-source pollution often cannot readilybe delineated in a spatially or temporally explicit manner. This leads to sig-nificant difficulty in the management of non-point-source pollution usingconventional regulatory approaches. Examples of non-point-source pollu-tion include agricultural runoff (pesticides, pathogens, and fertilizers), storm-water and urban runoff, and atmospheric deposition (wet and dry through-put of persistent organic pollutants).
It must be kept in mind that the distinction between point and non-point sources of contamination for some contaminant classes can be diffi-cult to establish. For example, the discharge of metals to surface watersfrom mining operations may represent a significant point source of conta-mination, but many of these same metals may occur ubiquitously in theenvironment as a result of natural geological processes.
In addition to the traditional point and nonpoint sources listed in Table1, there are a number of other sources of water contamination. Examplesinclude construction (land development, roads), habitat modification (re-moval, addition of riparian buffer zones), hydrologic modification (dams,channelization), and cooling-water effluents. These sources generally donot directly contribute toxic chemicals per se to water, but their associatedstressors may be just as significant in terms of their effects on in-stream eco-logical integrity. For example, siltation as a result of habitat or hydrologic
10 L. RITTER ET AL.
TABLE 2. Five Leading Pollutants Causing Water Quality Impairment in Various Surface Waters ofthe United States
Rank Rivers % Lakes % Estuaries %
1 Siltation 51 Nutrients 51 Nutrients 572 Nutrients 40 Metals 51 Pathogens 423 Pathogens 32 Siltation 25 Toxic organic chemicals 404 Oxygen-depleting 29 Oxygen-depleting 21 Oxygen-depleting 33
substances substances substances5 Pesticides 21 Noxious aquatic plants 16 Oil and Grease 20
Note. Percent impairment attributed to each pollutant is shown in parentheses. For example, siltationis listed as a cause of impairment in 51% of impaired river miles. Adapted from U.S. EPA (1998a).
modification can result in significantly increased sediment loading instreams, with a corresponding loss of benthic productivity and fish habitat(Waters, 1995). In fact, siltation was identified by the U.S. EPA (1998a) asthe most significant pollutant causing degradation of U.S. streams (Table 2).Indirectly, however, changes in the physicochemical characteristics ofreceiving water or sedimentary environments resulting from habitat andhydrologic modification can significantly influence the transport and load-ing of contaminants contributed from other sources. For example, the pri-mary route for phosphorus loading to surface waters is via runoff of sedi-ment particles to which the phosphorus is bound (Ritter, 1988). Increasedphosphorus loading may therefore occur in agricultural areas that do notincorporate management strategies aimed at mitigating the loss of soils dueto surface runoff.
Following release to the environment from any of the point and non-point sources identified in Table 1, a contaminant may move or partitioninto several different environmental matrices, whereupon it may be sub-jected to a myriad of factors that act to modify its concentration andchemical characteristics. For example, toxic contaminants may be con-verted to nontoxic forms by microbial, chemical, and photolytic degrada-tion in both surface waters and sediments. Some contaminants, particu-larly lipophilic (lipid-loving) forms, adsorb to suspended particles, soils,or sediments, which reduces their ambient water concentrations and bio-logical availability (bioavailability). Occasionally, degradation of contam-inants leads to the formation of toxic or bioaccumulative metabolites. Forexample, the insecticide DDT can be metabolized to the biologicallyactive environmental metabolite DDE; it is the latter that has been impli-cated in eggshell thinning and possible endocrine disruption.
The mobility and extent to which a chemical undergoes transformationin the environment, and hence the pathways and degree to which aquaticbiota and humans may be exposed to it, depend largely on the physico-chemical characteristics of the contaminant. For example, polar (water-lov-ing) contaminants will generally remain dissolved in water and are oftenhighly mobile in the environment. A notable example is the herbicideatrazine, which is commonly detected in both surface water and groundwa-ter (atrazine and other pesticides are discussed in greater detail under non-point sources of contamination). Polar compounds generally do not bioac-cumulate (but see atmospheric transport section for an exception) andtherefore are rarely found at elevated concentrations in biotic tissues unlessexposure is constant. In areas in which specific polar compounds occur,they may be common constituents of influent water in water treatmentplants. In contrast, nonpolar (water-hating) or lipophilic compounds aremore likely to be associated with suspended particles or to becomeentrained in aquatic sediments. Notable examples are polychlorinatedbiphenyls (PCBs) and DDT. These sparingly soluble compounds are rarelydetected in treated drinking water. The primary route for exposure tolipophilic compounds for humans and aquatic biota is through the diet.
SOURCES, PATHWAYS, AND RISKS OF CONTAMINANTS IN WATER 11
To facilitate discussion of the pathways through which contaminantsmove in the environment, it is instructive to identify the two matrices thatserve as the primary conduits for contaminants to drinking water: surfacewater and groundwater. Surface water includes all water that occurs on thelandscape, including streams, ponds, lakes, and oceans. In Canada, surfacewaters have long been used as a sink for many forms of anthropogenicwaste; however, they also serve as the primary source of drinking water.Approximately three quarters of water used for drinking purposes in Canadaand Ontario, particularly in urban centers, originates from surface waters.Groundwater, as the name implies, is water that occurs in the pores andcrevices of soil and rock beneath the ground. Although groundwater existsvirtually everywhere underground, some areas naturally contain morewater than others. Such areas are referred to as aquifers and they range insize from only a few hectares in area to thousands of square kilometers,and in depth from only a few meters to several hundreds of meters (Environ-ment Canada, 2000a).
In Canada, groundwater serves as the primary source of drinking waterfor approximately 7.9 million people or about 26% of the population (Gov-ernment of Canada, 1996). In some provinces, this proportion is muchhigher. For example, in Prince Edward Island and New Brunswick, 100%and 60% of drinking water originates from the ground, respectively (HealthCanada, 1997). In Ontario, approximately 23% of residents rely on ground-water as a source of drinking water, extracted via both community andprivately owned wells; the majority of these residents live in rural com-munities.
As with surface water, there are many sources of contamination togroundwater (Table 3). The spatial extent and intensity of groundwater con-tamination depends upon many factors that collectively make detection,treatment, and management of this resource unique from that of surfacewater when it becomes contaminated. For example, groundwater moves atvariable rates, depending upon the nature of the geological formation inwhich it occurs. The rate at which contaminants move in groundwater willdepend upon the comparative density and natural flow pattern of the wateralready contained within an aquifer (Miller, 1980). In general, groundwatercontamination moves as a plume. Where the hydrogeology of an area hasbeen well defined, it may be possible to track the movement of the plumeor determine the spatial extent of contamination. However, in some soilsplume movement is so slow that by the time groundwater contaminationhas been detected, it is often too late to prevent contamination of drinking-water sources, and impacts on aquatic ecosystems have already occurred.Further, it is often too expensive to initiate practical remedial action. Thus,for groundwater contamination, attention must be focused on source protec-tion such as ensuring safely and properly constructed wells, the use ofsecure landfill sites (if these must be used), and appropriate disposal ofwaste materials. Some of these aspects of waste management are considered
12 L. RITTER ET AL.

SOURCES, PATHWAYS, AND RISKS OF CONTAMINANTS IN WATER 13
TABLE 3. Sources of Groundwater Contaminants
Category 1: Sources designed to discharge substances
1 Sub-surface percolation from septic tanks/cesspools
2 Injection wellsHazardous wasteNonhazardous waste (e.g., brine disposal)Nonwaste (e.g., solution mining)
3 Land applicationWastewater (spray irrigation)Wastewater by-products (biosolids)Hazardous wasteNonhazardous waste
Category 2: Sources designed to store, treat, and/or dispose of substances; discharge through unplanned release
1 LandfillsIndustrial hazardous wasteIndustrial nonhazardous wasteMunicipal sanitary
2 Open dumps, including illegal dumping
3 Residential disposal
4 Surface impoundmentsHazardous wasteNonhazardous waste
5 Materials stockpiles (nonwaste)
6 Graveyards
7 Animal burial
8 Above-ground storage tanksHazardous wasteNonhazardous wasteNonwaste
9 Underground storage tanksHazardous wasteNonhazardous wasteNonwaste
10 ContainersHazardous wasteNonhazardous wasteNonwaste
11 Open burning and detonation sites
12 Radioactive disposal sites
Category 3: Sources designed to retain substances during transport or transmission
1 PipelinesHazardous wasteNonhazardous wasteNonwaste
2 Materials transport and transfer operationsHazardous wasteNonhazardous wasteNonwaste
Category 4: Sources discharging substances asa result of other planned activities
1 Irrigation practices
2 Pesticide applications
3 Fertilizer applications
4 Animal feeding applications
5 De-icing salt applications
6 Urban run-off
7 Percolation of atmospheric pollutants
8 Mining and mine drainageSurface mine relatedUnderground mine related
Category 5: Sources providing conduit or inducing discharge through altered flow patterns
1 Production wellsOil and gas wellsGeothermal and heat recovery wellsWater supply wells
2 Other wellsMonitoring wellsExploration wells
3 Construction excavation
Category 6: Naturally occurring sources whose discharge is created and/or exacerbated by human activity
1 Groundwater–surface-water interactions
2 Natural leaching
3 Salt water intrusion
Note. Adapted from Barcelona et al. (1990); based on a survey conducted by the U.S. Office ofTechnology Assessment (1984).

in greater detail later in relation to the various point and nonpoint sourcesof pollution.
Finally, it is important to bring attention to the fact that historical ap-proaches and philosophies regarding the governance and management ofgroundwater/surface-water research has been to treat these two water sys-tems as separate entities (Naiman et al., 1995; Duncan, 1999). However,the intimate chemical and biological connections between groundwaterand surface waters and their important relationship to the hydrologicalcycle have gained wide acceptance by scientists and greater appreciationby environmental managers. Understanding the nature of groundwater–surface-water relationships is a crucial step to understanding the pathwaysthrough which contaminants may be exchanged between these two sys-tems. Thus, it is imperative that future assessment and management ofthese systems be conducted in a manner that recognizes this intimate con-nection.
POINT SOURCES OF WATER CONTAMINATION
In this section, we identify and describe key point sources of contami-nants to aquatic environments. The discussion is organized according tothe type of source, within which we identify the major contaminants thathave had demonstrated or potential risks to human health via drinkingwater. In doing so, we describe the major transport pathways along whichcontaminants from each source move in surface water, groundwater, sedi-ments, and the atmosphere, with the goal of identifying the main path-ways by which contaminants enter into drinking-water supplies. Wherepossible, emphasis is placed on contaminant distribution and loading inOntario waters; however, these data were not always available for somecontaminants so we have augmented our discussion with examples drawnfrom elsewhere in Canada and the United States.
Industrial and Resource Extraction
Industrial applications constitute a significant source of toxic contami-nants to surface waters, sediments, and groundwater in Canada, and manycontaminants of industrial origin have been detected in drinking water. InCanada, there are three primary industries that are based on the extractionor removal of resources from within or on the land: mining (predominantlymetals), petrochemical, and pulp and paper. Collectively, these industriesaccount for approximately 10% of Canada’s gross domestic product (GDP)and directly employ over one million people (Government of Canada,1991). Chemical manufacturers, steel and metal processing plants, textilemanufacturers, and food processing plants are also important industries inCanada. Most contaminants from industry are discharged directly to surfacewaters in effluent or to the atmosphere via stack emissions. However,leaching of chemicals from waste disposal dumps and hazardous waste
14 L. RITTER ET AL.

wells may be significant direct sources of industrial contaminants to ground-water. In either case, industrial-borne contaminants have had broad impactson aquatic ecosystems, and many pose risks to human health (Governmentof Canada, 1996).
Keith (1979) reviewed the occurrence and frequency of detection oforganic contaminants and metals in industrial waste waters in a 1979 surveyconducted by the U.S. EPA. Although not inclusive, this review listed 129chemicals, many of which have been designated priority pollutants (contam-inants that are given high priority for risk assessment and management).Many of these chemicals have been detected in drinking water extractedfrom both surface-water and groundwater sources. Indeed, there are numer-ous classic examples of contaminated drinking-water supplies resulting fromthe inappropriate or poor disposal of industrial wastes across North America(Jorgenson, 1989; Gustafsson, 1993).
Industrial wastes can lead to the contamination of drinking water by oneof three primary routes. The most common pathway is through direct dis-charge of effluents into surface waters from which drinking water suppliesare extracted. Industries that use large amounts of water for processing (e.g.,the pulp and paper industry) have high potential to pollute waterways andsediments through the discharge of their effluent into streams and rivers.Industrial contaminants may also enter drinking water supplies through leak-age, leaching, runoff, or seepage of contaminants from waste water im-poundments and hazardous waste wells into nearby groundwater aquifers.Industrial contaminants may also enter aquatic environments via atmos-pheric transport of smokestack emissions that are deposited either directlyto surface waters via wet and dry deposition or indirectly in runoff andleachates following deposition on land. Atmospheric transport of pollutantsis treated separately later under non-point-source pollution. In each case,contamination of drinking water supplies from industrial sources will de-pend upon the various types of industrial processes, the types of contami-nants contributed by the different industries, and the disposal practices ofthe industry.
In the following text, we consider the types of contaminants originatingfrom three primary industrial point sources: mining, pulp and paper, andpetroleum. Although other industrial point sources exist (e.g., food process-ing industry), these are relatively minor compared to the industries justnamed in terms of both their economic importance and potential for con-tributing contaminants to surface waters and groundwater in Canada andOntario. Of the contaminants contributed by these three industries, we havedevoted considerable text to metals. Metals are one of the most common yettoxicologically significant contaminants found in water. When examiningnatural inorganic substances in the context of contaminants, the metals,metalloids, their parent minerals, and derivative compounds must be con-sidered differently than other classes of contaminants for two important rea-sons. First, metals, unlike synthesized organic compounds, occur naturally
SOURCES, PATHWAYS, AND RISKS OF CONTAMINANTS IN WATER 15

and persist indefinitely in nature, cycling through the environment withoutbreaking down. Second, some of these elements are required as macro- andmicronutrients and are essential at specific concentration ranges for healthof biological organisms. Owing to their natural and anthropogenic origins,and ubiquitous occurrence in surface and groundwater, we have purpose-fully departed from the general organizational structure of the document toconsider both point and nonpoint sources of metals together.
Mining and Other Sources of Metals and Metalloids in the Environment
Metals are solid substances in their elemental state at room tempera-ture, with the exception of mercury, which is a liquid. They are elementsthat are naturally present in the earth’s crust and in water. Metals can occuras dissolved or particle constituents and are significantly influenced byphysical and chemical processes in the environment. Of the multiple formsof metals present in the environment, not all of these are biologically avail-able for uptake by organisms. The particular physical or chemical form inwhich an element exists, referred to as the speciation of an element, is aunique quality of metals that can influence whether the element will havepositive or negative impacts on the natural environment. It is essential torecognize that the speciation of the metal along with the total metal conta-minant concentration is important in the evaluation of human health andenvironmental risk and determining the contaminant’s behavior. Indeed, thedegree of trace metal toxicity depends largely on the form of the metal andon water quality of the receiving environment. Metals can be categorized ingeneral terms according to their potential to be toxic to organisms, as out-lined in Table 4.
Sources of trace metals are either natural or influenced by human activ-ities. Natural sources of metals are largely the result of chemical weatheringof rock or volcanic activity, both of which can have considerable spatialvariability. Regional and vertical variations in metal concentrations in miner-al deposits in Canada must be considered in evaluation of trace metal conta-mination. In some cases, naturally occurring concentrations of trace metalsin some regions exceed safe-limit criteria established in particular juris-dictions (Klassen, 1998). Burning of fossil fuels, mining operations, and theindustrial use of metals and mineral compounds are prime human-influ-
16 L. RITTER ET AL.
TABLE 4. Classification of Trace Elements in Water Supplies According to Water Quality Significance
Significance Trace element
Aesthetic significance—taste and discoloration problems Cu, Fe, Mn, ZnToxic at levels found in some water As, Ba, Cd, Cr, Hg, PbToxic but present levels in water are probably unimportant Ag, Al, Be, Bi, Ni, Sb, UProbably not toxic up to ppm levels, current levels are ppb or less Ga, Ge, Sn, Sr, Ti, V, ZrNutrient metals (at ppb levels), some may be toxic at higher levels B, Co, Cu, Fe, Mn, Mo, Se, Zn
Note. From Brezonik (1976).

enced sources of trace metals in the environment. Sources of trace metals inthe environment can be described by five general categories: (1) natural geo-logical weathering, (2) industrial processing of minerals and ores, (3) indus-trial use of metals and metal complexes, (4) leaching of trace metals fromwaste disposal and urban surface runoff, and (5) human and animal wastesthat contain trace metals.
Common point sources of trace metal contaminants are disposal of efflu-ents from mining industries, refining, smelting and manufacturing industries,cement plants, sewage treatment plants that serve domestic and industrialwastewater sources, combined sewer outfalls, incinerators, power plants,landfills, leaking underground storage tanks, spills, and contaminated sites(Williams et al., 1976). Mining is one of the most important point sources ofmetals to surface waters. In Ontario in 1995, there were 24 metal-producingmines, from which gold, silver, lead, copper, nickel, zinc, molybdenum, andiron represented 68.8% of total value of the nonfuel mineral production inCanada for that year (Alloway, 1995). Of the four mining stages, only miningand milling and postoperational waste management contributed to contami-nation of surface water and groundwater resources (Alloway, 1995). Anotherimportant source of elevated metal concentrations in receiving environ-ments is domestic wastewater (Table 5), since many household and personalproducts contain metals (Atkins & Hawley, 1978). Corrosion of plumbingpipes and fixtures also contributes metals to wastewater (Millette & Mavinic,1988). Hazardous material dumps and injection wells for radioactive mate-rials also serve as point sources of trace metal contaminants. Deliberateillegal dumping of metallic residues and wastes must also be included whenconsidering point sources of trace metal contamination.
Nonpoint sources of trace metal contamination include the burning offossil fuels, agricultural practices, and atmospheric deposition (Williams et
SOURCES, PATHWAYS, AND RISKS OF CONTAMINANTS IN WATER 17
TABLE 5. Concentrations (ppb) of Trace Metals in Municipal Wastewater
St. Paul, Los New York New York Ontario OntarioMetal MN Angeles influent effluent influent effluent
Al 3800 470As 5 1 0.5 5 1Cd 36 1 1 0.3 20 <0.01Cr 470 5–15 20 2 970 90Cu 280 25–36 76 8 300 60Hg 2.8 <0.1 <1 0.5 1 0.07Ni 13–37 8 7 110 50Pb 69 3 17 2 170 20Se 1–14 3 2Zn 49–80 110 32 1120 290
Note. St. Paul from Costner and Thorton (1989). Los Angeles from http://www.sccwrp.org/pubs/annrpt/92-93/ar-01.htm, 1992. New York from http://www.cooper.edu/~ahmed/mtpc.html, 1994.Ontario from Atkins and Hawley (1978).

al., 1976). Deliberate application of trace metals in fertilizers, manure,sewage sludge, and pesticides makes agricultural runoff a key nonpointsource in rural areas. In addition to this, soil erosion in agricultural regionscontributes to greater mobilization of trace metals. In urbanized areas, tracemetal contamination due to stormwater runoff can be a significant nonpointsource of pollution. Common sources of trace metals in urban runoff origi-nate from automobile fuel exhaust and wear and corrosion of automobilecomponents such as tires, brake linings, and exhaust systems (Bannermanet al., 1993). Corrosion from ship traffic on the Great Lakes is also impor-tant as a mobile nonpoint source of trace metal contaminants.
Contaminated sediments can also be sources of metal pollution (Smith& Hamilton, 1992). These sediments are usually found downstream of pol-lution discharges and in highly industrialized and urbanized areas due todischarges from industry and sewage treatment plants. In Ontario, suchsediments are found in the Niagara, St. Clair, and St. Mary’s rivers, alongwith the Toronto and Hamilton harbors. Disturbing or dredging thesesediments, however, has the potential to release contaminants into thewater.
Soil ingestion, both purposeful and inadvertent, by wild animals, live-stock, and humans is a pathway of trace metal exposure, especially in thecase of dust adhering to plants, that is sometimes overlooked when assess-ing the environmental fate and transport of metals (Sheppard, 1998).
Factors That Affect Metal Concentrations in the Environment
Although trace metals can enter natural water systems by normalweathering of minerals, localized inputs as a result of human activities canmake significant contributions to trace metal contaminant loads. Severalphenomena unique to trace metals govern the extent to which they becomecontaminants in natural water systems (Leckie & James, 1976; Parametrix,Inc., 1995). Many of these phenomena depend on interactions betweenorganic and inorganic species present in solution and physical effects at thesolid–solution interface. Chemical and physical properties of trace metalsinfluence their availability for uptake by biological organisms and theirpotential to be toxic to organisms, as well as transport mechanisms in nat-ural waters. For example, fish take up dissolved metals relatively easily, sothese metals are more bioavailable than those that are complexed to largeorganic molecules such as humic acids.
Within aquatic systems, there are many pathways and transport mecha-nisms by which trace metals partition between the different components ofthe environment (Harrison, 1990). In both water and sediments, metals aresubject to complex chemical and biochemical reactions that affect theirchemical behavior and partitioning between different phases (Honeyman &Santschi, 1988; Elder, 1988). Some of these are illustrated in Figure 2. Inter-actions of these trace metal ions involve many processes, including ex-change reactions, adsorption/desorption processes and oxidation–reduction
18 L. RITTER ET AL.
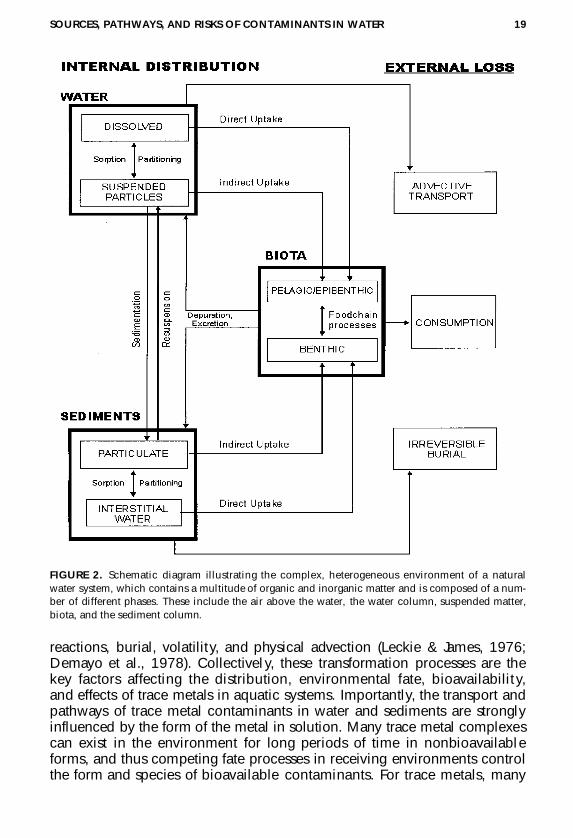
reactions, burial, volatility, and physical advection (Leckie & James, 1976;Demayo et al., 1978). Collectively, these transformation processes are thekey factors affecting the distribution, environmental fate, bioavailability,and effects of trace metals in aquatic systems. Importantly, the transport andpathways of trace metal contaminants in water and sediments are stronglyinfluenced by the form of the metal in solution. Many trace metal complexescan exist in the environment for long periods of time in nonbioavailableforms, and thus competing fate processes in receiving environments controlthe form and species of bioavailable contaminants. For trace metals, many
SOURCES, PATHWAYS, AND RISKS OF CONTAMINANTS IN WATER 19
FIGURE 2. Schematic diagram illustrating the complex, heterogeneous environment of a naturalwater system, which contains a multitude of organic and inorganic matter and is composed of a num-ber of different phases. These include the air above the water, the water column, suspended matter,biota, and the sediment column.
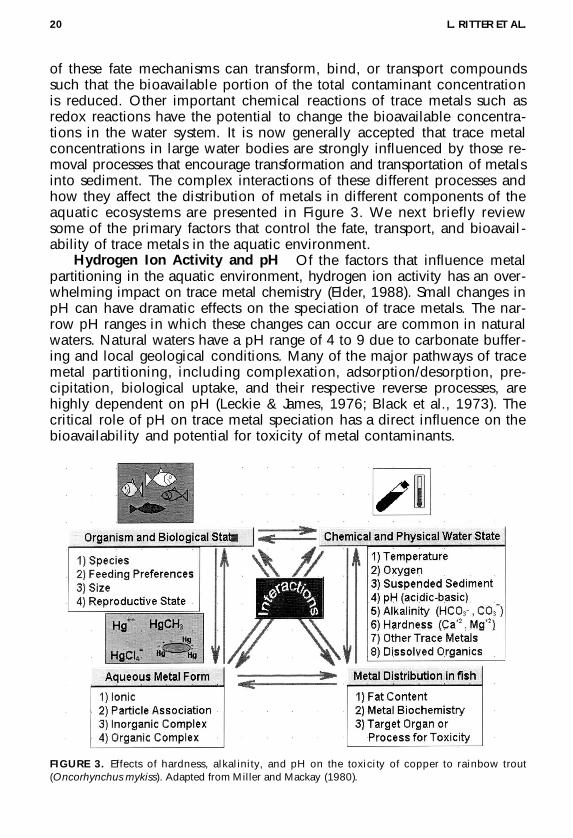
of these fate mechanisms can transform, bind, or transport compoundssuch that the bioavailable portion of the total contaminant concentrationis reduced. Other important chemical reactions of trace metals such asredox reactions have the potential to change the bioavailable concentra-tions in the water system. It is now generally accepted that trace metalconcentrations in large water bodies are strongly influenced by those re-moval processes that encourage transformation and transportation of metalsinto sediment. The complex interactions of these different processes andhow they affect the distribution of metals in different components of theaquatic ecosystems are presented in Figure 3. We next briefly reviewsome of the primary factors that control the fate, transport, and bioavail-ability of trace metals in the aquatic environment.
Hydrogen Ion Activity and pH Of the factors that influence metalpartitioning in the aquatic environment, hydrogen ion activity has an over-whelming impact on trace metal chemistry (Elder, 1988). Small changes inpH can have dramatic effects on the speciation of trace metals. The nar-row pH ranges in which these changes can occur are common in naturalwaters. Natural waters have a pH range of 4 to 9 due to carbonate buffer-ing and local geological conditions. Many of the major pathways of tracemetal partitioning, including complexation, adsorption/desorption, pre-cipitation, biological uptake, and their respective reverse processes, arehighly dependent on pH (Leckie & James, 1976; Black et al., 1973). Thecritical role of pH on trace metal speciation has a direct influence on thebioavailability and potential for toxicity of metal contaminants.
20 L. RITTER ET AL.
FIGURE 3. Effects of hardness, alkalinity, and pH on the toxicity of copper to rainbow trout(Oncorhynchus mykiss). Adapted from Miller and Mackay (1980).

Precipitation, Complexation, and Sorption Many metals form insol-uble hydroxide precipitates, especially under basic conditions. These pre-cipitates are often insoluble under natural water pH conditions. Since pHis intimately linked to hydroxide ion activity, the solubility of hydroxideprecipitates increases significantly as pH decreases (Pankow, 1991a).
Bonding between charged metal ions and oppositely charged coordi-nate sites often leads to formation of coordination complexes. Since thehydrogen ion can be a competitor for metals in these metal–ligand com-plexes, pH can be as important in the degree to which these complexeswill form as the concentrations of the metals and complexing moleculesthemselves. Organic matter in natural water can chelate trace metals andsignificantly influence mobilization of trace metals by changing their be-havior (Singer, 1974). A good example of this is complexation with naturalorganics such as humic and fulvic acids. Metals can also complex withinorganic anions such as chloride and sulfate. This complexation can alteravailability to organisms.
Physical and chemical properties of metals affect surface interactionsand the tendency for metals to adsorb to particle surfaces or absorb intothe particle. Trace metals ions tend to adsorb onto clay minerals due tonegative charges present on the surface of the clay particles. Metal ions ofone element can replace other ions of another element via ion exchange,depending on the properties of the element and environmental conditions.Coatings of Fe or Mn oxides and/or organic matter can act as scavengersof trace metals and sorb them onto particle surfaces (Allard et al., 1987;Bendell-Young & Harvey, 1992).
Hardness Water hardness is a measure of the amount of dissolvedsalts in water [especially calcium, magnesium, and iron(II)]. Usually ex-pressed as equivalents of CaCO3, it has been shown that increasing hard-ness decreases toxicity of some metals in natural waters to many biologicalorganisms by providing competition for the metal ions for binding sites inorganisms. Bioavailability and toxicity of some trace metals can be influ-enced by the formation insoluble metal carbonate precipitates or by directadsorption of metals onto calcium carbonate surfaces. The safe concentra-tion of trace metals in solution is closely linked to water hardness, andsome water-quality criteria (lead, nickel, and zinc) are expressed in terms ofseparate values for different levels of hardness of receiving water. An exam-ple of the effect of alkalinity and hardness on the toxicity of copper to rain-bow trout is provided in Figure 4.
Carbonates Dissolved carbon dioxide (CO2) in water can equili-brate as three carbonate species (H2CO3, HCO3
–, and CO32–), depending
on the pH of the water. These carbonate species form the main bufferingsystem in natural waters. Metals can bond or become coordinated withspecies in solution such as carbonates (Pankow, 1991b).
Since trace metal toxicity depends on its form or speciation, equilibriumconcentrations of the carbonate anions influence solution pH, and the
SOURCES, PATHWAYS, AND RISKS OF CONTAMINANTS IN WATER 21

pH, in turn, has a direct influence on the speciation of the metal. Thus,carbonates help determine the behavior of metals in water.
Oxidation–Reduction In natural waters, oxidation–reduction (redox)processes influence the environmental chemistry of trace metals. Dis-solved oxygen is important in establishing the redox conditions in water.Since photosynthesis, respiration, and decomposition processes help reg-ulate the dissolved oxygen concentrations in water, they can indirectly in-fluence the behavior of trace metals.
Changing redox conditions can affect trace metal concentrations innatural waters in two ways. First, direct changes in the oxidation state ofthe metal ion influences the speciation of the metal. Second, redox con-ditions in solution influence the competition between complexing speciesand can alter the bioavailability of a particular trace metal ion (Snoeyink& Jenkins, 1980). The redox conditions and pH become very important intrace metal mobilization and bioavailability in aquatic sediments where avertical gradient of oxygen is usually present (Campbell et al., 1988).
22 L. RITTER ET AL.
FIGURE 4. Complex interactions between many different parameters and processes affect the distrib-ution of trace metals in the different phases of aquatic ecosystems.

Biological Factors Microorganisms, especially bacteria and fungi,can mediate transformation processes of trace metals. Transformationscan change the speciation of trace metals and considerably alter theintrinsic behavior of elements. Most heterotrophic organisms depend onoxygen for respiration; therefore, insufficient dissolved oxygen concentra-tions in natural waters that compromise the health of those microorgan-isms involved in metal transformations will have impacts on trace metalform and transport. Those contaminants that compete with biologicalorganisms for oxygen can also have an effect on trace metal contaminantconcentrations in natural water systems. For example, oxygen-saturatedwaters are preferred for drinking water, since the oxygen helps precipitateout Fe and Mn.
Trace metals such as Hg, Pb, Se, Sn, and As can form very labileorganic complexes, which significantly changes their toxicity (Fergusson,1990). One such reaction is the methylation of Hg to methylmercury(CH3Hg) or dimethylmercury (CH3)2Hg (Jernelöv, 1974). Microorganismsin anaerobic environments can mediate these reactions. The alkylatedcompounds can be many orders of magnitude more toxic than the initialmetal species due to their ability to penetrate the blood-brain barrier. Forexample, the methylated forms of mercury and lead are much more toxicthan the elemental forms. However, the opposite can also occur, asshown by the methylation of arsenic which reduces its toxicity. Thesemethylated compounds more readily bioaccumulate in the lipids oforganisms. Less toxic forms of these metals can also be transformed to themore toxic forms in the bodies of organisms, including humans.
Pathways and Transport of Metals into Waterways
The hydrologic cycle and the related geophysical conditions withinwatersheds determine the chemistry of trace metals in human drinkingwater. In natural water systems, water quality, discharge, and biologicalproductivity are especially important in the transport of trace metals.Water storage and discharge influences dispersion of water constituents,and this in turn has impacts on dissolved trace metal concentration andthe tendency for trace metals to undergo sorption processes. Unlike eval-uation of transport pathways of synthetic contaminants, trace metal con-tamination requires an understanding of natural loadings from atmosphericand aqueous pathways (Rasmussen, 1998).
Moving water can dissolve and mobilize metals in its path. These caninclude contaminants on the surface or in the subsurface of the earth.They can subsequently flow into bodies of water that are used as sourcesof drinking water. In the urban environment, storm water is usually col-lected through storm sewers, due to the creation of impervious surfaces.This can accumulate significant metal pollution from the streets, whichcan then flow into bodies of water that may be used as drinking-watersupplies. Creation of impervious surfaces exacerbates the contamination,
SOURCES, PATHWAYS, AND RISKS OF CONTAMINANTS IN WATER 23

since covering soil reduces its ability to filter contaminants (Marsalek &Schroeter, 1988).
Storage of some waste material or tailings from mine operations inregions where high concentrations of sulfide and microorganisms may bepresent can result in formation of a highly acidic leachate, known as acidrock drainage. This type of mining effluent generates high concentrationsof sulfuric acid that can solubilize metals and potentially compromise thequality of drinking water drawn from surface water or groundwater (Gray,1988).
Facilitated transport is another mechanism that can move trace metalsthat might otherwise be relatively immobile in the aquatic environment.Trace metals can bind to colloids, natural complexing agents (humic andfulvic acids), and anthropogenic complexing agents such as nitrilotri-acetic acid (NTA), which can “protect” the metal from some precipitationand adsorption reactions (Grout et al., 1999; Gadh et al., 1991).
The amount of trace metal contamination in water is often difficult toquantify because the pollution may be transient and may flow in variablepatterns. For this reason, sediments are good long-term indicators of con-tamination (Smith & Hamilton, 1992; Wilber & Hunter, 1979). Many con-taminants including trace metals preferentially partition to sediments fromthe water column. Trace metals partition to the sediments based on theirphysical properties. Sediments are composed of many different materialsof many different particle sizes. They are composed of materialsthat have been weathered, washed downstream, and deposited. The hetero-geneous nature of sediments is the resulting combination of silt, sand,clays, minerals, organic matter, living organisms, water, and dis-solved gases.
Depending on the stream gradient and flow, large amounts of sedi-ments containing metal contaminants may be scoured and transportedby the stream during storm events and flooding. Water entering lakes fromstreams slows and deposits suspended sediments, making lakes sinks forcontaminants. The water in the Great Lakes has a long residence time;therefore, contaminants that enter the lakes get trapped within thelakes and concentrate over time. Lakes can become stratified due totemperature gradients, resulting in layers with different physiochemicalproperties. This process has important implications for contaminant mobil-ity and transport. During certain times of the year, lakes may becomesources of contaminants due to the release of contaminants from the bot-tom sediments. For example, Hg may flow from Lake St. Clair into LakeErie.
Sediments can exist as deposited bed sediments or as suspended sedi-ments in the water column. Sediment particles usually have coatings of Mnand Fe oxides and organic matter. These coatings provide strong bindingsites for contaminants, including trace metals (Bendell-Young & Harvey,1992). Some of the binding sites hold the contaminants very strongly, while
24 L. RITTER ET AL.

others only hold the contaminants weakly. This illustrates the concept ofbioavailability. Those contaminants that are weakly held are easily availableto organisms and the environment, while those that are strongly bound arenot as bioavailable. Therefore, the total concentration of a contaminant insediment is not indicative of its bioavailabilit y, and therefore of its potentialto cause harmful or toxic effects on humans or aquatic organisms.
Sediments are composed of many geochemical phases or fractions,such as ion-exchangeable, easily reducible, Mn oxide-bound, organic-bound, and residual components (Bendell-Young et al., 1992; Tessier etal., 1979). Each of these phases holds contaminants with different affinities.Contaminants in the easily reducible phase may be available to the watercolumn with only a small change in the environmental conditions, where-as, in order for the trace metals sequestered in the residual phase tobecome available for uptake by organisms, the water would have to be-come very acidic.
Transport of contaminants can be augmented as storms, high waterflows, and turbulence from boating activities physically disrupt sedimentlayers. This is one mechanism by which pollution can be transported whilestill sediment associated. Sediments can release some of their contaminantload when environmental conditions change (Tessier et al., 1994). Theseevents can include aerobic sediments becoming anoxic by burial, changesin redox potential or pH, burrowing by benthic organisms, etc. As moresediments are deposited, layers accumulate and the conditions change,resulting in physical and chemical reactions occurring in the sediments.The water in sediments, often referred to as interstitial water or porewater,also plays an important role in determining contaminant fluxes betweenthe water column and the sediment column and cycling of contaminantswithin the sediment column (Carigan et al., 1985). Complex processesoccur at the sediment–water interface that result in fluxes of contaminantsbetween the sediment and water. Dredging or removal of contaminatedsediments may also release large amounts of pollution. One remediationmethod is to cover the sediments with a layer of material that isolates thesediments, thereby protecting the sediment surface from physical disruptionby natural or anthropogenic means.
Concentrations of Trace Metals and Effects in the Environment
Several trace metals are both essential to the overall health of organ-isms at low concentrations and have the potential to become toxic to theorganism when tolerable concentrations are exceeded. Figure 5a illus-trates this unique quality of some trace metals. In contrast, some tracemetals are nonessential but do not demonstrate toxic effects below a criti-cal threshold concentration (Figure 5b). The tolerable concentration rangebetween thresholds that satisfy fundamental nutritional requirements andlevels above which the element becomes toxic to organisms varies amongtrace metals.
SOURCES, PATHWAYS, AND RISKS OF CONTAMINANTS IN WATER 25

26 L. RITTER ET AL.
FIGURE 5. Typical dose-response curve for (a) essential and (b) nonessential metals.

Essential elements such as copper, zinc, nickel, and selenium haveplayed a critical role in the evolutionary development of life. Nature be-came conditioned to the natural levels of metals present in the environ-ment, but this delicate balance can be disturbed by human input of metals.These essential elements can be toxic at concentrations that are too high,and a deficiency of these metals can also be harmful to the health ofhumans, plants, and aquatic organisms. This is very important in children,as they are growing and do not have fully evolved detoxification systems.Humans can tolerate a range of concentrations of these metals due to ex-cretion and detoxification processes that exist in our bodies. All individualshave small amounts of all metals in their bodies, often referred to as a bodyburden. This amount usually increases with age. Nonessential metals cansubstitute for essential metals in individuals, resulting in toxic effects. Forexample, a Cd ion is approximately the same size as a Zn ion and can re-place Zn in various molecules in our bodies. Scientific investigations formthe basis for establishing tolerable levels of contamination that provideminimal risk to human and ecosystem health. Understanding the nature oftrace metal chemistry in the receiving environment is critical to maintainingsuitable water quality for all water uses. There are multiple definitions usedto describe the contaminant levels that current science indicates are suit-able targets for overall health of organisms within an ecosystem. Waterquality criteria, guidelines, and objectives differ from water quality stan-dards, and these descriptors cannot be used interchangeably (Strachan,1987). A water quality standard is an objective or limit that is recognized inenforceable environmental control laws of a level of government. A waterquality objective is a numerical concentration or narrative statement thathas been negotiated to support and protect the designated use of water at aspecific site. Water quality guidelines are numerical concentration limits ornarrative statements recommended to support and maintain a designatedwater use. Criteria are the scientific data evaluated to derive the recom-mended limits (either guidelines or objectives) for water uses. The distinctionbetween these terms is important in assessing risk and acting to ensure suit-able water quality for all ecosystem members. A federal–provincial com-mittee of the Council of Canadian Ministers of the Environment (CCME)has developed the Guidelines for Canadian Drinking Water Quality(GCDWQ). Various provincial guidelines such as the Ontario provincialwater quality objectives also exist. These are shown in Table 6. Sedimentquality guidelines have recently been developed by CCME and are shownin Table 7, along with the probable effects level (PEL). The PEL is theconcentration at which toxic effects can be expected to occur in aquaticorganisms.
An examination of data from the 1998 and 1999 Ontario DrinkingWater Surveillance Program (www.ene.gov.on.ca/envision/dwsp9899/dwsp.htm) indicated that metal concentrations in Ontario’s drinking-water supply were within guideline values in most of the samples. Theprogram reported results from 162 waterworks that supply water to over88% of the population served by municipal water supplies. Some water
SOURCES, PATHWAYS, AND RISKS OF CONTAMINANTS IN WATER 27

supplies that were obtained from groundwater had naturally high levels ofsalts and minerals; however, these present only an aesthetic concern. Nosamples had any significant mercury concentrations. A few drinking-watersupplies had elevated aluminum levels due to the treatment process.Selenium levels were slightly above guideline values in 4 samples out ofapproximately 1000. A few water supplies had high copper and lead con-
28 L. RITTER ET AL.
TABLE 6. Various Drinking Water Guidelines and Objectives for Trace Metals (µg/L)
CCMEMetal GCDWQ aquatic life PWQO
Ag 0.1 0.1Al 15–75d
As 25a 5 5Cd 5 0.017 0.1–0.5c
Cr 50 100Cu 1000b 2–4c 1–5c
Fe 300b 300 300Hg 1 0.1 0.2Mn 50b
Ni 25–150 c 25Pb 10 1–7c 1–5c
Se 10 1 100U 20a
Zn 5000b 30 20
Note. GCDWQ, Guidelines for Canadian Drinking Water Quality (Federal–Provincial Subcommit-tee on Drinking Water, 1996). CCME, Canadian Council of Ministers of the Environment guidelinesfor the protection of aquatic life, same as Ontario drinking water standards. PWQO, Ontario provin-cial water quality objectives.
aInterim maximum acceptable concentration (IMAC).bAesthetic objective.cDepends on hardness.dpH dependent.
TABLE 7. Canadian Council of Ministers of the Environment (CCME)Sediment Quality Guidelines (mg/kg)
Metal ISQG PEL
As 5.9 17Cd 0.6 3.5Cr 37.3 90Cu 35.7 197Pb 35.0 91.3Hg 0.170 0.486Zn 12.3 315
Note. ISQG, interim sediment quality guidelines; PEL, probable effectslevel.

centrations due to leaching of these metals from pipes. Flushing the pipesbefore obtaining drinking water reduces the concentrations of these metalsto acceptable levels. The treatment plants that obtain their water from theGreat Lakes had influent water-borne metal concentrations that did notexceed the drinking water guidelines.
There are a number of areas of the Great Lakes that contain severelycontaminated sediments. These are the largest source of contaminants intothe food chain. Forty-three sites have been identified and are awaiting re-mediation. These include Port Hope, the Toronto and Hamilton harbors,St. Mary’s River, Niagara River, and many others. A list is maintained bythe U.S. EPA at www.epa.gov/glnpo/sediment/gpra/index.htm.
The following information about the characteristics, sources, environ-mental concentrations, toxicology, routes of exposure, and effects of theindividual metals was derived from the supporting documents for theGuidelines for Canadian Drinking Water Quality (GCDWQ) developed byHealth Canada. They can be found on the web at http://www.hc-sc.gc.ca/ehp/ehd/bch/water_quality.htm along with other valuable water quality in-formation. A good discussion of many of these individual metals can alsobe found in the work by Moore and Ramamoorthy (1984).
Aluminum Aluminum (Al) is a natural constituent of many mineralsand is the most abundant metal in the earth’s crust. It is also found exten-sively in clays. Al is also used in many drinking-water treatment plants toimprove water quality. In some treatment plants, incomplete removal of Alcan result in elevated Al concentrations in treated water. Health Canadarecommends that treatment plants attempt to reduce Al levels in treatedwater to 0.1 to 0.2 ppm (parts per million), as long as proper disinfection isnot compromised.
Current research suggests low level exposure to aluminum in waterdoes not have any significant adverse effects on humans. In 1987, levelsof Al in Ontario drinking water ranged from 0.0003 to 4.6 ppm, with aaverage of 0.16 ppm. At these levels, individuals would have to consumeover a 100 L of water every day to experience toxic effects. Ninety-sevenpercent of Al intake occurs through food. There is some evidence to sug-gest that ingestion of high levels of Al may play a role in neurodegenera-tive diseases such as amyotropic lateral sclerosis (ALS), Parkinson’s dis-ease, and Alzheimer’s disease. However, this has neither been proven nordisproven at the current time and further research is ongoing.
Arsenic The average arsenic (As) concentration in the earth’s crust is 2ppm, but it can be much more concentrated in arsenic-containing oressuch as arsenopyrite (FeAsS). Arsenic can also be a contaminant of otherminerals such as pyrite (FeS2). Arsenic is the 20th most common element inthe earth and the 12th most common element in the human body. Sourcesof As include natural weathering of geologic material, especially thosefound near gold- and other metal-rich areas, pesticides, wood preservatives ,
SOURCES, PATHWAYS, AND RISKS OF CONTAMINANTS IN WATER 29

and smelting. Arsenic is used in semiconductor manufacturing, inpigments, in glass production, and in many other minor uses (Nriagu,1994).
Arsenic can occur in different forms in the environment, although ingroundwater it is usually found as As(III) or As(V). Arsenic in groundwateris usually assumed to be in the As(III) form due to the anoxic conditionspresent in the aquifer. In surface water, the As(V) form is more common,along with organoarsenic compounds. The aqueous chemistry of arsenicis discussed in depth by Cullen and Reimer (1989).
Elevated levels of As have been found in groundwater in many parts ofCanada, including British Columbia, Nova Scotia, Manitoba, and Ontario,as well as in New Hampshire and Michigan. In one area of Nova Scotia,10% of samples of well water from areas with natural arsenic sources con-tained more than 500 ppb arsenic. The U.S. Environmental ProtectionAgency (EPA) recently concluded an extensive study on As in water andrecommended lowering the MAC to 10 ppb, in line with the World HealthOrganization (WHO) and many European countries. Consumption of watercontaining arsenic concentrations above drinking-water guidelines overlong periods of time can cause a variety of health effects. Arsenic is one ofthe few metals recognized as a carcinogen, and as such is on the drinkingwater Priority Substance List 1. Arsenic has been implicated to cause atype of skin cancer that is very common, along with cancers of other inter-nal organs.
Different forms of arsenic have varying degrees of toxicity. The triva-lent form, As(III), is the most toxic, followed by the pentavalent form,As(V), and then by the organic forms. The average person consumesabout 10 µg/d of As through water and food. Most of the exposure comesfrom eating seafood and meat; however, As in food is usually found in theless toxic organic forms. Smoking also exposes humans to arsenic.
Cadmium Cadmium (Cd) is usually found associated with zinc oresand is therefore released into the environment during the production ofzinc and other ores. Cadmium may also be present as an impurity in othermetals. The natural average of Cd in the earth’s crust is 0.1–0.2 mg/kg. It ismost commonly found in the environment in the Cd(II) form and is usuallypresent in water as an inorganic complex. At pH values above 7, most ofthe Cd is bound to sediments. Canada produced 890 tonnes of Cd in 1982,with most of it being exported. It is used in metal plating, alloys, pigments,Ni–Cd batteries, as a plastic stabilizer, and in a number of other smallerapplications. The use of Cd has been increasing over time. The majorsources of Cd contamination in the environment are municipal and indus-trial wastes.
The major source of Cd for humans is food. Cd is not an essential ele-ment. It may be released from sediments or dissolved into solution by adecrease in pH. Unpolluted water contains less than 1 ppb Cd. Levelsfound in Lake Erie and Lake Ontario were below 1 ppb in most cases
30 L. RITTER ET AL.

(Nriagu et al., 1996), with a few samples as high as 2 ppb. Cd has beenfound in Ontario sewage sludge at concentrations between 4 and 9 ppm(National Research Council of Canada [NRCC], 1979). Rain in Ontariowas found to have an average Cd concentration of 0.8 ppb. Anothersource of Cd may be impurities in pipes and other plumbing equipment.Flushing pipes before drawing water for consumption can reduce thisexposure. Long-term consumption of high levels of Cd may cause accu-mulation of Cd in the kidneys and may cause itai-itai disease, which leadsto weakening of bones.
Chromium Chromium (Cr) is mostly found in the nontoxic Cr(III)form; however, it can be oxidized to the toxic Cr(VI) form by chlorinationin drinking water treatment plants. Cr(III) forms stable complexes withnegatively charged organic or inorganic species in water. Cr is naturallyfound in soils at concentrations up to 120 ppm. Cr is widely used in themetallurgy industry. It is not usually found in the dissolved form in watersabove pH 5.
Cr(III) is essential for humans, while Cr(VI) is toxic to humans in highdoses and is not essential. Chromium is found in the Great Lakes at con-centrations between 0.0002 to 0.019 ppm, with an average of 0.001ppm. The concentrations of Cr in raw and treated water are predomi-nantly below maximum acceptable concentrations. The major route ofexposure to humans is via food consumption. Smoking is also suggestedto make significant contributions to Cr exposure in humans (NRCC,1976).
Copper Copper (Cu) is a common metal that is found in the environ-ment most frequently as Cu(II), but also as Cu(I). The Cu(II) ion is usuallyfound complexed with organic species such as humic and fulvic acids, orparticle or colloid associated. It is often used for plumbing pipes, wire,wood preservatives, pesticides, animal feed, water disinfection, etc. In 1981over 150,000 tonnes of Cu was produced in Ontario. Mine tailings contain-ing copper and other metals have been disposed of in Lake Superior in thepast and may contribute some Cu to the aquatic environment. Copper isoften widely distributed in water.
Copper is an essential micronutrient for plants, as well as for animalsand humans. Significant health effects do not occur until concentrationsof Cu are much higher than the aesthetic guideline (1000 µg/L), which isset to prevent staining of plumbing fixtures. Much of the Cu found in tap-water is due to leaching from Cu pipes that are used to distribute water inhomes. Studies of tapwater from across Canada indicate that Cu is pre-sent at safe levels. Almost 90% of the average Canadian’s intake of Cu isthrough food.
Iron and Manganese Iron (Fe) is the fourth most common element inthe earth’s crust. Iron ore deposits are found in Ontario and are used mainlyfor the production of steel. Iron and manganese (Mn) are very common indrinking water.
SOURCES, PATHWAYS, AND RISKS OF CONTAMINANTS IN WATER 31

Iron and Mn are essential nutrients for human life. The majority of Feand Mn exposure comes from food. Concentrations of Fe and Mn in mostwaters do not present any significant hazards to human life. The aestheticwater quality guidelines (300 and 50 µg/L for Fe and Mn, respectively) areset to prevent precipitates from forming in pipes and to prevent undesir-able tastes and color.
Lead The average lead (Pb) concentration in the earth’s crust is 10ppm. Lead has many commercial uses. Over a quarter million tonnes ofPb was produced in Canada in 1984. It is used in batteries, solder, paints,ammunition, and pipes, and was extensively used as a gasoline additive.Lead additives were banned in most forms of gasoline in 1990. However,vast amounts of Pb that were released into the environment from thecombustion of leaded gasoline are still present in the environment andmay be available to cycle. In many cases the Pb is held in soils or sedi-ments. Pb is also found in the air; however, these levels have begun todecrease since the elimination of Pb from gasoline in the 1970s. In aquaticecosystems, Pb is usually found in sediments.
Lead affects the central nervous system of humans, especially chil-dren. It is a nonessential element and a cumulative poison if chronically in-gested. Most of the Pb found in treated water is introduced from pipesand solder. Flushing of pipes for 3–5 min before drinking should signifi-cantly decrease exposure to Pb. Soil, dust, and paint are the major sourcesof Pb exposure for children. Lead exposure for young children is of con-cern due to the high percentage of Pb that is absorbed into the body; ab-sorption is thought to impair mental function. The majority of Pb expo-sure to humans is through food (NRCC, 1978).
Mercury Mercury (Hg) is a natural and anthropogenic contaminant.It is released naturally from volcanoes and from weathering of soils. In itselemental state it has a high vapor pressure, meaning it can be easilyvolatilized. In natural waters it can be found in three ionic forms, depend-ing on the pH, redox conditions, and other environmental parameters.When sufficient chloride ion is present in water, the most common form isHgCl2, with sulfide forms present in sediments. Human sources of Hg in-clude fossil fuels, municipal waste incinerators, pulp mills, dentalamalgams, electrical equipment, fungicides, seed coatings, and industrialwastes. Chloralkali plants near rivers and lakes in Ontario have dumpedmassive amounts of Hg into the waters, resulting in contaminated fish andsediments that will continue to be a cause of concern for many years tocome. Up to 1960, a plant near Sarnia released up to 90 kg Hg/d into ad-jacent waterways. Creation of hydroelectric reservoirs also results in highHg concentrations in the water and fish in the reservoir. This is attribut-able to mercury release from the decomposing vegetation and soils in theflooded zone (Mierle & Ingram, 1991). Sang and Lourie (1995) reportedthat 5138 kg Hg is released by humans into Ontario’s environment eachyear. Approximately half of this is released into the air and the other half
32 L. RITTER ET AL.

into water bodies. The amount released from natural sources may be muchgreater. However, it is important to remember that these are estimates andthere is continuing debate over the numbers. Nriagu (1997) estimated that39 tonnes of Hg was released into the Canadian environment in 1990, withhalf of this from nonferrous metal production.
Mercury as a contaminant is known for its toxicity, its tendency tobioaccumulate, and its persistence. Hg can readily transform into themore toxic methylmercury form in the environment and can accumulatein fish. This methylated Hg in fish is the largest source of Hg exposure tohumans, primarily through ingestion of contaminated fish and wildlife.Advisories have been issued for the consumption of fish from the GreatLakes due to high levels of Hg in fish. It is a candidate to be banned in theGreat Lakes (Sang & Lourie, 1995). Hg is not an essential element andcauses neurological and renal problems in humans. The alkylated formsare teratogenic, meaning they cause harm to fetal tissues. Concentrationsof Hg are low in most raw and treated water, except near areas of severecontamination. With tighter regulation on the use of Hg, the amounts pre-sent in water have begun to decline. Concentrations of Hg in the GreatLakes range from 13 to 18 ppb.
Selenium The average concentration of selenium (Se) in the crust is0.09 mg/kg. Like most metals, it is not distributed evenly over the earth’ssurface. Selenium is found in a variety of oxidation states and is easilytaken up by plants. It is a by-product in the production of other ores.Canada is a major exporter of Se, which has a variety of uses, includingthe production of pigmented glass, microelectronics, stainless steel, andexplosives. In some parts of California’s agricultural regions, irrigationrunoff has been found to contain extremely high levels of Se.
Se is an essential element for humans; however, it is unclear if exces-sive amounts may cause cancer. Most water sources that were tested hadSe levels that were considered safe. Higher concentrations were found inproximity to urban areas, indicating anthropogenic origins. Ingestion offood is the major source of Se for humans.
Uranium Uranium (U) is a radioactive element that may be found inwater in areas with high levels of U mineralization, including areas inOntario. It may also be found in mine tailings, and from human activitiesusing U such as the nuclear industry. Nuclear power plants are the mainend users of U. It is also released from the combustion of fuels such ascoal. Canada produced 11,000 tonnes of U in 1984. Most of the humanexposure to U is through food.
Zinc Zinc (Zn) is a common element and its average concentrationin Canadian soils is 90 ppm. Zn is usually associated with ores of othercommon metals such as Pb, Cu, Cd, and Fe. It is used in steel, as an in-dustrial metal, and in galvanizing, along with numerous other uses.Smelters release significant quantities of Zn into the air. Over a milliontonnes of Zn was produced in Canada in 1984. A 1980 estimate shows
SOURCES, PATHWAYS, AND RISKS OF CONTAMINANTS IN WATER 33

that over 750,000 tonnes of natural Zn and over 400,000 tonnes of anthro-pogenic Zn were released into the Canadian environment.
Zn is an essential element that has a recommended daily intake of atleast 8 mg/d for adults. Unpolluted freshwater usually has less than 15ppb Zn. The concentrations of Zn in air are higher in southern Ontariothan in northern Ontario. Higher concentrations of Zn were found in pre-cipitation near smelting operations, such as those found near Sudbury.Concentrations of Zn in some lakes used for drinking water in Ontariowere found to be below 10 ppb. Water in pipes and plumbing fixturescan be enriched in Zn due to leaching of galvanized pipes and otherplumbing fixtures. Food accounts for over 99% of a typical Canadian’s Znintake. The Zn water quality guideline of 5 ppm is an aesthetic objective,set because of the potential for objectionable tastes at higher levels.
Other Metals The major metals of concern have just been dis-cussed. There are other metals that may be significant in localized areas,such as near geological formations or near mining or smelting operations.The largest nickel (Ni) and copper mining, smelting, and refining complexin the world is located near Sudbury. Higher environmental contamina-tion with Ni is possible in regions such as Sudbury (Nriagu et al., 1998).Silver is another industrial metal that may be of concern in some areas, itis often found in wastewaters associated with photographic processing.Both Ag and Ni are found in sewage. Tin compounds such as tributyltin(TBT) are used as antifouling paints to protect the hulls of ships fromattracting barnacles and algae. They are toxic to aquatic organisms andare found in water bodies that are frequented by boats (Randall et al.,1986).
Exposure to Metals From Sources Other Than Water
Primary nonaqueous pathways of trace metals to humans are throughconsumption of food, occupational exposure, smoking, and air. Manypharmaceutical and therapeutic products (described later) also containmetals and may be a significant route of exposure for some individuals. Itis important to realize that these sources of exposure are intimately linkedwith those from drinking water and should therefore be considered col-lectively in the risk assessment process.
Risk Assessment and Management of Metals
Risk assessment of trace metals and metal compounds requires anunderstanding of the fundamental differences between inorganic metalcompounds and organic compounds. There are unique attributes of tracemetals that must be considered in all steps of the risk assessment process.As naturally occurring substances that persist over time in altered forms,risk associated with the toxicity of the various trace metal elements mustbe carefully examined in the context of its species, form, and bioavail-ability. Many metals are essential for health of organisms, and contamina-
34 L. RITTER ET AL.

tion of waters with nonmetallic contaminants that reduce essential tracemetal bioavailability is as much of concern as excessive loading of tracemetal contaminants.
Identification of trace metal exposure hazards relies on informationabout toxicity, persistence, and potential to bioaccumulate in an ecosys-tem food chain. Although toxicity is the universal measure of potential ofhazard applied to all substances, not all substances demonstrate a toxicresponse. In the case of metals, this is important because some relativelynontoxic metal species can be transformed into potentially very toxiccompounds depending on the biological, chemical, and physical charac-teristics of the receiving environment. Short-term, or acute, toxicity drivesthe hazard identification process, whereas chronic toxicity endpointssuch as reproductive success and growth impairment are secondary mea-sures of hazard identification . An additional important consideration isthat metal exposure is cumulative. Unlike exposures to microorganisms,which can be traced back to the source, metal exposure is continuousover a lifetime, so it is difficult to determine the time or route of exposurethat may lead to toxic effects.
Petroleum
In Ontario, there are currently seven petroleum refineries. Wastewaterdischarged from these industries may contain a wide range of organic andmetallic pollutants, including phenols, oil and grease, sulfides, ammonianitrogen, and polycyclic aromatic hydrocarbons (PAHs) (Government ofCanada, 1996). Some of these are used or produced during the process ofrefining, but many are already contained in the crude oil itself (Govern-ment of Canada, 1996). Of these contaminants, PAHs have attracted thegreatest attention because they are ubiquitous in the environment andsome are highly toxic. PAHs may have significant impacts on aquatic eco-systems where they become entrained in sediments and are accumulatedby aquatic biota (Huggett et al., 1992). From a human risk perspective,PAHs constitute a significant health concern because some, such as benzo-[a]pyrene, have been shown to be carcinogenic. Importantly, PAHs havebeen detected in groundwater due to leaching of oils or creosote fromspills, untreated discharges, or poor waste management practices (Muelleret al., 1989). For example, one of the common waste disposal methods inthe petrochemical industry is the use of deep wells (described later). Ingeneral, this is a safe disposal practice, but it can lead to significant conta-mination of groundwater, as was the case in western Ontario (LambtonCounty) in the early 1970s. Goss et al. (1998) found no evidence of petro-leum derivatives in well water from wells that were located within 60 m ofa fuel storage tank on 160 farms. This suggests that there were few inci-dences of pertoleum spills, leakages, or seepage to the groundwater, orthat the relatively lipophilic PAHs were sequestered by soil particles andhence rendered immobile.
SOURCES, PATHWAYS, AND RISKS OF CONTAMINANTS IN WATER 35

Because hydrocarbon processing is a water-intensive practice, the petro-leum industry uses and discharges large volumes of wastewater to surfacewaters. Petroleum-associated contaminants in the wastewater may arise fromsix separate wastewater streams that flow out of the refinery subsystem. Oiland its associated PAHs are the most common contaminants in refineryeffluent, but much of this is typically treated and recovered for reuse in therefinery using separators before entering into the final mill effluent. Sludgeproduced during this process is treated in the sludge disposal system to pro-duce inert solids for land disposal (Finelt & Crump, 1980).
Most of the refinery effluent undergoes extensive treatment, but some islost to evaporation and cooling tower blowdown. The effluent is treatedusing secondary treatment in an activated sludge unit. The treated waste-water resulting from these processes flows into a mixing and surge pond,where further treatment can upgrade the quality for reuse in cooling towermakeup. The biological oxygen demand of the wastewater can be reducedto less than half its original value by using a secondary treatment process.Notably, the dissolved organics that occur in some effluents are not amen-able to biological degradation and require tertiary treatment using acti-vated carbon adsorption or reverse osmosis for removal (Beychok, 1980). Afinal holding basin downstream of the treatment system allows for dilutionof effluent and reprocessing of effluent in the case of a plant malfunction.Chlorination may also be added to this last step of the treatment process ifthere is any pathogenic (coliform) contamination present in the total waste-water (Beychok, 1980).
With a strong effort in reducing environmental impact to meet regula-tions, the petroleum refining industry has undergone important technologi-cal advances in all areas of pollution management, including wastewater.At present, the petroleum industry is subject to a number of environmentalregulations under the Petroleum Refinery Effluent Regulations of the Fish-eries Act (Government of Canada, 1997). These regulations limit the amountof oil and grease, phenols, sulfide, ammonia nitrogen, and total suspendedmatter that can be discharged by a refinery in a 24-hour or month-longperiod (Government of Canada, 2000a). The 1996 Compliance InspectionSummary Report gave a 99% compliance rate for the 84 company reportsreceived (Government of Canada, 1997). With more efficient treatmentprocesses including filters and reverse osmosis units, effluent dischargeshave been reduced by up to 90% over the last two decades (Government ofCanada, 1996). Overall, there does not appear to be any substantial envi-ronmental or human health risks associated with petroleum refining basedon present-day practices. However, despite significant reductions in thevolume of wastewater and associated contaminants over the past 20 years,concerns still persist over discharges of carcinogenic substances and otherpotentially toxic metal and organic contaminants to surface waters (Govern-ment of Canada, 1996). Moreover, localized areas of sediment contamina-tion, particularly in some Great Lakes Areas of Concern (e.g., Hamilton
36 L. RITTER ET AL.
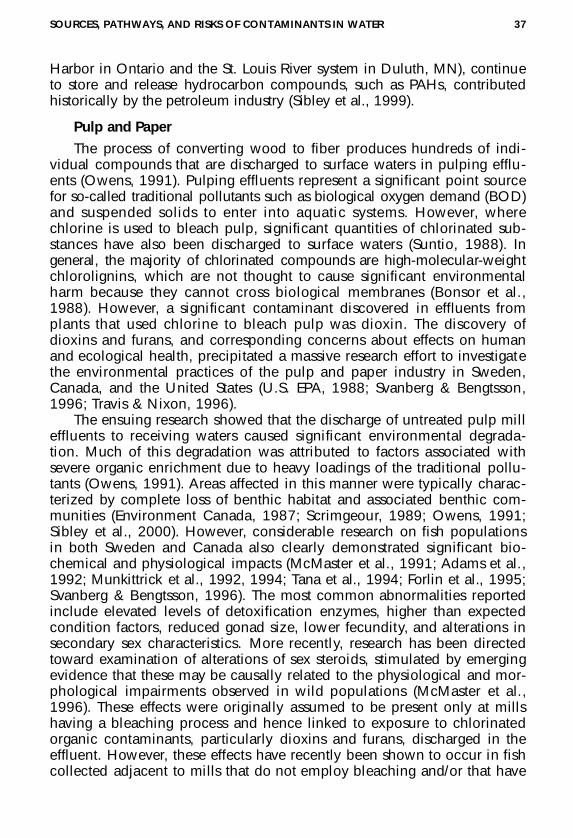
Harbor in Ontario and the St. Louis River system in Duluth, MN), continueto store and release hydrocarbon compounds, such as PAHs, contributedhistorically by the petroleum industry (Sibley et al., 1999).
Pulp and Paper
The process of converting wood to fiber produces hundreds of indi-vidual compounds that are discharged to surface waters in pulping efflu-ents (Owens, 1991). Pulping effluents represent a significant point sourcefor so-called traditional pollutants such as biological oxygen demand (BOD)and suspended solids to enter into aquatic systems. However, wherechlorine is used to bleach pulp, significant quantities of chlorinated sub-stances have also been discharged to surface waters (Suntio, 1988). Ingeneral, the majority of chlorinated compounds are high-molecular-weightchlorolignins, which are not thought to cause significant environmentalharm because they cannot cross biological membranes (Bonsor et al.,1988). However, a significant contaminant discovered in effluents fromplants that used chlorine to bleach pulp was dioxin. The discovery ofdioxins and furans, and corresponding concerns about effects on humanand ecological health, precipitated a massive research effort to investigatethe environmental practices of the pulp and paper industry in Sweden,Canada, and the United States (U.S. EPA, 1988; Svanberg & Bengtsson,1996; Travis & Nixon, 1996).
The ensuing research showed that the discharge of untreated pulp milleffluents to receiving waters caused significant environmental degrada-tion. Much of this degradation was attributed to factors associated withsevere organic enrichment due to heavy loadings of the traditional pollu-tants (Owens, 1991). Areas affected in this manner were typically charac-terized by complete loss of benthic habitat and associated benthic com-munities (Environment Canada, 1987; Scrimgeour, 1989; Owens, 1991;Sibley et al., 2000). However, considerable research on fish populationsin both Sweden and Canada also clearly demonstrated significant bio-chemical and physiological impacts (McMaster et al., 1991; Adams et al.,1992; Munkittrick et al., 1992, 1994; Tana et al., 1994; Forlin et al., 1995;Svanberg & Bengtsson, 1996). The most common abnormalities reportedinclude elevated levels of detoxification enzymes, higher than expectedcondition factors, reduced gonad size, lower fecundity, and alterations insecondary sex characteristics. More recently, research has been directedtoward examination of alterations of sex steroids, stimulated by emergingevidence that these may be causally related to the physiological and mor-phological impairments observed in wild populations (McMaster et al.,1996). These effects were originally assumed to be present only at millshaving a bleaching process and hence linked to exposure to chlorinatedorganic contaminants, particularly dioxins and furans, discharged in theeffluent. However, these effects have recently been shown to occur in fishcollected adjacent to mills that do not employ bleaching and/or that have
SOURCES, PATHWAYS, AND RISKS OF CONTAMINANTS IN WATER 37

secondary treatment of effluent (Personen & Andersson, 1992; Munkittricket al., 1994).
In response to both scientific and public pressure, the pulp and paperindustry has undergone extensive changes over the past two decadesaimed at reducing pollutants loadings to aquatic environments. At themills themselves, internal (e.g., changes to in-mill processes such as sub-stituting or eliminating the use of chlorine to bleach pulp) and external(e.g., installation of secondary treatment facilities) changes have led tosignificant reductions in the loadings of both traditional and chlorinatedcontaminants to aquatic environments. For example, between 1988 and1994, loadings of total suspended solids were reduced by 68%, BOD fellby 65%, and the release of dioxins was reduced by 99.4% (Governmentof Canada, 1996). At present, most pulp mill effluents in Canada are nolonger toxic based on toxicity tests with fish and invertebrates. In addi-tion, the pulp and paper industry is currently in the second iteration ofthe Environmental Effects Monitoring Program, which is designed to trackchanges in the environmental effects of effluents in relation to changingmill practices and to ensure compliance with existing legislation underthe Fisheries Act.
Sewage Treatment and Combined Storm Water Overflows
The collection, treatment, and disposal of wastewater and solids frommunicipal wastewater treatment plants (WWTPs) may contribute signifi-cant loadings of contaminants to surface waters and groundwater via sev-eral direct and indirect routes: (1) discharge of effluent to surface waters,(2) leakage from old or improperly maintained collecting sewers, (3) leak-age from the treatment plant during waste processing, (4) land disposal oftreatment plant effluent and solids, and (5) leaching and runoff of sludgefollowing land disposal. The most significant route in terms of volume isdischarge to surface waters, although spills and overflows may also besignificant. The latter two routes may lead to contamination of groundwa-ter, especially if the surface water into which the effluent is dischargedrecharges local aquifers or material is leached through the soil. WhereWWTPs are combined with storm-sewer overflows, flow volume may bean important factor determining the quantity of pollutants discharged tosurface waters. For example, a recent survey comparing the relative con-tribution of flow volume, and hence contaminant loading, to surfacewaters from storm-water runoff, combined sewer overflows, and WWTPeffluent discharge in 47 urban centers in Ontario showed that flow vol-ume varied considerably among jurisdictions in relation to precipitationevents (Schroeter, 1997). For example, in dry weather conditions, flowvolumes varied at 17–65% for storm water, 1–6% for combined seweroverflows, and 35–80% for WWTP effluents. However, in wet weatherconditions, the flow volume proportions changed to approximately 80%,7%, and 13% for these sources, respectively.
38 L. RITTER ET AL.

Effluents from WWTPs are derived predominantly from householdand industrial sources. (Chambers et al., 1997). The effluent may containsolids, suspended and dissolved substances that may incur a biologicaloxygen demand in receiving waters, nutrients, pathogens, organic chemi-cals, metals, and oil and grease (Ontario Ministry of the Environment,1988; Chambers et al., 1997; Li & McAteer, 2000). From a human healthperspective, potential impacts of sewage treatment and combined seweroverflows on drinking water quality have focused predominantly on path-ogenic pollution and nutrient contamination. However, up to 200 chemi-cals have been identified from effluents of WWTPs and combined seweroverflows. Interestingly, sewage treatment effluents have recently beenshown to contain a variety of hormonally active agents (chemicals thatare capable of disrupting the endocrine system), such as alkylphenol eth-oxylate surfactants (Bennie, 1999; Servos, 1999). There is also emergingevidence that WWTP effluents contain numerous pharmaceuticals, theenvironmental fate and effects of which are virtually unknown (Halling-Sorensen, 1998; Koenig et al., 2000). Next, we briefly discuss the sourcesand pathways of four contaminant classes discharged to surface waterand groundwater from WWTP and combined sewer overflow effluents:pathogens, nutrients, hormonally active agents, and pharmaceuticals.Note that contaminant loading issues related to urban and storm waterrunoff are treated separately under non-point-source pollution.
Pathogens The most significant from of pollution from sewage treat-ment and combined storm-water overflows is pathogenic. Sewage treat-ment plants contribute numerous species of potentially infectious agentsincluding Salmonella, coliforms, viruses, and protozoans to surface waters(Table 8). These pathogens are commonly detected in treated waste watertreatment effluents, often long distances below the point of discharge(Geldreich, 1996). Drinking water intake pipes of municipalities locateddownstream of such effluent discharge points may then draw high num-bers of pathogenic organisms.
Separate and combined sewer systems that bypass treatment duringintense storms are major sources of coliforms to surface waters. For exam-ple, the U.S. EPA (1998a) found that approximately 32% of degradedriver miles in United States rivers in a nationwide survey could be attrib-uted to pathogenic pollution. This compares to 51% by siltation and 40%by nutrient enrichment (see Table 2). In the Great Lakes region, manymiles of shoreline are routinely impaired by pathogenic contaminationand many beaches close during the summer months due to human healthconcerns (U.S. EPA, 1998a). Although much of this contamination resultsfrom the discharge of sewage treatment effluents and combined stormsewer overflows, pathogens from agricultural activity and urban runoffalso contribute significantly to degradation of water quality (these lattertwo sources are discussed in greater detail later; see also commis-sion paper by Goss et al., 2001).
SOURCES, PATHWAYS, AND RISKS OF CONTAMINANTS IN WATER 39

Nutrients Household sewage represents the largest point-source dis-charge of nitrogen and phosphorus to the Canadian environment (Chamberset al., 2001) (Table 9). However, relative to nonpoint discharges such asagriculture and atmospheric deposition, the contribution of these nutri-ents from sewage treatment plants and combined storm sewer overflowsis comparatively low (<20%). Based on a comprehensive review of allsources of nutrients to Canadian surface waters, Chambers et al. (1997)concluded that N and P loading has increased risks to human health byincreasing the frequency and spatial extent to which drinking waterguidelines for nitrate are exceeded in groundwater. Indeed, as discussedlater, it is not uncommon to observe a relatively high proportion of excee-dences of nitrate water quality criteria in rural well waters (Briggins &Moerman, 1995; Frank et al., 1990). Further, they have led to an increasein blooms of blue green algae, which are capable of producing naturaltoxins that pose risks to human health (see natural toxins, later). They mayalso impart undesirable tastes and ordors in drinking water. From an eco-system perspective, increased N and P loadings have accelerated eutrophi-cation (nutrient enrichment) in some rivers, lakes, and wetlands, with aconcomitant decline in diversity and habitat quality.
40 L. RITTER ET AL.
TABLE 8. Major Infectious Agents Found Globally in Contaminated Drinking Waters
Organism Disease Primary sources
BacteriaCampylobacter Gastroenteritis Human fecesEnteropathogenic E. coli Gastroenteritis Human fecesSalmonella (1700 spp.) Typhoid fever/salmonellosis Human/animal fecesShigella (4 spp.) Bacillary dysentery Human fecesVibrio cholerae Cholera Human fecesYersinia enterocolitica Gastroenteritis Human/animal fecesLegionella pneumonophila Acute respiratory illness Thermally enriched waters
VirusesAdenovirus Upper respiratory and Human feces
gastrointestinal illnessEnteroviruses (71 types) Aseptic meningitis poliomyeltis Human fecesHepatitis A Infectious hepatitis Human fecesNorwalk virus Gastroenteritis Human fecesReovirus Mild upper respiratory and Human/animal feces
gastrointestinal illnessRotavirus Gastroenteritis Human fecesCoxsackie virus Aseptic meningitis Human feces
ProtozoansBalantidium coli Balantidiasis (dysentery) Human fecesCryptosporidium entamoeba Amoebic dysentery Human feces
histolyticaGiardia lamblia Giardiasis (gastroenteritis) Human feces
Note. Adapted from Olivieri (1986) and Geldreich (1990).

Hormonally Active Agents In recent years, there has been increasingconcern regarding potential adverse human and environmental healtheffects of various contaminants that act on the endocrine system (Colbornet al., 1993, 1996; NRC, 1999). These compounds, designated as hormon-ally active agents, or endocrine disruptors, have been alleged to includemany well-studied compounds such as organochlorine pesticides (e.g.,DDT, toxaphene, dieldrin), phenolics (e.g., alkylphenol ethoxylates), PCBs,and dioxins and furans. A comprehensive list of known or suspected hor-monally active agents was compiled by Keith (1997); a listing of major
SOURCES, PATHWAYS, AND RISKS OF CONTAMINANTS IN WATER 41
TABLE 9. Comparison of Nitrogen and Phosphorus Loading (103 tonnes/yr) to Canadian SurfaceWater and Groundwater from Various Sources
Nutrient source Nitrogen Phosphorus
Municipal wastewater treatment plants 80.3 5.6Sewers 11.8 2.3Septic systems 15.4 1.9Industrya 11.8 2.0Agriculture b 293 55Aquaculture 2.3 0.5Atmospheric deposition to water 182 N/A
Note. From Chambers et al. (2001).aIndustrial N loads are based on NO3 + NH3 and are thus dissolved inorganic nitrogen and not
total nitrogen.bDetermined as the difference between the amount of N or P available to the growing crop and
that removed in harvest (data are not available regarding the proportion of this residual that moves tosurface or groundwater).
TABLE 10. Estrogenic Potencies of Some Common Xenoestrogens, Relative to 17- b -Estradiol (E2)
Vitellogenin induction__________________________________________Maximum % Potency relative
Compound LOECa (µM) of max E2 to E2
17-b -Estradiol 0.002 100 1Diethylstilbestrol (DES) 0.006 135 0.5Methoxychlor 5 48 1 × 10⁻³
o,p-DDT 25 19 2 × 10⁻⁴
Chlordecone 20 3.2 1 × 10⁻⁴
Bisphenol A 50 10 1 × 10⁻⁴
4-t-Pentylphenol 50 10 1 × 10⁻⁴
o,p-DDE NDb ND NDToxaphene ND ND NDb -Endosulfan ND ND NDDieldrin ND ND ND
Note. Adapted from Smeet et al. (1999).aLowest-observed-effect concentration; see glossary for definition.bNot detected.

classes of hormonally active agents in the Canadian environment is pro-vided by Hewitt and Servos (2001), selected examples of which are listedin Table 10. Toxicological concerns have arisen from evidence that thesecompounds may, under conditions of high exposure, mimic the action ofthe female sex hormone, causing developmental and reproductive effects inwildlife. Strong evidence for such action has been observed among birdpopulations that feed on contaminated fish (Fox, 1992; Giesy et al., 1994),but several studies have also demonstrated the potential for endocrine dis-ruption in a wide variety of organisms, ranging from invertebrates to mam-mals (NRC, 1999). Recently, a series of papers was published in which evi-dence for endocrine disruption in humans and wildlife in the Canadianenvironment are reviewed (McMaster, 2001; Fox, 2001; Foster, 2001;Munkittrick, 2001). These studies suggest that there is strong evidence forendocrine disruption (e.g., reproductive and developmental impairment) incertain populations, but there has been little progress in linking these effectswith specific contaminants. Importantly, some scientists have hypothesizedthat exposure of humans to hormonally active agents may produce effectson reproduction and development similar to that observed in wildlife andmay be involved, for example, in the increasing incidence of breast cancerin human populations (Davis et al., 1993). Further, dietary exposure to PCBshas been correlated with intellectual deficits in children who have beenbreast-fed in some Great Lakes areas (Colborn et al., 1996).
Hormonally active agents enter the environment from a wide variety ofsources, both natural and anthropogenic. Exposure of humans and wildlifeto naturally occurring phytoestrogens from plants and vegetables is com-mon. There is little scientific consensus as to the potential risks that thesenatural estrogen mimics pose to humans; however, whatever risks exist,they probably do not result from exposure via drinking water since expo-sure to phytoestrogens is predominantly via dietary sources. This is also trueof exposure of humans and wildlife to many anthropogenic hormonallyactive agents, because most are highly lipophilic (James & Kleinow, 1994).However, sparingly soluble, endocrine-active compounds like PCBs, DDT,and alkylphenol ethoxylates are routinely detected in surface water sam-ples from the Great Lakes, albeit at extremely low concentrations (Pearsonet al., 1996; Bennie et al., 1997). These compounds could be taken up inthe influent water by water treatment plants, although most would notpass through the treatment process and into the final distribution water.Nonetheless, a number of hormonally active agents have been detected atvarious times in drinking water. Surprisingly, few hormonally active agentsare routinely monitored in water treatment plants in Ontario. Althoughexposure via drinking water is a comparatively minor exposure route forhumans, exposure could occur if contaminated water is ingested from anuntreated source.
Pharmaceuticals Despite widespread use in numerous sectors ofsociety, until recently, pharmaceuticals (or medical substances) received
42 L. RITTER ET AL.

little attention as potential contaminants in drinking water. However,there is considerable emerging evidence that pharmaceutical compoundsare relatively widespread in the surface waters of many countries, espe-cially in water bodies receiving effluent from sewage treatment facilitie s(Halling-Sorensen et al., 1998; Buser, 1999; Daughton & Ternes 1999;Stumpf et al., 1999). In most cases, the concentrations of pharmaceuticalsin surface waters occur in the nanograms to micrograms per liter range,with the highest concentrations generally found in waters receiving efflu-ent from sewage treatment plants. However, some pharmaceuticals havealso been detected in surface waters that are remote from points of sewagedischarge (Daughton & Ternes, 1999), suggesting that some may be atleast moderately persistent in the environment.
The various sources and routes of pharmaceuticals in the environmentare provided in Figure 6. In Ontario, sewage treatment plants are probablythe primary source of pharmaceuticals in surface waters and many havebeen detected in sewage discharges (Koenig et al., 2000). However, it islikely that pharmaceuticals will also be detected in other aquatic matricesin Ontario as they have in other countries. For example, pharmaceuticalshave been detected in groundwater via leachates from landfill sites (Eckel etal., 1993; Holm et al., 1995) and in sediments in conjunction with aqua-
SOURCES, PATHWAYS, AND RISKS OF CONTAMINANTS IN WATER 43
FIGURE 6. Sources and pathways of pharmaceutical compounds in aquatic environments. Modifiedfrom Halling-Sorensen et al. (1998).

cultural practices (Jacobsen & Berglind, 1988; Kerry et al., 1995). In the lat-ter source, antibiotics administered to fish that are not consumed fall to thebottom to be accumulated in the sediments or discharged after treatment.Veterinary pharmaceuticals used as growth additives in livestock operations(eliminated in urine) could occur in surface waters as runoff from fields thathave been subjected to spreading of manure. The same situation may existin relation to land application of human sludge. Similarly, contamination ofgroundwater may occur due to mineralization of compounds in the manureor sludge as it lies on the field (Halling-Sorensen et al., 1998). Interestingly,Hirsch et al. (1999) found little evidence of groundwater contamination bypharmaceuticals in areas influenced by agriculture or when sewage wasapplied to fields.
While numerous pharmaceuticals have been identified in a number ofenvironmental matrices, the extent to which pharmaceuticals occur in drink-ing water in Ontario and other jurisdictions is virtually unknown. Inter-estingly, clofibric acid, a common pharmaceutical, was routinely detected indrinking water in Germany, where it was thought to have originated fromvarious medical applications (Stan et al., 1994). Unfortunately, there is noconcerted effort to monitor pharmaceuticals in drinking water in Canada, sothe potential effects of these compounds on human health are essentiallyunknown. Similarly, despite routine detection in surface waters, there isnothing known of the potential effects of pharmaceuticals on aquatic biota.It must be kept in mind that pharmaceuticals are designed with the intentionof eliciting biological effects, often at very low concentrations. One areaof concern is the potential for many antibiotic pharmaceuticals to induceresistance among natural bacterial populations, a phenomenon that hasalready been demonstrated in aquacultural applications (Kerry et al., 1995;Kummerer, 2000). In light of recent experiences with hormonally activeagents, which may impair development and reproduction in humans andwildlife at low concentrations, it is essential to investigate this class ofcompounds in order to provide a strong basis upon which to assess theirpotential risk to humans and aquatic biota.
Water Treatment and Disinfection By-Products
Most surface water in North America would be unpotable withoutsome form of treatment to remove pathogens and contaminants (Naimanet al., 1995). Water may be disinfected using a number of treatmentmethods (WHO, 1996): (1) chlorination, in which water is treated withelemental chlorine; (2) chloramination, in which water is treated withmonochloramine; (3) chlorine dioxide; (4) iodination (generally only usedfor short-term disinfection); (5) ozonation, in which water is injected withozone to destroy organic compounds that impart taste or odor to drinkingwater; and (6) irradiation with ultraviolet (UV) light. Of these disinfectionprocedures, the most common method of treatment on a global basis ischlorination; in Ontario, chlorination is also the disinfection method used
44 L. RITTER ET AL.
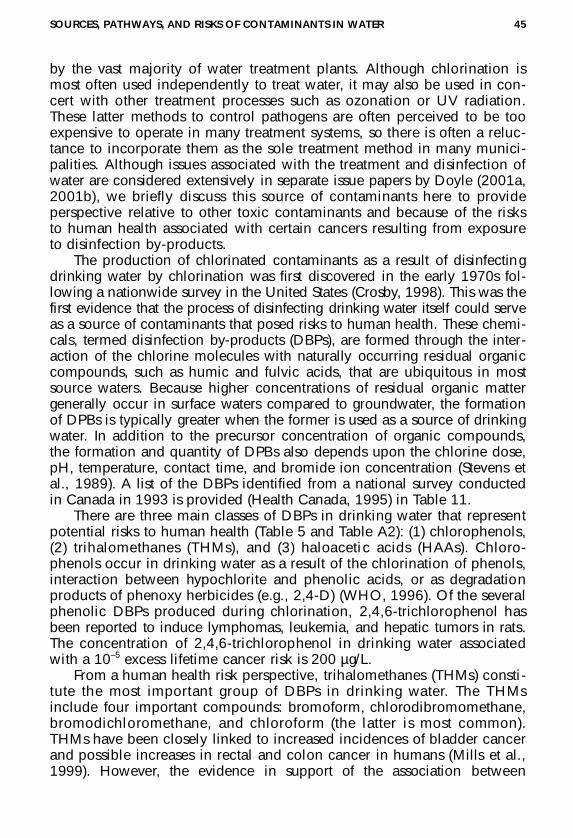
by the vast majority of water treatment plants. Although chlorination ismost often used independently to treat water, it may also be used in con-cert with other treatment processes such as ozonation or UV radiation.These latter methods to control pathogens are often perceived to be tooexpensive to operate in many treatment systems, so there is often a reluc-tance to incorporate them as the sole treatment method in many munici-palities. Although issues associated with the treatment and disinfection ofwater are considered extensively in separate issue papers by Doyle (2001a,2001b), we briefly discuss this source of contaminants here to provideperspective relative to other toxic contaminants and because of the risksto human health associated with certain cancers resulting from exposureto disinfection by-products.
The production of chlorinated contaminants as a result of disinfectingdrinking water by chlorination was first discovered in the early 1970s fol-lowing a nationwide survey in the United States (Crosby, 1998). This was thefirst evidence that the process of disinfecting drinking water itself could serveas a source of contaminants that posed risks to human health. These chemi-cals, termed disinfection by-products (DBPs), are formed through the inter-action of the chlorine molecules with naturally occurring residual organiccompounds, such as humic and fulvic acids, that are ubiquitous in mostsource waters. Because higher concentrations of residual organic mattergenerally occur in surface waters compared to groundwater, the formationof DPBs is typically greater when the former is used as a source of drinkingwater. In addition to the precursor concentration of organic compounds,the formation and quantity of DPBs also depends upon the chlorine dose,pH, temperature, contact time, and bromide ion concentration (Stevens etal., 1989). A list of the DBPs identified from a national survey conductedin Canada in 1993 is provided (Health Canada, 1995) in Table 11.
There are three main classes of DBPs in drinking water that representpotential risks to human health (Table 5 and Table A2): (1) chlorophenols,(2) trihalomethanes (THMs), and (3) haloacetic acids (HAAs). Chloro-phenols occur in drinking water as a result of the chlorination of phenols,interaction between hypochlorite and phenolic acids, or as degradationproducts of phenoxy herbicides (e.g., 2,4-D) (WHO, 1996). Of the severalphenolic DBPs produced during chlorination, 2,4,6-trichlorophenol hasbeen reported to induce lymphomas, leukemia, and hepatic tumors in rats.The concentration of 2,4,6-trichlorophenol in drinking water associatedwith a 10–5 excess lifetime cancer risk is 200 µg/L.
From a human health risk perspective, trihalomethanes (THMs) consti-tute the most important group of DBPs in drinking water. The THMsinclude four important compounds: bromoform, chlorodibromomethane,bromodichloromethane, and chloroform (the latter is most common).THMs have been closely linked to increased incidences of bladder cancerand possible increases in rectal and colon cancer in humans (Mills et al.,1999). However, the evidence in support of the association between
SOURCES, PATHWAYS, AND RISKS OF CONTAMINANTS IN WATER 45

bladder cancer and DBPs is considered to be inadequate by the Interna-tional Agency for Research on Cancer (WHO, 1996). The levels of thesecompounds associated with a 10–5 excess lifetime cancer risk are 200, 60,100, and 100 µg/L for chloroform, bromodichloromethane, chlorodibromo-methane, and bromoform, respectively.
Chlorinated acetic acids (haloacetic acids) formed during disinfectioninclude mono-, di-, and trichloroacetic acid. Of these, the latter twooccur most frequently in treated water and also represent the greatestrisks to human health. Dichloroacetic acid has been used pharmaceuti-cally and has been shown to induce hepatic tumors in mice; however,evidence in support of cancer in humans is considered to be insufficient
46 L. RITTER ET AL.
TABLE 11. Identity and Ranges of Concentrations for Disinfection By-Products Analyzed in TreatedWater (Immediately Prior to Distribution) in a 1993 National Survey Conducted by Health Canada, withCorresponding Water Quality Values, Where Available
MACa WHOb Concentration range (µg/L)d
or IMAC guideline IARC ___________________Disinfection by-product (Canada) (µg/L) designationc Summer Winter
Trihalomethanes (THMs) 0.1 mg/L — 2B 0.2–342.4 0.2–221.1Chloroform (trichloromethane) NA 200 2B 0.2–335.9 0.2–216.2Bromodichloromethane NA 60 2B <0.1–29.8 <0.1–16.7Chlorodibromomethane NA 100 3 <0.1–19.8 <0.1–9.0Bromoform NA 100 3 <0.1–4.2 <0.1–3.3
Haloacetic acids (HAAs)Monochloroacetic acid NA — 3 0.21–12.1 0.17–7.5Dichloroacetic acid NA 50 NA 0.25–163.3 0.11–45.4Trichloroacetic acid NA 100 NA <0.01–296.1 <0.01–473.1Monobromoacetic acid NA NA NA <0.01–2.3 <0.01–9.22Dibromoacetic acid NA NA NA <0.01–1.9 <0.01–1.98
Other DPBsDichloroacetonitrile NA 90 3 <0.1–15.0 <0.1–16.3Trichloroacetonitrile NA 1 3 <0.1–0.2 <0.1–0.5Bromochloroacetonitrile NA — 3 <0.1–3.7 <0.1–2.4Dibromoacetonitrile NA 100 3 <0.01–1.9 <0.01–1.91,1-Dichloro-2-propanone NA NA NA <0.1–2.6 <0.1–3.71,1,1-Trichloro-2-propanone NA NA NA <0.1–9.3 <0.1–10.1Chloral hydrate NA 10 NA <0.1–18.6 <0.1–22.5Chloropicrin NA NA NA <0.1–2.5 <0.1–1.6Bromide ion 0.01 mg/L NA NA 10–500 2–500
aMAC, maximum allowable concentration; IMAC, interim MAC.bFrom WHO (1996). Level determined as the concentration of drinking water associated with a life-
time cancer risk of 10–5.cInternational Agency for Research on Cancer: Group 1A, chemical is carcinogenic to humans; Group
2A, chemical is probably carcinogenic to humans; Group 2B, chemical is possibly carcinogenic tohumans; Group 3, chemical is not classifiable as to its carcinogenicity to humans; Group 4, chemical isprobably not carcinogenic to humans.
dRepresents minimum and maximum values measured in distribution water at the treatment plants(n = 53) assessed across Canada.

(WHO, 1996). Trichloracetic acid has been used as a herbicide and theacetate form has been found to induce hepatic tumors and is mutagenicin in vitro assays. The levels of these two compounds associated with a10–5 excess lifetime cancer risk are 50 and 100 µg/L, respectively.
Debates surrounding the merits and potential risks associated with thepractice of chlorination versus other forms of disinfection have beenprevalent in the scientific and trade journal literature and public fora formany years. The recent declination by the people of Erickson, BritishColumbia, to chlorinate their water supply is testimony to the intensityand passion invoked by the issue of water chlorination. The issues sur-rounding DBPs provides us with an excellent opportunity to remind our-selves of the relative nature of risk. That is, while both chlorination andnonchlorination possess inherent risks to human health, the risks associatedwith failing to treat water are generally deemed to substantially outweighthose associated with the practice of disinfecting water. Indeed, in mostjurisdictions, the failure to treat water in some manner is associated withwell-recognized and significant human health risks, most notably thoseassociated with the transmission of pathogenic disease and infection. In-creased exposure to many of the chemicals discussed in this documentmay also occur. An overall assessment of the impact of disinfection onpubic health must consider both the microbiological quality of the treatedwater and the toxicity of the disinfectants and their reaction products(WHO, 1996). However, where local circumstances require that a choicemust be made between meeting either microbiological quality or guide-lines for disinfectants or disinfectant by-products, microbiological qualitymust always take precedence (WHO, 1996). In the absence of new, risk-free technologies for water disinfection, the challenge that we are facedwith at present, therefore, is how to best manage water disinfection in amanner that maximizes the reduction of risk without compromising disin-fection efficiency (Health Canada, 1996a).
Although not a disinfection by-product per se, fluoride is another com-monly encountered halogen in drinking water. Like chlorine, the addition offluorine to water has been enveloped in public controversy. Fluoride is awidespread, naturally occurring element that accounts for approximately 0.3g/kg of the earth’s crust and occurs widely in surface waters (WHO, 1996).Although fluoride can be obtained through the diet, supplemental fluorida-tion of drinking water is routinely conducted because it has been shown tosignificantly reduce dental caries (bacterial decay of teeth), particularlyamong children (Health Canada, 1996a; WHO, 1996). However, inorganicfluorides are also toxic, with forms such as sodium fluoride, sodium fluo-rophosphate, and cryolite (sodium aluminum fluoride) historically beingused as insecticides and rodenticides (Crosby, 1998). Chronic exposure tofluoride may cause mottled teeth and eventually bone defects, the latterresulting from the replacement of hydoxy (OH–) groups with F– in the struc-tural mineral apatite of bones (WHO, 1984).
SOURCES, PATHWAYS, AND RISKS OF CONTAMINANTS IN WATER 47
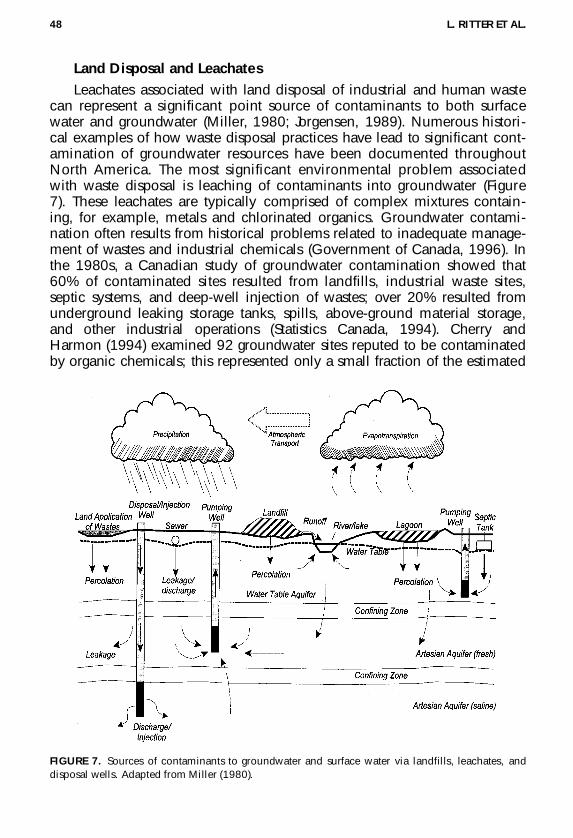
Land Disposal and LeachatesLeachates associated with land disposal of industrial and human waste
can represent a significant point source of contaminants to both surfacewater and groundwater (Miller, 1980; Jorgensen, 1989). Numerous histori-cal examples of how waste disposal practices have lead to significant cont-amination of groundwater resources have been documented throughoutNorth America. The most significant environmental problem associatedwith waste disposal is leaching of contaminants into groundwater (Figure7). These leachates are typically comprised of complex mixtures contain-ing, for example, metals and chlorinated organics. Groundwater contami-nation often results from historical problems related to inadequate manage-ment of wastes and industrial chemicals (Government of Canada, 1996). Inthe 1980s, a Canadian study of groundwater contamination showed that60% of contaminated sites resulted from landfills, industrial waste sites,septic systems, and deep-well injection of wastes; over 20% resulted fromunderground leaking storage tanks, spills, above-ground material storage,and other industrial operations (Statistics Canada, 1994). Cherry andHarmon (1994) examined 92 groundwater sites reputed to be contaminatedby organic chemicals; this represented only a small fraction of the estimated
48 L. RITTER ET AL.
FIGURE 7. Sources of contaminants to groundwater and surface water via landfills, leachates, anddisposal wells. Adapted from Miller (1980).

number of existing sites. Although more recent containment systems aregenerally constructed using elaborate leak prevention systems, there are stillsignificant problems associated with contamination from historical contain-ment practices, many of which often consisted of nothing more than a holein the ground that was covered with dirt (Jorgensen, 1989). These problemshave been exacerbated by poor management practices in the past and a cor-responding lack of detailed records pertaining to the location and the natureof the material stored within the landfill.
There are numerous types of land disposal systems, each with its ownpotential to contribute anthropogenic contaminants to surface waters andgroundwater (Miller, 1980; Devinny, 1990; Qasim & Chang, 1994; Shah,2000). Sources and pathways of contaminants from landfills, leachates,and containment systems are considered briefly next; other aspects arealso discussed in detail elsewhere in this article.
Industrial Wastewater Impoundments Industrial wastewater im-poundments are storage facilities designed to store liquid waste or liquid–solid waste mixtures, usually for the purpose of waste treatment (Miller,1980). Surface impoundments are most common and are used to storeorganic wastes from municipal wastewater and sewage treatment facilitiesand animal feedlots and farms, and hazardous wastes from numerousindustries, including oil and gas, mining, pulp and paper, and chemicaloperations (Jorgensen, 1989; Shah, 2000).
Once treated, the liquid waste is primarily discharged to local surfacewaters; residual waste solids resulting from the waste treatment processare either incinerated, applied to land (this is common for solid wastematerial from municipal, agricultural, and some pulp and paper wastetreatment), or sent to a land fill site. Treated waste material discharged aseffluent from wastewater impoundments can represent a significant pointsource of contaminants to surface waters. The type of contaminants dis-charged will, of course, depend upon the industry in question, and someof these were discussed in greater detail earlier.
Leakage or seepage of contaminants from wastewater impoundmentsinto surrounding shallow aquifers can also lead to localized contamina-tion of groundwater. Leakage can occur as a result of flawed design orpoor construction, system failure, or accident. In view of the diversity ofmunicipal and industrial applications, wastewater impoundments can con-tribute a wide variety of contaminants to groundwater.
Leaking Underground Storage Tanks Underground storage tanks(USTs) have long been used to store toxic chemicals, particularly petroleumproducts such as gasoline, diesel and heating oil, waste oil, and aviation fuel(Devinny & Lu, 1990; Swaigen, 1995). When leaks occur in these tanks(whereupon they are referred to as LUSTs) due to age, neglect, or impropermaintenance, there is significant potential for widespread groundwater con-tamination. For example, a single liter of gasoline leaked from a under-ground storage tank can contaminate up to 1 million liters of groundwater
SOURCES, PATHWAYS, AND RISKS OF CONTAMINANTS IN WATER 49

(Environment Canada, 2000a). In 1986, Environment Canada estimated thatas many as 200,000 USTs may be present in Canada and that between10,000 and 20,000 of these may be leaking (Swaigen, 1995). Based on theassumption that Ontario has approximately 17% of the gas stations inCanada (Swaigen, 1995), there are potentially between 1700 and 3400 leak-ing tanks in the province of Ontario.
From both an environmental and human health perspective, the pri-mary toxicological concern of underground storage tanks that are used tostore petroleum products is the occurrence of BTEX compounds (benzene,toluene, ethylbenzene, and xylenes). Benzene is the most significant ofthese because it is known to be a potent carcinogen (Group 1 classifica -tion by IARC). In Canada, the maximum allowable concentration of ben-zene in drinking water associated with an excess lifetime cancer risk of10–5 is 5 µg/L (Health Canada, 1996b). The other three compounds arecurrently regulated on the basis of aesthetic objectives (taste and odor)and have no established maximum allowable concentrations in drinkingwater in Canada (Health Canada, 1996b) or Ontario (Phyper & Ibbotson,1994).
Landfills and Dumps Landfills and dumps are primarily used to dis-pose of solid wastes generated by human or animal activities. A dump isgenerally defined as an uncovered disposal site in which there is little orno regard for pollution control or aesthetics (Miller, 1980). A landfill isgenerally defined as a disposal site in which cover is provided and thereis some concern for pollution control and aesthetics. There are two typesof landfill sites, a sanitary landfill and a secured landfill. Only the latter isdesigned to ensure that there is no hydraulic connection with naturalwaters, but there are few examples of these in practice (Miller, 1980).
Land disposal of solid wastes can be a significant source of contami-nants to groundwater via the generation of leachates, which are caused bythe percolation of water through the refuse and waste materials. Leachatesare highly mineralized fluids that may contain a toxic mixture of contami-nants (Qisam & Chiang, 1994; Shah, 2000). Leachates from landfills inwhich industrial and manufacturing wastes have been dumped often con-tain hazardous chemicals such as heavy metals (e.g., cyanide, cadmium,lead) and chlorinated organics (e.g., PCBs, chlorinated hydrocarbons),which may pose concerns to human health should the leachate enter intoaquifers that supply water for drinking. Untreated, private wells are mostsusceptible in this regard. Leachates may enter surface waters if there ishydraulic connection between the contaminated groundwater and localsurface waters (e.g., a stream). In this case, lipophilic compounds associ-ated with the leachate (e.g., PCBs) could be accumulated by aquaticbiota and ultimately passed up the food chain. For example, organochlo-rines have been detected in the water and biota throughout the NiagaraRiver system, and these have been traced to leachates from hazardouswaste dump sites located adjacent to the river in New York (Government
50 L. RITTER ET AL.

of Canada, 1996). These compounds eventually find there way into LakeOntario and undoubtedly into the influent water abstracted by watertreatment facilities to supply municipalities with drinking water.
Septic Tanks and Cesspools In the United States, septic tanks andcesspools discharge or leak the highest quantity of wastewater of allsources directly to groundwater (Miller, 1980). For this reason, concernsregarding potential risks to human health from this source are predomi-nantly associated with contamination of groundwater with pathogensoriginating in the discharged or leaked septic fluids. However, significantabove-ground contamination may also occur if leaks or damaged tanksbreak through the soil surface. In addition to potential risks from expo-sure to pathogens from surface-associated sludge from leaking or brokentanks/cesspools, significant local odor problems may also prevail. Nitratesin groundwater may also constitute a significant problem (nutrients arediscussed in greater detail later), although the extent to which these origi-nate from septic systems relative to other sources is not well understood.Potential risks to human health are greatest in rural areas, where bacterialcontamination of drinking water extracted from private wells may occur.For example, Goss and Barry (1995) reported that approximately one-thirdof wells on 1200 rural farms were contaminated with bacteria. However, inrural areas, it is often difficult to differentiate between contamination due torunoff and leaching of animal manure or to faulty septic systems (Conboy &Goss, 1999). If properly maintained, bacterial contamination of ground-water by septic systems can be negligible (Seyfried & Joy, 1995). Interest-ingly, Rudolph and Goss (1993) found no significant correlation betweenthe proximity of a wellhead to the septic tank or weeping bed at distancesup to 300 ft in rural areas.
Land Application of Sludges The land application of sludges (alsoreferred to as residual waste materials and biosolids), usually over farmand forest land, is becoming increasingly common and can represent anenvironmentally responsible method of disposing of residual waste mate-rials and recycling nutrients to the soil (OMAFRA, 1998). This subject istreated comprehensively in a separate issue paper (Reilly, 2001) and isconsidered here briefly to provide perspective.
Municipal (sewage treatment) and industrial sludge is the residual mate-rial that remains after treatment of wastewater. In the agriculture, applica-tion of residual waste materials from both municipal (human wastes) andfarming (animal wastes) origins has been practiced by farmers for manyyears. When applied using one of several best management practices, theland application of residual waste materials can be conducted in a mannerthat minimizes losses via runoff and leaching, thereby ensuring mainte-nance of environmental quality (Miner et al., 2000). However, land appli-cation of residual waste material can lead to contamination of surfacewater via runoff or of groundwater via leaching. Common contaminantsassociated with farms sludges include pathogens and nutrients (nitrogen
SOURCES, PATHWAYS, AND RISKS OF CONTAMINANTS IN WATER 51
and phosphorus), while contaminants associated with municipal or indus-trial sludges may include heavy metals, toxic chemicals, pharmaceuticals,pathogens, and nitrates.
Disposal Wells/Deep-Well Injection Disposal or drainage wells arewells drilled into the ground for the express purpose of disposing of indus-trial waste, sewage effluent, spent cooling water, storm water, and agricul-tural drainage (Miller, 1980). The primary concern associated with disposalwells is contamination of groundwater aquifers. Drainage wells are particu-larly common in agriculture where they are used to remove surface and sub-surface drainage and maintain favorable soil moisture levels (Tobin & Raja-gopal, 1990). However, they may also channel agricultural contaminants,such as pathogens and nutrients, directly into underground aquifers (Bakeret al., 1985; Tobin & Rajagopal, 1990), which supply water for drinking.
Disposal wells are also commonly used by the chemical, petroleum,metals, minerals, aerospace, and wood-preserving industries. In the UnitedStates, more than 8 billion gallons (approximately 32 billion liters) of indus-trial wastes is disposed of annually in deep injection wells (Wickstrom &Baranowski, 2001), a practice that has resulted in the contamination ofgroundwater supplies in a number of jurisdictions (Jorgensen, 1989). Com-parable statistics for Ontario and Canada could not be located, although thistechnology for waste disposal is used on both a national and provincialbasis.
A common form of disposal well is the deep injection well, which isprincipally used by industry to dispose of hazardous wastes. It is a popu-lar disposal method within industry because of its relatively low cost(Jorgensen, 1989). As the name implies, deep disposal wells are drilleddeep into the ground, often between 1000 and 6000 ft, to the point atwhich an appropriate geologic formation for holding the wastes can belocated (Shah, 2000). Such a formation usually consists of permeable,brackish sandstone or limestone/dolomite deposits confined by layers ofrelatively impermeable geologic deposits (Jorgensen, 1989). The waterassociated with these deposits is characteristically saline and unpotable.In most situations, disposal of wastes using deep disposal wells can bepracticed safely. However, chemicals contained in the waste material mayenter into usable groundwater supplies through small cracks and fissuresin the well casings or the geologic formation itself if the latter are notdetected prior to construction of the well. Moreover, the chemicals them-selves may corrode geological formations such as limestone, leading tothe movement of contaminants into adjacent aquifers.
Brine Disposal from Petroleum Exploration and DevelopmentDisposal of brine solutions from oil and gas production has been a histor-ical problem in areas of intense petroleum exploration and development(Miller, 1980). In these areas, the principal problem has been contamina-tion of surface waters via direct discharge of saline effluent waters, or ofgroundwater via leaching of the effluent from unlined pits. Occasionally,
52 L. RITTER ET AL.

metals may also be present in the brine solutions and these may alsoenter surface waters or leach to groundwater. As this practice has beenprohibited for many years, this form of pollution is no longer consideredto be a major point source of water contamination (Miller, 1980). How-ever, in the United States deep disposal wells (described earlier) are cur-rently used for the injection of brines resulting from oil and gas produc-tion or of fluids used for the enhanced recovery of oil or natural gas (Shah,2000). In Ontario, due to the relatively small size of the oil and gas indus-try (restricted to southwestern regions of the province), brine disposal hasgenerally not represented a significant source of groundwater contamina-tion in the province. Further discussion of the petroleum industry, and itsrelationship to surface water and groundwater contamination, was pro-vided earlier under industrial sources of contamination.
Disposal of Animal Feedlot Wastes Issues related to the sources andpathways of contaminants associated with animal wastes are described inseparate sections earlier and later in this article. For additional informa-tion on this subject, the reader is referred to the issue paper of Goss et al.(2001) and the book by Miner et al. (2000). With recent concerns overthe construction of so-called factory farms and concerns over the disposalof the large volumes of animal waste generated from such farms, it is likelythat pathogenic and nutrient contamination issues related to the manage-ment of feedlot wastes will continue well into the future.
Abandoned/Poorly Constructed Wells An area of potentially signifi-cant, yet poorly understood, groundwater contamination is that originatingfrom abandoned and poorly constructed wells. In Ontario, it is estimatedthat there may be up to 100,000 abandoned wells. These abandoned wells,along with existing, older wells, which may be poorly constructed and donot meet current standards, represent a direct conduit for contaminants togroundwater (Gustafsson, 1993). Indeed, in a study of Nebraska wells, Exnerand Spaulding (1985) found a strong correlation between well constructionquality and the likelihood of groundwater contamination. In most cases,greatest environmental and human health concerns center around thepotential for pathogenic contamination of groundwater sources; however,other chemicals and nutrients associated with runoff may also enter intothese wells.
In many cases, abandoned wells are difficult to locate due to poor his-torical records. Thus, plugging these wells as stipulated in current regula-tions (regulation 903 in Ontario; Ontario Ministry of the Environment, 1998)cannot be conducted (OMAFRA, 1998). Moreover, the cost of plugging and/or repairing poorly constructed wells may be high (up to $10,000 to prop-erly plug a well), so there is often a lack of incentive for owners to reportexisting wells that are no longer in service or to repair those that require it.
According to Gustafsson (1993), a properly constructed drinking-waterwell (e.g., one in which groundwater contamination potential is minimized)should have the following features:
SOURCES, PATHWAYS, AND RISKS OF CONTAMINANTS IN WATER 53
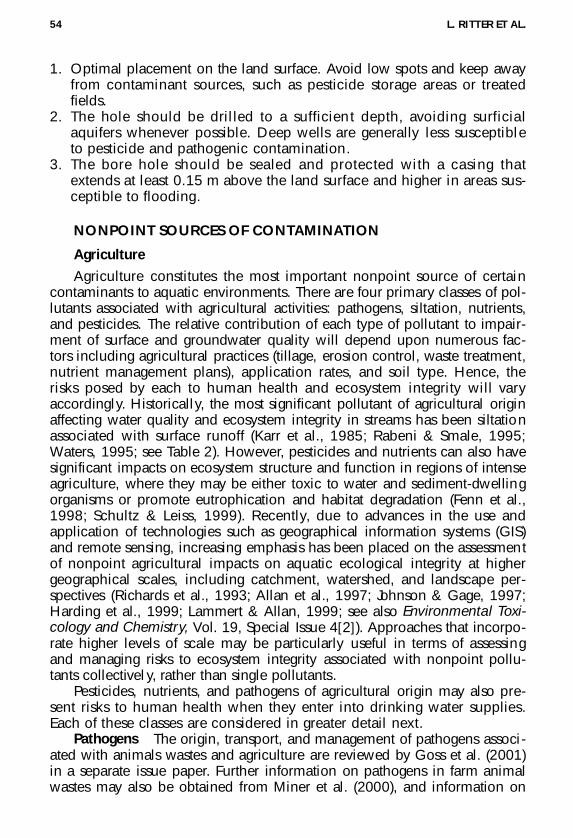
1. Optimal placement on the land surface. Avoid low spots and keep awayfrom contaminant sources, such as pesticide storage areas or treatedfields.
2. The hole should be drilled to a sufficient depth, avoiding surficialaquifers whenever possible. Deep wells are generally less susceptibleto pesticide and pathogenic contamination.
3. The bore hole should be sealed and protected with a casing thatextends at least 0.15 m above the land surface and higher in areas sus-ceptible to flooding.
NONPOINT SOURCES OF CONTAMINATION
Agriculture
Agriculture constitutes the most important nonpoint source of certaincontaminants to aquatic environments. There are four primary classes of pol-lutants associated with agricultural activities: pathogens, siltation, nutrients,and pesticides. The relative contribution of each type of pollutant to impair-ment of surface and groundwater quality will depend upon numerous fac-tors including agricultural practices (tillage, erosion control, waste treatment,nutrient management plans), application rates, and soil type. Hence, therisks posed by each to human health and ecosystem integrity will varyaccordingly. Historically, the most significant pollutant of agricultural originaffecting water quality and ecosystem integrity in streams has been siltationassociated with surface runoff (Karr et al., 1985; Rabeni & Smale, 1995;Waters, 1995; see Table 2). However, pesticides and nutrients can also havesignificant impacts on ecosystem structure and function in regions of intenseagriculture, where they may be either toxic to water and sediment-dwellingorganisms or promote eutrophication and habitat degradation (Fenn et al.,1998; Schultz & Leiss, 1999). Recently, due to advances in the use andapplication of technologies such as geographical information systems (GIS)and remote sensing, increasing emphasis has been placed on the assessmentof nonpoint agricultural impacts on aquatic ecological integrity at highergeographical scales, including catchment, watershed, and landscape per-spectives (Richards et al., 1993; Allan et al., 1997; Johnson & Gage, 1997;Harding et al., 1999; Lammert & Allan, 1999; see also Environmental Toxi-cology and Chemistry, Vol. 19, Special Issue 4[2]). Approaches that incorpo-rate higher levels of scale may be particularly useful in terms of assessingand managing risks to ecosystem integrity associated with nonpoint pollu-tants collectively, rather than single pollutants.
Pesticides, nutrients, and pathogens of agricultural origin may also pre-sent risks to human health when they enter into drinking water supplies.Each of these classes are considered in greater detail next.
Pathogens The origin, transport, and management of pathogens associ-ated with animals wastes and agriculture are reviewed by Goss et al. (2001)in a separate issue paper. Further information on pathogens in farm animalwastes may also be obtained from Miner et al. (2000), and information on
54 L. RITTER ET AL.

pathogens in drinking water in Ontario may be obtained from Geldreich(1996), Conboy and Goss (1997, 1999), Goss et al. (1998) and Rudolph etal. (1998). Thus, we provide only a brief contextual description of patho-genic pollution in relation to agricultural activities and potential humanhealth risks.
Pathogenic pollution of drinking water from agricultural sources posesthe most significant health risks to that segment of the population thatdraws its water from private wells located within areas of agriculturalactivity. A number of pathogens are commonly associated with animalwastes in agriculture, including the H7:0157 variant of Escherichia coli.Although this variant has been implicated as a significant pathogen asso-ciated with well-water contamination from agriculture, in fact normalvariants of this bacteria (e.g., fecal coliforms) are a far more common sourceof contamination. These pathogens may enter private wells via surfacerunoff or groundwater. Wells positioned below grade or that are poorlysealed are particularly susceptible to contamination via surface runoff;wells that are old, have deteriorated, or are poorly constructed are mostsusceptible to contamination via groundwater.
From either source, contamination of drinking water supplies can be sig-nificant. A series of recent, comprehensive surveys of farm wells in Ontariohave revealed relatively high levels of bacterial contamination. For example,Conboy and Goss (1999) found that 52.9% and 59.2% of wells tested (n =302) exceeded the provincial water quality objective for total coliforms andfecal coliforms, respectively, on at least one occasion during the 12-monthperiod in which they were sampled. In that study, it was shown that the bac-terial contamination was associated with an increase in the proportion ofindividuals experiencing diarrhea; no other illnesses were noted and theincreased incidences of diarrhea did not increase the number of visits to thehospital. Interestingly, these authors indicated that there has been a signifi-cant increase in the number of wells showing E. coli contamination betweenthe early 1950s and the mid 1990s (Conboy & Goss, 1997).
Pesticides Pesticides have been used widely to control pests in agri-culture since the middle of the 20th century. Many of the early pesticideswere chlorinated organics (e.g., DDT, chlordane, dieldrin), which, due totheir propensity to bioaccumulate, were subsequently discovered to haveserious environmental effects, including significant risks to human health(Colborn et al., 1996). These problems were brought to the attention ofthe public by Rachel Carson in the book Silent Spring, and with it camethe birth of the environmental movement. Although most of the problempesticides have long been banned in North America, their residues can stillbe found in many environmental matrices, particularly in the Arctic (seelater section on atmospheric transport). Moreover, there are renewed con-cerns about potential risks that these persistent pesticides may pose tohuman health in light of recent evidence that some of these chemicalsaffect functioning of the endocrine system and may lead to developmen-tal and reproductive problems in wildlife and humans (NRC, 1997).
SOURCES, PATHWAYS, AND RISKS OF CONTAMINANTS IN WATER 55
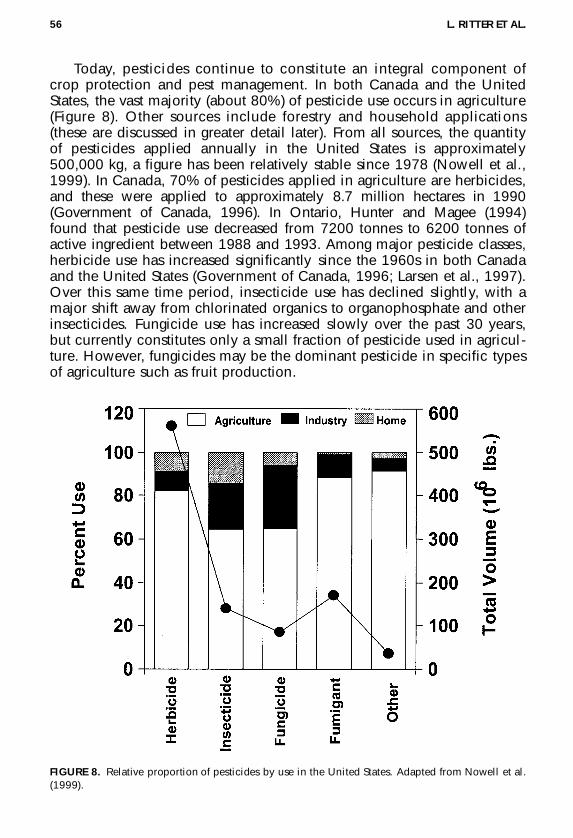
Today, pesticides continue to constitute an integral component ofcrop protection and pest management. In both Canada and the UnitedStates, the vast majority (about 80%) of pesticide use occurs in agriculture(Figure 8). Other sources include forestry and household applications(these are discussed in greater detail later). From all sources, the quantityof pesticides applied annually in the United States is approximately500,000 kg, a figure has been relatively stable since 1978 (Nowell et al.,1999). In Canada, 70% of pesticides applied in agriculture are herbicides,and these were applied to approximately 8.7 million hectares in 1990(Government of Canada, 1996). In Ontario, Hunter and Magee (1994)found that pesticide use decreased from 7200 tonnes to 6200 tonnes ofactive ingredient between 1988 and 1993. Among major pesticide classes,herbicide use has increased significantly since the 1960s in both Canadaand the United States (Government of Canada, 1996; Larsen et al., 1997).Over this same time period, insecticide use has declined slightly, with amajor shift away from chlorinated organics to organophosphate and otherinsecticides. Fungicide use has increased slowly over the past 30 years,but currently constitutes only a small fraction of pesticide used in agricul-ture. However, fungicides may be the dominant pesticide in specific typesof agriculture such as fruit production.
56 L. RITTER ET AL.
FIGURE 8. Relative proportion of pesticides by use in the United States. Adapted from Nowell et al.(1999).
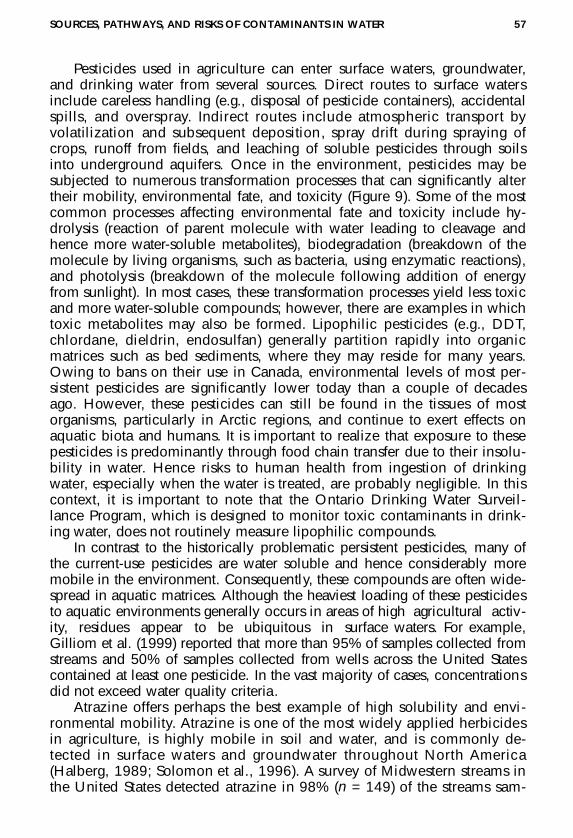
Pesticides used in agriculture can enter surface waters, groundwater,and drinking water from several sources. Direct routes to surface watersinclude careless handling (e.g., disposal of pesticide containers), accidentalspills, and overspray. Indirect routes include atmospheric transport byvolatilization and subsequent deposition, spray drift during spraying ofcrops, runoff from fields, and leaching of soluble pesticides through soilsinto underground aquifers. Once in the environment, pesticides may besubjected to numerous transformation processes that can significantly altertheir mobility, environmental fate, and toxicity (Figure 9). Some of the mostcommon processes affecting environmental fate and toxicity include hy-drolysis (reaction of parent molecule with water leading to cleavage andhence more water-soluble metabolites), biodegradation (breakdown of themolecule by living organisms, such as bacteria, using enzymatic reactions),and photolysis (breakdown of the molecule following addition of energyfrom sunlight). In most cases, these transformation processes yield less toxicand more water-soluble compounds; however, there are examples in whichtoxic metabolites may also be formed. Lipophilic pesticides (e.g., DDT,chlordane, dieldrin, endosulfan) generally partition rapidly into organicmatrices such as bed sediments, where they may reside for many years.Owing to bans on their use in Canada, environmental levels of most per-sistent pesticides are significantly lower today than a couple of decadesago. However, these pesticides can still be found in the tissues of mostorganisms, particularly in Arctic regions, and continue to exert effects onaquatic biota and humans. It is important to realize that exposure to thesepesticides is predominantly through food chain transfer due to their insolu-bility in water. Hence risks to human health from ingestion of drinkingwater, especially when the water is treated, are probably negligible. In thiscontext, it is important to note that the Ontario Drinking Water Surveil-lance Program, which is designed to monitor toxic contaminants in drink-ing water, does not routinely measure lipophilic compounds.
In contrast to the historically problematic persistent pesticides, many ofthe current-use pesticides are water soluble and hence considerably moremobile in the environment. Consequently, these compounds are often wide-spread in aquatic matrices. Although the heaviest loading of these pesticidesto aquatic environments generally occurs in areas of high agricultural activ-ity, residues appear to be ubiquitous in surface waters. For example,Gilliom et al. (1999) reported that more than 95% of samples collected fromstreams and 50% of samples collected from wells across the United Statescontained at least one pesticide. In the vast majority of cases, concentrationsdid not exceed water quality criteria.
Atrazine offers perhaps the best example of high solubility and envi-ronmental mobility. Atrazine is one of the most widely applied herbicidesin agriculture, is highly mobile in soil and water, and is commonly de-tected in surface waters and groundwater throughout North America(Halberg, 1989; Solomon et al., 1996). A survey of Midwestern streams inthe United States detected atrazine in 98% (n = 149) of the streams sam-
SOURCES, PATHWAYS, AND RISKS OF CONTAMINANTS IN WATER 57

58
FIG
UR
E 9.
Source
s, sinks, p
athw
ays, and
mov
emen
t of p
esticide
s in te
rrestrial a
nd aqu
atic env
iron
men
ts.

pled (Thurman et al., 1991). In southern Ontario, atrazine was detected inmost surface waters flowing into the Great Lakes (Frank et al., 1982).Solomon et al. (1996), in a comprehensive probabilistic environmentalrisk assessment of atrazine in North American surface waters, concludedthat this compound does not pose a significant risk to the aquatic envi-ronment. However, it was noted that a subset of surface waters in areas ofintense atrazine use may be at greater risk and should be subjected toindependent, site-specific risk assessments.
Because of its solubility and mobility, atrazine is commonly detectedin groundwater samples throughout many parts of North America andCanada in areas in which this herbicide is used (Gustafsson, 1993). In a re-cent survey of 7 high-use herbicides in groundwater of the United States,atrazine was detected in approximately 20% of shallow groundwater sites(Barbash et al., 1999). The widespread occurrence of atrazine in ground-water is not surprising, as this compound was ranked as having the highestleaching potential in a survey of 86 pesticides by the Canadian government(McRae, 1991). Atrazine is commonly detected in drinking-water suppliesdrawn from both surface-water and groundwater sources. For example, inour survey of drinking water from water treatment plants in Ontario,atrazine was the most frequently detected (and most frequently measured)pesticide (see Table 19, later in this article). Goss et al. (1998) detectedatrazine in 6.6 and 10.5% of approximately 1300 domestic wells sampledin the winter and summer, respectively. Briggins and Moerman (1995)found atrazine in 32% of wells (n = 102) in Nova Scotia, although nonewere above the Canadian water quality criterion of 5 µg/L. Other pesticidesdetected in that study (<4% of wells) included simazine, metribuzin,alachlor, metolachlor, captan, chlorothalonil, dimethoate, and permethrin.
On the basis of the hazard assessment that we conducted, the esti-mated hazard quotients for atrazine based on the maximum concentra-tions found in both treated drinking water and well water were all wellbelow 1, suggesting little risk to human health associated with its occur-rence in this matrix. However, the widespread and persistent occurrenceof this compound in water supply systems continues to raise concernsabout potential effects on human health resulting from long-term, chronicexposures. In this context, it is interesting to note that exposure to lowconcentrations of atrazine was recently shown to increase the productionof males in water fleas (Daphnia pulicaria), a species in which males aretypically rare (Dobson et al., 1999). These authors suggested that this effectby atrazine could have been due to hormonal interference (endocrine dis-ruption). However, in a similar study using comparable exposure conditionsand atrazine concentrations, Hosmer et al. (2000) found no evidence tosupport a shift in sex ratio in this species.
In Ontario, a number of extensive surveys have been conducted tomeasure pesticide concentrations in surface water and groundwater. Theearliest surveys were conducted on the occurrence of pesticides in drink-
SOURCES, PATHWAYS, AND RISKS OF CONTAMINANTS IN WATER 59

ing water by the Ministry of the Environment during the mid 1980s inresponse to evidence that alachlor, a widely used herbicide, had beenimplicated as a possible carcinogen in animal studies (Ontario Ministry ofthe Environment, 1985). The first survey was targeted to agricultural areasand to a lesser extent areas that were hydrogeologically susceptible tocontamination (Ontario Ministry of the Environment, 1987a). In total, ninepesticides, all herbicides, were detected in the wells. At least 1 pesticidewas detected in 51% of the wells sampled, while 21% contained residuesof at least 2 pesticides (Table 12). Of those wells that tested positive, 95%contained residues of atrazine. A similar survey was conducted in 1986,with site selection restricted to avoid well construction/placement prob-lems (Ontario Ministry of the Environment, 1987b). The results of this morerestricted survey were similar to those of the 1985 survey with respect tothe percentage of detections, but the number of multiple detections andmaximum concentrations was generally lower. A key finding of these sur-veys was that contamination of the wells was due approximately equallyto surface-water and groundwater contamination.
In a series of studies on pesticide contamination of farm wells andgroundwater in Ontario, Frank and colleagues found varying frequenciesof contamination. For example, in surveys conducted between 1969 and1978, 67% of wells (n = 237) suspected of being contaminated with her-bicides contained residues (Frank et al., 1979). In surveys conductedbetween 1979 and 1984 on a broader range of pesticides, 71% of wells(n = 359) contained pesticide residues (Frank et al., 1987a). In a survey of
60 L. RITTER ET AL.
TABLE 12. Pesticides Detected in Wells Drawn from Groundwater During a Monitoring ProgramConducted by the Ontario Ministry of the Environment
1985 Survey 1986 Survey____________________ ____________________Number of Maximum Number of Maximumdetections concentration detections concentration
Pesticide (%) (µg/L) (%) (µg/L)
Alachor 15 20 5 2.3Atrazine — — 43 4.2Atrazine and deethyl atrazine 48 354 50 10.5Deethyl atrazinea — — 31 7.5Cyanazine 5 4 NDDicamba <1 2.3 NDMetolachlor 15 1800 7 3.2Metribuzin 6 300 NDPrometryne <1 0.8 NDSimazine and deethyl atrazine 3 23 ND2,4-D/2,4-DB 1 5800 NDTotal detections 51 50
Note. Adapted from Halberg (1989).aAtrazine and deethyl atrazine combined in 1985 survey.

pesticide contamination of wells in different soil types, Frank et al. (1987b)found that <25% (n = 11) of wells in organic soils and 13% (n = 91) ofwells in mineral soils were contaminated by at least one herbicide (mostlyatrazine). Finally, in a series of surveys conducted in 1984, 1986, and1987, Frank et al. (1990) found that 13% (n = 91), 9.7% (n = 103), and5.3% (n = 76) of wells, respectively, contained pesticide residues from allclasses of pesticides. In these studies, it was shown that a relatively highproportion of well-water contamination was due to accidental spills,back-siphoning, and use of the well as a supply of water for mixing pesti-cide formulations. For example, in a 1985 survey, it was shown that of the18 out of 61 (about 30%) wells contaminated by pesticides 11 were dueto direct spills, 3 from runoff immediately following an application event,and 4 from a combination of the two.
In one of the most comprehensive investigations of the potential risks ofpesticide exposure of farm families to pesticides in well water, Ripley et al.(1998) found that pesticide application practices on the farms participatingin the study resulted in little or no inadvertent exposure to farm familiesfrom drinking water. In that study, 20% of wells (n = 126) contained pesti-cide residues; atrazine was found in 15% of wells, MCPA (monochloro-phenoxyacetic acid) in 3% of wells, and MCPP (mecaprop), dicamba,metolachlor, and simazine in 2% of wells each. In all cases, the levels werebelow respective drinking water guidelines, where these existed.
In Ontario, monitoring programs for the detection of pesticide residuesin treated drinking water are virtually nonexistent. For example, in ourreview of water quality monitoring data for water treatment plants in south-ern Ontario, with the exception of atrazine, very few pesticide residueswere measured. The overwhelming majority of measurements were con-ducted on disinfection by-products and metals. In contrast, there have beenseveral recent comprehensive surveys of farm well water for pesticideresidues. Well water used for drinking on farms is typically untreated andhas a higher probability of experiencing contamination by pesticides due totheir proximity to various agricultural practices. Goss et al. (1998) andRudolph et al. (1998) conducted a survey of contaminants (pathogens,nutrients, and pesticides) in approximately 1300 domestic wells and multi-level monitoring well installations at 144 farms in northern and southernOntario. This survey measured the pesticides alachlor, metolachlor, atra-zine, metribuzin, and cyanazine and found that detection in wells andgroundwater was relatively low—7% in winter samples and 11% in sum-mer samples. Atrazine was the most common pesticide detected. Only sixwells had residues that exceeded the provincial IMAC.
Nonagricultural Sources of Pesticides
Although agriculture accounts for 70–80% of pesticides found in sur-face water, groundwater, and drinking water in North America (Apselin,1994), a number of other significant sources exist. Some of these may con-
SOURCES, PATHWAYS, AND RISKS OF CONTAMINANTS IN WATER 61

stitute the dominant source of pesticides to surface waters or groundwateron a localized basis, depending upon the pesticides in question and theirrespective use patterns (Larson et al., 1997; Nowell et al., 1999). Someapplications include (1) forestry, (2) transportation (to control weeds alongroad sides, railways, and right-of-ways), (3) urban and suburban areas (tocontrol pests in homes, gardens, buildings, and ornamental and turf grasses),(4) commercial and industrial applications (e.g., control of wood rot inlumberyards), and (5) lakes and streams for control of aquatic weeds andnuisance organisms (e.g., pestifierous midges). The various sources ofpesticides used in nonagricultural applications are provided in Figure 10.We next briefly discuss these nonagricultural sources of pesticides withrespect to their loading to, and movement in, aquatic environments.
Forestry The amount of pesticides applied in forestry, and the corre-sponding areal coverage, represents a small fraction of the amount andareal coverage used in agriculture (Government of Canada, 1996; Larsonet al., 1997). In Canada the total area receiving herbicide treatments in1993 was 235,000 ha, and most of the treatments were applied in BritishColumbia, Ontario, Quebec, and New Brunswick. Herbicides are the mostcommonly applied pesticide in the forest industry, where they are usedfor weed control in silvicultural applications. Historically, the herbicideswith the highest use in forestry were 2,4-D, picloram, and hexazinone.More recently, however, the use of triclopyr and glyphosate has increasedsignificantly. Insecticides, in contrast, are not routinely used as part of sil-vicultural practices and are more typically directed to controlling pestoutbreaks (e.g., gypsy moth, spruce budworm) in localized areas. Here,
62 L. RITTER ET AL.
FIGURE 10. Potential sources of pesticides other than crop protection that can lead to drinking-water contamination. Adapted from Gustafsson (1993).

DDT and organochlorines were used extensively in the 1950s and 1960s.These were succeeded by organophosphates (malathion, azinphos-methyl,fenitrothion) and carbamates (carbofuran and carbaryl) in the 1970s and1980s. Most recently, the bacterial agent Bacillus thuringiensis var. kurstaki(Bt) has become the primary insecticide to control forest pests. Between1980 and 1993, the total amount of land with insecticides applied in for-est operations declined significantly (from over 3 million ha to less than270,000 ha coverage), reflecting a decline in spruce budworm popula-tions (Government of Canada, 1996).
Depending upon the nature of the forest practice, forestry activitiesmay significantly affect water quality of surface waters draining forests,and these are typically regulated as nonpoint sources of pollution (Binkley &Brown, 1993). The primary pollutants associated with forest practices arepesticides, sediments, nitrate-N, and phosphates. The former typically entersinto aquatic surface waters or groundwater via direct overspray or spray driftduring aerial applications for pest control, runoff, and leaching (Neary et al.,1993). In most cases, pesticides used in forestry are nonpersistent and de-grade quickly under normal environmental conditions. However, impacts,when present, may be experienced by nontarget organisms. In this lattercontext, primary concern has focused on fish, and these have been investi-gated extensively in relation to historical applications of DDT, aminocarb,and fenitrothion used to control forest pests (Eidt et al., 1989). Overall, thereare few documented accounts of forest pesticides in drinking water. Neary etal. (1993), in a review of over a decade of research on the use of pesticidesin forestry operations, concluded that the low concentrations and short per-sistence of forestry pesticides in surface water and groundwater do not posea significant risk to water quality, aquatic biota, or human health.
In addition to pesticides, forestry may contribute significant quantities ofsediments, nitrate-N, and phosphorus; loadings of these compounds typi-cally increase following harvesting and fertilization of forests. The environ-mental significance of siltation was discussed earlier in relation to generaldegradation of surface waters and fish habitat. Nitrate-N can be a significantproblem from a human health perspective, but the overall contribution ofnitrate from forestry operations is very small compared to agricultural andatmospheric sources, and it is rare that forestry practices contribute N atlevels that exceed water quality criteria in the United States or Canada(Binkley & Brown, 1993). Phosphorus is not a significant concern in drink-ing water, but it may cause increased enrichment (eutrophication) of receiv-ing-water environments, leading to an increase in productivity in lakes andstreams and a corresponding reduction in water and habitat quality.
Urban/Suburban Pesticide Use The home and garden sector uses rela-tively small amounts of pesticides compared to agriculture (see Figure 8). Forexample, in the United States, 8.9% (herbicides), 14.3% (insecticides), and5.9% (fungicides) of all pesticide use was attributed to urban activities suchas lawn and garden maintenance, golf course and cemetery applications,
SOURCES, PATHWAYS, AND RISKS OF CONTAMINANTS IN WATER 63

and insect pest control of household plants and gardens. Among insecti-cides, chlorpyrifos and diazinon are most common where they are used innumerous household applications, such as dormant sprays on fruit trees, inprofessional landscape and maintenance uses, and structural pest controlagents (Bailey et al., 2000). Both are regularly detected in urban runoff andoccasionally in drinking water. For example, Bailey et al. (2000) measuredthese two insecticides in several urban streams in California. Both weredetected in the majority of samples collected. More importantly, diazinonlevels exceeded the California Fish and Game criterion for this pesticide in85% of samples collected (n = 231); chlorpyrifos exceeded its respective cri-terion in 80% of samples collected (n = 90). Recently, the U.S. EPA initiateda ban on certain uses of chlorpyrifos because of potential increased risksto children, including exposure via drinking water (U.S. EPA, 2000a).Parker et al. (2000) found that organochlorines such as DDT, DDE, dield-rin, chlordane, and toxaphene were ubiquitous, although generally low inconcentration, in urban runoff samples collected in Phoenix, AZ, despitethe fact that these compounds have been banned for up to 30 years.
Many of the transport pathways along which pesticides move to surfacewater or groundwater are the same in urban areas as they are for agriculture;however, the greater frequency of impervious surfaces (concrete, asphalt) inurban areas increases the efficiency and rapidity with which pesticides (andother contaminants) are moved to surface waters by runoff during rainevents or lawn watering. Moreover, the impermeable surfaces of urban areashave few adsorptive sites that might otherwise bind and retain the pesticides.Interestingly, studies have shown that well-maintained lawns, includingthose on golf courses, can prevent or greatly mitigate the loss of pesticidesapplied to them, thereby minimizing the amount reaching surface watersand groundwater (Harrison et al., 1993; Gustafsson, 1993).
Roadways and Rights-of-Way Herbicides are often applied to road-ways and rights-of way to control weeds and grasses for safety and aes-thetic purposes, and occasionally as firebreaks (Larson et al., 1997). Themost common herbicides used in this context include 2,4-D, triclopyr,and picloram. On rare occasions, insecticides such as fonofos may alsobe applied to control pests such as grasshoppers during periods of heavyinfestation. Pesticides used along roadways and rights-of-ways may enteradjacent aquatic or groundwater environments via spray drift, volatilization ,runoff, or leaching; however, the relative contribution from each source ispoorly known (Larson et al., 1997). A study conducted in Ontario showedthat 2,4-D applied to a right-of-way could be detected in soil samples takenup to 36 m from the original place of application and in water samplestaken from a nearby lake (McKinley & Arron, 1987). However, residual con-centrations of this herbicide were well below levels of toxicological con-cern. Watson et al. (1989) found little evidence of movement of the herbi-cide picloram applied to roadsides in a mountain valley. In contrast to thesestudies, Abke et al. (1993) found that 87% of groundwater control wells (n =
64 L. RITTER ET AL.

150) were contaminated with various herbicides used for weed controlalong railway tracks in Germany. The soils in that study were sandy, whichlikely aided the transport of the herbicides to the local groundwater aquifers.
In general, herbicide use to control weeds along roadways and right-of-ways is minor relative to many other pesticide uses. Hence, the contri-bution of pesticides from this application to surface waters and ground-water (and hence drinking water) in Ontario is probably quite minor andcorrespondingly poses little risk to human health.
Aquatic Plant Control Pesticides may be applied directly to surfacewaters for control of insect pests (e.g., blackflies, mosquitoes, and nui-sance midges), algae, and aquatic macrophytes. Herbicides (e.g., 2,4-D,glyphosate, copper sulfate) are the most commonly applied pesticides inaquatic environments, where they are used to control invasive weeds (e.g.,water hyacinth and Eurasian watermilfoil) in reservoirs and canals, and algaein ponds (Larson et al., 1997). Insecticides are commonly applied directly tosurface waters in areas prone to heavy infestations of nuisance aquatic insectpests. Historically, insecticides used in this capacity included DDT and anumber of organophosphorus compounds (e.g., fenthion, malathion, feni-trothion); some of the latter are still used in some regions of Canada. How-ever, in recent years, applications of bacterial agents such as Bacillus thur-ingiensis var. isrealensis (Bti), and of growth regulators such as methoprene,have been used increasingly to control aquatic pests such as mosquitoes(Larson et al., 1997). Pesticides applied to control aquatic weeds could enterinto drinking water if it is drawn from the treated water bodies around orshortly after a spray program. However, most of the pesticides used in cur-rent pest control applications are quickly degraded under normal environ-mental conditions.
Greenhouses Although pesticides are commonly used in greenhouses(or glasshouses), this industry probably represents only a minor source ofpesticide loading to surface waters or groundwater (Gustafsson, 1993).Where contamination does occur, it is likely to be restricted in area (pointsource) and limited in magnitude. Contributions of pesticides to drinkingwater from greenhouse sources may occur when drainage water contain-ing pesticides is released to surface waters that also serves as a source ofdrinking water (Gustafsson, 1993).
Nutrients The two predominant sources of nutrients in agricultureare animal wastes and fertilizers applied to crops. The origin of nutrientsfrom animal wastes, with their management, is the subject of a separateissue paper (Goss et al., 2001) and is not considered further here. How-ever, fertilizers may also represent a significant source of nutrients to bothsurface waters and groundwater; these are considered in detail.
When fertilizers are applied to soil, the nutrients contained within themwill either be taken up by the crop, remain in the soil, or be lost from thesoil of the crop systems by one of several possible mechanisms (Marschner,1986). The relative amounts of nutrient exported from soil to surface waters
SOURCES, PATHWAYS, AND RISKS OF CONTAMINANTS IN WATER 65

and ground water varies widely between nutrients, soil type, and climaticand agricultural circumstances. The two most significant nutrients in termsof their potential impact to aquatic ecological integrity, and/or that pose athreat to human health, are nitrogen (N) and phosphorus (P). High levelsof nitrate in drinking water is an important human health concern due tothe potential for nitrate toxicosis or methemaglobinemia (oxygen starva-tion). Nitrates are less significant to aquatic biota from a direct toxicologi-cal perspective. However, nitrate, along with phosphorus, contributes toeutrophication and degradation of water quality. It is also important in theformation of ammonia, which is toxic to aquatic organisms, especiallyfish. Fertilizers can also contain trace amounts of a variety of metals suchas arsenic, cadmium, and lead that may contribute to the contamination ofsurface water and groundwater. In most cases, however, contributions ofmetals from fertilizers are small relative to other sources, typically muchless than 1% of total metal loading to aquatic environments.
Leaching, runoff, and atmospheric transport are the primary mecha-nisms by which nutrients enter aquatic environments. Nitrogen and phos-phorus may enter surface waters from agricultural, atmospheric, andurban (sewage) sources. Total nitrogen concentrations found in Canadianrivers, lakes, and underground water bodies has been estimated to rangebetween 1 and 10 mg/L, but may be considerably higher in localizedareas, most notably in regions of high agricultural intensity. Nitrate is alsoproduced naturally (for example, by blue-green algae) and is assimilatedfrom water through uptake by aquatic plants or denitrification in bottomsediments. However, nitrogen in excess of that which can be assimilatedby an aquatic system may, in conjunction with phosphorus loading, con-tribute to eutrophication (nutrient enrichment) and a concomitant declinein water quality and ecological diversity.
Phosphorus in the chemical form of phosphate is one of the principalnutrients for plants. Assimilation of fertilizer phosphorus by crops is gener-ally poor, and that which is not taken up is effectively converted to water-insoluble forms or is strongly adsorbed on soil particles. Thus, lossof phosphorus to surface water or groundwater via leaching is relativelylow, typically less than 1–2 kg phosphorus/yr/ha (International Potash Insti-tute, 1983). Phosphorus loading to aquatic environments occurs primarilyas runoff of soil particles to which the phosphorus is adsorbed (Bockman,1990). The phosphorus content of streams in Canada ranges between 0.01and 0.1 mg/L in forest watersheds and up to 0.5 mg/L in agricultural runoff(International Potash Institute, 1983). Phosphorus loading to streams mayaccount for up to 80% of phosphorus present in these systems (Bockman,1990).
From a human health perspective, phosphorus does not pose a signif-icant risk when present in drinking water and there are currently nowater quality standards for phosphorus in this matrix. However, phos-phorus can have a significant effect on the ecological integrity of surfacewaters, where it is the primary cause of eutrophication. Indeed, phos-
66 L. RITTER ET AL.
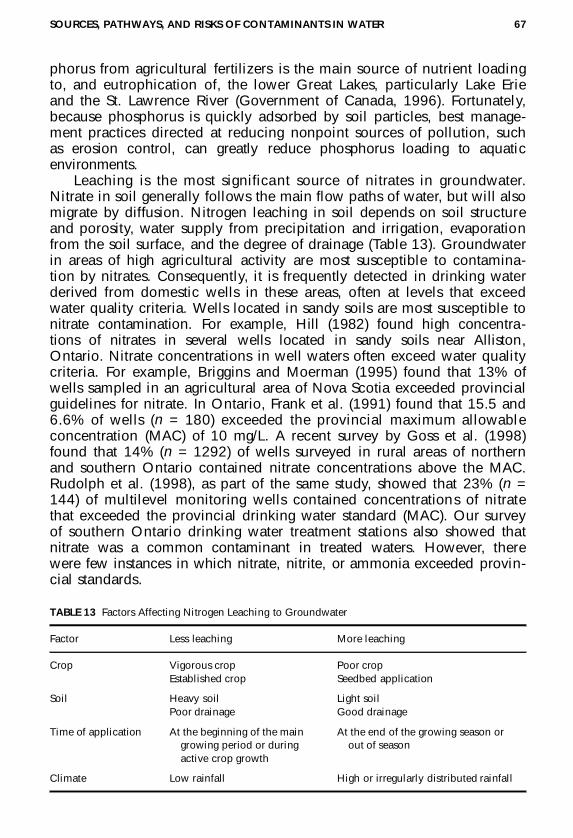
phorus from agricultural fertilizers is the main source of nutrient loadingto, and eutrophication of, the lower Great Lakes, particularly Lake Erieand the St. Lawrence River (Government of Canada, 1996). Fortunately,because phosphorus is quickly adsorbed by soil particles, best manage-ment practices directed at reducing nonpoint sources of pollution, suchas erosion control, can greatly reduce phosphorus loading to aquaticenvironments.
Leaching is the most significant source of nitrates in groundwater.Nitrate in soil generally follows the main flow paths of water, but will alsomigrate by diffusion. Nitrogen leaching in soil depends on soil structureand porosity, water supply from precipitation and irrigation, evaporationfrom the soil surface, and the degree of drainage (Table 13). Groundwaterin areas of high agricultural activity are most susceptible to contamina-tion by nitrates. Consequently, it is frequently detected in drinking waterderived from domestic wells in these areas, often at levels that exceedwater quality criteria. Wells located in sandy soils are most susceptible tonitrate contamination. For example, Hill (1982) found high concentra-tions of nitrates in several wells located in sandy soils near Alliston,Ontario. Nitrate concentrations in well waters often exceed water qualitycriteria. For example, Briggins and Moerman (1995) found that 13% ofwells sampled in an agricultural area of Nova Scotia exceeded provincialguidelines for nitrate. In Ontario, Frank et al. (1991) found that 15.5 and6.6% of wells (n = 180) exceeded the provincial maximum allowableconcentration (MAC) of 10 mg/L. A recent survey by Goss et al. (1998)found that 14% (n = 1292) of wells surveyed in rural areas of northernand southern Ontario contained nitrate concentrations above the MAC.Rudolph et al. (1998), as part of the same study, showed that 23% (n =144) of multilevel monitoring wells contained concentrations of nitratethat exceeded the provincial drinking water standard (MAC). Our surveyof southern Ontario drinking water treatment stations also showed thatnitrate was a common contaminant in treated waters. However, therewere few instances in which nitrate, nitrite, or ammonia exceeded provin-cial standards.
SOURCES, PATHWAYS, AND RISKS OF CONTAMINANTS IN WATER 67
TABLE 13 Factors Affecting Nitrogen Leaching to Groundwater
Factor Less leaching More leaching
Crop Vigorous crop Poor cropEstablished crop Seedbed application
Soil Heavy soil Light soilPoor drainage Good drainage
Time of application At the beginning of the main At the end of the growing season or growing period or during out of seasonactive crop growth
Climate Low rainfall High or irregularly distributed rainfall
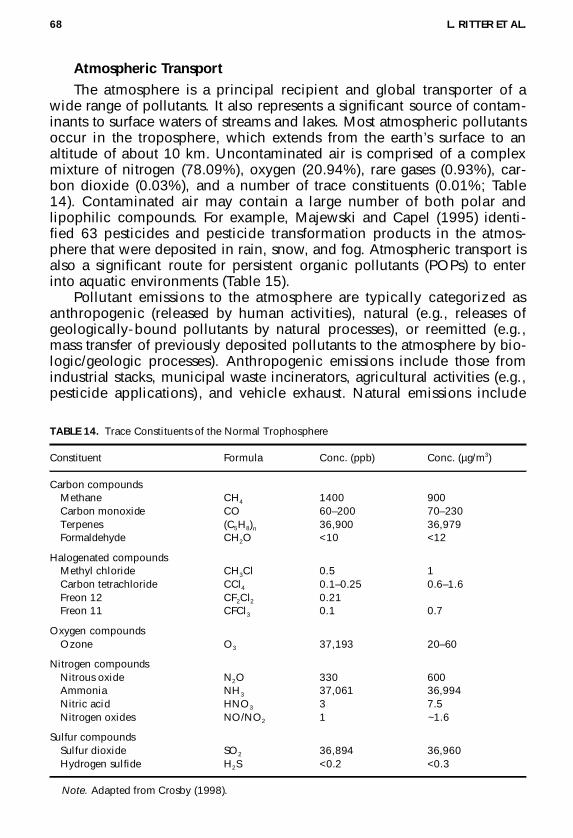
Atmospheric TransportThe atmosphere is a principal recipient and global transporter of a
wide range of pollutants. It also represents a significant source of contam-inants to surface waters of streams and lakes. Most atmospheric pollutantsoccur in the troposphere, which extends from the earth’s surface to analtitude of about 10 km. Uncontaminated air is comprised of a complexmixture of nitrogen (78.09%), oxygen (20.94%), rare gases (0.93%), car-bon dioxide (0.03%), and a number of trace constituents (0.01%; Table14). Contaminated air may contain a large number of both polar andlipophilic compounds. For example, Majewski and Capel (1995) identi-fied 63 pesticides and pesticide transformation products in the atmos-phere that were deposited in rain, snow, and fog. Atmospheric transport isalso a significant route for persistent organic pollutants (POPs) to enterinto aquatic environments (Table 15).
Pollutant emissions to the atmosphere are typically categorized asanthropogenic (released by human activities), natural (e.g., releases ofgeologically-bound pollutants by natural processes), or reemitted (e.g.,mass transfer of previously deposited pollutants to the atmosphere by bio-logic/geologic processes). Anthropogenic emissions include those fromindustrial stacks, municipal waste incinerators, agricultural activities (e.g.,pesticide applications) , and vehicle exhaust. Natural emissions include
68 L. RITTER ET AL.
TABLE 14. Trace Constituents of the Normal Trophosphere
Constituent Formula Conc. (ppb) Conc. (µg/m3)
Carbon compoundsMethane CH4 1400 900Carbon monoxide CO 60–200 70–230Terpenes (C5H8)n 36,900 36,979Formaldehyde CH2O <10 <12
Halogenated compoundsMethyl chloride CH3Cl 0.5 1Carbon tetrachloride CCl4 0.1–0.25 0.6–1.6Freon 12 CF2Cl2 0.21Freon 11 CFCl3 0.1 0.7
Oxygen compoundsOzone O3 37,193 20–60
Nitrogen compoundsNitrous oxide N2O 330 600Ammonia NH3 37,061 36,994Nitric acid HNO3 3 7.5Nitrogen oxides NO/NO2 1 ~1.6
Sulfur compoundsSulfur dioxide SO2 36,894 36,960Hydrogen sulfide H2S <0.2 <0.3
Note. Adapted from Crosby (1998).
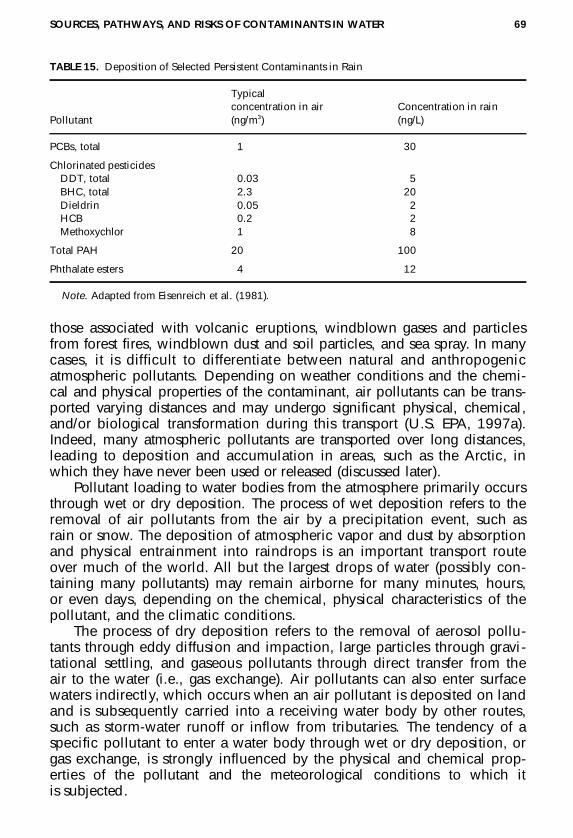
those associated with volcanic eruptions, windblown gases and particlesfrom forest fires, windblown dust and soil particles, and sea spray. In manycases, it is difficult to differentiate between natural and anthropogenicatmospheric pollutants. Depending on weather conditions and the chemi-cal and physical properties of the contaminant, air pollutants can be trans-ported varying distances and may undergo significant physical, chemical,and/or biological transformation during this transport (U.S. EPA, 1997a).Indeed, many atmospheric pollutants are transported over long distances,leading to deposition and accumulation in areas, such as the Arctic, inwhich they have never been used or released (discussed later).
Pollutant loading to water bodies from the atmosphere primarily occursthrough wet or dry deposition. The process of wet deposition refers to theremoval of air pollutants from the air by a precipitation event, such asrain or snow. The deposition of atmospheric vapor and dust by absorptionand physical entrainment into raindrops is an important transport routeover much of the world. All but the largest drops of water (possibly con-taining many pollutants) may remain airborne for many minutes, hours,or even days, depending on the chemical, physical characteristics of thepollutant, and the climatic conditions.
The process of dry deposition refers to the removal of aerosol pollu-tants through eddy diffusion and impaction, large particles through gravi-tational settling, and gaseous pollutants through direct transfer from theair to the water (i.e., gas exchange). Air pollutants can also enter surfacewaters indirectly, which occurs when an air pollutant is deposited on landand is subsequently carried into a receiving water body by other routes,such as storm-water runoff or inflow from tributaries. The tendency of aspecific pollutant to enter a water body through wet or dry deposition, orgas exchange, is strongly influenced by the physical and chemical prop-erties of the pollutant and the meteorological conditions to which itis subjected.
SOURCES, PATHWAYS, AND RISKS OF CONTAMINANTS IN WATER 69
TABLE 15. Deposition of Selected Persistent Contaminants in Rain
Typicalconcentration in air Concentration in rain
Pollutant (ng/m3) (ng/L)
PCBs, total 1 30
Chlorinated pesticidesDDT, total 0.03 5BHC, total 2.3 20Dieldrin 0.05 2HCB 0.2 2Methoxychlor 1 8
Total PAH 20 100
Phthalate esters 4 12
Note. Adapted from Eisenreich et al. (1981).

Although a potentially significant source of contaminants to surfacewaters, atmospheric deposition is generally only a minor direct source ofcontaminants to groundwater. However, contaminants of atmospheric ori-gin may nonetheless eventually find their way into groundwater via indirectpathways, through exchange of previously deposited contaminants at sedi-ment–water interfaces, movement of surface waters into fluvial aquifers, orupwelling/downwelling events in streams (discussed later).
Persistent Organic Pollutants (POPs) and Other Contaminants Trans-ported in the Atmosphere Persistent organic pollutants consist of a groupof chemicals that are highly persistent in the environment, bioaccumulatein tissues, and exhibit significant toxicological properties (Crosby, 1998).These chemicals have no natural sources and are produced entirely throughcommercial and industrial activity (Hester & Harrison, 1994; Harrad, 1996;Edjulee & Cains, 1996). Many have been banned, phased out, or severelyrestricted in use for many years; however, only recently has the UnitedNations Environment Program (UNEP) agreed to completely abolish theworst offenders (Table 16) and set forth a process to determine the nextchemicals to be proscribed (UNEP, 1999; Kaiser & Enserink, 2000). Thesechemicals are semivolatile, so they are capable of undergoing long-rangeatmospheric transport, a process that is characterized by the gradual move-ment of chemicals that are produced in midlatitude regions toward polarregions in a series of volatilization–distillation events (Figure 11). This pro-cess, also referred to as the global distillation hypothesis (Wania & Mackay,1982) or the grasshopper effect, has led to high concentrations of these con-taminants in Arctic environments and bioaccumulation in associated biotaand humans. Indeed, many persistent organic pollutants (POPs) can bedetected in virtually every environmental matrix around the world. Some ofthese chemicals (e.g., organochlorine pesticides, DDT dioxins/furans) havebeen implicated as potential endocrine-disrupting compounds, raising con-cerns about possible developmental, immunological, and reproductiveeffects in wildlife and humans (see also earlier discussion). Despite long-time bans on most, significant human health problems continue to be expe-rienced in polar regions due to exposure of adults and children to these
70 L. RITTER ET AL.
TABLE 16. POPs Currently Listed Under the UNECE and UNEP Initiatives
Pesticides By-products Industrial chemicals
Aldrin/dieldrin PCDDs HexabromobiphenylEndrin PCDFs PCBsDDT/DDE PAHsHCH/lindane HCBChlordaneHeptachlorChlordeconeMirexToxaphene

chemicals through dietary sources. Because exposure of humans andbiota is overwhelmingly via food (it is estimated that less than 1% of theuptake of these compounds is accumulated via nondietary sources; Govern-ment of Canada, 1991), there is little risk of exposure to these compoundsvia drinking water. In fact, although many of the POPs listed in Table 16have at one time or another been detected in drinking water (see TableA1), most are extremely rare in this matrix today. The primary reason forthe absence of these compounds in drinking water is that they are spar-ingly soluble, preferring instead to be associated with lipophilic matricessuch as sediments and lipids.
Among the most important POPs from a human health perspective arePCBs. In general, the number and magnitude of PCB sources have de-creased significantly (20-fold) in the past 20 years. The largest national-level stationary air emission source of PCBs is incineration of hazardouswaste materials and consumer products containing PCBs (Mojewski &Capell, 1995). The primary route for human health exposure is diet, andbecause PCBs are rarely found in water, there is presently little risk asso-ciated with ingestion of drinking water.
A number of persistent pesticides are also commonly encountered in theatmosphere (Majewski & Capell, 1995) and are subject to long-range atmos-pheric transport (Kurtz, 1990). Pesticides can enter the atmosphere as spray
SOURCES, PATHWAYS, AND RISKS OF CONTAMINANTS IN WATER 71
FIGURE 11. Illustration of the movement of persistent organic pollutants according to the global dis-tillation hypothesis.

drift generated as droplets or as particles of the pesticide formulation. Suchparticles or droplets may travel considerable distances. In a global monitor-ing survey of air and surface seawater from 1989 to 1990, Iwata et al. (1994)found hexachlorocyclohexane (HCH) to have the highest concentrationamong organic pollutants. Concentrations were greatest in tropical sourceregions and in cold water deposition areas near the Arctic. Other persistentorganic pesticides, such as chlordane, showed a more uniform global distri-bution. Although long-range transport of persistent pesticides is of greatestinterest due to human health concerns, it is important to recognize thatpolar pesticides may also be transported long distances in the atmosphere.For example, Thurman and Cromwell (2000) found residues of atrazine, ahighly polar and widespread herbicide, in pristine areas of Ilse RoyaleNational Park in Lake Superior. This area is well removed from the primaryagricultural areas of the Midwestern United States where atrazine is applied.
Atmospheric deposition also represents a significant route for the entryof mercury into aquatic ecosystems. Anthropogenic mercury emissions areonly one component of the global mercury cycle; the amount of mercuryin the land, water, and air at any one location is comprised of mercuryfrom the natural global cycle, the global cycle perturbed by human activ-ities, and from regional anthropogenic sources. Other sources of mercuryinclude direct discharges to water or the application of mercury in theform of fungicides to protect crops. In total, natural, industrial, and re-cycled anthropogenic mercury contribute about one-third of the currentmercury burden in the global atmosphere (Pirrone et al., 1996). Estimatesof the global contribution of mercury emissions to the atmosphere fromanthropogenic sources are 2000 to 4000 tons per year (tpy) and from nat-ural sources are 2200 to 4000 tpy, resulting in total mercury air emissionsof 4200 to 8000 tpy (Pirrone et al., 1998). In comparison, U.S. mercury airemissions for 1994–1995 were 158 tpy (U.S. EPA, 1997b). Approximately87% of anthropogenic mercury emissions in the United States is fromcombustion sources, including waste and fossil fuel combustion.
Interestingly, new measurement methods suggest that natural mercuryemissions rates from mercury-rich soils and bedrocks may be larger thanpast estimates suggested. Also, a recently identified source of mercury tothe atmosphere is emissions of elemental mercury gas (Hg°) from soils thathave been amended with municipal sewage sludge (Carpi & Lindberg,1997). These researchers estimated that land application of sewage sludgein the United States and European Union may account for approximately5 × 106 g/yr (5 metric tons/yr) of Hg° released to the atmosphere based onthe area of land amended each year and measured Hg° emission rates. It isimportant to understand the source of mercury and the amount of mercurycontributed by each source type so that the most efficient control strategiescan be devised.
The atmosphere also represents a significant source of nitrogen to sur-face waters (National Atmospheric Deposition Program, 1999). The predom-
72 L. RITTER ET AL.

inant natural source of nitrogen in the atmosphere is via microbial decom-position of organic matter in soil and water. Microorganisms release ammo-nia (NH3) to the atmosphere during the breakdown of amino acids (Oke,1978; Smith, 1980). Predominant anthropogenic atmospheric nitrogensources include (1) emissions of nitrogen oxides from the combustion offossil fuel, (2) ammonia (NH3) and ammonium (NH4
+) emissions from fertil-izer and explosive factories, and (3) volatilization of ammonia-based fertil-izer from agricultural fields (Oke, 1978; Lippman, 1989; Paerl, 1993).
As with many atmospheric contaminants, once emitted into the atmos-phere, nitrogen may be deposited locally or may travel great distancesbefore deposition. More than 3.2 million tons of atmospheric nitrogen isdeposited on watersheds of the United States annually. In Canada, atmos-pheric deposition of nitrogen to surface waters amount to approximately182,000 tonnes per year (Chambers et al., 2001). Wet deposition accountsfor the majority of nitrogen removed from the atmosphere (Paerl et al.,1990). The degree to which a watershed retains nitrogen is a function of thesoil characteristics, topography, underlying geology, amount and type ofsurface vegetation, and degree of impervious cover (Paerl, 1993). Inevi-tably, a significant amount of deposited nitrogen will be transported duringa precipitation event, via overland or subsurface flow, into a freshwater sys-tem. Here it may contribute to processes such as eutrophication of aquaticsystems or may enter into groundwater supplies through various exchangemechanisms with surface waters.
Recently, a number of persistent polar organic pollutants (PPOPs) havecome to the attention of environmental scientists. Like POPs, this class ofchemicals contains several highly persistent compounds, some with half-lives in the order of thousands of years. Examples include trifluoroaceticacid (TFA, an atmospheric breakdown product of some chlorofluorocarbonreplacement compounds), chlorodifluoroacetic acid (CDFA), and perfluo-rooctane sulfonate (PFOS), a flourinated surfactant that is commonly usedas a stain repellent in products such as ScotchGuard. Unlike the POPs,however, these compounds are highly water-soluble and therefore generallydo not bioaccumulate in tissues. Further, most PPOPs also appear to exhibitlow levels of toxicity to most organisms. However, a notable exception isPFOS. This compound has been detected in tissues of wildlife, mammals,and humans (Giesy & Kannan, 2001; Kannan et al., 2001; Gilliland &Mandel, 1996) and may be globally ubiquitous. Unfortunately, data onexposure of humans to PPOPs via diet or drinking water, and on potentialrisks to human or ecosystem health, are scarce. However, in view of theirsolubility and general recalcitrance to microbial and chemical break-down, the occurrence of some of these compounds in drinking water wouldnot be surprising.
It is important to point out that new POPs continue to be identifiedand detected in the tissues of Arctic biota. For example, polychlorinatedparaffins and polybrominated diphenyl ethers (PBDEs, used as fire retar-
SOURCES, PATHWAYS, AND RISKS OF CONTAMINANTS IN WATER 73

dants and are structurally similar to PCBs), and the pesticide endosulfan,which is still used in Canada, have recently been added to the UNEP listof potentially important POPs that are subject to long-range atmospherictransport. In some cases (e.g., PBDEs), these compounds appear to beundergoing significant increases in many aquatic environments, but infor-mation on potential effects on human health and ecosystem integrity isscarce. As with many of the classic POPs, the most significant route of ex-posure to these compounds for humans and aquatic biota will be dietary;exposure via treated drinking water is likely to be negligible.
Urban/Suburban Runoff
Urban runoff represents a significant source of contamination in sur-face waters. The impacts of urban runoff on the quality of surface watershave become a key issue in Canada in recent decades. Currently, approx-imately 80% of Canadians live in urban areas, but this proportion isexpected to increase within the next 15 years as the Canadian populationis projected to increase by 5 million people (Statistics Canada, 2000).Approximately 80–90% of this expansion will occur in urban areas. In-tensified urbanization and the resultant increase in impervious surfaces(concrete, pavements, roofs, etc.) will alter the volume and quality ofurban runoff (Ellis, 1986). There is already concern about storm-waterpollution in the Great Lakes Basin, particularly in Hamilton Harbor andthe Toronto Waterfront (Marsalek & Kok, 1997), where storm water isoften contaminated with suspended solids, phosphorus, heavy metals,hydrocarbons, and fecal bacteria (Chambers et al., 1997).
Runoff from urban centers primarily occurs during or shortly after pre-cipitation or snowmelt events. As the water contacts and subsequentlymoves over the many urban surfaces, a wide range of contaminants maybecome dissolved or suspended in the resulting runoff. Urban runoff isultimately discharged into receiving waters, either before or after beingpassed through storm-water treatment facilities, if such technologies existin the municipality (Chambers et al., 1997). Thus, coastal areas, largerivers, and the Great Lakes are the main recipients of urban runoff; how-ever, small streams and metropolitan lakes often accept primary inflows(Waller & Hart, 1986).
Precipitation intensity and volume are important removal factors ofsurface contaminants in runoff (Ellis, 1986). In most cases, precipitationintensity is the most significant removal factor (Price & Mance, 1978), butwater volume can be very important in transporting solids, particularlythose of large diameter (Ellis, 1986). Runoff volume is dependent upon onthe type (industrial, commercial, residential) and density of development,as well as the conditions and gradient of the developed area (Ellis, 1986).Precipitation of low pH can also affect the dislodgibility of pollutants, sinceacidic rain solubilizes some pollutants (e.g., metals) that are weakly boundto urban surfaces (Ellis, 1986). Typically, the first flush that accompanies
74 L. RITTER ET AL.

each storm or snowmelt event is the most concentrated and contaminatedoutflow (Ferguson, 1994), especially if there has been a protracted periodbetween precipitation events.
Contaminants in runoff originate from a variety of nonpoint sources inthe urban environment. Solids such as glass, asphalt, stone, rubber, rust,building materials, pavements, dust, and human litter accumulate on pavedsurfaces (highways and large parking lots) between storm events (Ferguson,1994). Urban snowpacks also accumulate large quantities of solids and con-taminants over the winter months. Schroeter (1997) assessed the wastewatercontaminant discharges in 17 Ontario areas where waste water pollution is aconcern. He reported that during wet weather events, storm water accountedfor 77 to 100% of the solid loadings into receiving waters. Although solidsare frequently found in surface waters, they rarely migrate into groundwater,due to the filtering and adsorptive properties of soil (Bianchi & Muckel,1970). Hence, environmental problems associated with solids in runoff (e.g.,sediment loading) are generally restricted to impacts on aquatic biota.
Canadian highways and parking lots also accumulate high levels ofsalts, which are widely used as deicing agents and, in lower quantities, asdust suppressants. Salts are highly water-soluble and their ions may be per-sistent in both surface waters and groundwaters (Mayer et al., 1999). Allroad salts are chloride based; thus, chloride is the principal contributinganion to salinity from road salt application. Salt use in urban Ontario hasincreased substantially over the past few decades, leading to an increase inchloride concentrations in receiving waters. For example, Bowen andHinton (1998) reported that chloride concentrations in Highland Creek, astream in the Greater Toronto Area (GTA), increased from 150 mg L–1 in1972 to over 250 mg L–1 in 1995. Similarly, median chloride concentrationsin Duffin Creek, also in the GTA, were 10 to 20 mg L–1 in the 1960s, butincreased to between 30 to 40 mg L–1 in the early 1990s (Bowen & Hinton,1998). Road-salt contamination of surface waters also exhibits significantseasonal variation, which are characterized by “salt pulses.” For example,in the Don River, Toronto, the autumn baseline chloride concentrationranged from 100 to 150 mg L–1 (Scott, 1980), whereas in the winter months,concentrations were as high as 1000 mg L–1 after thaw periods (Scott, 1980;Schroeder & Solomon, 1998). Indeed, deicing compounds are a major con-tributor to snow-pack contamination (Oberts et al., 2000). These trends pre-cipitated a joint assessment by Environment Canada and Health Canada onthe environmental impacts from road salts (Environment Canada, 2000b).They concluded that road salts were entering aquatic habitats at concentra-tions that had, or were predicted to have, immediate or long-term harmfuleffects on the environment and its biological diversity (Environment Canada,2000b). As a result, road salts are now considered to be toxic under Section64 of CEPA.
Urban oil spills also represent a significant source of organic pollution inrunoff in Ontario. Between 1988 and 1997, an estimated 6.84 million liters
SOURCES, PATHWAYS, AND RISKS OF CONTAMINANTS IN WATER 75

of oil was spilled in the highly populated Golden Horseshoe area of south-western Ontario (Li & McAteer, 2000). Approximately 1.34 million litersof this oil passed through the urban drainage systems within the regionand entered Lake Ontario (Li & McAteer, 2000), contributing to the con-tamination of surface water from which many municipalities draw drink-ing water.
Automobile emissions and the wear of automobile parts and road con-struction materials are the primary sources of lead, zinc, copper, and ironto roadways and parking lots (Marsalek, 1986; Ferguson, 1994). However,the banning of leaded gasoline in the 1970s greatly reduced lead residuesfound on and surrounding roadways (Marsalek, 1986).
Pesticides and fertilizers from intensively managed golf courses, parks,and lawns are common constituents in urban runoff. The most prevalentcontaminants that originate from fertilizers are nitrogen and phosphorus;however, metals can also be leached out of some fertilizers (Ferguson,1994). Nutrient enrichment problems exist in a number of harbors on theCanadian side of the Great Lakes (Waller & Novak, 1980), where eutrophi-cation, as well as elevated biological and chemical oxygen demands, hasbeen evident (Ellis, 1986; Ferguson, 1994). Additionally, fecal bacteria fromdog, cat, rodent, and bird wastes frequently contaminate urban runoff(Feldman, 1974; Ferguson, 1994).
Roofs are sources of numerous contaminants such as solids, metals, andbacteria. Solids are often deposited on rooftops via atmospheric sources inquantities large enough to deem roofs to be one of the key origins of solidsin urban runoff (Ellis, 1986). Roofs are also a source of metal contamina-tion. Malmquist (1983) suggested that as much as 70 to 90% and 50 to70% of the total mass discharges of copper and zinc, respectively, in urbanrunoff are derived from the corrosion of roofing materials. Copper, zinc,and lead are also components of exterior paints, which flake or are leachedoff walls and roofs (Marsalek, 1986; Ferguson, 1994). Roof runoff can alsobe high in bacterial pathogens, a problem that been associated with birddroppings (Ellis, 1986).
Other urban sources of runoff contaminants include construction siteswhere soil and metal particulates can originate, and urban garbage dis-posal sites, which are sources of bacterial pathogens, nitrogen, and phos-phorus (Ferguson, 1994).
Sediments
Sediment consists of a heterogeneous matrix of all detrital, inorganic,and organic particles that occur on the bottom of a body of water (Power &Chapman, 1992). From a pollution standpoint, sediments have the uniquecharacteristic of acting as both a source and a sink for many natural andanthropogenic contaminants. As a sink, contaminants from many of thepoint and nonpoint sources outlined earlier become entrained in sediments,either by partitioning out of the water or via deposition of suspended solids
76 L. RITTER ET AL.

to which they are adsorbed. Many contaminants and organic wastes dis-charged to aquatic systems eventually accumulate in sediments, where theymay adversely affect the benthic biota, and enter into pelagic and humanfood chains (Thomas, 1994). Particularly problematic in this regard arelipophilic chemicals (having a strong affinity for lipids), which preferentiallypartition into sediments and other (e.g., tissues) environmental matrices.Areas of significant sediment contamination exist in well-defined areasthroughout North America as indicated by the numerous Area of Concernsin the Great Lakes and many of the Superfund sites in the United States. Inthese areas, sediment contamination could be considered as point sourcesfor pollution of aquatic habitats. However, the majority of sediment con-tamination is relatively diffuse, characterized by low-level contaminationspread over broad geographical ranges.
As a source, contaminated sediments may release chemicals to water viadesorption from organic ligands into surrounding interstitial water. One ofthe theories used to describe this process is equilibrium partitioning (EqP),which is based on the assumption that organic chemicals and certain metalsreach a thermodynamic equilibrium between benthic fauna, solid phases inthe sediment (e.g., organic ligands), and interstitial water (Lee, 1992) (Figure12). If the dissociated free chemical is lipophilic, it may be taken up and
SOURCES, PATHWAYS, AND RISKS OF CONTAMINANTS IN WATER 77
FIGURE 12. Partitioning relationships between sediment phases and biotic tissues as a basis for equi-librium partitioning. Partitioning is represented by a constant (K) between any two respective phases(e.g., Koc between sediment organic carbon and interstitial water).

accumulated from the interstitial water by benthic aquatic organisms thatcome into contact with it. An equally important route for accumulation ofcontaminants by benthos is by ingestion of sediment particles and organicmatter to which the contaminants are adsorbed; the contaminants desorb inthe gut and pass across the intestinal wall into the tissues (Fisher, 1995). Ineither case, the compounds may subsequently be passed through the foodchain as organisms at each trophic level are consumed by those at higherlevels; the contaminants may become increasingly concentrated with eachlevel, a process referred to as biomagnification. This route of exposure istypical for lipophilic compounds such as DDT, PCBs, and mercury, and itcan lead to significant impacts on aquatic and terrestrial biota as illustratedby the decline of bald eagles in the Great Lakes region due to eggshell thin-ning and widespread fish consumption advisories due to mercury contami-nation. Metals may be accumulated in a similar fashion, but these are alsosubjected to natural biogeochemical cycling processes (see earlier metalssection; see also Allen, 1995; Di Toro et al., 1991; Ankley et al., 1996).
The EqP approach has formed the cornerstone of the U.S. EPA pro-gram to establish sediment quality criteria for the protection of aquaticlife; however, this approach has come under considerable scrutiny in re-cent years (e.g., see Chapman et al., 2001) because increasingly it is rec-ognized that a true thermodynamic equilibrium between the sedimentand interstitial water or between the interstitial water and organism isprobably rarely achieved. For this and other reasons, there have been anumber of alternative approaches proposed (Reynoldson et al., 1997; Longet al., 1998; Burton, 2001), although these are not without limitations.Regardless of the approach used, it is critical that sediment criteria be re-assessed on a periodic basis to be certain that they are protective of bothhuman health and ecosystem integrity; this will mean that they must besufficiently flexible (Standley & Bott, 2001), particularly in terms of accep-tance and application by key regulatory agencies, to accommodate newscientific understanding of sediment-associated processes and factors thataffect the bioavailability of contaminants.
One of the most significant routes for contaminants in sediments to enteroverlying water is dredging. Dredging is routinely conducted in harbors,ports, and other areas of high boat and water transportation activity (NRC,1997). Because resuspension of contaminants and associated impacts due todredging activities are usually restricted to a local scale (e.g., harbor), thisessentially represents a point-source form of pollution. Due to the lipophilicnature of most sediment-associated contaminants, they tend to remaintightly bound to sediment particles during dredging activities (Digiano et al.,1993). Nonetheless, dredging can lead to the dissolution of certain contami-nants, particularly metals, into the water column, and these may exert toxi-cological effects on surrounding biota. Recognition of the potential impactsof dredging activities on aquatic communities led to the development ofsome of the first sediment bioassays (Lee, 1992) and arguably marked the
78 L. RITTER ET AL.

beginning of sediment toxicology and the development of sediment qualitycriteria. Risks to humans from dredging are unknown but probably minordue to the localized nature of this activity. Plausibly, sediment-associatedcontaminants that are liberated during dredging could enter into drinkingwater if such water was extracted from the same area in which the dredgingactivity occurred.
While considerable effort has been directed toward understanding rela-tionships between sediment and overlying (surface) water regarding themovement and bioavailability of contaminants in aquatic environments,much less effort has been directed toward understanding such relationshipsbetween surface water and groundwater. Potentially, contaminants that de-sorb from sediments, or that are adsorbed to suspended particles, couldenter groundwater if the overlying surface water into which the contami-nants partition enters into a fluvial aquifer (a stream that drains into agroundwater aquifer). Recent evidence has also shown that sediment-associated contaminants may also move to groundwater via downwellingof water, particularly in streams (Greenberg et al., 2000). These authorshypothesize that localized sediment contamination, and exchange of con-taminants between surface water and groundwater, is strongly influencedby upwelling or downwelling events in streams. Areas of upwelling mayfacilitate entry of contaminants associated with groundwater into surfacewaters, where they may enter into drinking-water supplies extracted fromthe water body. Such exchanges have been demonstrated in groundwater-dominated streams in agricultural areas where nitrate loading to surfacewaters via groundwater have caused significant deterioration of drinking-water supplies (van Lanen & Dijksma, 1999). In addition to potential hu-man health risks, the contribution of contaminants via upwelling may alsoimpact benthic communities that live in the sediments and that serve as thebasis of production in these systems (Duncan, 1999).
Downwelling, in contrast, can move contaminants associated with sur-face waters and sediments into subsurface systems where they may beincorporated into the groundwater. These contaminants may become in-corporated into shallow aquifers that supply domestic wells, or may resur-face at another location in a stream via upwelling.
Other Sources of Contaminants to Surface Waters and Groundwater
A number of sources of environmental stressors cannot be definitivelycategorized as either point or nonpoint sources of pollution, or may notconstitute chemical contaminants per se, yet may significantly affect thequality of surface waters or groundwater and hence have effects on in-stream ecological integrity and risks to human health. These sourcesinclude construction (e.g., land development, roads), habitat modification(e.g., removal, addition of riparian buffer zones), hydrologic modification(e.g., dams, channelization), discharge of cooling-water effluents, and theoccurrence of natural toxins. The most significant of these sources are
SOURCES, PATHWAYS, AND RISKS OF CONTAMINANTS IN WATER 79

described briefly next. In the United States, sediment/siltation has longbeen recognized as the most significant “nontoxic” pollutant contributingto degradation of surface waters (Oschwald, 1972; U.S. EPA, 1990).Increased sedimentation in streams due to habitat or hydrologic modifica-tion can result in significantly increased sediment loading, with a corre-sponding loss of benthic productivity and fish habitat (Waters, 1995).
From the perspective of human exposure to contaminants in drinkingwater, these sources generally do not directly contribute toxic chemicalsper se to aquatic environments. However, they can have a significanteffect on the physicochemical characteristics of receiving water or sedi-mentary environments, which may in turn affect the environmental chemo-dynamics of naturally occurring contaminants (e.g., metals) or contami-nants contributed from other anthropogenic sources. This could ultimatelychange the pathways along which many contaminants may eventuallycome to be present in drinking water. For example, increased runoff andtransport of soil particles to which contaminants are adsorbed can lead toreductions in water quality and loss of habitat in developed watersheds,particularly in agricultural areas. Such events have been closely linked withthe removal of riparian or wetland vegetative zones (Naiman et al., 1988;Petersen, 1992; Rabeni & Smale, 1995), which is a common practice inwatersheds being developed from human use.
Hydrologic and Habitat Modification Historically, hydrologic andhabitat modification of streams and lakes has represented arguably themost significant disturbance of aquatic systems since the arrival of humansin North America. Hydrologic modification includes activities such aschannelization, dredging (see earlier sediment section), dam construction,and flow regulation (U.S. EPA, 1998b). Habitat modification includes re-moval of riparian vegetation, stream-bank modification, and drainage andfilling of wetlands. In general, hydrologic and habitat modification ofaquatic environments poses far greater risks to aquatic biota and ecosystemhealth than it does to human health. However, such modifications can sig-nificantly affect the transport and chemodynamics of pollutants in the envi-ronment and hence on the exposure of humans to them. For example, theremoval of forest, grass, or wetland riparian buffer zones along streams canlead to an increase in the quantity of sediments, nutrients, or other pollu-tants (e.g., pesticides) transported from terrestrial landscapes into aquaticenvironments. Humans could experience increased exposure to these pol-lutants if drinking water is extracted from the contaminated surface waters.
The most common forms of hydrologic modification are channeliza-tion/diversions and dam construction, and these are often found together inaquatic systems. In the United States, the extent of channelization is exten-sive, with 26,550 km of channelization having been completed by 1977(Leopold, 1977). In Canada, Quinn (1987) documented 54 interbasin diver-sions, representing a mean annual flow rate of approximately 1 m/s. Theseare predominantly used in relation to hydroelectric development. Smaller
80 L. RITTER ET AL.

scale channelization is particularly common in urban areas to ensure ex-peditious movement of water to wastewater treatment facilities or receivingwaters, and in agriculture where it is often used to divert stream water foruse in crop irrigation. From an ecosystem perspective, stream channeliza-tion disrupts the riffle–pool habitat complexes required by many organismsfor the completion of life cycles and destroys spawning habitat for fish(Allen, 1995). Although channelization may yield benefits in terms of floodcontrol, this is often offset by losses in habitat diversity and ecological con-dition. The effects of dams on the physical and biotic integrity of streamecosystems have been well documented, perhaps most dramatically in rela-tion to declines in migrating fish populations (e.g., salmon), which cannotreach critical spawning grounds located above the dams (Nehlsen et al.,1991). Damming and pooling of streams may also lead to significant in-creases in water temperature downstream due to the increased residencetime and surface area of dammed water, which allow for greater solar heat-ing. This may lead to substantial declines in, or loss of, sensitive speciessuch as trout, or shifts in fish community structure such as, for example, thereplacement of cold-water species with warm-water species.
Other forms of habitat modification can also significantly alter waterand habitat quality in water courses. Loss of riparian buffer zones alongstreams and lakes and loss of wetlands through draining and filling canhave dramatic effects in this regard. The riparian zone consists of the areaof land adjacent to streams and rivers or surrounding lakes, and repre-sents an important transition zone that regulates the flow of energy andmaterials between the terrestrial landscape and the aquatic environment(Naiman & Descamps, 1997; Naiman et al., 2000); this interface is often re-ferred to as an ecotone. Because of its important function in regulatingthe flow of materials, loss of riparian vegetation can lead to a significantincrease in non-point-source pollution and the export of toxic contaminantsto aquatic environments. Conversely, the presence of riparian buffer areashas been shown to significantly reduce inputs of nutrients and suspendedsolids from agricultural activities and forestry to aquatic systems (Peterjohn& Correll, 1984; Gregory et al., 1991). Wetlands have been shown tofunction similarly in this capacity (Richardson, 1999). Riparian zones andwetlands may also serve to impede the movement of, or permanently re-tain, water- and particle-borne toxic contaminants such as pesticides.From a functional standpoint, regardless of the class of pollutant, the in-creased contact time afforded by retention within the soil or sedimentmatrix of the riparian zone or wetland provides significantly increasedopportunity for attenuation and degradation of the contaminants via chemi-cal and microbial processes. Constructed wetlands have been shown to bevery effective as treatment systems for reducing contaminant and pathogenconcentrations and toxicity of point source effluents and non-point sourcepollution (Richardson, 1999; Rodgers et al., 1999; Huddleston et al., 2000).Increasing the proportion of riparian and wetland structures also signifi-
SOURCES, PATHWAYS, AND RISKS OF CONTAMINANTS IN WATER 81
cantly improves habitat quality, thereby improving the overall health ofthe ecosystem (Naiman et al., 2000).
Recognition of the important role of riparian zones and wetlands in thisregard has led to the initiation of a number of restoration initiatives through-out North America. For example, in 1997, the U.S. Department of Agricul-ture initiated the National Conservation Buffer Initiative program, in whichfinancial assistance and technical guidance is provided to landowners todevelop buffer strips in both rural and urban settings to reduce non-point-source pollutant loadings to aquatic environments (Federal InteragencyStream Restoration Working Group, 1998). The goal of this ambitious pro-gram is to have a total of 3.2 million km of buffer strips in place along thenations waterways by the year 2002. A similar program was launched in1999 in Prince Edward Island, Canada, wherein the province has legislatedthe requirement of vegetative buffers for all watercourses. Similar “bufferstrip” initiatives are being proposed in Ontario through various conserva-tion authorities.
Cooling-Water Effluent Effluent discharged as a result of cooling oper-ations in industry represents a form of point source pollution to aquatic en-vironments. This form of pollution does not contribute toxic chemicals tosurface waters per se, so there is little risk to human health. However, cool-ing-water effluents can have a significant effect on receiving waters ecosys-tems. In streams, large fluctuations in temperature can significantly effectspecies richness due to the elimination of thermal cues needed to breakegg diapuase, reduction in degree days needed to complete development,and loss of synchrony in life cycles (Allan, 1995). In both streams and lakes,a change in temperature profile can also alter the type of fish communitypresent.
Radionuclides Exposure to radionuclides may occur from both naturaland artificial sources. The former accounts for approximately 82% andincludes sources of cosmic, internal, and terrestrial origin as well as expo-sure to radon (NRC, 1990). Artificial sources account for 18% of expo-sure and include medical applications, occupational exposure, nuclear fuelcycle, and fallout. On average, Canadians are exposed to a 2.6 mS/yr,which is slightly higher than the average global exposure of 2.4 mS (HealthCanada, 1996b).
Radionuclides are frequently detected in both surface and groundwa-ter sources that supply drinking water; however, the contribution of drink-ing water to total exposure is very small and is primarily the result of thepresence of naturally occurring radionuclides in the uranium and thoriumdecay series (Health Canada, 1996b). Sources of radionuclides to surfacewaters include atmospheric deposition to both surface waters and soil,loss from soils due to surface runoff and leaching to soil water, and directaddition from effluent radionuclides associated with industrial activities(Cockerham & Cockerham, 1994).
Radon is the major source of naturally occurring radiation exposure forhumans (Health Canada, 1996b). Exposure occurs as the result of ingestion
82 L. RITTER ET AL.

of water in which radon is dissolved or via inhalation of atmospheric radon.Because radon is volatile, surface water concentrations tend to be low,typically in the order of 0.01 Bq/L. However, groundwater may containhigher levels, often in the range of 10–75 Bq/L (Health Canada, 1996b).In some jurisdictions in the United States, radon represents a significant con-taminant of drinking water, particularly in locations in which radon occursat high natural concentrations in groundwater, or when it is found at highindoor atmospheric concentrations (Nero, 1988; Health Canada, 1996b).However, in Canada, it has been concluded that radon poses little risk tohumans via drinking water exposure (Health Canada, 1996b). For this rea-son, a MAC has not been established for this radionuclide; however, it isrecommended that in situations in which indoor air concentrations of radonexceed the acceptable level of 800 Bq/m3 (as an annual average concentra-tion in a normal living space), groundwater supplies should be examined todetermine levels in that matrix.
In Ontario, the radionuclide of primary concern in drinking water is tri-tium, and it is routinely monitored as part of the Ontario Drinking WaterSurveillance Program (ODWSP, 2000). Average tritium concentrations havebeen shown to range from 5 to 10 Bq/L in surface waters across Canada,between 7 and 10 Bq/L in Great Lakes surfaces waters, and to average 6Bq/L in Ontario surface waters based on samples taken from various loca-tions (Health Canada, 1996b). These values are all well below the CanadianDrinking Water Quality Maximum Allowable Concentration (MAC) for tri-tium of 7000 Bq/L. Moreover, data from the ODWSP indicate that tritiumhas never been found above the Ontario Drinking Water Objective, al-though the provincial drinking water objective for tritium is currently underreview (ODWSP, 2000).
The ODWSP also undertakes periodic measurements of gross beta andalpha particles, which are used as preliminary screens for all radionuclidesin water other than tritium. As with tritium, the ODWSP data indicate thatthese too are rarely detected in Ontario’s drinking water (Table 17).
Natural Toxins There are numerous examples of naturally occurringtoxins in aquatic environments. Of primary concern from a human healthperspective in drinking water are toxins that originate from cyanobacteria.Cyanobacteria grow in surface waters of freshwater lakes and riversthroughout the year, but are typically most prevalent during the warmmid to late summer months, when they may bloom to high concentra-tions (Tang et al., 1997; Lee, 1999). These algae proliferate during thistime of the year because they have superior light-capturing capacity rela-tive to some other algae, have a high affinity for nitrogen and phosphoruswhen supplies are limited, can regulate their position in the water col-umn via gas vacuoles to better exploit areas of higher nutrient enrich-ment, and have relatively high temperature optima for growth (Tang et al.,1997). Not surprisingly, it is during this time of the year that they pose thegreatest threat to humans and wildlife due to poisoning following inges-tion. These algae occur across Canada, but they are particularly prevalent
SOURCES, PATHWAYS, AND RISKS OF CONTAMINANTS IN WATER 83

in the prairies where cyanobacterial poisoning has resulted in a number oflivestock deaths (Manitoba Environment, 1998). However, there has beenan increase in the number of cyanbacterial blooms in the Great lakes, sothere may be increased risks to humans in these (and other) areas that usethis water for drinking purposes. Interestingly, it has been hypothesizedthat one of the reasons for the apparent increase in these blooms in theGreat Lakes region is a corresponding general increase in lakewide mea-surements of nitrogen (Chambers et al., 1997). Although studies to investi-gate this apparent relationship are lacking, it clearly underscores thepotential interactive nature of many contaminants in aquatic environ-ments. More importantly, it has important implications for the manage-ment of environmental contaminants in aquatic environments insofar asregulation of single compounds may not be appropriate, nor sufficientlyprotective, for both humans and aquatic biota, if interactions with other
84 L. RITTER ET AL.
TABLE 17. Concentration Ranges for Radionuclides Measured in Various Stages of Water Treatment
Concentrations ranges______________________________________Influent
Compound (surface) Treated Distribution
Southern region
Gross alpha radiation (Bq/L) 0.08–0.31 10.05–0.72 0.05–0.84(24/4/2)a (23/23/23) (47/15/10)
Gross beta radiation (Bq/L) 0.04–0.19 0.04–0.32 0.04–0.34(24/22/22) (23/23/23) (47/7/6)
Tritium 6.0–11.0 — 6.0–8.0(24/6/5) (23/1/0) (47/7/6)
Radium — — —(24/6/0) (23/1/0) (47/8/0)
Northern region
Gross alpha radiation (Bq/L) — 0.04–0.12 0.05–0.06(9/1/0) (6/3/3) (15/4/2)
Gross beta radiation (Bq/L) 0.04–0.07 0.05–0.21 0.04–0.13(9/7/7) (6/6/6) (15/12/12)
Tritium — — —(9/2/0) (6/1/0) (15/3/0)
Radium — — —(9/0/0) (6/0/0) (15/0/0)
Note. Data taken from the Ontario Drinking Water Surveillance Program (ODWSP, 2000).aFirst number in parentheses represents number of municipal water treatment plants searched, sec-
ond number represents number of municipal water treatment plants that tested for presence of com-pound, and third number represents the number of municipal water treatment plants that detectedcompound on at least one occasion.

compounds or abiotic factors exert a strong influence on the behaviour andconcentration of the contaminant to which the regulation(s) is/are directed.
Some cyanobacteria produce toxins (cyanotoxins) of which there are twobasic types: neurotoxins and hepatotoxins (Bell & Cobb, 1994). Neurotoxinsare alkaloids (low-molecular-weight nitrogen-containing compounds) thatblock the transmission of nerve impulses between neurons and betweenneurons and muscles. Hepatotoxins are inhibitors of protein phosphatases1 and 2A (Arment & Carmichael, 1996) and cause bleeding of the liver.There are two types of hepatotoxins: microcystins (produced by severalspecies) and nodularins (produced by a single species). The former ismost commonly encountered in freshwater and poses the greatest risk tohumans and wildlife that drink contaminated water. The occurrence ofthese toxins in drinking water is most likely to occur in areas that do nothave water treatment. However, these toxins may also occur in treatedwater even when the water is chlorinated. Indeed, although suitable ana-lytical methods are poorly developed, it appears that a reduction in toxic-ity due to these neurotoxins in treated water can only be achieved usingactivated carbon or ozonation treatment processes (WHO, 1996).
The proposed guideline for consumption of algal toxins from drinkingwater in Canada is 1.5 µg/L, which is slightly higher than the World HealthOrganization guideline of 1.0 µg/L. However, these guidelines do notaddress risks associated with the potential for cancer from these toxins,which have been shown to promote tumor development. Interestingly, in arecent survey of drinking water in the United States and Canada, algal toxinswere found to exceed World Health Organization guidelines in a number ofjurisdictions (e.g., Winnipeg, Regina, cental Alberta). In the lower GreatLakes, particularly Lake Erie, the frequency of recent blue-green-dominatedalgal blooms appears to be increasing. Possible causes for these increasesare unknown, but they may reflect lakewide increases in nitrogen or possi-bly an indirect effect of the invasive zebra mussel, whose filtering activitymay be removing species that would otherwise compete with these algae.Similar competitive interactions have been shown between zebra musseland the deepwater amphipod, Diporiea spp. It has been hypothesized thatpopulation densities of the latter are declining in southern Lake Michigandue to removal of diatoms, its primary food base, via feeding (filtering)activity of the zebra mussels (Landrum et al., 2001).
Another natural toxic agent that has recently emerged as a significantthreat to human and aquatic ecosystem health and that has been connectedto intense agricultural practices is Pfiesteria . Outbreaks of Pfiesteria pisci-cida, a dinoflagellate marine algae, are uncommon in Canada, but it hasbeen a significant problem in the U.S. estuaries, particularly in South Caro-lina, where it has been connected with large hog farming practices (U.S.EPA, 1998b). These outbreaks occur largely due to poor watershed manage-ment practices such as inadequate protection from agricultural runoff andprovide a dramatic indication of the intimate relationship between humans
SOURCES, PATHWAYS, AND RISKS OF CONTAMINANTS IN WATER 85

and ecosystems and the effect that each can have on the other (Silbergeldet al., 2000).
Pfiesteria poses risks to both humans and ecosystems, although ourunderstanding of the latter is much better than the former (Silbergeld et al.,2000). In fish, Pfiesteria cause characteristic lesions, the origin of which ishypothesized to result from a toxin secreted by the alga that damages themucus/skin of the fish, allowing penetration of harmful bacterial or fungalspecies present in the water (Noga et al., 1996). In humans, potentialroutes of exposure and mechanisms of toxicity are poorly understood. Glas-gow et al. (1995) reported that individuals having contact with Pfiesteria–contaminated water exhibited symptoms of headaches, skin lesions, andskin burning. Unfortunately, there is currently little information on occur-rence of Pfiesteria in drinking-water supplies in areas where this organismoccurs, so potential exposure via this route is virtually unknown.
Summary of Sources and Pathways
Although necessarily brief in scope and conceptually general, wehave attempted to identify the most significant point and nonpoint sourcesof contaminants, the transport pathways (e.g., erosion, leaching, deposition)through which the contaminants move, and some of the factors (e.g., hard-ness, pH) that affect their composition and toxicity in the environment asthey become incorporated into the groundwater and surface-water resourcesthat supply our drinking water. Although we have attempted to be as thor-ough as possible in our consideration of the various sources and pathways ofwater contamination, we realize that some important aspects (e.g., specificcompounds) have not been addressed at a level of detail that might other-wise be warranted based on their perceived or actual importance. However,it must be realized that our goal was not to provide a comprehensive assess-ment in this regard, but rather to provide the reader with an introduction to,and appreciation of, the myriad sources, pathways, and types of contami-nants that occur in surface waters, groundwater, and drinking water, to serveas a basis for assessing the relative risks posed by selected contaminants indrinking water to human health. We have provided the reader with numer-ous references that may be used as a starting point for additional investiga-tion. With these thoughts in mind, we now turn our attention to issues of riskassessment, with the goal of describing risk assessment methodologies andthe risks that selected compounds in drinking water pose to human health.
ASSESSING RELATIVE RISK AND RISK CHARACTERIZATION
Risk assessment has traditionally been done by comparison of the ex-posure concentration of the stressor(s) to the responses reported for thatstressor(s) in laboratory tests. These comparisons usually make use of re-sponse data from surrogate species such as laboratory rats and mice for
86 L. RITTER ET AL.

assessing risks in humans and fish and other wildlife for assessing risks inthe environment. Risk assessments for humans usually employ a number ofconservative steps to ensure that the population is protected from almost alleventualities; however, for environmental risk assessment, some effects maybe tolerated, especially if the activities that produce the risks also bringbenefits, such as the use of pesticides in the production of food.
Deterministic Versus Stochastic Effects in Risk Assessment
Prior to a discussion on the process of risk assessment, it may be valu-able to explain the difference between deterministic and stochastic effects inthe context of risk assessment. Effects for which the severity of the damagedcaused is proportional to the dose and for which a threshold dose existsbelow which they do not occur are called deterministic effects (HealthCanada, 1996b). Effect endpoints that measure toxicity, such as mortality orgrowth inhibition, are examples of deterministic endpoints. On the otherhand, effects for which the probability of occurrence, rather than severity, isproportional to the dose are referred to as stochastic effects. It is assumedthat there is no threshold below which stochastic effects do not occur.Cancer is the primary example of a stochastic effect. Deterministic effectsmay be categorized as either somatic or developmental, whereas stochasticeffects may be categorized as somatic, hereditary, or teratogenic.
A key difference between these two categories of health effect in termsof applying risk assessment methodologies is that approaches such as hazardquotient assessments (discussed later), which are referenced to deterministicendpoints (e.g., no observed effect concentrations), may not be appropri-ate for assessing risks associated with stochastic effects. In this sense, theapproach to risk assessment and the ensuing development of regulatory cri-teria differ for each category of effect. Specifically, although deterministicapproaches, such as the use of hazard quotients, may be suitable for end-points for which thresholds can be defined, probabilistic approaches may bemore appropriate for stochastic endpoints (see also later discussion). Forexample, stochastic effects are the most important consequence of exposureto environmental levels of radiation and hence form the basis of the currentradiological guidelines (Health Canada, 1996b).
Tiers in Risk Assessment
For logistical reasons, it is frequently necessary to divide complex tasksinto smaller components that can be more easily managed or dividedamong workers. Nowhere is this more true than in risk assessment, whererelationships between exposure and responses can be very complex. Theuse of tiers or steps in the process of risk assessment is one method usedto reduce complexity and narrow the focus of risk assessments to the keyissues and has been recommended frequently for use in risk assessments(NRC, 1993; U.S. EPA, 1992, 1998c; ECOFRAM, 1999). The use of tiered
SOURCES, PATHWAYS, AND RISKS OF CONTAMINANTS IN WATER 87

approaches in risk assessment has several advantages. The initial use ofconservative criteria allows substances that truly do not present a risk tobe eliminated from the risk assessment process, thus allowing the focus ofexpertise to be shifted to more problematic substances or situations. Asone progresses through the tiers, the estimates of exposure and effects be-come more realistic as uncertainty is reduced through the acquisition ofmore or better quality data. Tiers are normally designed such that thelower tiers in the risk assessment are more conservative (less likely to passa hazardous substance or activity) while the higher tiers are more realis-tic, with assumptions more closely approaching reality. Because lowertiers are designed to be protective, failing to meet the criteria for thesetiers does not necessarily mean that a disaster is imminent; rather, it is anindication that an assessment based on more realistic data is needed be-fore a regulatory decision can be reached.
The First Tier of Risk Assessment—Classification Systems Classifica-tion systems only make use of the physical or biological properties of thestressor and have been used over the years by a large number of organiza-tions for the purposes of ranking and selecting substances for further regula-tory action (International Joint Commission, 1993; Ontario Ministry of theEnvironment and Energy, 1990; Environment Canada, 1994).
The basic principle of a scoring system is to assign a rank or priority toa list of potential stressors. This is usually accomplished by assigning ascore to several of the properties of the substances being assessed, manip-ulating these scores in some way or another, and then using the scores torank (and select) some of these substances for further action. Some scoringsystems use single criteria (above or below a threshold) for a property,while others may use multiple criteria which are assigned numerical scores.Very few scoring systems use decision criteria for multiple values, that is,where different authors report different values. Some systems use thesmallest value, regardless of source or provenance (validity of the methodsused to determine the value). Some scoring systems use mathematical for-mulas where scores are added, multiplied, or subtracted to give a com-bined score. The combined score is then ranked to identify compounds ofhigher or lower priority. Yet other scoring systems use the scores in a taxo-nomic key where, after the scores have been evaluated in a series of ques-tions, the compound is classified into a particular category. This has theadvantage that scores may be combined in specific ways for different com-binations of properties and that the system may be integrated into a com-puterized expert system.
Correctly used, scoring systems have been used to rank substances inorder of priority for further assessment. This is usually in the first tier ofrisk assessment. Further assessment is normally required because the scoringsystems commonly make use of worst-case data and they do not handlemissing values, weighting, or scaling in clear or appropriate ways. The ranknumbers produced from combinations of scores have no meaning in the
88 L. RITTER ET AL.

real world; their only use is to allow prioritization of substances for moredetailed assessment.
The Use of Quotients for Assessing Hazard
The most widely used method of assessing risk is the hazard quotientmethod (HQ), by which the exposure concentration of a stressor, eithermeasured or estimated, is compared to an effect concentration such as anLC50 or no-observed-effect concentration (NOEC) (Urban & Cook, 1986;Calabrese & Baldwin, 1993). These are simple ratios of single exposureand effects values and may be used to express hazard or relative safety.For example:
exposure effect concentration concentration
Hazard = ______________ or Margin of safety = ______________effect exposure
concentration concentration
The calculation of hazard quotients has normally been conducted by utiliz-ing the effect concentration of the most sensitive organism or group oforganisms and comparing this to the greatest exposure concentration mea-sured or estimated in the environmental matrix. In this case, if the hazardratio is greater than 1, a hazard exists. Many HQ assessments incorporatesome form of uncertainty factor, either explicitly as part of the calculation it-self or in the criteria for acceptance of the HQ (CWQG, 1999), as illustratedin Table 18.
Because they frequently make use of worst-case data, HQs are designedto be protective of almost all possible situations that may occur. However,reduction of the probability of a type II error (false negative) through the useof very conservative application factors and assumptions can lead to theimplementation of expensive measures of risk mitigation for stressors thatpose little or no threat to humans or the environment (Moore & Elliott, 1996;Lee & Jones-Lee, 1995). A common error in the interpretation of HQs is theassumption that the HQ itself is exactly proportional to the “risk.” As theconcept of risk should always incorporate an element of probability, the HQis biased because it assumes that the conditions of the HQ exist on every
SOURCES, PATHWAYS, AND RISKS OF CONTAMINANTS IN WATER 89
TABLE 18. Uncertainty Factors in Assessing Risks from Substances in Humans
From To Uncertainty factor
Average Sensitive human ³ 10Animal Human ³ 10LOAEL NOAEL ³ 10Subchronic Chronic ³ 10Database inadequacies ³ 10Modifying factors 0

occasion and in every location. In addition, the HQ is based on a pointestimate of effect (EC50 or NOEC) and does not consider the relationshipbetween the concentration and the effect (the dose-response). Althoughvery great HQs are obviously more important than small HQs, small dif-ferences between these ratios should not be considered significant. At theother end of the scale, HQs that are less than 1, no matter how small, areall indicative of low risks, provided that appropriate uncertainty factors havebeen considered. Because of this, the HQ approach is only really useful forearly tiers or preliminary risk assessments and for the elimination of sub-stances from the need for further assessment.
The Probabilistic Approach
The probability of occurrence of a particular event is, and has been,widely used in the characterization of risk from many physical and med-ical events in humans (the insurance industry) and for protection againstfailure in mechanical and civil engineering projects (time between fail-ures, one-in-one-hundred-year floods, etc.). Probabilistic risk assessmentprocedures make use of distributions of values for exposures and effects toestimate the likelihood that a particular combination of exposure and re-sponse will occur. Probabilistic approaches offer an additional refinementto HQ approaches.
Distributional approaches have been used in the regulation of food addi-tives (Munro, 1990) for the protection of human health for several years. Theidea of using these distributions for setting environmental quality guidelinesoriginated from early work in the Netherlands (van Straalen, 1989, personalcommunication) (Kooijman, 1987) and the United States (Stephan et al.,1985). Other authors who have expanded upon the probabilistic risk esti-mation process include Van Straalen and Denneman (1989), Wagner andLøkke (1991), Aldenberg and Slob (1991, 1993), and Okkerman et al.(1991, 1993). Comparing distributions of species sensitivity directly to dis-tributions of exposure concentrations (Cardwell et al., 1993) was recom-mended for pesticide risk assessment by the Aquatic Risk Assessment Dia-logue Group (SETAC, 1994), demonstrated for metals and other substances(Parkhurst et al., 1996), and incorporated in a computer program (CadmusGroup, Inc., 1996).
Probabilistic risk assessment has been recommended for regulatory riskassessment of pesticides (ECOFRAM, 1999). The general concepts as theyapply to ecological and human health risk assessment have been reviewedand extensively discussed (Suter et al., 1993; Forbes & Forbes, 1993, 1994;Balk et al., 1995; Solomon, 1996; Richardson, 1996; Anderson & Yuhas,1996; Burmaster, 1996; Power & McCarty, 1996; Bier, 1999; Roberts, 1999;Postuma et al., 2001).
The major advantage of probabilistic risk assessment is that it uses allrelevant data and allows quantitative estimation of risks. In addition, thedata may be revisited, the decision criteria become more robust with addi-
90 L. RITTER ET AL.

tional data, and the method is transparent and consistent—producing thesame results with similar data sets. The method does have some disadvan-tages. More data are usually needed. For new substances not yet used inthe environment, models must be used to estimate exposures and havenot been widely validated for these uses. Probabilistic approaches arealso less easily applied where exposure is from multiple sources.
It is important to recognize that, as for risk assessment in general, allprobabilistic risk assessment methods are essentially similar; however, theymay be used for different purposes. As for risk assessments, some usesinclude the setting of environmental guidelines and criteria, while in others,probabilistic risk assessment is used to assess risks in situations where ex-posures are known and their significance is being assessed.
For the setting of criteria, an a priori decision must be made as to whatlevel of protection is acceptable (Balk et al., 1995; Forbes & Forbes, 1993).For example, the U.S. EPA method of setting environmental water qualitycriteria (Stephan et al., 1985) uses a 95% protection level (with an extrapo-lation factor of 2) but applies this to acute, chronic, and tissue residues.Similar techniques have been recommended for water quality determina-tion in the North American Great Lakes Initiative (U.S. EPA, 1995).
The other use of probabilistic risk assessment is in assessing risks fromsituations that already exist, such as where a substance has been releasedor is about to be released into the environment and a risk assessment isneeded to apply to a risk-benefit regulatory decision. In this case, no prede-fined percentage of species to protect is needed as this will vary from onesituation to another, depending on other lines of evidence, such as thetypes of organism most likely to be affected or the toxicological propertiesof the substance. Unlike the process of criteria setting, it may be very ap-propriate to exclude certain types of organisms from the assessment or,based on biological knowledge, to tolerate more frequent exceedences ofspecies response values for some groups of organisms than others. Becausethe potential adverse effects of measured or estimated exposures are beingassessed in this method, combination or segregation of exposure data setsadds significant utility to the risk assessment process. It allows more realis-tic toxicity and exposure information to be applied to ranking of exposurescenarios for the purposes of mitigation or regulatory decision making. Be-cause risk assessment considers both likelihood of exposure concentrationsand likelihood of effects, risk can be expressed as a joint probability, forexample, that n% of organisms will be affected x% of the time or in y% ofthe locations, depending on the type of exposure data collected. These riskscan be expressed as the probability of exceeding a fixed criterion ofresponse (Solomon et al., 1996) or as an exceedence profile (EP, Figure 13),which is relatively simple and offers a useful tool for communication ofrisks (ECOFRAM, 1999).
Application of distributional analysis to concentrations of substancesin the environment must be done with due consideration for the fact that
SOURCES, PATHWAYS, AND RISKS OF CONTAMINANTS IN WATER 91

these data are usually censored by the limits of analytical detection (Figure14). In practice, all exposure concentration data below the limit of detec-tion (LOD) or limit of quantization (LOQ) are assigned a dummy value ofzero. These data are used in the calculation of the total number of samples(n) but are not used to estimate centiles directly. The assumption usedhere is that the values below the LOD lie on the same distribution as thevalues above the LOD. With recent advances in analytical chemistry, valuesbelow the LOD are usually of little toxicological significance; however,the regression equation for the distribution may be used to estimate theconcentration of data points below the LOD for the purposes of developingan exceedence profile. The substitution of a value of half the LOD for allthe data points below the LOD—a practice used for estimating mean con-centration of a data set—results in a biased data set that will be difficult to fitto any model.
Probabilistic risk assessment has been applied to a number of sub-stances as part of higher tiered and more realistic assessment of their eco-logical risks. While probabilistic risk assessment provided tools to morethoroughly address these assessments and to handle large data sets, other
92 L. RITTER ET AL.
FIGURE 13. Presentation of exceedence probabilities (A) as a continuum of likelihoods in (B) anexceedence profile (EP) and (C) the use of these curves in decision making. Adapted from ECOFRAM(1999).

lines of evidence were also important in reaching the final conclusions.These risk assessments were intensive of a broad range of expertise andresources and were most easily carried out where good data sets for toxic-ity and exposure values were available. Probabilistic risk assessment is asignificant improvement on the traditional HQ approach but it will likelycontinue to evolve as the entire science moves forward and as exceptionstest the interpretation of the methods. As has been pointed out, one of themajor hurdles that probabilistic risk assessment will face is its acceptanceby the public and regulators (Solomon, 1999; Roberts, 1999). Risk man-agers will likely continue to demand, or at least interpret, probabilistic riskestimates as point estimates of high certainty (Moore & Elliott, 1996; Chap-man, 1995; Richardson, 1996). Decision makers want to know whether itis safe or not and prefer being told what will happen, not what might hap-pen (Morgan, 1998). Similarly, the public demands absolute safety but hasless understanding of probability and also greatly misperceives risks tothemselves, fellow humans, and the environment (Slovic, 1987).
Risk Perception
Once risk has been characterized, it will almost always be necessary todevelop a risk communication strategy. Effective risk communication is noteasy to achieve, especially if the result of the assessment is contrary to con-ventional wisdom or to the interests of certain stakeholder groups. Informa-tion about risks often involves using terms that are not part of the public
SOURCES, PATHWAYS, AND RISKS OF CONTAMINANTS IN WATER 93
FIGURE 14. Illustration of censoring of a distribution of measured concentration data by the level ofdetection of the analytical method.

vocabulary and hence may be difficult for the public to understand (NOELs,MATCs, uncertainty, etc.). Understanding risk means dealing with a largeamount of information. An audience can only assimilate a certain amountof the data given, and this is often greatly oversimplified in the process ofassimilation.
Perceptions of human health risk are based on our social structures andmorals, and it is necessary to take these into account when communicatingrisks to the public. A person’s perception of risk will also be determined bythat person’s implicit “worldview” and knowledge or assumptions of who(or what) receives the benefits and who (or what) pays the costs for the riskmanagement decisions (Lackey, 1995). While the scientific definition of riskis usually taken as the probability that a particular event will occur (i.e., anautomobile accident), the public perception of risk is a summation of ob-servability (knowledge) and controllability (Morgan, 1993). Thus, the publicwill perceive a different risk for a voluntary versus a coerced activity or onecontrolled by the individual versus one controlled by society, governmentor another group. The perception of individual and societal risks also varieswith expertise and knowledge (Slovic, 1980).
As an example of risk perception, there is a determinant philosophyamong the public that cancer rates are rising and that these “increases” aredirectly linked to exposure to chemicals in drinking water or food. In somecases this perception is correct and statistics will bear this out. In manycases, however, medical statistics on cancer are incongruent with this per-ception of increasing cancer rates. For example, of the leading types ofcancer in men and women in Canada, many have either declined or re-mained comparable relative to their rates of 20 years or so ago (Figure 15).In essence, the perception of the public represents uncertainty that can beascribed to some of the reasons already discussed. Uncertainty is dis-cussed in the next section.
Uncertainty
One of the most elusive concepts in risk assessment to convey to thepublic is the relative nature of risk. Uncertainty analysis is an importantstep in the risk assessment process as it both identifies and, to the extentpossible, quantifies the uncertainty in entire process of problem formula-tion, analysis, and risk characterization (Warren-Hicks & Moore, 1998).In addition, an assessment of uncertainty may allow identification of waysin which uncertainty can be reduced. Uncertainties in risk assessmenthave three sources: ignorance or imperfect knowledge, systematic errors,and nonsystematic errors.
The first is ignorance or imperfect knowledge of things that should beknown—for example, not knowing that a pathogen or potentially toxic sub-stance is present in a water source. Uncertainty from lack of knowledgecan never be addressed to the complete satisfaction of everyone; however,the more data that are available, the less likely it is that errors from lack of
94 L. RITTER ET AL.

knowledge will occur. Uncertainty resulting from co-occurring stressorsand possible interactions in mixtures is an area of current concern. Uncer-tainty from insufficient data is considered in the probabilistic process as theestimated exceedences are responsive to the number of data points.
Systematic errors in the risk assessment process are those that mayoccur through computational mistakes (incorrect position of the decimal,data entry errors) or through incorrect instrumental calibration. Providedthat these errors can be identified, they can be addressed through betterquality control and quality assurance or through a correction factor. Sys-tematic errors include errors in sampling where nonrepresentative samplesare taken, errors in analysis such as a lack of correction for recovery of theanalytical method, errors in analytical techniques where systematic but dif-ferent errors occur at different concentrations, and incomplete data collec-tions that do not fully represent the entire year and will result in samplesbiased toward seasonal drivers that are present during that particular time ofthe year.
Nonsystematic errors are random or stochastic errors that result fromthe random nature of the system being assessed and, unlike systematicerrors, are just as likely to give a value that is too low as one that is toohigh. These types of errors can be described and quantified but cannot beavoided or corrected for. For example, in the analysis of small concentra-
SOURCES, PATHWAYS, AND RISKS OF CONTAMINANTS IN WATER 95
FIGURE 15. Annual percent change in age-standardized incidence rates for selected cancer sites(1988–1995). Adapted from Health Canada (2000).

tions of substances, recoveries are more variable and quantification tech-niques are subjected to relatively greater interference from matrix effects.Similarly, variability in the results of toxicity tests for a given species testedin different experiments or by different laboratories is a potential source ofrandom (or systematic) errors. This type of error can be addressed by takingthe smallest value in the set (worst-case, conservative approach) or by usingthe geometric mean of all the data points for the species.
Exposure Values and Water Quality Guidelines Used in HQ Assessment
To provide insight into the relative risks of toxic contaminants found indrinking water to human health, we conducted an assessment of selectedcompounds using the HQ approach. Criteria for the selection of compoundswere (1) whether they pose a known or potential concern to human health(see Table A1), and/or (2) availability of measurements in drinking water. Thecompounds selected for the HQ assessment are identified in Table 19. Therespective Ontario, Canadian, and World Health Organization Water Qual-ity Guideline values for these and other compounds are listed in Table A2.
Assessments were conducted on both treated water and domestic wells.Hazard assessments on treated water were based on information derivedfrom the Ontario Drinking Water Surveillance Program (DWSP). These areavailable online at http://www.ene.gov.on.ca/envision/dwsp9899/dwsp.htm.The DWSP was initiated in 1986 to provide reliable and current informationabout the quality of municipal drinking water. Participation by municipalwater treatment plants (MWTPs) in this program is voluntary, although in-clusion in the program is also based on the population served, geographiclocation, and risk of contamination. In theory, each MWTP monitors a widerange of water quality parameters and toxic compounds, although this isnot consistent between plants. Metals, chloroaromatic compounds, chloro-phenols, n-nitrosodimethylamine (NMDA), disinfection by-products, poly-cyclic aromatic hydrocarbons, polychlorinated biphenyls, volatile organics,pesticides, radionuclides, and taste- and odor-impairing compounds aremonitored with varying frequency. In practice, however, only metals, ni-trates, disinfection by-products, atrazine, and a few individual organiccompounds are routinely monitored; it is from these groups of substancesthat we selected individual contaminants for the current assessment (Table19). Measurements at the MWTPs are typically made at three stages ofwater treatment prior to human consumption: (1) raw (influent) water,drawn from surface or groundwater sources, (2) treated laboratory water,and (3) distribution water, which is measured at various locations within themunicipality.
For assessments on municipal water treatment, concentrations of thecompounds listed in Table 19 were taken from 47 randomly selectedMWTPs in 4 regions of Ontario, 12 from each of the 3 southernmost regionsand 11 from the eastern region (Figure 16). Of the 47 plants, 24 (6 perregion) were selected that extracted water from surface-water sources
96 L. RITTER ET AL.
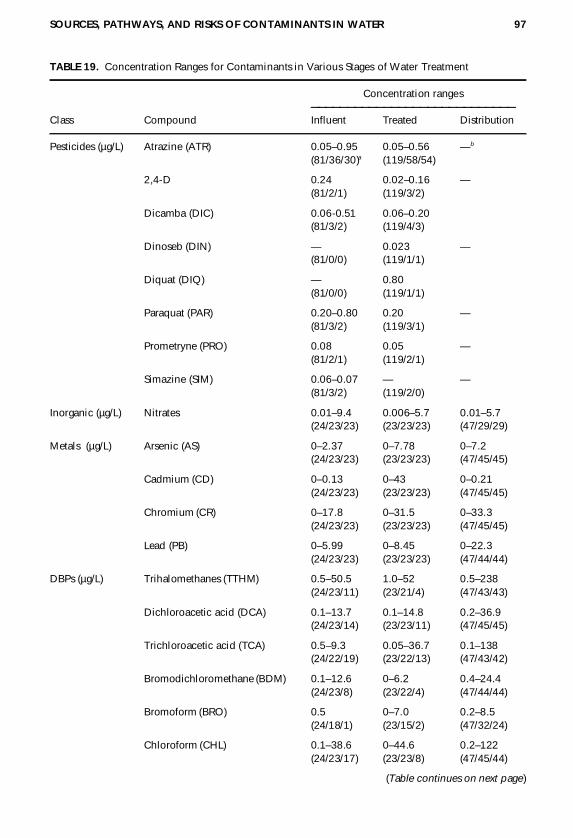
SOURCES, PATHWAYS, AND RISKS OF CONTAMINANTS IN WATER 97
TABLE 19. Concentration Ranges for Contaminants in Various Stages of Water Treatment
Concentration ranges____________________________Class Compound Influent Treated Distribution
Pesticides (µg/L) Atrazine (ATR) 0.05–0.95 0.05–0.56 —b
(81/36/30)a (119/58/54)
2,4-D 0.24 0.02–0.16 —(81/2/1) (119/3/2)
Dicamba (DIC) 0.06-0.51 0.06–0.20(81/3/2) (119/4/3)
Dinoseb (DIN) — 0.023 —(81/0/0) (119/1/1)
Diquat (DIQ) — 0.80(81/0/0) (119/1/1)
Paraquat (PAR) 0.20–0.80 0.20 —(81/3/2) (119/3/1)
Prometryne (PRO) 0.08 0.05 —(81/2/1) (119/2/1)
Simazine (SIM) 0.06–0.07 — —(81/3/2) (119/2/0)
Inorganic (µg/L) Nitrates 0.01–9.4 0.006–5.7 0.01–5.7(24/23/23) (23/23/23) (47/29/29)
Metals (µg/L) Arsenic (AS) 0–2.37 0–7.78 0–7.2(24/23/23) (23/23/23) (47/45/45)
Cadmium (CD) 0–0.13 0–43 0–0.21(24/23/23) (23/23/23) (47/45/45)
Chromium (CR) 0–17.8 0–31.5 0–33.3(24/23/23) (23/23/23) (47/45/45)
Lead (PB) 0–5.99 0–8.45 0–22.3(24/23/23) (23/23/23) (47/44/44)
DBPs (µg/L) Trihalomethanes (TTHM) 0.5–50.5 1.0–52 0.5–238(24/23/11) (23/21/4) (47/43/43)
Dichloroacetic acid (DCA) 0.1–13.7 0.1–14.8 0.2–36.9(24/23/14) (23/23/11) (47/45/45)
Trichloroacetic acid (TCA) 0.5–9.3 0.05–36.7 0.1–138(24/22/19) (23/22/13) (47/43/42)
Bromodichloromethane (BDM) 0.1–12.6 0–6.2 0.4–24.4(24/23/8) (23/22/4) (47/44/44)
Bromoform (BRO) 0.5 0–7.0 0.2–8.5(24/18/1) (23/15/2) (47/32/24)
Chloroform (CHL) 0.1–38.6 0–44.6 0.2–122(24/23/17) (23/23/8) (47/45/44)
(Table continues on next page)

98 L. RITTER ET AL.
TABLE 19. Concentration Ranges for Contaminants in Various Stages of Water Treatment (Continued)
Concentration ranges____________________________Class Compound Influent Treated Distribution
Organics (µg/L) Carbon tetrachloride (CT) — — 0.2–1.6(81/14/0) (119/18/6)
1,4-Dichlorobenzene (DCB) 0.02–0.15 — 0.05–0.5(81/21/9) (119/24/14)
Nitrosodimethylamine (NMDA) 0.001–0.005 — 0.001–0.005(81/53/34) (119/4/4)
Pentachlorphenol (PCP) 0.01–0.016 — —(81/2/2) (119/0/0)
Tetrachlorethylene (TCE) 0.05–0.15 — 0.05–4.75(81/16/7) (119/23/9)
aIn order of appearance, numbers in parentheses represent number of municipal water treatmentplants searched, number of municipal water treatment plants that tested for presence of compound,and number of municipal water treatment plants that detected compound on at least one occasion.
bNot measured.
FIGURE 16. Location of the 47 randomly selected municipal water treatment stations in 4 regions ofOntario used in the hazard quotient (HQ) assessment for metals, pesticides, disinfection by-products,and nitrates. Region 1, southwestern; Region 2, west central; Region 3, central; Region 4, eastern.Circles (v ) indicate water drawn from surface water; square (m ) indicates water drawn from ground-water.

(streams, lakes), and 23 from groundwater sources. At each plant, we re-corded the minimum and maximum value measured for each compound inthe influent (surface or ground) and distribution stages of water treatmentfrom the 24 surface-water stations and the 23 groundwater stations. How-ever, because few MWTPs regularly monitor levels of pesticides and conta-minants, we searched all water treatment plants in southern Ontario (119plants in total) for pesticide concentration data. Hazard quotients weredetermined for each of the metals, disinfection by-products, nitrates, pesti-cides, and organics selected from the drinking water database. In all casesexcept pesticides, the HQ estimates were based on maximum concentra-tions in the distribution water (48 stations), as we felt that these concentra-tions would be most representative of those to which humans would beexposed via ingestion of water. In the case of pesticides, which were notroutinely measured in distribution waters in the DWSP, we used valuesfrom the treatment stage.
For untreated well water, we assessed only pesticides and nitrate con-centrations. For these compounds, we used the information from OntarioMinistry of the Environment (1987a), Frank et al. (1990), Rudolph and Goss(1993), and Briggins and Moerman (1995). As with treated water assess-ments, we used the maximum value in the HQ assessment; however, wewere careful to differentiate between normal contamination levels (e.g,,those that might occur as a result of groundwater contamination or normalrunoff events) and those due to spills, back-siphoning, or other unusualevents that could bias the estimates. Thus, HQ values based on mean andmedian exposures were also included where this information was provided.
For both treated and untreated water, the HQ assessment was deter-mined as the ratio of the maximum measured concentration in either thetreated or well water and the Provincial Water Quality Criterion for thatcompound (Canadian guidelines were used when provincial guidelineswere not available) :
maximum exposure concentrationHazard = ______________________________________
water quality guideline concentration
This approach is highly conservative for two reasons. First, some waterquality criteria typically incorporate uncertainty factors to enhance protec-tion. Second, by using the maximum concentration detected, we are essen-tially evaluating a worst-case scenario. That is, the HQ that we calculate inmost cases is likely to much greater than would be predicted had we usedmean or median values for the data. Overall, this approach allows us tobetter detect “meaningful violations” and hence to gain a better sense ofpotential risk to human health.
Where we found HQ values >1 (an indication of potential risk), thesewere further analyzed using a probabilistic risk assessment. For thisanalysis, we constructed cumulative frequency distributions of data pointscorresponding to all measured concentrations of each substance in distri-
SOURCES, PATHWAYS, AND RISKS OF CONTAMINANTS IN WATER 99
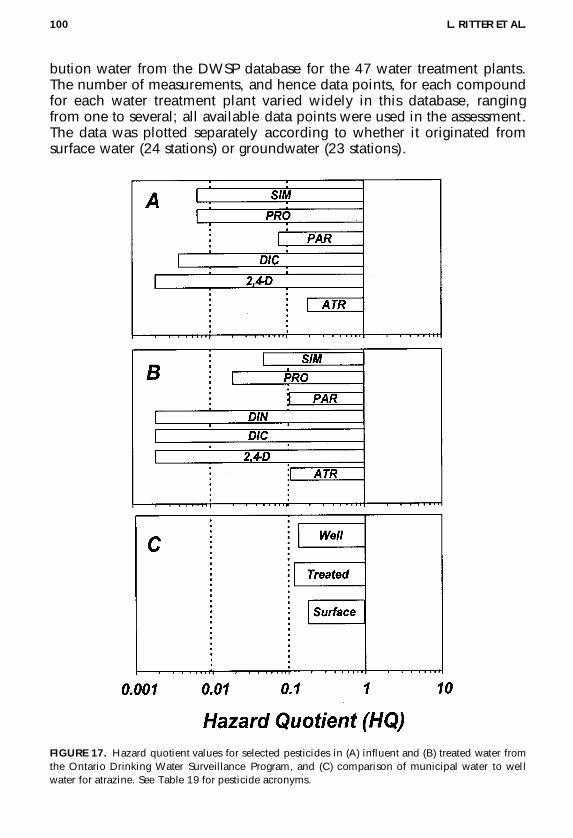
bution water from the DWSP database for the 47 water treatment plants.The number of measurements, and hence data points, for each compoundfor each water treatment plant varied widely in this database, rangingfrom one to several; all available data points were used in the assessment.The data was plotted separately according to whether it originated fromsurface water (24 stations) or groundwater (23 stations).
100 L. RITTER ET AL.
FIGURE 17. Hazard quotient values for selected pesticides in (A) influent and (B) treated water fromthe Ontario Drinking Water Surveillance Program, and (C) comparison of municipal water to wellwater for atrazine. See Table 19 for pesticide acronyms.

Where possible, we have provided an indication of the frequencywith which these compounds are detected in drinking water or in surfacewaters, if the former was not available. For some compounds, frequency-of-detection data have been presented in the preceding sections.
Results of HQ Assessment
The ranges of concentrations for each compound at each stage of thewater treatment process from the DWSP are provided in Table 19. Ourassessment of these data in drinking water showed that the HQ values formost contaminants were well below 1 (Figures 17–20). These data suggestthat there is little risk to humans from exposure to these substancesthrough ingestion of water. In fact, the HQs that we report here are basedon highest exposure levels (maximum concentrations), so it likely that theHQs based on the average or median concentrations, and the impliedlevel of risk, would be even lower as illustrated by the pesticide HQ esti-mates from well water (Table 20).
Pesticides
All of the pesticides evaluated from treated municipal water had HQvalues <1 (Figure 17). HQ values ranged from 0.002–0.190 for surfacewater samples (Figure 17A) and 0.002–0.112 for groundwater samples(Figure 17B). For both sources, atrazine generally yielded the highest HQvalues, with surface waters (0.190) being slightly higher than groundwater(0.112). It must be kept in mind that the data used to estimate the HQsfor pesticides, other than atrazine, were based on very few data pointsbecause pesticides are not routinely measured as part of the DWSP. The
SOURCES, PATHWAYS, AND RISKS OF CONTAMINANTS IN WATER 101
FIGURE 18. Hazard quotient values for nitrates in influent (surface and ground) and distributionwater in municipal water treatment plants participating in the Ontario Drinking Water SurveillanceProgram.

HQ value for the mean concentration of atrazine measured in well water(from study of Rudolph & Goss, 1993) was 0.138 (Figure 17C). The HQvalue for the maximum concentration recorded in that study (18 µg/L)was 3.6. A number of other pesticides detected in that survey had HQvalues >1 (Table 20); however, these occurred very infrequently and,based on median values, the majority yielded HQ values well below 1.Only 6 out of the 1292 wells (0.46%) sampled in that survey containedpesticides above the provincial MAC (Goss et al., 1998).
102 L. RITTER ET AL.
FIGURE 19. Hazard quotient values for selected metals in (A) influent, (B) treated, and (C) distribu-tion water from the Ontario Drinking Water Surveillance Program.

NitratesHQ estimates for nitrates in water sampled from each stage of the treat-
ment process in municipal water treatment plants were <1 (Figure 18); how-ever, the HQ value for the highest concentration in surface water was justbelow 1 (0.94). In contrast, based on several studies, HQ values >1 werefrequently determined for the highest nitrate concentrations in rural waterwells (Table 21). This result is consistent with the relatively high number
SOURCES, PATHWAYS, AND RISKS OF CONTAMINANTS IN WATER 103
FIGURE 20. Hazard quotient values for selected disinfection by-products in (A) influent, (B) ground,and (C) distribution water from the Ontario Drinking Water Surveillance Program. See Table 19 foracronyms.

of exceedences of the nitrate water quality guideline reported for wellwater in rural areas in Ontario and elsewhere in Canada (Frank et al.,1991; Briggins & Moerman, 1995; Goss et al., 1998).
MetalsExcept for lead in distribution water, for which we estimated an HQ
value of 2.23, the HQ values for chromium, cadmium, and arsenic were<1 (Figure 19) in all water treatment stages. Elevated lead levels in distrib-ution water is not surprising due to the occurrence of lead piping in someolder architecture. The lead data are analyzed in greater detail belowusing a probabilistic approach.
Organics
The HQ estimates for all of the organic compounds for which data werecollected from the DWSP database were <1, ranging from 0.005–0.57 ininfluent (surface) water to 0.1–0.56 in distribution water (Table 22).
104 L. RITTER ET AL.
TABLE 20. Summary of Pesticide Findings from a 1991/1992 Survey of Ontario Rural Wells (Rudolph& Goss, 1993)
Frequencyof detection Frequency Concentrations (µg/L)(number of detection ______________________________
Pesticide of wells) (%) Maximum Mean Median
Alachlor 1 0.1 15.0 (0.75)a 15.0 (0.75) NAAtrazine 126 10.5 18.9 (3.6) 0.69 (0.14) 0.30 (0.06)Diethyl atrazine 76 6.3 8.2 (2.3) 0.98 (0.20) 0.72 (0.14)Cyanazine 3 0.3 3.6 (0.36) 1.7 (0.17) 1.2 (0.12)Metribuzin 9 0.3 0.69 (0.009) 0.61 (0.008) 0.63 (0.008)Metolachlor 3 0.8 93 (1.9) 17.3 (0.35) 1.7 (0.60)
Note. Numbers in parentheses represent hazard quotient (HQ) estimates (derived from CanadianWater Quality Guidelines unless indicated otherwise).
aBased on WHO (1996) drinking water guideline.
TABLE 21. Summary of Nitrate Concentrations in Well Water from Various Studies and EstimatedHazard Quotients (in Parentheses)
Concentrations (µg/L)__________________________________Study Maximum Mean Median
Briggins and Moerman (1995) 46.1 (4.61) 4.61 (0.46) 2.68 (0.27)Frank et al. (1990)–1986 55 (5.5) NA NAFrank et al. (1990)–1987 43 (4.3) NA NARudolph and Goss (1993)–summer 87 (8.7) NA NARudolph and Goss (1993)–winter 77 (7.7) NA NAOntario Ministry of Environment (1985) 60 (6.0) NA NA
Note. Canadian Water Quality Guideline value for nitrate is 10 mg/L.

Disinfection By-Products
The HQ values for the maximum concentration of total trihalomethaneswere 0.505, 0.520, and 2.38 for surface water, groundwater, and distributionwater, respectively (Figure 20). Except for trichloracetic acid in distributionwater (HQ = 1.38), the HQ estimates for each of the individual componentsof THMs (di- and trichloroacetic acid, bromodichloromethane, bromoform,and chloroform) did not exceed 1. The HQ values for these compoundswere generally higher in distribution water; this is not surprising becauseDBPs are formed, in part, as a result of interactions with naturally occurringorganic precursors in surface and groundwater during and after the treat-ment process.
Probabilistic Assessment
Those compounds for which the estimated HQ was >1 in the assess-ment of treated municipal water (trichloroacetic acid, total trihalomethanes,and lead) were subsequently analyzed using a probabilistic assessmentbased on cumulative frequency distributions to estimate the likelihood ofthe measured values exceeding the respective MACs. The regression coef-ficients for the cumulative frequency distributions (Table 23) were used toestimate the likelihood of the measured values exceeding the MAC (Table
SOURCES, PATHWAYS, AND RISKS OF CONTAMINANTS IN WATER 105
TABLE 22. Hazard Quotient Estimates for Selected Organic Substances in Drinking Water Derivedfrom the Ontario Drinking Water Surveillance Program
Influent (surface) Distribution Compound water water
Benzene 0.4 0.17Carbontetrachloride — 0.321,4-Dichlorobenzene 0.11 0.1Nitrosodimethylamine (NDMA) 0.57 0.56Pentachlorophenol 0 —Tetrachloroethylene 0.005 0.32
TABLE 23. Regression Coefficients and Intercepts for Various Contaminants in Drinking Water
y = ax + b Regression Probability_________________________ intercepts of exceedingData source a b r2 MAC (µg/L) 90% the MAC
TCA surface water 1.72 3.74 0.95 100 30 1.44TCA groundwater 1.25 5.04 0.99 100 10 0.54THM surface water 2.97 0.77 0.98 100 72 4.36THM groundwater 1.77 3.77 0.99 100 26 1.05Lead surface water 1.14 5.83 0.92 10 2 2.39Lead groundwater 1.62 5.96 0.96 10 2 0.48
Note. Values for the regression are based on a linear regression analysis on the log- and probability-transformed values from the plotted data.

A2). For all three compounds, >95% of the measured values fell below theMAC in surface water, and 100% of values fell below the MAC in ground-water (Figures 21–23). While these exceedences are relatively low, theymust be considered in the context of the sampling base from which theywere drawn. Analyses for these substances are conducted relatively infre-quently (every 3–6 mo in most locations), so these samples may not rep-resent the entire period between samples. In the absence of analyses forthe intermediate times, the distribution analyses suggest that exceedencescould be of relatively long duration. As might be expected for TCA andtotal THMs, exceedences of the MAC in the distribution water drawn fromsurface water were greater than those from groundwater (no exceedences) .Exceedences of the MAC for lead were also greater in surface water than ingroundwater. While this may be the result of contamination from lead pipes,it is more likely from contaminants other sources such as in runoff fromcontaminated soil or from atmospheric deposition.
SUMMARY AND CONCLUSIONSAddressing issues of drinking water quality and management requires a
thorough understanding and evaluation of the types and environmental
106 L. RITTER ET AL.
FIGURE 21. Probability distributions for total trihalomethane (THMs) concentrations in surface waterand groundwater. MAC, provincial maximum allowable concentration.

behaviour of contaminants that lead to impairment of this critical resource.A key aspect of this evaluation is the need for an enhanced understandingof the sources and nature of contaminant loadings to, and the transportpathways within, the primary water systems that serve as sources of drink-ing water for humans and a place of residence for aquatic organisms. Whilethe tragic events at Walkerton were precipitated by pathogenic contamina-tion of the drinking water supply, it is important to realize that water qualityissues in Ontario and other jurisdictions extend well beyond issues of path-ogenic contamination and its associated risks to human health. Indeed, sig-nificant risks to human health may result from exposure to nonpathogenic,toxic contaminants, many of which are globally ubiquitous in waters fromwhich drinking water is derived. In this context, we undertook the currentreview to address two important objectives: (1) to identify the majorsources of contaminants from anthropogenic activities to aquatic surfacewaters and groundwater and the pathways through which they move, and(2) to assess the health significance of selected contaminants in drinkingwater and identify some of the inherent uncertainties in terms of exposuresand potential effects.
The loading of contaminants to surface waters, groundwater, sediments,and ultimately drinking water occurs as either point-source or non-point-
SOURCES, PATHWAYS, AND RISKS OF CONTAMINANTS IN WATER 107
FIGURE 22. Probability distributions for lead (Pb) concentrations in surface water and groundwater.MAC, provincial maximum allowable concentration.
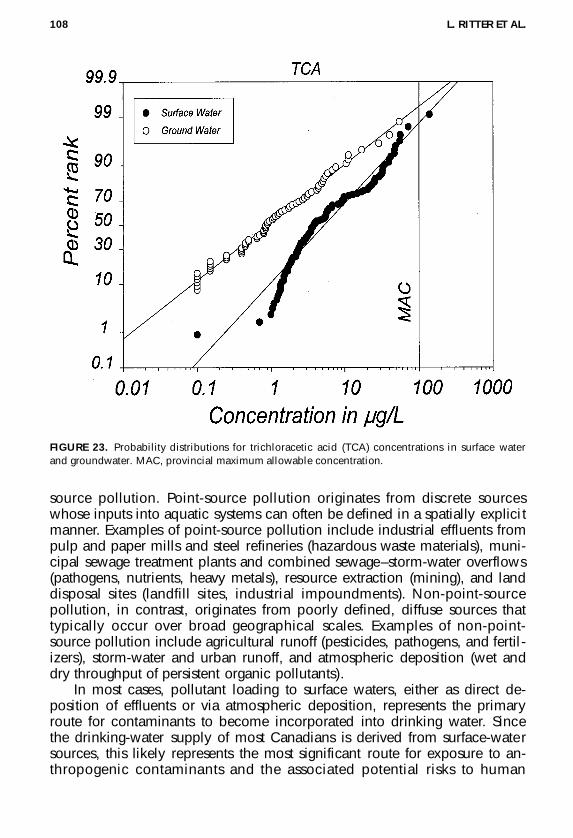
source pollution. Point-source pollution originates from discrete sourceswhose inputs into aquatic systems can often be defined in a spatially explicitmanner. Examples of point-source pollution include industrial effluents frompulp and paper mills and steel refineries (hazardous waste materials), muni-cipal sewage treatment plants and combined sewage–storm-water overflows(pathogens, nutrients, heavy metals), resource extraction (mining), and landdisposal sites (landfill sites, industrial impoundments). Non-point-sourcepollution, in contrast, originates from poorly defined, diffuse sources thattypically occur over broad geographical scales. Examples of non-point-source pollution include agricultural runoff (pesticides, pathogens, and fertil-izers), storm-water and urban runoff, and atmospheric deposition (wet anddry throughput of persistent organic pollutants).
In most cases, pollutant loading to surface waters, either as direct de-position of effluents or via atmospheric deposition, represents the primaryroute for contaminants to become incorporated into drinking water. Sincethe drinking-water supply of most Canadians is derived from surface-watersources, this likely represents the most significant route for exposure to an-thropogenic contaminants and the associated potential risks to human
108 L. RITTER ET AL.
FIGURE 23. Probability distributions for trichloracetic acid (TCA) concentrations in surface waterand groundwater. MAC, provincial maximum allowable concentration.

health. Contamination of surface waters and associated sediments is cer-tainly the most significant route by which aquatic communities are exposedto anthropogenic contaminants and associated risks that threaten the ecolog-ical integrity of aquatic systems. Despite this fact, apart from some focusedregional studies (e.g., Struger et al., 2000), there has been surprisingly littleeffort to undertake comprehensive, national monitoring programs of conta-minants in Canadian surface waters. Such programs can be very expensiveto undertake; however, as demonstrated by recent national monitoring pro-grams in the United States (e.g., by the U.S. Geological Survey and U.S.Environmental Protection Agency), they can also provide important spatialand temporal information about surface-water contamination that can feedinto the risk assessment process, and can aid managers in regulatory initia-tives on both a regional and national level.
Pollutant loading to groundwater occurs through direct exchange withcontaminated surface water or leaching of contaminants through soil.Although fewer Canadians draw their drinking water from groundwatersources, this route is the most significant source for exposure of humansto contaminants in drinking water in rural communities. Risks to humanhealth may be much higher in rural areas because drinking water, particu-larly that associated with privately owned wells, is often not treated. Inthis context, although several comprehensive studies have been conductedto evaluate levels and distributions of relevant contaminants in rural wellwater, no structured monitoring program exists.
Historical approaches regarding the governance and management ofgroundwater/surface-water research has been to treat surface water andgroundwater as distinctly separate water systems (Naiman et al., 1995; Dun-can, 1999). However, that the intimate chemical and biological connec-tions between groundwater and surface waters form an integral componentof the hydrological cycle has gained wide acceptance by scientists andgreater appreciation by environmental managers. Understanding the natureof groundwater–surface-water relationships is a crucial step to understand-ing the pathways through which contaminants may be exchanged betweenthese two systems and how this may affect exposure of humans and aquaticbiota to contaminants. Thus, it is imperative that future assessment andmanagement of water quality be conducted in a manner that recognizes theintimate connection between these two systems.
For selected compounds in both surface water and groundwater sub-jected to the hazard assessment, most of the estimated HQs were <1. Thisindicates that there is little risk associated with exposure from drinkingwater to the compounds tested. There were some exceptions. For example,nitrates were found to commonly yield HQs >1 in drinking water takenfrom many rural areas. Some pesticides from well water also yielded HQs>1. In treated distribution waters (water distributed to households), lead,total trihalomethanes, and trichloroacetic acid each yielded HQs >1. Theselatter compounds were further assessed using a probabilistic approach;
SOURCES, PATHWAYS, AND RISKS OF CONTAMINANTS IN WATER 109

these assessments indicated that the maximum allowable concentrations(MACs) or interim MACs for the respective compounds were exceeded<5% of the time. In other words, the probability of finding these com-pounds in drinking water at levels that pose risks to humans through inges-tion of drinking water is very low.
Our review was carried out in accordance with the conventional princi-ples of risk assessment. Application of the risk assessment paradigm re-quires rigorous data on both exposure and toxicity in order to adequatelycharacterize potential risks of contaminants to human health and ecologi-cal integrity. Uncertainty rendered by poor data, or lack of data, in eitherthe exposure or effects stages of the risk assessment process significantlyreduces the confidence that can be placed in the overall risk assessment.
Overall, while our review suggested selected instances of potential risksto human health from exposure to contaminants in drinking water, we alsonoted a distinct paucity of information on exposure levels for many contami-nants in this matrix. We suggest that this represents a significant limitation toconducting sound risk assessments and introduces considerable uncertaintywith respect to the management of water quality. In this context, futureresearch must place greater emphasis on targeted monitoring and assess-ment of specific contaminants in drinking water for which there is currentlylittle information. Such a undertaking need not be resource intensive norcost prohibitive as long as research priorities are directed to problem com-pounds identified using the appropriate tools of sound risk assessment. Thiscould be accomplished by using a tiered risk approach, beginning with, forexample, assessments based on the use of hazard quotients. Ideally, thesewould not be used as a basis for rendering final management decisions,although this is often the practice. Potentially problematic compounds iden-tified in these preliminary assessments would then be subjected to morecomprehensive risk assessments using probabilistic methods, if sufficientdata exist to do so. On this latter point, there is often a lack of adequateexposure and/or toxicity information for many compounds (e.g., pharmaceu-ticals) from which to construct distributions to estimate the probability ofrisk, thus providing little opportunity to undertake adequate ecological orhuman risk assessments. In such cases, basic research into exposure and tox-icity must be conducted.
REFERENCESAbke, W., Korpien, H., and Post, B. 1993. Pollution of downstream groundwater near railway tracks
treated with herbicides. Vom Wasser 81:257–273.Adams, S. M., Crumby, W. D., Greeley, M. S., Jr., Shugart, L. R., and Taylor, C. F. 1992. Responses
of fish populations and communities to pulp mill effluents: a holistic assessment. Ecotoxicol.Environ. Safety 24:347–360.
Aldenberg, T., and Slob, W. 1991. Confidence limits for hazardous concentrations based on logisti-cally distributed NOEC toxicity data. Ecotoxicol. Environ. Safety 18:221–251.
Aldenberg, T., and Slob, W. 1993. Confidence limits for hazardous concentrations based on logisti-cally distributed NOEC toxicity data. Ecotoxicol. Environ. Safety 25:48–63.
110 L. RITTER ET AL.

Allard, B., Hakansson, K., and Karlsson, S. 1987. The importance of sorption phenomena in relationto trace metal speciation and mobility. In Speciation of metals in water, sediment and soil sys-tems, ed. L. Landner. New York: Springer-Verlag.
Allan, J. D. 1995. Stream ecology. Structure and function of running waters. New York: Chapmanand Hall.
Allan, J. D. Erickson, D. L., and Fay, J. 1997. The influence of catchment land use on stream integrityacross multiple scales. Freshwater Biol. 37:149–161.
Allen, H. E. 1995. Metal contaminated aquatic sediments. Ann Arbor, MI: Ann Arbor Press.Allen, H. E., Perdue, E. M., and Brown, D. S. 1993. Metals in groundwater. Chelsea, MI: Lewis.Alloway B. J. 1995. Heavy metals in soils, 2nd ed. New York: Chapman & Hall.Anderson, P. S., and Yuhas, A. L. 1996. Improving risk management by characterizing reality: A ben-
efit of probabilistic risk assessment. Hum. Ecol. Risk Assess. 2:55–58.Ankley, G. T., Di Toro, D. M., Hansen, D. J., and Berry, W. J. 1996. Technical basis and proposal for
deriving sediment quality criteria for metals. Environ. Toxicol. Chem. 15:2056–2066.Apselin, A. L. 1994. Pesticide industry sales and usage, 1992 and 1993 market estimates. Washing-
ton, DC: U.S. Environmental Protection Agency, Office of Pesticide Programs, Biological andEconomic Analysis Division, Economic Analysis Branch. Report 733K-92-001.
Arment, A. R., and Carmichael, W. W. 1996. Evidence that microcystin is a thio template product. J.Phycol. 32:591–597.
Atkins, E., and Hawley, J. 1978. Sources of metals and metal levels in municipal wastewaters.Research Report No. 80. Research Program for the Abatement of Municipal Pollution under Pro-visions of the Canada–Ontario Agreement on Great Lakes Water Quality. Ottawa: EnvironmentCanada and Ontario Ministry of Environment.
Bailey, H. C., Deanovic, L., Reyes, E., Kimball, T., Larson, K., Cortright, K., Connor, V., and Hinton,D. E. 2000. Diazinon and chlorpyrifos in urban waterways in northern California. Environ.Toxicol. Chem. 19:82–87.
Baker, J. L., Kanwar, R. S., and Austin, T. A. 1985. Impact of agricultural drainage wells on ground-water quality. J. Soil Wat. Conserv. 40:516–520.
Balk, F., Okkerman, P. C., and Dogger, J. W. 1995. Guidance document for aquatic effects assess-ment. Paris: Organization for Economic Co-operation and Development.
Bannerman, R. T., Owens, D. W., Dodds, R. B., and Hornewer, H. J. 1993. Sources of pollutants inWisconsin stormwater. Water Sci. Technol. 28:241–259.
Barbash, J. E., Thelin, G. P., Kolpin, D. W., and Gilliom, R. J. 1999. Distribution of major herbicidesin groundwater of the United States. Sacramento, CA: U.S. Geological Survey, Water ResourcesInvestigation Report 98-4245.
Barcelona, M., Wehrmann, A., Keely, J. F., and Pettyjohn, W. A. 1990. Contamination of ground-water. Prevention, assessment, and restoration. Pollut. Technol. Rev. 184. Park Ridge, NJ: Noyes.
Bell, S. G., and Cobb, G. A. 1994. Cyanobacterial toxins and human health. Rev. Med. Microbiol.5:256–264.
Bendell-Young, L. I., and Harvey, H. H. 1992. Geochemistry on Mn and Fe in lake sediments in rela-tion to lake acidity. Limnol. Oceanogr. 37:603–613.
Bendell-Young, L. I., Dutton, M., and Pick, F. R. 1992. Contrasting two methods for determiningtrace metal partitioning in oxidized lake sediments. Biogeochemistry 17:205.
Bennie, D. T. 1999. Review of the environmental occurrence of alkylphenols and alkylphenolethoxylates. Water Qual. Res. J. Can. 34:79–122.
Bennie, D. T., Sullivan, C. A., Lee, H.-B., Peart, T. E., and Maguire, R. J. 1997. Occurrence ofalkylphenols and alkylkphenol mono- and diethoxylates in natural waters of the LaurentianGreat Lakes basin and upper St. Lawrence River. Sci. Total Environ. 193:263–275.
Beychok, M. R. 1980. State-of-the-art wastewater treatment. In Environmental management hand-book for the hydrocarbon processing industries, ed J. D. Wall, pp. 48–51. New York: Gulf.
Bianchi, W. C., and Muckel, D. C. 1970. Ground-water recharge hydrology. USDA ARS 41-161.Washington, DC: U.S. Department of Agriculture. Agricultural Research Service.
Bier, V. M. 1999. Challenges to the acceptance of probabilistic risk analysis. Risk Anal. 19:703–709.
SOURCES, PATHWAYS, AND RISKS OF CONTAMINANTS IN WATER 111

Binkley, D., and Brown, T. C. 1993. Forest practices as non-point sources of pollution in NorthAmerica. Water Resource Bull. 29:729–740.
Black, T. A., Roberts, R. F., Johnson, D. M., Minicucci, D. D., Mancy, K. H., and Allen, H. E. 1973.The significance of physiochemical variables in aquatic bioassays of heavy metals. In Bioassaytechniques and environmental chemistry, ed. G. E. Glass, pp. 259–275. Ann Arbor, MI: AnnArbor Science.
Bockman, O. 1990. Agriculture and fertilizers in perspective: Their role in feeding the world, environ-mental challenges. Are there alternatives? Oslo, Norway: Agricultural Group, Norsk Hydro.
Bonsor, N., McCubbin, N., and Sprague, J. B. 1988. Kraft mill effluents in Ontario. Report preparedfor Ministry of the Environment. Toronto, ON: Ministry of Environment.
Bowen, G. S., and Hinton, M. J. 1998. The temporal and spatial impacts of road salt on streamsdraining the Greater Toronto Area. In Groundwater in a watershed context proceedings, pp. 303–309. Burlington, Ontario.
Brezonik, P. 1976. Analysis and speciation of trace metals in water supplies. In Aqueous-environ-mental chemistry of metals, ed A. J. Rubin, pp. 167–191. Ann Arbor, MI: Ann Arbor Science.
Briggins, D. R., and Moerman, D. E. 1995. Pesticides and farm well water quality in Kings County,Nova Scotia. Water Qual. Res. J. Can. 30:443–468.
Burmaster, D. E. 1996. Benefits and costs of using probabilistic techniques in human health riskassessments—With emphasis on site-specific risk assessments. Hum. Ecol. Risk Assess. 2:35–43.
Burton, G. A., Jr. 2001. Moving beyond sediment quality values and simple laboratory toxicity tests.SETAC Globe 2(2):26–27.
Buser, H.-R., Poiger, T., and Muller, M. D. 1999. Occurrence and environmental behavior of the chi-ral pharmaceutical drug ibuprofen in surface waters and in waste water. Environ. Sci. Technol.33:2529–2535.
Cadmus Group, Inc. 1996. Aquatic Ecological Risk Assessment. Alexandria, VA: Water EnvironmentResearch Foundation.
Calabrese, E. J., and Baldwin, L. A. 1993. Performing ecological risk assessments. Boca Raton, FL:Lewis.
Campbell, P. G. C., Lewis, A. G., Chapman, P. M., Crowder, A. A., Fletcher, W. K., Imber, B.,Luoma, S. N., Stokes, P. M., and Winfrey, M. 1988. Biologically available metals in sediments.National Research Council of Canada Report No. 27694. Associate Committee on ScientificCriteria for Environmental Quality. Ottawa, Ontario: National Research Council.
Cardwell, R. D., Parkhurst, B. R., Warren-Hicks, W., and Volosin, J. S. 1993. Aquatic ecological risk.Water Environ. Technol. 5:47–51.
Carigan, R., Rapin, F., and Tessier, A. 1985. Sediment porewater sampling for metal analysis: A com-parison of techniques. Geochem. Cosmochim. Acta 49:2493–2497.
Carpi, A., and Lindberg, S. E. 1997. Sunlight-mediated emission of elemental mercury from soilamended with municipal sewage sludge. Environ. Sci. Technol. 31(7):2085–2091.
Chambers, P. A., Allard, M., Walker, S. L., Marsalek, J., Lawrence, J., Servos, M., Busnarda, J.,Munger, K. S., Adare, K., Jefferson, C., Kent, R. A., and Wong, M. P. 1997. Impacts of municipalwastewater effluents on Canadian waters: A review. Water Qual. Res. J. Can. 32:659–713.
Chambers, P. A., Kent, R. A., Charlton, M. N., Guy, M., Gagnon, C., Roberts, E., Grove, G., andFoster, N. 2001. Nutrients and their impact on the Canadian environment. Ottawa, ON: Govern-ment of Canada.
Chapman, P. M. 1995. How should numerical criteria be used? Hum. Ecol. Risk Assess. 1:1–4.Chapman, P. M., Birge, W. J., Adams, W. J., Barrick, R., Bott, T. L., Burton, G. A., Douglas, W. S.,
Luther, G. W. III, O’Connor, T., Page, D. S., Sibley, P. K., Standley, L. J., and Wenning, R. 2001.Sediment quality values (SQVs)—Key issues and recommendations. SETAC Globe 2(2):36–37.
Cherry, J. A., and Harmon, J. 1994. Organic chemicals in Canadian groundwater. Haz. Mater. Manage.6:47–49.
Cockerham, L. G., and Cockerham, M. B. 1994. Environmental ionizing radiation. In Basic environ-mental toxicology, eds. L. G. Cockerham and B. S. Shane, pp. 231–261. Boca Raton, FL: CRCPress.
112 L. RITTER ET AL.

Colborn, T., vom Saal, F. S., and Soto, A. M. 1993. Developmental effects of endocrine disruptingchemicals in wildlife and humans. Environ. Health Perspect. 101:378–384.
Colborn, T., Dumanoski, D., and Myers, J. P. 1996. Our stolen future. New York: Dutton Press.Conboy, M. J., and Goss, M. J. 1997. Is Escherichia coli an effective predictor of health risks and
source of water contamination for rural populations? Toxicol. Exotoxicol. News 4:156–157.Conboy, M. J., and Goss, M. J. 1999. Contamination of rural drinking water wells by fecal origin bac-
teria—Survey findings. Water Qual. Res. J. Can. 34:281–303.Costner, P., and Thornton, J. 1989. We all live downstream—The Mississippi River and the national
toxics crisis. Washington, DC: Greenpeace USA.Crosby, D. G. 1998. Environmental toxicology and chemistry. New York: Oxford University Press.Cullen, W., and Reimer, K. 1989. Environmental arsenic chemistry. Chem. Rev. 89:713–764.CWQG. 1999. Canadian water quality guidelines (and updates). Ottawa, ON: Task Force on Water
Quality Guidelines of the Canadian Council of Resource and Environment Ministers.Daughton, C. G., and Ternes, T. A. 1999. Pharmaceuticals and personal care products in the envi-
ronment: Agents of subtle change? Environ. Health Perspect. 107(suppl. 6):907–938.Davis, D. L., Bradlow, H. L., Wolff, M., Woodruff, D. G., Hoel, D. G., and Anton-Culver, H. 1993.
Medical hypothesis: Xenoestrogens as preventable causes of breast cancer. Environ. HealthPerspect. 101:372–377.
Demayo, A., Davis, A. R., and Forbes, M. A. 1978. Forms of metals in water. Scientific Series No. 87.Ottawa: Inland Water Directorate, Water Quality Branch.
Devinny, J. S. 1990. The composition of hazardous waste. In Subsurface migration of hazardouswastes, eds. J. S. Devinny, L. G. Everett, J. C. S. Lu, and R. L. Stoller, pp. 15–39. New York: VanNostrand Reinhold.
Devinny, J. S., and Lu, J. C. S. 1990. Introduction. In Subsurface migration of hazardous wastes, eds.J. S. Devinny, L. G. Everett, J. C. S. Lu, and R. L. Stoller, pp. 1–7. New York: Van NostrandReinhold.
Digiano, F. A., Miller, C. T., and Yoon, J. 1993. Predicting the release of PCBs at the point of dredg-ing. J. Environ. Eng. 119:72–89.
Di Toro, D. M., Zarba, C., Hansen, D. J., Swartz, R. C., Cowan, C. E., Allen, H. E., Thomas, N. A.,Paquin, P. R., and Berry, W. J. 1991. Technical basis for establishing sediment quality criteriafor non-ionic organic chemicals using equilibrium partitioning. Environ. Toxicol. Chem. 10:1541–1583.
Dobson, S. I., Merritt, C. M., Shannahan, J.-P., and Schults, C. M. 1999. Low exposure concentra-tions of atrazine increase male production in Daphnia pulicaria. Environ. Toxicol. Chem. 15:1568–1573.
Doyle, E. 2001a. Production and distribution of drinking water. A paper submitted to the WalkertonInquiry. www.walkertoninquiry.com.
Doyle, E. 2001b. Waste water collection and treatment. A paper submitted to the Walkerton Inquiry.www.walkertoninquiry.com.
Duncan, P. B. 1999. Groundwater–surface water interactions: No longer ignoring the obvious atsuperfund sites. SETAC News 19(5):20–21.
Eckel, W. P., Ross, B., and Isensee, R. 1993. Pentobarbital found in ground water. Ground Water31:801–804.
ECOFRAM. 1999. ECOFRAM aquatic and terrestrial final draft reports. U.S. EPA, www.epa.gov/oppefed1/ecorisk/index.htm. Accessed 1 June 1999.
Edjulee, G. V., and Cains, P. 1996. Control of PCDD and PCDF emissions from waste combusters. InChlorinated organic micropollutants, eds. R. E. Hester and R. M. Harrison, pp. 1–15. RoyalSociety of Chemistry, Issues in Environmental Science and Technology, vol. 6, Herts, UK.
Eidt, D. C., Hollebone, J. E., Lockhart, W. L., Kinsbury, P. D., Gadsby, M. C., and Ernst, W. R. 1989.Pesticides in forestry and agriculture: Effects on aquatic habitats. Adv. Environ. Sci. Technol.22:245–284.
Eisenreich, S. J., Looney, B. B., and Thornton, J. D. 1981. Airborne organic contaminants in the GreatLakes ecosystem. Environ. Sci. Technol. 15:30–38.
SOURCES, PATHWAYS, AND RISKS OF CONTAMINANTS IN WATER 113

Elder, J. F. 1988. Metal biogeochemistry in surface-water systems: A review of principles and con-cepts. U.S. Geological Survey Circular 1013. Denver, CO: USGS.
Ellis, J. B. 1986. Pollutant aspects of urban runoff. In Urban runoff pollution, eds. H. C. Torno,J. Marsalek, and M. Desbordes, pp. 1–38. New York: Springer-Verlag.
Environment Canada. 1987. Aquatic toxicity of pulp and paper mill effluent: A review. Report EPS4PF/1. Ottawa.
Environment Canada. 1994. Towards a toxic substances management policy for Canada: A discus-sion document for consultation purposes. Ottawa.
Environment Canada. 2000a. Groundwater—Nature’s hidden treasure. Freshwater Series A-5. www.ec.gc.ca/water/en/info/pubs/FS/e_FSA5.htm.
Environment Canada. 2000b. Priority substances list assessment report. Road salts. Canadian En-vironmental Protection Act (CEPA), 1999. Draft for Public Comment. Ottawa.
Exner, M. E., and Spaulding, R. F. 1985. Groundwater contamination and well construction in south-east Nebraska. Ground Water 23:26–34.
Federal Interagency Stream Restoration Working Group. 1998. Stream corridor restoration: Prin-ciples, process, and practices. Springfield, VA: National Technical Information Service (NTIS).
Federal-Provincial Subcommittee on Drinking Water. 1996. Guidelines for Canadian drinking waterquality, 6th ed. Ottawa: Minister of Supply and Services Canada Cat. No. H48-10/1996E, ISBN0-660-16295-4.
Feldman, B. M. 1974. The problem of urban dogs. Science 185:903.Fenn, M. E., Poth, M. A., Aber, J. D., Baron, J. S., Bormann, B. T., Johnson, D. W., Lemly, D., McNulty,
S. G., Ryan, D. F., and Stottlemeyer, R. 1998. Nitrogen excess in North American ecosystems:Predisposing factors, ecosystem responses, and management strategies. Ecol. Appl. 8:706–733.
Ferguson, B. K. 1994. Stormwater infiltration, pp. 154–164. Boca Raton, FL: CRC Press.Ferguson, J. E. 1990. Methyl compounds of the heavy elements. In The heavy elements: Chemistry,
environmental impact and health effects, pp. 429–457. Toronto: Pergamon Press.Finelt, S., and Crump, J. R. 1980. Pick the right water reuse system. In Environmental management
handbook for the hydrocarbon processing industries, ed. J. D. Wall, pp. 38–47. TX: Gulf.Fisher, S. W. 1995. Mechanisms of bioaccumulation in aquatic systems. Rev. Environ. Contam.
Toxicol. 142:87–117.Forbes, T. L., and Forbes, V. E. 1993. A critique of the use of distribution-based extrapolation models
in ecotoxicology. Funct. Ecol. 7:249–254.Forbes, V. E., and Forbes, T. L. 1994. Ecotoxicology in theory and practice. New York: Chapman and
Hall.Forlin, L., Anderson, T., Balk, L., and Larsson, A. 1995. Biochemical and physiological effects in fish
exposed to bleached kraft mill effluents. Ecotoxicol. Environ. Safety 30:164–170.Foster, W. G. 2001. Endocrine disruption and human reproductive effects: An overview. Water Qual.
Res. J. Can. 36:253–271.Fox, G. A. 1992. Epidemiological and pathobiological evidence of contaminant-induced alterations in
sexual development in free-living wildlife. In Chemically-induced alterations in sexual and func-tional development: The wildlife–human connection, pp. 147–158. Princeton, NJ: PrincetonScientific.
Fox, G. A. 2001. Effects of endocrine disrupting chemicals on wildlife in Canada: Past, present, andfuture. Water Qual. Res. J. Can. 36:233–251.
Frank, R., Sirons, G. J., and Ripley, B. D. 1979. Herbicide contamination and decontamination ofwell waters in Ontario, Canada, 1969–1978. Pestic. Monit. J. 13:149–167.
Frank, R., Sirons, G. J., Thomas, R. L., and McMillan, K. 1982. Triazine residues in suspended solids(1974–1976) and water (1977) from mouths of the Canadian streams flowing into the GreatLakes. J. Great Lakes Res. 5:131–138.
Frank, R., Clegg, B. S., Ripley, B. D., and Braun, H. E. 1987a. Investigations of pesticide contami-nations in rural wells, 1979–1984, Ontario, Canada. Arch. Environ. Contam. Toxicol. 16:9–22.
Frank, R., Ripley, B. D., Braun, H. E., Clegg, B. S., Johnson, R., and O’Neill, T. J. 1987b. Survey offarm wells for pesticide residues, Southern Ontario, Canada, 1981–1982, 1984. Arch. Environ.Contam. Toxicol. 16:108.
114 L. RITTER ET AL.

Frank, R., Braun, H. E., Ripley, B. D., Clegg, B. S., and Johnson, R. 1990. Survey of farm wells forpesticides, Ontario, Canada, 1986 and 1987. Bull. Environ. Contam. Toxicol. 44:410–419.
Gadh, R., Singh, O. V., Tandon, S. N., and Mathur, R. P. 1991. Determination of different solublespecies in Yamuna River Waters. Environ. Technol. 12:363–369.
Geldreich, E. E. 1990. Microbiological quality of source waters for water supply. In Drinking watermicrobiology, ed. G. A. McFeters, pp. 3–31. New York: Springer-Verlag.
Geldreich, E. E. 1996. Microbial quality of water supply in distribution systems. Boca Raton, FL: CRCPress.
Gibbons, D. C. 1986. The economic value of water. Washington, DC: Resources for the Future.Giesy, J. P., and Kannan, K. 2001. Global distribution of perfluorooctane sulfonate and related com-
pounds in wildlife. Environ. Sci. Technol. 35:1339–1342.Giesy, J. P., Ludwig, J. P., and Tillet, D. E. 1994. Deformities in birds of the Great Lakes region:
Assigning causality. Environ. Sci. Technol. 28:128A–135A.Gilliland, F. D., and Mandel, J. S. 1996. Serum perfluorooctanoic acid and hepatic enzymes, lipopro-
teins, and cholesterol: A study of occupationally exposed men. Am. J. Ind. Med. 29:560–568.Gilliom, R. J., Barbash, J. E., Koplin, D. W., and Larsen, S. J. 1999. Testing water quality for pesticide
pollution. Environ. Sci. Technol. 33:164A–169A.Glasgow, H. B., Burkholder, J. M., Schmechel, J. D., Tester, P. A., and Rublee, P. A. 1995. Insidious
effects of a toxic estuarine dinoflagellate on fish survival and human health. J. Toxicol. Environ.Health 46:501–522.
Goss, M. J., and Barry, D. A. J. 1995. Groundwater quality: Responsible agriculture and public per-ceptions. J. Agricul. Environ. Ethics 8:52–64.
Goss, M. J., Barry, D. A. J., and Rudolph, D. L. 1998. Contamination in Ontario farmstead domesticwells and its association with agriculture. 1. Results from drinking water wells. J. Contam. Hydrol.32:267–293.
Goss, M. J., Rollins, K., McEwan, K., Shaw, R., and Lammers-Helps, H. 2001. The management ofmanure in Ontario with respect to water quality. A report to the Walkerton Commission. www.walkertoninquiry.com.
Government of Canada. 1991. The state of Canada’s environment. Ottawa: Ministry of Supply andServices Canada. En21-54/1991E.
Government of Canada. 1996. The state of Canada’s environment. Ottawa: Minister of Public Worksand Government Services. En21-54/1996E.
Government of Canada. 1997. Ontario region compliance inspection summary report 1996/ 97, En-vironment Canada. www.on.ec.gc.ca/glimr/data/summary-report/intro.html. Accessed 2 February2001.
Government of Canada. 2000. Petroleum refinery liquid effluent regulations. Department of Fisheriesand Oceans. http://Canada.justice.gc.ca/FTP/EN/Regs/Chap/F/F-14/CRC828.txt. Accessed 2February 2001.
Gray, N. F. 1998. Acid mine drainage composition and the implications for its impact on lotic sys-tems. Water Res. 32:2122–2134.
Greenberg, M. S., Burton, G. A., and Duncan, P. B. 2000. Considering groundwater–surface waterinteractions in sediment toxicity assessment. SETAC Globe 1:42–44.
Gregory, S. V., Swanson, F. J., McKee, A., and Cummins, K. W. 1991. An ecosystem perspective onriparian zones. BioScience 41:540–551.
Grout, H., Wiesner, M. R., and Bottero, J.-Y. 1999. Analysis of colloidal phases in urban stormwaterrunoff. Environ. Sci. Technol. 33:831–839.
Gustafson, D. I. 1993. Pesticides in drinking water. New York: Van Nostrand Reinhold.Halberg, G. R. 1989. Pesticide pollution of groundwater in the humid United States. Agri. Ecosys.
Environ. 26:299–367.Halling-Sorensen, B., Nielson, N., Lanzky, P. F., Ingerslev, F., Lutzhoft, H. C. H., and Jorgensen, S. E.
1998. Occurrence, fate, and effects of pharmaceutical substances in the environment—Areview. Chemosphere 36:357–393.
Harding, J. S., Young, R. G., Hayes, J. W., Shearer, K. A., and Stark, J. D. 1999. Changes in agricul-tural intensity and river health along a river continuum. Freshwater Biol. 42:345–357.
SOURCES, PATHWAYS, AND RISKS OF CONTAMINANTS IN WATER 115
Harrad, S. J. 1996. Sources and fates of polychlorinated dibenzo-p-dioxins, dibenzofurans, andbiphenyls: The budget and source inventory approach. In Chlorinated organic micropollutants,eds. R. E. Hester and R. M. Harrison, vol. 6, pp. 1–15. Royal Society of Chemistry, Issues inEnvironmental Science and Technology, Herts, UK.
Harrison, R. M. 1990. Cycles, fluxes and speciation of trace metals in the environment. In Metal spe-ciation, separation and recovery, vol. II, eds. J. W. Patterson and R. Passino, pp. 3–42. Chelsea,MI: Lewis.
Harrison, S. A., Wastchke, T. L., Mumma, R. O., Jarrett, A. R., and Hamilton, G. W., Jr. 1993.Nutrient and pesticide concentrations in water from chemically treated turfgrass. In Pesticides inurban environments: Fate and significance, eds. K. D. Racke and A. R. Leslie, pp. 191–207.Washington, DC: American Chemistry Society Symposium Series.
Health Canada. 1995. A national survey of chlorinated disinfection by-products in Canadian drinkingwater. Report 95-EHD-197. Ottawa, ON.
Health Canada. 1996a. A one-year survey of halogenated disinfection by-products in the distributionsystems of treatment plants using three different disinfection processes. Report 960EHD-206.Ottawa, ON.
Health Canada. 1996b. Canadian water quality guidelines, 6th ed.Health Canada. 1997. Water. Ottawa: Ministry of Public Works and Services Canada, Cat. No. 1449-
112/1997E. www.hc-sc.gc.ca/ehp/ehd/catalogue/general/97ehd215.htm. Ottawa, ON.Health Canada. 2000. Canadian Cancer Statistics. www.cancer.ca.Hester, R. E., and Harrison, R. M. 1994. Waste incineration and the environment. Cambridge, UK:
Royal Society of Chemistry.Hewitt, M., and Servos, M. 2001. An overview of substances present in Canadian aquatic environ-
ments associated with endocrine disruption. Water Qual. Res. J. Can. 36:191–213.Hill, A. R. 1982. Nitrate distribution in the groundwater at the Alliston region of Ontario. Groundwater
20:696–702.Hirsch, R., Ternes, T., Haberer, K., and Kratz, K.-L. 1999. Occurrence of antibiotics in the aquatic
environment. Sci. Total Environ. 225:109–118.Holm, J. V., Rugge, K., Bjerg, P. L., and Christiansen, T. H. 1995. Occurrence and distribution of
pharmaceutical organic compounds in the groundwater down-gradient of a landfill (Grinsted,Denmark). Environ. Sci. Technol. 29:1415–1420.
Honeyman, B. D., and Santaschi, P. H. 1988. Metals in aquatic systems. Environ. Sci. Technol. 22:862–871.
Hosmer, A., Warren, J., and Brady, J. 2000. Effects of atrazine on the sex ratio of Daphnia pulicaria.In Abtract book for the 21st annual meeting of the Society of Environmental Toxicology andChemistry, Nashville TN, abstr. PTP139.
Huddleston, G. M., Gillespie, W. B., and Rodgers, J. H., Jr. 2000. Using constructed wetlands to treatbiochemical oxygen demand and ammonia associated with a refinery effluent. Ecotoxicol.Environ. Safety 45:188–193.
Huggett, R. J., Van Veld, P. A., Smith, C. L., Hargis, W. J., Jr., Vogelbein, W. K., and Weeks, B. A.1992. The effects of contaminated sediments in the Elizabeth River. In Sediment toxicity assess-ment, ed. G. A. Burton, Jr., pp. 405–430. Boca Raton, FL: Lewis Press.
Hunter, C., and McGee, B. 1994. Survey of pesticide use in Ontario, 1993. Economics Informationreport no. 94-01. Ottawa: Ontario Ministry of Agriculture, Food and Rural Affairs.
International Joint Commission. 1993. A strategy for the virtual elimination of persistent toxic sub-stances, Vol 1. Report of the Virtual Elimination Task Force to the IJC. International Joint Com-mission. Windsor, ON.
International Potash Institute. 1983. Handbook on environmental aspects of fertilizer use. The Hague:W. Junk.
Iwata, H., Tanabe, S., Sakai, N., Nishimura, A., and Tatsukawa, R. 1994. Geographical distribution ofpersistent organochlorines in air, water and sediments from Asia and Oceania, and their impli-cations for global redistribution from lower latitudes. Environ. Pollut. 85:15–33.
Jacobsen, P., and Berglind, L. 1988. Persistence of oxytetracycline in sediments from fish farms.Aquaculture 70:365–370.
116 L. RITTER ET AL.

James, M. O., and Kleinow, K. M. 1994. Trophic transfers of chemicals in the aquatic environment.In Aquatic toxicology: Molecular, biochemical, and cellular perspectives, eds. D. C. Mallins andG. K. Ostrander, pp. 1–35. Boca Raton, FL: Lewis.
Jernelöv, A. 1974. Factors in the transformation of mercury to methylmercury. In Environmental mer-cury contamination, eds. R. Harting and B. D. Dinman, pp. 167–172. Ann Arbor, MI: Ann ArborSciences.
Johnson, L. B., and Gage, S. H. 1997. Landscape approaches to the analysis of aquatic ecosystems.Freshwater Biol. 37:113–132.
Jorgensen, E. P. 1989. The poisoned well. New strategies for groundwater protection. Sierra ClubLegal Defense Fund. Washington, DC: Island Press.
Kaiser, J., and Enserink, M. 2000. Treaty takes a POP at the dirty dozen. Science 290:2053.Kannan, K., Koistenen, J., Beckman, K., Evans, T., Gorzelany, J., Jones, P. D., and Giesy, J. P. 2001. Per-
fluorooctane sulfonate and related fluorinated organic chemicals in marine mammals. Environ. Sci.Technol. 35:1593–1598.
Karr, J. R., Toth, L. A., and Dudley, D. R. 1985. Fish communities of mid-western rivers: A history ofdegradation. BioScience 35:90–95.
Keith, L. H. 1979. Priority pollutants. I. A perspective view. Environ. Sci. Technol. 13:416–423.Keith, L. H. 1997. Environmental endocrine disruptors. A handbook of property data. New York:
Wiley Interscience.Kerry, J., Hiney, M., Coyne, R., NicGabhhaim, S., Gilroy, D., Cazabon, D., and Smith, P. 1995. Fish
feed as a source of oxytetracycline-resistant bacteria in the sediment under fish farms. Aqua-culture 131:101–113.
Klassen, R. 1998. Geological factors affecting the distribution of trace metals in glacial sediments incentral Newfoundland. Environ. Geol. 33:154–169.
Kleinow, K. M., and Goodrich, M. S. 1994. Environmental aquatic toxicology. In Basic environ-mental toxicology, eds. L. G. Cockerham and B. S. Shane, pp. 353–384. Boca Raton, FL: CRCPress.
Koenig, B. G., Metcalfe, C. D., Ternes, T., and Hirsch, R. 2000. Drugs in sewage treatment planteffluents in Canada. In Abstract from the 21st annual meeting of the Society of EnvironmentalToxicology and Chemistry, Nashville, TN, 14–17 November 2000, abstr. 342.
Kooijman, S. A. L. M. 1987. A safety factor for LC50 values allowing for differences in sensitivityamong species. Water Res. 21:269–276.
Krewski, D., Balbus, J., Butler-Jones, D., Haas, C., Isaac-Renton, J., Roberts, K., and Sinclair, M. 2001a.Managing the health risks from drinking water: A background paper for the Walkerton Inquiry.www.walktertoninquiry.com.
Krewski, D., Balbus, J., Butler-Jones, D., Haas, C., Isaac-Renton, J., Roberts, K., and Sinclair, M.2001b. History of drinking water pollution outbreaks in Ontario: A background paper for theWalkerton Inquiry. www.walktertoninquiry.com.
Kummerer, K. 2000. Health risk potential from drinking water polluted with domestic sewage andexcreta. Drugs, diagnostic agents, and disinfectants in waste water. Schrift. Des Ver. WasserBoden Lufthyg. 15:59–66.
Kurtz, D. A. 1990. Long range transport of pesticides. Boca Raton, FL: Lewis.Lackey, R. T. 1995. The future of ecological risk assessment. Hum. Ecol. Risk Assess. 1:339–343.Lammert, M., and Allan, J. D. 1999. Assessing biotic integrity of streams: Effects of scale in measuring
the influence of land use/cover and habitat structure on fish and macroinvertebrates. Environ.Manage. 23:257–270.
Lancaster, J. 2000. The ridiculous notion of assessing ecological health and identifying the usefulconcepts underneath. Hum. Ecol. Risk Assess. 6:213–222.
Landrum, P. F., Gossiaux, D. C., Nalepa, T. C., and Fanslow, D. L. 2001. Evaluation of Lake Michigansediment for causes of the disappearance of Diporiea spp. in southern Lake Michigan. J. GreatLakes Res. 26:402–407.
Larson, S. J., Capel, P. D., and Majewski, M. S. 1997. Pesticides in surface waters. Distribution,trends, and governing factors. Pesticides in the Hydrologic System, Vol. 3. Chelsea, MI: AnnArbor Press.
SOURCES, PATHWAYS, AND RISKS OF CONTAMINANTS IN WATER 117

Leckie, J. O., and James, R. O. 1976. Control mechanisms for trace metals in natural waters. InAqueous-environmental chemistry of metals, ed. A. J. Rubin, pp. 1–76. Ann Arbor, MI: AnnArbor Sciences.
Lee, G. F., and Jones-Lee, A. 1995. Appropriate use of numeric chemical concentration-based waterquality criteria. Hum. Ecol. Risk Assess. 1:5–11.
Lee, R. E. 1999. Phycology. Cambridge, UK: Cambridge University Press.Lee, R. F. 1992. Models, muddles, and mud: Predicting bioaccumulation of sediment-associated con-
taminants. In Sediment quality assessment, ed. G. A. Burton, Jr., pp. 267–291. Boca Raton, FL:Lewis Press.
Leopold, L. B. 1977. A reference for rivers. Geology 5:429–430.Li, J., and McAteer, P. 2000. Urban oil spills as a non-point pollution source in the Golden Horshoe
of southern Ontario. Water Qual. Res. J. Can. 35:331–340.Lippman, M. 1989. Health benefits of air pollution control: A discussion. Congressional Research
Service (CRS) Report for Congress. Washington, DC: Library of Congress.Long, E. R., Field, L. J., and MacDonald, D. D. 1998. Predicting toxicity in marine sediments with
numerical sediment quality guidelines. Environ. Toxicol. Chem. 17:714–727.Majewski, M. S., and Capell, P. D. 1995. Pesticides in the atmosphere: Distribution, trends, and gov-
erning factors. Pesticides in the Hydologic System Series vol. 1. Chelsea, MI: Ann Arbor Press.Malmquist, P. A. 1983. Urban stormwater pollutant sources. Gothenburg: Chalmers University of
Technology.Manitoba Environment. 1998. Manitoba rural water quality. Toxic blue-green algae. Publication 2.
www.cwra.org/branches/arts/manitoba/pub2page1.html.Marsalek, J. 1986. Toxic contaminants in urban runoff: A case study. In Urban runoff pollution, eds.
H. Torno, J. Marsalek, and M. Desbordes, pp. 39–57. Heidelberg: Springer-Verlag.Marsalek, J., and Kok, S. 1997. Stormwater management and abatement of combined sewer overflow
pollution. Water Qual. Res. J. Can. 32:1–5.Marsalek, J., and Schroeter, H. 1988. Annual loadings of toxic contaminants in urban runoff from the
Canadian Great Lakes basin. Water Pollut. Res. J. Can. 23:360–378.Marschner, H. 1986. Mineral nutrition of higher plants. London: Academic Press.Mayer, R., Snodgrass, W. J., and Morin, D. 1999. Spatial characterization of the occurrence of road
salts and their environmental concentrations as chlorides in Canadian surface waters and benthicsediments. Water Qual. Res. Can. 34:545–574.
McCrae, B. 1991. Backgrounder 91-01: The characterization and identification of potentially leach-able pesticides and area vulnerable to groundwater contamination by pesticides in Canada.Ottawa: Agriculture Canada, Food Production and Inspection Branch.
McKinley, R. S., and Arron, G. P. 1987. Distribution of 2,4-D and picloram residues in environmentalcomponents adjacent to a treated right-of-way. Department of Energy and Mines. ResearchReport OH/R-87/49/K. Ottawa, ON.
McMaster, M. E. 2001. A review of the evidence for endocrine disruption in Canadian aquaticecosystems. Water Qual. Res. J. Can. 36:215–231.
McMaster, M. E., Van der Kraak, G. J., and Munkittrick, K. R. 1996. An epidemiological evaluation ofthe biochemical basis for steroid hormonal depressions in fish exposed to industrial wastes. J.Great Lakes Res. 22:153–171.
McMaster, M. E., Van der Kraak, G. J., Portt, C. B., Munkittrick, K. R., Sibley, P. K., Smith, I. R., andDixon, D. G. 1991. Changes in hepatic mixed-function oxygenase (MFO) activity, plasmasteroid levels and age at maturity of a white sucker (Catostomus commersoni) populationexposed to a bleached kraft pulp mill effluent. Aquat. Toxicol. 21:199–218.
Mierle, G., and Ingram, R. 1991. The role of humic substances in the mobilization of mercury fromwatersheds. Water Air Soil Pollut. 56:349–358.
Miller, D. W. 1980. Waste disposal effects on groundwater: A comprehensive survey of the occur-rence and control of ground water contamination. Berkeley, CA: Premier Press.
Miller, T. G., and Mackay, W. C. 1980. The effects of hardness, alkalinity, and pH of test water onthe toxicity of copper to rainbow trout (Salmo gairdneri). Water Res. 14:129.
118 L. RITTER ET AL.

Millette, L., and Mavinic, D. S. 1988. The effect of pH adjustment on the internal corrosion rate ofcast-iron and copper water distribution pipes. Can. J. Civil Eng. 15:79–90.
Mills, C. J., Bull, R. J., Cantor, K. P., Reif, J., Hrudey, S. E., and Huston, P. 1999. Health risks of drinkingwater chlorination by-products: Report of an expert working group. Chron. Dis. Can. 19:91–102.
Miner, J. R., Humenik, F. J., and Overcash, M. R. 2000. Managing livestock wastes to preserve envi-ronmental quality. Ames: Iowa State University Press.
Moore, J., and Ramamoorthy, S. 1984. Heavy metals in natural waters. New York: Springer Verlag.Moore, D. R. J., and Elliott, B. J. 1996. Should uncertainty be quantified in human and ecological risk
assessments used for decision-making? Hum. Ecol. Risk Assess. 2:11–24.Morgan, M. G. 1993. Risk analysis and management. Sci. Am. 269:32–41.Morgan, M. G. 1998. Uncertainty analysis in risk assessment. Hum. Ecol. Risk Assess. 4:25–39.Mueller, J. G., Chapman, P. J., and Pritchard, P. H. 1989. Creosote-contaminated sites. Their poten-
tial for remediation. Environ. Sci. Technol. 23:1197–1201.Munkittrick, K. R. 2001. Assessment of the effects of endocrine disrupting substances in the Canadian
environment. Water Qual. Res. J. Can. 36:293–302.Munkittrick, K. R., McMaster, M. E., Portt, C. B., Van der Kraak, G. J., Smith, I. R., and Dixon, D. G.
1992. Changes in maturity, plasma sex steroids, hepatic MFO activity and the presence of externallesions in lake whitefish exposed to bleached kraft mill effluent. Can. J. Fish. Aquat. Sci. 49:1560–1569.
Munkittrick, K. R., Van der Kraak, G. J., McMaster, M. E., Portt, C. B., Van den Heuval, M. R., andServos, M. R. 1994. Survey of receiving-water environmental impacts associated with dischargesfrom pulp mills. 2. Gonad size, liver size, hepatic EROD activity and plasma sex steroid levelsin white sucker. Environ. Toxicol. Chem. 13:1089–1011.
Munro, I. C. 1990. Safety assessment procedures for indirect food additives: An overview. Regul.Toxicol. Pharmacol. 12:2–12.
Naiman, R. J., and Descamps, H. 1997. The ecology of interfaces. Ann. Rev. Ecol. Syst. 28:621–658.Naiman, R. J., Descamps, H., Pastor, J., and Johnston, C. A. 1988. The potential importance of
boundaries to fluvial ecosystems. J. North Am. Benthol. Soc. 7:289–306.Naiman, R. J., Magnuson, J. J., McKnight, D. M., and Stanfield, J. A. 1995. The freshwater imperative.
A research agenda. Washington, DC: Island Press.Naiman, R. J., Bilby, R. E., and Bisson, P. A. 2000. Riparian ecology and management in the Pacific
coastal rain forest. BioScience 50:996–1011.National Academy of Sciences. 1983. Risk assessment in the federal government. Washington, DC:
National Academy Press.National Atmospheric Deposition Program. 2000. Nitrogen in the nation’s rain. http://nadp.sws.uiuc.
edu.National Research Council of Canada. 1976. Effects of chromium in the canadian environment.
NRCC no. 15017. Ottawa: National Research Council Canada.National Research Council of Canada. 1978. Effects of lead in the environment—1978. NRCC no.
16736. Ottawa: National Research Council of Canada.National Research Council of Canada. 1979. Effects of cadmium in the Canadian environment. NRC
no. 16743, ISSN 0316-0114. Ottawa: National Research Council of Canada.National Research Council. 1990. The effects on populations of exposure to low levels of ionizing
radiation. Committee on the Biological Effects of Ionizing Radiation (BEIR). National Academyof Sciences. Washington, DC: National Academy Press.
National Research Council. 1993. Issues in risk assessment. Washington, DC: National Academy Press.National Research Council. 1997. Contaminated sediments in ports and waterways. Cleanup strategies
and technologies. Washington, DC: National Academy of Sciences.National Research Council. 1999. Hormonally active agents in the environment. Washington, DC:
National Academy Press.Neary, D. G., Bush, P. B., and Michael, J. L. 1993. Fate, dissipation and environmental effects of pes-
ticides in southern forests. A review of a decade of research progress. Environ. Toxicol. Chem.12:411–428.
SOURCES, PATHWAYS, AND RISKS OF CONTAMINANTS IN WATER 119

Nehlsen, W., Williams, J. E., and Lichatowich, J. A. 1991. Pacific salmon at the crossroads: Stocks ofsalmon at risk from California, Oregon, Idaho, and Washington. Fisheries 16:40–21.
Nero, A. V., Jr. 1988. Radon and its decay products in indoor air: An overview. In Radon and itsdecay products in indoor air, eds. W. Nazaroff and A. Nero, Jr., pp. 1–53. New York: JohnWiley and Sons.
Noga, E. J., Khoo, L., Stevens, J. B., Fan, Z., and Burkholder, J. M. 1996. A new ichthyotoxic dinofla-gellate: Cause of acute mortality in aquarium fishes. Vet. Rec. 133:96–97.
Nowell, L. H., Capel, P. D., and Dileanis, P. D. 1999. Pesticides in stream sediment and aquaticbiota. Distribution, trends, and governing factors. Pesticides in the Hydrologic System, vol. 4.New York: Lewis.
Nriagu, J. O. 1994. Arsenic in the environment: Part 1: Cycling and characterization. Toronto: JohnWiley & Sons.
Nriagu, J. O. 1997. Origin, long-range transport, atmospheric deposition, and associated effects ofheavy metals in the Canadian environment. Prepared for the Atmospheric Environment Service,Environment Canada. Downsview, Ontario.
Nriagu, J. O., Lawson, G., Wong, H. K. T., and Cheam, V. 1996. Dissolved trace metals in lakesSuperior, Erie, and Ontario. Environ. Sci. Technol. 30:178–187.
Nriagu, J. O., Wong, H. K. T., Lawson, G., and Daniel, P. 1998. Saturation of ecosystems with toxicmetals in Sudbury basin, Ontario. Sci. Total Environ. 223:99–118.
Oberts, G. L., Marsalek, J., and Viklander, M. 2000. Review of water quality impacts of winter opera-tion on urban drainage. Water Qual. Res. Can. 35(4):781–808.
Oke, T. R. 1978. Boundary layer climates. London: Methuen.Okkerman, P. C., Plassche, E. J., Sloof, W., Van Leeuwen, C. J., and Canton, J. H. 1991. Ecotoxico-
logical effects assessment: A comparison of several extrapolation procedures. Ecotoxicol.Environ. Safety 21:182–193.
Okkerman, P. C., van der Plassche, E. J., Emans, H. J. B., and Canton, J. H. 1993. Validation of someextrapolation methods with toxicity data derived from multiple species experiments. Ecotoxicol.Environ. Safety 25:341–359.
Olivieri, V. P. 1986. Human pathogens, disinfection, and chlorine. In Water chlorination. Chemistry,environmental impact, and health effects, vol. 5, eds. R. L. Jolley, R. J. Bull, W. P. Davis, S. Katz,M. Roberts, and V. A. Jacobs, pp. 5–18. Chelsea, MI: Lewis.
Ontario Drinking Water Surveillance Program. 2000. Reports for 1998 and 1999. www.ene.gov.on.ca/envision/dwsp9899/dwsp/htm.
Ontario Ministry of Agriculture, Food, and Rural Affairs. 1998. Factsheet: The land application ofsewage biosolids for crop production. www.gov/on.ca/OMAFRA/english/environment/facts/95-069.htm.
Ontario Ministry of Agriculture, Food, and Rural Affairs. 1998. Infosheet # 2. Water wells. www.gov/on.ca/OMAFRA/english/environment/EFP/efp2-water_wells.htm.
Ontario Ministry of the Environment. 1985. Alachlor monitoring of Ontario drinking water, May–November 1985. Report of the Water Resources Branch, Ministry of the Environment,Toronto.
Ontario Ministry of the Environment. 1987a. Pesticides in Ontario drinking water, 1985. Report of theWater Resources Branch, Ministry of the Environment, Toronto.
Ontario Ministry of the Environment. 1987b. Pesticides in Ontario drinking water, 1986. Report ofthe Water Resources Branch, Ministry of the Environment, Toronto.
Ontario Ministry of the Environment. 1988. Thirty-seven municipal water pollution control plants:pilot monitoring study. Volume 1. Interim report, and Vol. II, Appendix A. Prepared by CanviroConsultants for the Water Resources Branch of the Ontario Ministry of the Environment,Toronto.
Ontario Ministry of the Environment. 1998. Green Tips. Water wells and groundwater: Recom-mended methods for plugging abandoned water wells. Report 1M-09-98. Toronto.
Ontario Ministry of the Environment. 2000. Ontario drinking water standards. Report PIBS 4065e.Toronto.
120 L. RITTER ET AL.
Ontario Ministry of the Environment and Energy. 1990. The Ontario Ministry of the Environmentscoring system: A scoring system for assessing environmental contaminants. Ontario Ministry ofthe Environment and Energy, Hazardous Contaminants Branch, Toronto.
Oschwald, W. R. 1972. Sediment-water interactions. J. Environ. Qual. 1:360–366.Owens, J. W. 1991. The hazard assessment of pulp and paper effluents in the aquatic environment: A
review. Environ. Toxicol. Chem. 10:1511–1540.Paerl, H. W. 1993. Emerging role of atmospheric deposition in coastal eutrophication: Biogeo-
chemical and trophic perspectives. Can. J. Fish. Aquat. Sci. 50:2254–2269.Paerl, H. W., Rudek, J., and Mallin, M. A. 1990. Stimulation of phytoplankton production in coastal
waters by natural rainfall inputs: nutritional and trophic implications. Mar. Biol. 107:247–254.Pankow, J. F. 1991a. Solubility behaviors of simple mineral salts, and metal oxides, hydroxides and
oxyhydroxides. In Aquatic chemistry concepts, pp. 219–242. Chelsea, MI: Lewis.Pankow, J. F. 1991b. Solubility behavior of metal carbonates in closed systems. In Aquatic chemistry
concepts, pp. 243–278. Chelsea, MI: Lewis.Parametrix, Inc. 1995. Persistence, bioaccumulation and toxicity of metals and metal compounds.
Prepared for the International Council on Metals and the Environment, Kirkland, WA.Parker, J. T. C., Fossum, K. D., and Ingersoll, T. L. 2000. Chemical characteristics of urban storm-
water sediments and implications for environmental management, Miricopa County, Arizona.Environ. Manage. 26:99–115.
Parkhurst, B. R., Warren-Hicks, W., Cardwell, R. D., Volison, J., Etchison, T., Butcher, J. B., andCovington, S. M., 1996. Aquatic ecological risk assessment: A multi-tiered approach to riskassessment. Water Environment Research Foundation, Alexandria, VA.
Pearson, R., Hornbuckle, K., Eisenreich, S., and Swackhammer, D. 1996. PCBs in Lake Michiganwater revisited. Environ. Sci. Technol. 30:1429–1436.
Personen, M., and Anderson, T. 1992. Toxic effects of bleached and unbleached paper mill effluentsin primary cultures of rainbow trout hepatocytes. Ecotoxicol. Environ. Safety 24:63–71.
Peterjohn, W. T., and Correll, D. L. 1984. Nutrient dynamics in an agricultural watershed: Observa-tion on the role of riparian forest. Ecology 65:1466–1475.
Petersen, R. C., Jr. 1992. The RCE: A riparian, channel, and environmental inventory for smallstreams in the agricultural landscape. Freshwater Biol. 27:295–306.
Phyper, J.-D., and Ibbotson, B. 1994. The handbook of environmental compliance in Ontario, 2nd ed.Whitby, ON: McGraw-Hill Ryerson.
Pirrone, N., Keeler, G., and Nriagu, J. 1996. Regional differences in worldwide emissions of mercuryto the atmosphere. Atmos. Environ. 30(7):2981–2987.
Pirrone, N., Allegrini, I., Keeler, G. J., Nriagu, J. O., Rossmann, R., and Robbins, J. A. 1998.Historical atmospheric mercury emissions and depositions in North America compared to mer-cury accumulations in sedimentary records. Atmos. Environ. 32(5):929–940.
Postuma, L., Traas, T., and Suter, G. W. 2001. Species sensitivity distributions in risk assessment.Pensacola, FL: SETAC Press.
Power, E. A., and Chapman, P. M. 1992. Assessing sediment quality. In Sediment quality assessment,ed. G. A. Burton, Jr., pp. 1–18. Boca Raton, FL: Lewis Press.
Power, M., and McCarty, L. S. 1996. Probabilistic risk assessment: Betting on its future. Hum. Ecol.Risk Assess. 2:30–34.
Price, R. K., and Mance, G. 1978. A suspended solids model for stormwater runoff. In Urban stormdrainage, ed. P. Helliwell, pp. 546–555. London: Pentech Press.
Qasim, S. R., and Chiang, W. 1994. Sanitary landfill leachate. Generation, control, and treatment.Lancaster: Technomic.
Quinn, F. 1987. Interbasin water diversions: A Canadian perspective. J. Soil Water Conserv. 42:389–393.
Rabeni, C. F., and Smale, M. A. 1995. Effects of siltation on stream fishes and the potential mitigatingrole of the buffering riparian zone. Hydrobiologia 303:211–219.
Randall, L., Han, J. S., and Weber, J. H. 1986. Determination of inorganic tin, methyltin and butyltincompounds in sediments. Environ. Technol. Lett. 7:571–576.
SOURCES, PATHWAYS, AND RISKS OF CONTAMINANTS IN WATER 121

Rapport, D. J. 1989. What constitutes ecosystem health? Perspect. Biol. Med. 33:120–133.Rasmussen, P. E. 1998. Long-range atmospheric transport of trace metals: The need for geoscience
perspectives. Environ. Geol. 33:96–108.Reilly, M. 2001. Land application of waste residues (biosolids). Report to the Walkerton Commission,
January. www.walkertoninquiry.com.Reynoldson, T. B., Norris, R. H., Resh, V. H., Day, K. E., and Rosenberg, D. M. 1997. The reference
condition approach: a comparison of multiple and multivariate approaches to assess water-qual-ity impairment using benthic macroinvertebrates. J. North Am. Benthol. Soc. 16:833–852.
Richards, C., Host, G. E., and Arthur, J. W. 1993. Identification of predominant environmental factorsstructuring stream macroinvertebrate communities within a large agricultural catchment. Fresh-water Biol. 29:285–294.
Richardson, C. 1999. Plenary session presentation: Ecological functions of wetlands in the landscape.In Ecotoxicology and risk assessment for wetlands, eds. M. A. Lewis, F. L. Mayer, R. L. Powell,M. K. Nelson, S. J. Klaine, M. G. Henry, and G. W. Dickson, pp. 9–25. Spec. Publ. Soc. Environ.Toxicol. Chem. Pensacola, FL: SETAC Press.
Richardson, G. M. 1996. Deterministic versus probabilistic risk assessment: Strengths and weaknessesin a regulatory context. Hum. Ecol. Risk Assess. 2:44–54.
Ripley, B., Arbuckle, T., Ritter, L., and Archibald, B. 1998. The contribution of well water to overallfarm family pesticide exposure. Toxicol. Sci. 42:767.
Ritter, W. F. 1988. Reducing impacts of nonpoint source pollution from agriculture: A review. J.Environ. Sci. Health A23:645–667.
Roberts, S. M. 1999. Practical issues in the use of probabilistic risk assessment. Hum. Ecol. RiskAssess. 5:729–736.
Rodgers, J. H., Jr., Dickson, G. W., Dillon, T., Dorn, P. B., Farmer, J. E., Gearheart, R. A., Hall, J. F.,McFarland, B., Nelson, M. K., Nix, P., Richardson, C. J., and Tiernay, D. P. 1999. Workgroup Vsynopsis: Constructed wetlands as a risk mitigation alternative. In Ecotoxicology and risk assess-ment for wetlands, eds. M. A. Lewis, F. L. Mayer, R. L. Powell, M. K. Nelson, S. J. Klaine, M. G.Henry, and G. W. Dickson, pp. 315–342. Spec. Publ. Soc. Environ. Toxicol. Chem. Pensacola,FL: SETAC Press.
Rudolph, D. L., and Goss, M. J. 1993. The Ontario farm groundwater survey—Summer 1992. Reportto Agriculture Canada under the Federal–Provincial Environmental Sustainability Initiative. June,Guelph, ON.
Rudolph, D. L., Barry, D. A. J., and Goss, M. J. 1998. Contamination in Ontario farmstead domesticwells and its association with agriculture. 2. Results from multilevel monitoring well installa-tions. J. Contam. Hydrol. 32:295–311.
Sang, S., and Lourie, B. 1995. Mercury in Ontario: an inventory of sources, use and releases. InProceedings of the 1995 Canadian Mercury Network Workshop. Report of a workshop held on29–30 September 1995 at York University, Toronto.
Schaeffer, D. J., Herricks, E. E., and Kerster, H. W. 1988. Ecosystem health 1. Measuring ecosystemhealth. Environ. Manage. 12:445–455.
Schroeder, J. E., and Solomon, K. R. 1998. Impact of road salt on an urban watershed. In Abstracts19th annual meeting of the Society of Environmental Toxicology and Chemistry (SETAC), Char-lotte, NC. Abstr. PTA193.
Schroeter, H. O. 1997. Toxic contaminant loadings from municipal sources in Ontario areas of con-cern. Water Qual. Res. J. Can. 32:7–22.
Schultz, R., and Liess, M. 1999. A field study of the effects of agriculturally-derived insecticide inputon stream macroinvertebrate dynamics. Aquat. Toxiol. 46:155–176.
Scott, W. S. 1980. Road salt movement into two Toronto streams. J. Environ. Eng. Div. EE3:547–560.Scrimgeour, G. J. 1989. Effects of bleached kraft mill effluent on macroinvertebrate and fish populations
in weedbeds in a New Zealand hydro-electric lake. N. Z. J. Mar. Freshwater Res. 23:373–379.Servos, M. R. 1999. Review of the aquatic toxicity, estrogenic responses and bioaccumulation of
alkylphenols and alkylphenol polyethoxylates. Water Qual. Res. J. Can. 34:123–177.
122 L. RITTER ET AL.

SETAC. 1994. Society for Environmental Toxicology and Chemistry. Pesticide risk and mitigation.Final report of the Aquatic Risk Assessment and Mitigation Dialog Group. Pensacola, FL: SETACFoundation for Environmental Education.
Seyfried, P., and Joy, D. 1995. Pathogenic viruses in septic systems and their removal. In Alternativesystems: Nutrient removal and pathogenic microbes, pp. 5–15. Conference proceedings, Water-loo, ON.
Shah, K. L. 2000. Basics of solid and hazardous waste management technology. Columbus, OH:Prentice Hall.
Sheppard, S. C. 1998. Geophagy: who eats soil and where do possible contaminants go? Environ.Geol. 33:109–114.
Sibley, P. K., Benoit, D. A., Ankley, G. T., Balcer, M. K., West, C. Phipps, G. L., and Hoke, R. A.1999. An exposure apparatus for the in situ assessment of sediment toxicity and bioaccumula-tion. Environ. Toxicol. Chem. 18:2325–2336.
Sibley, P. K., Dixon, D. G., and Barton, D. R. 2000. Impact of bleached kraft mill effluent on benthiccommunity structure in relation to environmental factors. J. Aquat. Ecosys. Stress Recov. 7:256–269.
Silbergeld, E. K., Grattan, L., Oldach, D., and Morris, J. G. 2000. Pfiesteria: Harmful algal blooms asindicators of human:ecosystem interactions. Environ. Res. 82:97–105.
Singer, P. C. 1974. Trace metals and metal–organic interactions in natural waters. Ann Arbor, MI:Ann Arbor Science.
Slovic, P. 1980. Societal risk assessment; How safe is safe enough, eds. R. Schuring and W. A. J.Albors, pp. 181–216. New York: Plenum Press.
Slovic, P. 1987. Perception of risk. Science 236:280–285.Smeet, J. M. W., van Holstein, I., Giesy, J. P., Seinen, W., van den Berg, M. 1999. Estrogenic potencies
of several environmental pollutants, as determined by vitellogenin induction in carp hepatocyteassay. Toxicol. Sci. 50:206–213.
Smith, R. L. 1980. Ecology and field biology. New York: Harper Collins.Smith, J. D., and Hamilton, T. E. 1992. Trace metal fluxes to lake sediments in south-eastern
Australia. Sci. Total Environ. 125:227–233.Snoeyink, V. L., and Jenkins, D. 1980. Oxidation–reduction reactions. In Water chemistry, pp. 316–
430. Toronto: John Wiley and Sons.Solomon, K. R. 1996. Overview of recent developments in ecotoxicological risk assessment. Risk
Anal. 16:627–633.Solomon, K. R. 1999. Integrating environmental fate and effects information: The keys to ecotoxico-
logical risk assessment for pesticides. In Pesticide chemistry and bioscience: The food-environ-ment challenge, eds. G. T. Brooks and T. R. Roberts, pp. 313–326. London: Royal Society ofChemistry.
Solomon, K. R., Baker, D. B., Richards, P., Dixon, K. R., Klaine, S. J., La Point, T. W., Kendall, R. J.,Giddings, J. M., Giesy, J. P., Hall, L. W. J., Weisskopf, C., and Williams, M. 1996. Ecologicalrisk assessment of atrazine in North American surface waters. Environ. Toxicol. Chem. 15:31–76.
Stan, H. J., Heberer, T., and Linkerhagner, M. 1994. Occurrence of clofibric acid in the aquatic sys-tem—Is the use in human medical care the source of the contamination of surface, ground, anddrinking water? Vom Wasser 83:57–68.
Standley, L. J., and Bott, T. L. 2001. Appropriate role for biology in establishing sediment quality cri-teria. SETAC Globe 2(2):29–30.
Statistics Canada. 1994. Human activity and the environment 1994. Ottawa.Statistics Canada. 2000. Human activity and the environment 2000. Catalogue No. 11-509-XPE.
Ottawa: Industry Canada.Stephan, C. E., Mount, D. I., Hansen, D. J., Gentile, J. H., Chapman, G. A., and Brungs, W. A. 1985.
Guidelines for deriving numerical national water quality criteria for the protection of aquaticorganisms and their uses, pp. 1–97. Duluth, MN: U.S. EPA ORD ERL.
SOURCES, PATHWAYS, AND RISKS OF CONTAMINANTS IN WATER 123

Stevens, A. A., Moore, L. A., and Miltner, R. J. 1989. Formation and control of non-trihalomethanedisinfection by-products. Am. Water Works Assoc. 81:54–60.
Strachan, W. M. J. 1987. Development needs for Canada’s national water quality guidelines. WaterPollut. Res. J. Can. 22:280–288.
Struger, J., Martos, P., Ripley, B., and Gris, G. 2000. Pesticide concentrations in urban aquatic envi-ronments of Ontario, Canada. In SETAC 21st annual meeting abstract book, abst. PHA129.
Stumpf, M., Ternes, T. A., Wilken, R.-D., Rodrigues, S. V., and Baumann, W. 1999. Polar drug residuesin sewage and natural waters in the state of Rio de Janeiro, Brazil. Sci. Total Environ. 225:135–141.
Suntio, L. R., Shiu, W. Y., and MacKay, D. 1988. A review of the nature and properties of chemicalspresent in pulp mill effluents. Chemosphere 17:1249–1290.
Suter, G. W. 1993. A critique of ecosystem health concepts and indices. Environ. Toxicol. Chem. 12:1533–1539.
Suter, G. W., Barnthouse, L. W., Bartell, S. M., Mill, T., Mackay, D., and Patterson, S. 1993. Ecologicalrisk assessment. Boca Raton, FL: Lewis.
Svanberg, O., and Bengtsson, B.-E. 1996. Impact of bleached pulp mill effluents on the aquatic envi-ronment (The Swedish Environment/Cellulose Project)—a case study. Res. Conserv. Recyc. 16:189–199.
Swaigen, J. 1995. Toxic time bombs. The regulation of Canada’s leaking underground storage tanks.Canadian Institute of Environmental Law and Policy. Toronto, ON: Edmond Montgomery.
Tana, J., Rosemarin, A., Lehtinen, K.-J., Hardig, J., Grahn, O., and Landner, L. 1994. Assessingimpacts on Baltic coastal ecosystems with mesocosm and fish biomarker tests: A comparison ofnew and old wood pulp bleaching technologies. Sci. Total Environ. 145:213–234.
Tang, E. P. Y., Tremblay, R., and Vincent, W. F. 1997. Cyanobacterial dominance of polar freshwaterecosystems: Are high-altitude mat-formers adapted to low temperature? J. Phycol. 33:171–181.
Tessier, A., Campbell, P. G., and Bisson, M. 1979. Sequential extraction procedure for the speciationof particulate trace metals. Anal. Chem. 51:844–851.
Tessier, A., Carignan, R. C., and Belzile, N. 1994. Processes occurring at the sediment–water inter-face: Emphasis on trace elements. In Chemical and biological regulation of aquatic systems, eds.J. Buffle and R. R. Devitre, pp. 137–173. Boca Raton, FL: CRC Press.
Thomas, N. A. 1994. EPA/ORD role and perspective in sediment research. In Transport and transfor-mation of contaminants near the sediment–water interface, eds. J. V. DePinto, W. Lick, and J. F.Paul, pp. 7–16. Boca Raton, FL: CRC Press.
Thurman, E. M., and Cromwell, A. E. 2000. Atmospheric transport, deposition, and fate of triazineherbicides and their metabolites in pristine areas at Isle Royale National Park. Environ. Sci.Technol. 34:3079–3085.
Thurman, E. M., Gooslby, D. A., Meyer, M. T., and Kolpin, D. W. 1991. Herbicides in surface waters ofthe Midwestern United States: The effect of the spring flush. Environ. Sci. Technol. 25:1794–1796.
Tobin, G. A., and Rajagopal, R. 1990. Expert opinion and groundwater quality: The case of agricul-tural drainage wells. J. Soil Wat. Conserv. 45:341–336.
Travis, C. C., and Nixon, A. G. 1996. Human exposure to dioxin. In Chlorinated organic micropollu-tants, eds. R. E. Hester and R. M. Harrison, vol. 6, pp. 17–30. Royal Society of Chemistry, Issuesin Environmental Science and Technology. Herts, UK.
United Nations Environmental Program. 1999. UNEP chemicals: Status report on POPs. UnitedNations Environmental Programme. http://irptc.uhep.ch/pops/statrep/jun99/pdf/report1.pdf.
U.S. Environmental Protection Agency. 1988. U.S. EPA/paper industry cooperative dioxin screeningstudy. Washington, DC: Office of Water, Regulations, and Standards. EPA-440/1-88-025.
U.S. Environmental Protection Agency. 1990. The quality of our nation’s water: A summary of the1988 National Water Quality Inventory. Washington, DC: U.S. EPA report 440/4-90-005.
U.S. Environmental Protection Agency. 1992. Framework for ecological risk assessment. Washington,DC: U.S. EPA.
U.S. Environmental Protection Agency. 1995. Final water quality guidance for Great Lakes System.Fed. Reg. March 23:15366–15425
U.S. Environmental Protection Agency. 1997a. Deposition of air pollutants to the Great waters:
124 L. RITTER ET AL.

Second report to Congress. Washington, DC: Office of Air Quality Planning and Standards. EPA453/R-97-011.
U.S. Environmental Protection Agency. 1997b. Mercury study report to Congress (Volumes I–VIII).Washington, DC: Office of Air Quality Planning and Standards and Office of Research andDevelopment. EPA-452/R-97-005.
U.S. Environmental Protection Agency. 1998a. National water quality inventory: 1998 Report toCongress. Washington, DC: Office of Water. www.epa.gov/305b/98report/toc/html.
U.S. Environmental Protection Agency. 1998b. National water quality inventory: 1998 report toCongress. Appendix IV. Environmental impacts of animal feedlot operations. Washington, DC:Office of Water. www.epa.gov.305b/98report/toc/html.
U.S. Environmental Protection Agency. 1998c. Guidelines for ecological risk assessment. RiskAssessment Forum, U.S. Environmental Protection Agency, Washington, DC.
U.S. Environmental Protection Agency. 2000a. Chlorpyrifos revised risk assessment and agreementwith registrants. Prevention, Pesticides, and Toxic Substances (7506C). www.epa.gov/pesticides.
U.S. Environmental Protection Agency. 2000b. Site remediation technology InfoBase: A guide tofederal programs, information, resources, and publications on contaminated site cleanup tech-nologies. Report No. EPA 542-B-00-005. Washington, DC: U.S. EPA.
U.S. Office of Technology Assessment. 1984. Protecting the nations groundwater from contamina-tion. Vol. 1 and 2. Office of Technology Assessment. Reports OTA-0-233 and OTA-0-276. Wash-ington, DC.
Urban, D. J., and Cook, N. J. 1986. Standard evaluation procedure for ecological risk assessment.Washington, DC: Hazard Evaluation Division, Office of Pesticide Programs, U.S. EnvironmentalProtection Agency.
van Lanen, H. A. J., and Dijksma, R. 1999. Water flow and nitrate transport to a groundwater-fedstream in the Belgian–Dutch chalk region. Hydrol. Proc. 13:295–307.
Van Straalen, N. M., and Denneman, C. A. J. 1989. Ecotoxicological evaluation of soil quality criteria.Ecotoxicol. Environ. Safety 18:241–251.
Wagner, C., and Løkke, H. 1991. Estimation of ecotoxicological protection levels from NOEC toxicitydata. Water Res. 25:1237–1242.
Waller, D. H., and Hart, W. C. 1986. Solids, nutrients, and chlorides in urban runoff. In Urban runoffpollution, eds. H. Torno, J. Marsalek, and M. Desbordes, pp. 59–85. Heidelberg: Springer-Verlag.
Waller, D. H., and Novak, Z. 1980. Pollution loadings to the Great Lakes from municipal sources inOntario. J. Water Pollut. Control Fed. 52:387–395.
Wania, F., and Mackay, D. 1993. Global fractionation and cold condensation of low volatilityorganochlorine compounds in polar regions. Ambio 22:10–18.
Warren-Hicks, W. J., and Moore, D. R. J. 1998. Uncertainty analysis in ecological risk assessment.Pensacola, FL: SETAC Press.
Waters, T. F. 1995. Sediment in streams: Sources, biological effects, and control. American FisheriesSociety Monograph no. 7. Bethesda, MD.
Watson, V. J., Rice, P. M., and Monning, E. C. 1989. Environmental fate of picloram used for road-side weed control. J. Environ. Qual. 18:198–205.
Wickstrom, L. H., and Baranoski, M. T. 2000. Industrial waste disposal wells in Ohio. Ohio Divisionof Geological Survey. www.dnr.state.oh.su.
Wilber, W. G., and Hunter, J. V. 1979. The impact of urbanization on the distribution of heavymetals in bottom sediments of the Saddle River. Water Res. Bull. 15:790–800.
Williams, S. L., Aulenbach, D. B., and Clesceri, N. L. 1976. Sources and distribution of trace metalsin aquatic environments. In Aqueous environmental chemistry of metals, ed. A. J. Rubin, pp.77–127. Ann Arbor, MI: Ann Arbor Science.
World Health Organization. 1984. Fluorine and fluorides. Environmental Health Criteria 36. Geneva:WHO.
World Health Organization. 1993. Guidelines for drinking-water quality, 2nd ed., vol. 1. Recom-mendations, pp. 174–178. Geneva: WHO.
World Health Organization. 1996. Guidelines for drinking-water quality, vol. 1. Recommendations,2nd ed. Geneva: WHO.
SOURCES, PATHWAYS, AND RISKS OF CONTAMINANTS IN WATER 125

126 L. RITTER ET AL.
TABLE A1. Chemicals That Have Been Detected in Drinking Water in Ontario, Their PrioritySubstance List (PSL) Designation, and Status Regarding Human Health Concerns
CEPA Humanpriority healthpollutant? concern?
Chemical Class Description of use/origin (PSL1/2)a (yes/no)
Alachlor Pesticide (OC) Herbicide used mainly on corn Yesand soybeans to control the growth of weeds.
Aldrin Pesticide (OC) A pesticide used to control soil Yesinsects.
Aluminum Metal(I) Found naturally in the form of PSL 2 Novery fine particles of aluminosilicate clay.
Arsenic Metal(I) Arsenic is sometimes found at Yeshigher levels in groundwater in hard rock areas in Ontario through the dissolution of arsenic containing minerals, in some mine drainage waters and in some mine waste leachates.
Atrazine Pesticide A triazine pesticide used mainly as Yesa preemergent herbicide on corn for annual grass control.
Azinphos-methyl Pesticide A broad-spectrum insecticide used Yesagainst foliage-feeding insects.
Barium Metal(I) Barium is a common constituent Yesin sedimentary rocks such as limestone and dolomite.
Bendiocarb Pesticide Bendiocarb is a carbamate Yesinsecticide used to control specific insects in buildings and greenhouses.
Benzene Organic Benzene is present in small PSL 1 Yesamounts in gasoline and other refined petroleum products. Benzene is reported to occur in vehicle emissions and cigarette smoke. Drinking water is not considered a significant source of benzene because of its objectionable taste and odor in water.
Benzo[a]pyrene Organic Formed during the incomplete Yesburning of organic matter and is found in poorly adjusted diesel exhaust and in coal/coking tar.

SOURCES, PATHWAYS, AND RISKS OF CONTAMINANTS IN WATER 127
TABLE A1. Chemicals That Have Been Detected in Drinking Water in Ontario, Their PrioritySubstance List (PSL) Designation, and Status Regarding Human Health Concerns (Continued)
CEPA Humanpriority healthpollutant? concern?
Chemical Class Description of use/origin (PSL1/2)a (yes/no)
Boron (borate) Inorganic Acute boron poisonings have Yesresulted from the use of borates as antiseptic agents and from accidental ingestion; however, the consumed amounts were much higher than would be encountered through drinking water.
Bromoxynil Pesticide Herbicide used in Ontario for Yesthe control of specific weed seedlings in grain crops.
Cadmium Metal(I) Cadmium is a relatively rare PSL1 Yeselement that is extremely unlikely to be present as a significant natural contaminant in drinking water. Cadmium compounds used in electroplated materials and electroplating wastes may be a significant source of drinking-water contamination.
Carbaryl Pesticide Carbaryl is a commonly used Yesbroad-spectrum carbamate insecticide used in agriculture and forestry for control of foliar pests and as a home and garden product for specific garden and lawn pests. It is also used for the control of parasites on livestock and pets.
Carbofuran Pesticide It is a broad-spectrum Yescarbamate insecticide used in agriculture for control of foliar pests.
Carbon tetrachloride Organic Carbon tetrachloride is likely Yesto be found only in ground water from old industrial sites where chlorinated solvents were made or used.
(Table continues on next page)

128 L. RITTER ET AL.
TABLE A1. Chemicals That Have Been Detected in Drinking Water in Ontario, Their PrioritySubstance List (PSL) Designation, and Status Regarding Human Health Concerns (Continued)
CEPA Humanpriority healthpollutant? concern?
Chemical Class Description of use/origin (PSL1/2)a (yes/no)
Chloramines Organic Chloramines are produced when PSL2 Yesammonia is added to chlorinated water during the disinfection process. Chlor-amine is a weak disinfectant that usually results in lower levels of trihalomethanes and other chlorination by-products in the drinking water.
Chlordane Pesticide (OC) Chlordane is an organochlorine Yesinsecticide that was once used extensively in agriculture as a soil insecticide and for domestic control of cockroaches, ants, and termites. Chlordane is very persistent in soil. Chlordane was banned in Ontario in 1994.
Chloride Inorganic Chloride is a common non-toxic No material present in small amounts in drinking water and produces a detectable salty taste. Chloride is widely distributed in nature, generally as the sodium (NaCl), potassium (KCl), and calcium (CaCl2) salts.
Chloroform Organic A common by-product of water PSL2 Yesdisinfection using chlorination.
Chlorpyrifos Pesticide Common organophosphate Yesinsecticide used for the control of insects on agricultural crops, domestic use, and for flea and tick control.
Chromium Metal(I) Trivalent chromium, the most Yescommon and naturally occurring state of chromium, is not considered to be toxic. However, chromium present in untreated water may be oxidized to a harmful hexavalent form during chlorination. Chromium in the more highly oxidized form may be present in older yellow paints and in residues from plating operations and around old recirculating water-cooling systems.

SOURCES, PATHWAYS, AND RISKS OF CONTAMINANTS IN WATER 129
TABLE A1. Chemicals That Have Been Detected in Drinking Water in Ontario, Their PrioritySubstance List (PSL) Designation, and Status Regarding Human Health Concerns (Continued)
CEPA Humanpriority healthpollutant? concern?
Chemical Class Description of use/origin (PSL1/2)a (yes/no)
Copper Metal(I) Copper occurs naturally in the Noenvironment, but is rarely found in untreated water. Copper is used extensively in domestic plumbing, in tubing and fittings, and is an essential component of food. Drinking water has the potential to be corrosive and to cause copper to dissolve in water.
Cyanazine Pesticide A triazine herbicide registered Yesfor control of weeds in crop and noncrop areas.
Cyanide Inorganic Widely used in metals plating Yesand refining industries, and industrial effluents are the major potential sources of cyanide contamination.
Diazinon Pesticide An organophosphate insecticide Yesused to control foliar and soil pests. Also used to control flies in barns, ants, and cockroaches.
Dicamba Pesticide A benzoic acid herbicide that is Yesused for control of broadleaf weeds in grains, corn, flax,sorghum, pastures, and weed control in lawns.
1,2-Dichlorobenzene Organic Used in a variety of specialty PSL1 Yeschemical blends (e.g., degreasing agents, imported dye carriers).
1,4-Dichlorobenzene Organic A persistent synthetic material PSL1 Yeswith a strong “medicinal” smell. It has been used widely in toilet pucks and mothballs.
1,2-Dichloroethane Organic Used principally as a starting PSL1 Yesmaterial for vinyl chloride production, as a solvent and a fumigant. It is released into the environment via atmospheric emissions and the discharge of industrial wastewaters .
(Table continues on next page)
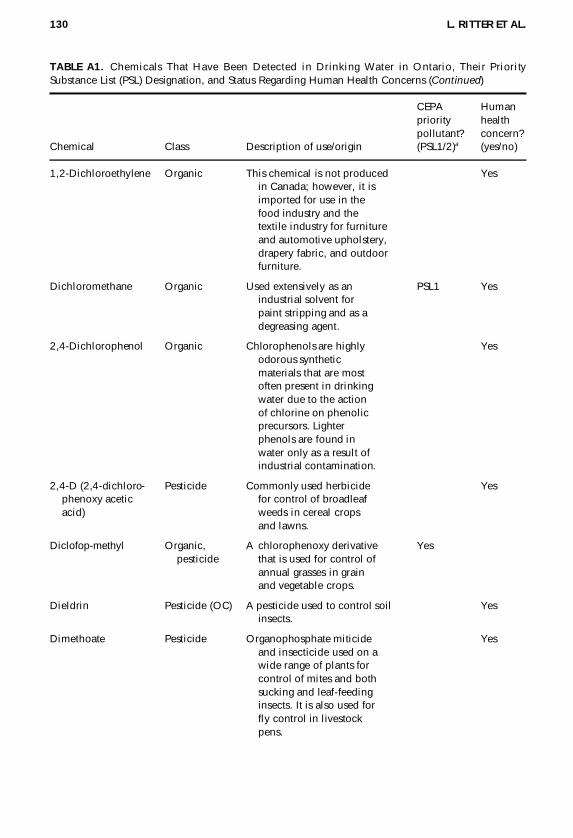
130 L. RITTER ET AL.
TABLE A1. Chemicals That Have Been Detected in Drinking Water in Ontario, Their PrioritySubstance List (PSL) Designation, and Status Regarding Human Health Concerns (Continued)
CEPA Humanpriority healthpollutant? concern?
Chemical Class Description of use/origin (PSL1/2)a (yes/no)
1,2-Dichloroethylene Organic This chemical is not produced Yesin Canada; however, it is imported for use in the food industry and the textile industry for furniture and automotive upholstery, drapery fabric, and outdoor furniture.
Dichloromethane Organic Used extensively as an PSL1 Yesindustrial solvent for paint stripping and as a degreasing agent.
2,4-Dichlorophenol Organic Chlorophenols are highly Yesodorous synthetic materials that are most often present in drinking water due to the action of chlorine on phenolic precursors. Lighter phenols are found in water only as a result of industrial contamination.
2,4-D (2,4-dichloro- Pesticide Commonly used herbicide Yesphenoxy acetic for control of broadleaf acid) weeds in cereal crops
and lawns.
Diclofop-methyl Organic, A chlorophenoxy derivative Yespesticide that is used for control of
annual grasses in grain and vegetable crops.
Dieldrin Pesticide (OC) A pesticide used to control soil Yesinsects.
Dimethoate Pesticide Organophosphate miticide Yesand insecticide used on a wide range of plants for control of mites and both sucking and leaf-feeding insects. It is also used for fly control in livestock pens.

SOURCES, PATHWAYS, AND RISKS OF CONTAMINANTS IN WATER 131
TABLE A1. Chemicals That Have Been Detected in Drinking Water in Ontario, Their PrioritySubstance List (PSL) Designation, and Status Regarding Human Health Concerns (Continued)
CEPA Humanpriority healthpollutant? concern?
Chemical Class Description of use/origin (PSL1/2)a (yes/no)
Dioxins Organic (OC) Dioxins are formed in very PSL1 Yessmall amounts in combustion processes, particularly combustion of chlorine containing materials such as scrap tires and, potentially, in some poorly controlled industrial processes such as bleached paper manufacturing.
Diquat Pesticide Herbicide used primarily as a Yescrop desiccant in seed crops and as an aquatic herbicide.
Diuron Pesticide A substituted urea-based Yesherbicide used for the control of vegetation in crop and noncrop areas, including sites and rights-of-way.
Ethylbenzene Organic A component of gasoline Noadditives used for octane rating boosting. It is also used in solvent-based paint formulations.
Fluoride Inorganic Where fluoride is added to PSL2 Yesdrinking water, it is recommended that the concentration be adjusted to the optimum level for control of tooth decay to prevent excessive human exposure.
Glyphosate Pesticide Broad-spectrum, nonselective Yesherbicide used for weed control on rights-of-way, forestry plantations, and in-site preparations for planting of crops, as well as for domestic control of plants.
(Table continues on next page)

132 L. RITTER ET AL.
TABLE A1. Chemicals That Have Been Detected in Drinking Water in Ontario, Their PrioritySubstance List (PSL) Designation, and Status Regarding Human Health Concerns (Continued)
CEPA Humanpriority healthpollutant? concern?
Chemical Class Description of use/origin (PSL1/2)a (yes/no)
Hardness (caused Inorganic Hardness is caused by dissolved Noby dissolved calcium and magnesium, and calcium and is expressed as the equivalent magnesium) quantity of calcium carbonate.
On heating, hard water has a tendency to form scale deposits and can form excessive scum with regular soaps. However, certain detergents are largely unaffected by hardness.
Iron Metal(I) Iron may be present in ground- Nowater as a result of mineral deposits and chemically reducing underground condi-tions. It may also be present in surface waters as a result of anaerobic decay in sediments and complex formation.
Lead Metal(I) Lead is only present in drinking Yeswater as a result of corrosion of lead solder, lead-containing brass fittings, or lead pipes, which are found close to or in domestic plumbing and the service connection to buildings.
Lindane Pesticide (OC) Organochlorine insecticide used Yesin seed treatment; may also be used in pharmaceutical preparations of human lice and mite shampoos.
Malathion Pesticide Broad-spectrum organophosphate Yesinsecticide used on fruits and vegetables, as well as for mosquito, fly, and tick control.
Manganese Metal(I) Present in some groundwaters Nobecause of reducing conditions underground, coupled with the presence of manganese mineral deposits. Manganese also occasionally present, seasonally, in surface waters when anaerobic decay processes in sediments are occurring.

SOURCES, PATHWAYS, AND RISKS OF CONTAMINANTS IN WATER 133
TABLE A1. Chemicals That Have Been Detected in Drinking Water in Ontario, Their PrioritySubstance List (PSL) Designation, and Status Regarding Human Health Concerns (Continued)
CEPA Humanpriority healthpollutant? concern?
Chemical Class Description of use/origin (PSL1/2)a (yes/no)
Mercury Metal(0) Sources of mercury in drinking Yeswater include air pollution from coal combustion, waste incineration, and from metal refining operations and from natural mineral deposits in some hard rock areas. Food is the major source of human exposure to mercury, with freshwater fish being the most significant local source.
Methane Organic Occurs naturally in some Nogroundwater and acts as a stimulant for microbiological fouling in the water distribution system. If methane is allowed to accumulate in confined areas, the potential for explosive combustion exists.
Methoxychlor Pesticide (OC) An organochlorine insecticide. YesIt is nonaccumulative in biological tissues, making it an attractive insecticide for use on products nearing harvest, in dairy barns for housefly control, and as either a larvicide or adulticide against black flies and mosquitoes.
Metolachlor Pesticide A selective herbicide used for Yespreemergence and preplant broadleaf weed control in corn, soybeans, peanuts, grain sorghum, pod crops, woody ornamentals, and sunflowers.
Metribuzin Pesticide Triazine herbicide used for Yesthe control of broadleaf weeds and grasses infesting agricultural crops. It is used selectively on soybeans and potatoes, all crops that are highly sensitive to most other triazine herbicides.
(Table continues on next page)

134 L. RITTER ET AL.
TABLE A1. Chemicals That Have Been Detected in Drinking Water in Ontario, Their PrioritySubstance List (PSL) Designation, and Status Regarding Human Health Concerns (Continued)
CEPA Humanpriority healthpollutant? concern?
Chemical Class Description of use/origin (PSL1/2)a (yes/no)
Monochloro- Organic Used in the production of PSL1 Yesbenzene chloronitrobenzene and (chloro- diphenyl ether, as a rubber benzene) intermediate, and as a
solvent in adhesives, paints, waxes, polishes, and inert solvents. Also used in metal-cleaning operations and may be present in industrial discharges.
Nitrate Inorganic Present in water (particularly Yesgroundwater) as a result of decay of plant or animal material, the use of agricultural fertilizers, domestic sewage or treated wastewater contamination, or geological formations containing soluble nitrogen compounds.
Nitrite Inorganic Rapidly oxidized to nitrate and is Yestherefore seldom present in surface waters in significant concentrations. Nitrite may occur in groundwater sources; however, if chlorination is practiced the nitrite will usually be oxidized to nitrate.
NTA (nitrilotriacetic Organic NTA is mainly used in laundry Yesacid) detergents, most of which is
eventually disposed of in domestic wastewater.
NDMA (N-nitroso- Organic NDMA is used industrially but PSL2 Yesdimethylamine) has been used as an
antioxidant, as an additive for lubricants, and as a softener of copolymers. It has been detected in some foods, particularly smoked foods, and very occasionally in treated river/lake water in heavily farmed locations.

SOURCES, PATHWAYS, AND RISKS OF CONTAMINANTS IN WATER 135
TABLE A1. Chemicals That Have Been Detected in Drinking Water in Ontario, Their PrioritySubstance List (PSL) Designation, and Status Regarding Human Health Concerns (Continued)
CEPA Humanpriority healthpollutant? concern?
Chemical Class Description of use/origin (PSL1/2)a (yes/no)
Paraquat Pesticide Highly toxic herbicide used as Yesa contact herbicide and for desiccation of seed crops. It is also used for noncrop and industrial weed control.
Parathion Pesticide Broad-spectrum, organophos- Yesphate insecticide used in agriculture against foliar pests and adult stage of root maggots.
Pentachlorophenol Organic (OC) Rarely found in commercial Yesuse today but was used extensively as a pesticide and wood preservative. It is the most environmentally persistent of the chlorophenols.
Phorate Pesticide An organophosphate insecticide Yesused for control of sucking insects, larvae of the corn rootworm and leaf-eating beetles.
Picloram Pesticide A phenoxyalkanoic acid Yesherbicide used for broadleaf weed and brush control on right-of-ways and roadsides.
Polychlorinated Organic (OC) Among the most ubiquitous PSL1 Yesbiphenyls and persistent pollutants in (PCBs) the global ecosystem. In the
past, PCBs have been marketed extensively for a wide variety of purposes but are no longer manufactured or used.
Prometryne Pesticide Herbicide used to selectively Yescontrol annual grasses and broadleaf weeds in crops and noncrops.
(Table continues on next page)

136 L. RITTER ET AL.
TABLE A1. Chemicals That Have Been Detected in Drinking Water in Ontario, Their PrioritySubstance List (PSL) Designation, and Status Regarding Human Health Concerns (Continued)
CEPA Humanpriority healthpollutant? concern?
Chemical Class Description of use/origin (PSL1/2)a (yes/no)
Selenium Metal(I) Occurs naturally in waters at Yestrace levels as a result of geochemical processes such as weathering of rocks. Food is the main source of selenium intake other than occupational exposure. Selenium is an essential trace element in the human diet.
Simazine Pesticide A triazine herbicide used for pre- Yesemergence weed control in annual row crops. Simazine is least soluble of all triazines and is easily leached to groundwater, where it may persist for years.
Sodium Inorganic Sodium is not toxic. The average Nointake of sodium from water is only a small fraction of that consumed in a normal diet. Softening using a domestic water softener increases the sodium level in drinking water and may contribute a significant percentage to the daily sodium intake for a person on a sodium restricted diet.
Sulfate Inorganic High levels of sulfate may be Noassociated with calcium, which is a major component of scale boilers and heat exchangers. In addition, sulfate can be converted into sulfide by some anaerobic bacteria, creating odor problems and potentially greatly accelerating corrosion.
Sulfide Inorganic Sulfide is undesirable in water supplies Nomainly because, in association with iron, it produces black stains on laundered items and black deposits on pipes and fixtures.
Temephos Pesticide Organophosphate insecticide used to Yescontrol mosquito and black-fly larvae.
Terbufos Pesticide Terbufos is an organophosphate Yesinsecticide used for insect control in corn.

SOURCES, PATHWAYS, AND RISKS OF CONTAMINANTS IN WATER 137
TABLE A1. Chemicals That Have Been Detected in Drinking Water in Ontario, Their PrioritySubstance List (PSL) Designation, and Status Regarding Human Health Concerns (Continued)
CEPA Humanpriority healthpollutant? concern?
Chemical Class Description of use/origin (PSL1/2)a (yes/no)
Tetrachloro- Pesticide No longer produced in Canada PSL1 Yesethylene but continues to be imported (perchloro- primarily as a solvent for the ethylene) dry cleaning and metal
cleaning industries. It has been found in groundwater, primarily after improper disposal or dumping of cleaning solvents.
2,3,4,6-Tetra- Organic 2,3,4,6-Tetrachlorophenol was Yeschlorophenol used extensively, along with
pentachlorophenol, to preserve wood.
Toluene Organic Used in gasoline and other PSL1 Nopetroleum products and in the manufacture of benzene derived medicines, dyes, paints, coating gums, resins, and rubber. It may be found in industrial effluents.
Triallate Pesticide A thiocarbamate herbicide used Yesfor control of wild oats in grain crops, mustard, and sugar beets.
Trichloroethylene Organic Mostly used in dry cleaning. PSL1 YesSome is used in metal degreasing operations and in tetrachloroethylene production. Trichloroethylene may be introduced into surface water and groundwater through industrial spills and illegal disposal of effluents.
2,4,6-Trichlorophenol Organic Used in the manufacture of Yespesticides.
2,4,5-T (2,4,5-Tri- Pesticide A phenoxy alkanoic acid Yeschlorophenoxy- herbicide that was once an acetic acid) important stem/foliage
treatment for deciduous brush control on roadsides and power lines. 2,4,5-T is no longer used in Ontario.
Trifluralin Pesticide A dinitroaniline herbicide used Yesfor weed control in summer fallow and annual grasses in wheat, barley, and canola.
(Table continues on next page)

138 L. RITTER ET AL.
TABLE A1. Chemicals That Have Been Detected in Drinking Water in Ontario, Their PrioritySubstance List (PSL) Designation, and Status Regarding Human Health Concerns (Continued)
CEPA Humanpriority healthpollutant? concern?
Chemical Class Description of use/origin (PSL1/2)a (yes/no)
Trihalomethanes Organic Trihalomethanes are the most PSL1 Yes(e.g., chloroform, widely occurring synthetic bromodichloro- organics found in chlorinated methane, chloro- drinking water. The principal dibromomethane, source of trihalomethanes in and bromoform) drinking water is the action
of chlorine with naturally occurring organic (precursors) left in the water after filtration.
Uranium Metal(I) Uranium is normally present in Yesbiological systems and aqueous media as the uranyl ion (UO2
2+).
Vinyl chloride Organic Vinyl chloride is a synthetic Yes(chloroethene) chemical with no known natural
sources. It is used in making PVC (polyvinyl chloride) plastic items such as water-main pipe, siding, and many other common plastic items, all of which are now made in such a way that there is no trace of vinyl chloride present in them.
Xylenes Organic There are three isomers of dimethyl PSL1 Nobenzene, which are almost identical chemically and are collectively called xylenes. Xylenes are used as industrial solvents and as an intermediate for dyes and organic synthesis. They are a component of household paints and paint cleaners and gasoline and other petroleum products.
Zinc Metal(I) The concentration of zinc may be Noconsiderably higher at the drinking water tap in standing water because of corrosion taking place in galvanized pipes.
Note. Adapted from Ontario Ministry of the Environment (2000). Abbreviations used in this table:OC, organochlorine; I, inorganic; O, organic.
aPSL, priority substance list 1 or 2. Contaminants on this list have been designated in CEPA(Canadian Environmental Protection Act) as this.

139
TAB
LE A
2.Che
micals of H
ealth
Signific
ance
in Drink
ing W
ater and
Assoc
iated W
ater Q
uality Guide
lines/C
riteria (m
g/L)
WHO
Can
adian drinking
Prov
incial
Ontario drink
ing
drinking
water
water qua
lity
water qua
lity
water qua
lity
Used in H
Qqu
ality va
lue
guideline
guideline/ob
jective
guideline
assessmen
t?
Inorga
nic co
nstitue
nts
Antim
ony
0.00
5a70
00c
Arsen
ic0.01
a,b
0.02
5IM
AC
100,00
0Yes
Barium
0.7
1MAC
1MAC
Berylliu
mNAD
100,00
0c
Boron
0.3
5IM
AC
5IM
AC
Cad
mium
0.00
30.00
5MAC
200
Yes
Chrom
ium
0.05
a0.05
MAC
100,00
00.05
MAC
Yes
Cop
per
2a1.0
AO
5000
Cya
nide
0.07
0.2
MAC
0.2
MAC
Fluo
ride
1.5
1.5
MAC
1.5g
MAC
Lead
0.01
0.01
MAC
d0.01
MAC
Yes
Man
gane
se0.5a
0.05
AO
Mercu
ry (total)
0.00
10.00
1MAC
200
0.00
1MAC
Molyb
eden
um0.07
10,000
c
Nicke
l0.02
25,000
Nitrate (as NO
3– )
50e
4510
MAC
Yes
Nitrite
(as NO
2– )3a
,e3.2f
1MAC
Selenium
0.01
0.01
MAC
100,00
00.01
MAC
Uranium
NAD
0.1
MAC
0.1
MAC
Organ
ic con
stitue
nts
Chlorinated
alkan
esCarbo
n tetrac
hloride
20.00
5MAC
0.00
5MAC
Yes
Dichlorom
etha
ne20
0.05
MAC
0.05
MAC
1,1-Dichloroe
than
eNAD
200,00
01,2-Dichloroe
than
e30
b0.00
5IM
AC
100,00
00.00
5IM
AC
1,1,1-Trichloroe
than
e20
00a
800,00
0Chlorinated
ethen
es vinyl chloride
5b0.00
2MAC
0.00
2MAC
1,1-Dichloroe
then
e30
1,2-Dichloroe
then
e50
Trichloroe
then
e70
aYes
Tetrac
hloroe
then
e40
(Tab
le con
tinue
s on
next pa
ge)
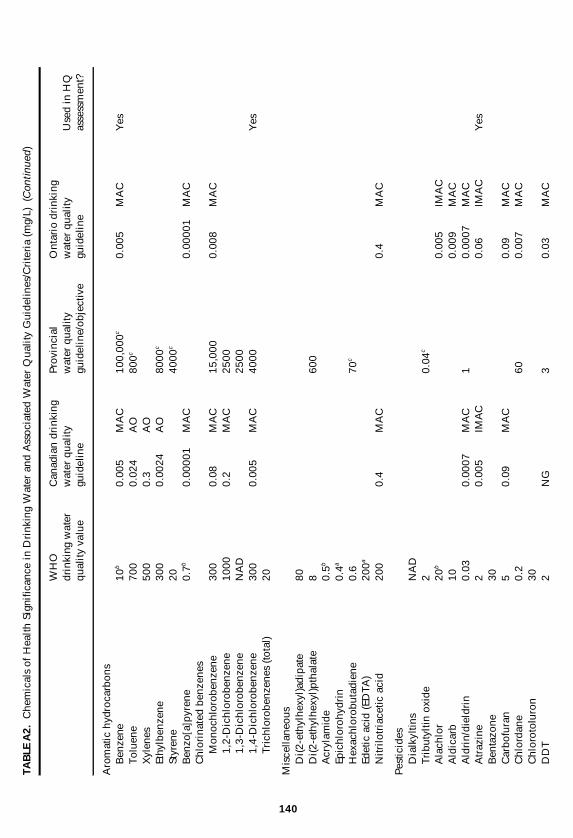
140
TAB
LE A
2.Che
micals of H
ealth
Signific
ance
in Drink
ing W
ater and
Assoc
iated W
ater Q
uality Guide
lines/C
riteria (m
g/L) (Con
tinue
d)
WHO
Can
adian drinking
Prov
incial
Ontario drink
ing
drinking
water
water qua
lity
water qua
lity
water qua
lity
Used in H
Qqu
ality va
lue
guideline
guideline/ob
jective
guideline
assessmen
t?
Aromatic hyd
roca
rbon
sBen
zene
10b
0.00
5MAC
100,00
0c0.00
5MAC
Yes
Toluen
e70
00.02
4AO
800c
Xylen
es50
00.3
AO
Ethy
lben
zene
300
0.00
24AO
8000
c
Styren
e20
4000
c
Ben
zo[ a] pyren
e0.7b
0.00
001
MAC
0.00
001
MAC
Chlorinated
ben
zene
sMon
ochlorob
enze
ne30
00.08
MAC
15,000
0.00
8MAC
1,2-Dichlorob
enze
ne10
000.2
MAC
2500
1,3-Dichlorob
enze
neNAD
2500
1,4-Dichlorob
enze
ne30
00.00
5MAC
4000
Yes
Trichlorob
enze
nes (to
tal)
20
Misce
llane
ous
Di(2
-ethylhe
xyl)a
dipa
te80
Di(2
-ethylhe
xyl)p
thalate
860
0Acrylam
ide
0.5b
Epichloroh
ydrin
0.4a
Hex
achlorob
utad
iene
0.6
70c
Edetic acid (EDTA
)20
0a
Nitrilo
triace
tic acid
200
0.4
MAC
0.4
MAC
Pesticides
Dialkyltin
sNAD
Tributyltin
oxide
20.04
c
Alach
lor
20b
0.00
5IM
AC
Aldicarb
100.00
9MAC
Aldrin/dieldrin
0.03
0.00
07MAC
10.00
07MAC
Atraz
ine
20.00
5IM
AC
0.06
IMAC
Yes
Ben
tazo
ne30
Carbo
furan
50.09
MAC
0.09
MAC
Chlorda
ne0.2
600.00
7MAC
Chlorotoluron
30DDT
2NG
30.03
MAC

141
1,2-Dibromo-3-ch
loroprop
ane
1b
2,4-D
300.1
IMAC
0.1
MAC
Yes
1,2-Dichlorop
ropa
ne20
a
1,3-Dichlroprop
ane
NAD
1,3-Dichlorop
rope
ne20
b
Ethy
lene
dibromide
NAD
Hep
tach
lor an
d he
ptachlor epo
xide
0.03
NG
10.00
3MAC
Hex
achlorob
enze
ne1b
6.5
Isop
roturon
9Lind
ane
210
0.00
4MAC
MCPA
2Metho
xych
lor
200.9
MAC
400.9
MAC
Metolac
hlor
100.05
IMAC
0.05
IMAC
Molinate
6Pe
ndim
etha
lin20
500
Pentac
hlorop
heno
l9
0.06
MAC
Yes
Perm
ethrin
20Prop
anil
20Py
rida
te10
0Simaz
ine
20.01
IMAC
10,000
0.01
IMAC
Yes
Trifluralin
200.04
5IM
AC
0.04
5IM
AC
Other chlorop
heno
xy herbicide
s2,4-DB
90Dichlorop
rop
100
Feno
prop
9MCPB
NAD
Mec
oprop
102,4,5-T
90.2
MAC
Disinfectan
tsMon
ochloroa
mine
33
MAC
Di- and
trichloram
ine
NAD
Chlorine
520
00Chlorine diox
ide
NAD
Iodine
NAD
Disinfectan
t by-prod
ucts
Bromate
25a,b
Chlorate
NAD
Chlorite
200a
(Tab
le con
tinue
s on
next pag
e)

142
TAB
LE A
2.Che
micals of H
ealth
Signific
ance
in Drink
ing W
ater and
Assoc
iated W
ater Q
uality Guide
lines/C
riteria (m
g/L) (Con
tinue
d)
WHO
Can
adian drinking
Prov
incial
Ontario drink
ing
drinking
water
water qua
lity
water qua
lity
water qua
lity
Used in H
Qqu
ality va
lue
guideline
guideline/ob
jective
guideline
assessmen
t?
Chlorop
heno
ls2-Chlorop
heno
lNAD
NAD
NAD
2,4-Dichlorop
heno
lNAD
0.9
MAC
0.9
MAC
2,4,6-Trichlorop
heno
l20
0b0.00
5MAC
0.00
5MAC
Form
alde
hyde
900
MX
NAD
Trihalom
etha
nes
0.1
MAC (total)
Yes
Bromoform
100
0.35
MAC
Dibromoc
hlorom
ethn
e10
00.35
MAC
Dibromod
ichlorom
etha
ne60
b0.35
MAC
Chloroform
200b
0.35
MAC
Chloroa
cetone
NAD
Halog
enated
ace
tonitriles
Dichloroa
cetonitrile
90a
Dibromoa
cetonitrile
100a
Bromoc
hloroa
cetonitrile
NAD
Trichloroa
cetonitrile
1a
Cya
noge
n ch
loride
(as CN)
70Chlorop
icrin
NAD
Note.
MAC, max
imum
acc
eptable co
ncen
tration; IMAC, interim m
axim
um acc
eptable co
ncen
tration; A
O, ae
sthe
tic o
bjec
tive; N
G, no
guide
line
available; N
AD, no
ava
ilab
le data. Sou
rces of inform
ation used
to co
mpile this table includ
ed: (1) Hea
lth Can
ada (199
6b), pp. 19–
77, (2) Ph
yper and
Ibbo
tson
(199
4), p
p. 90–
93 &
102
–104
; (3) W
orld H
ealth
Organ
ization (199
3), p
p. 174
–178
.a Provision
al guide
line va
lue, used for co
nstitue
nts for which
the
re is some ev
iden
ce of a po
tential ha
zard but w
here the
ava
ilable inform
ation on
health effec
ts is lim
ited
; or whe
re an un
certainty factor greater th
an 100
0 ha
s be
en used in th
e de
riva
tion of th
e tolerable da
ily in
take
(TDI).
bFo
r substanc
es tha
t are co
nsidered
to be
carcino
genic, the
guide
line va
lue is the
con
centratio
n in drink
ing water assoc
iated with
an ex
cess lifetim
eca
ncer risk of 10–
5(1 add
ition
al can
cer pe
r 10
0,00
0 of the
pop
ulation inge
sting drinking
water con
taining the subs
tanc
e at the
guide
line va
lue for 70
yr). Con
centratio
ns assoc
iated with
estim
ated
exc
ess lifetim
e ca
ncer risks of 10
–4an
d 10
–6ca
n be
calcu
lated by
multiplying
and
dividing, respe
ctively,
the gu
ideline va
lue by
10.
c The
se value
s represen
t prop
sed Prov
incial W
ater Q
uality Guide
line
s/Objec
tive
s.dPW
QO/G
is eith
er a narrativ
e, or de
pend
ent on
pH, alka
linity, o
r ha
rdne
ss.
e The
sum
of the
ratio of the
con
centratio
n of eac
h to its respe
ctive gu
ideline va
lue shou
ld not exc
eed this.
f In cases w
here nitrate an
d nitrite are de
term
ined
sep
arately.
g The
MAC for naturally occ
urring
fluoride in drink
ing water is 2.4 mg/L. A
MAC of 1.5 mg/L was estab
lishe
d to ensure that w
hen flu
oride is add
edto drink
ing water the
con
centratio
n (1.2 ± 0.2 m
g/L) is maintaine
d such
tha
t the
pop
ulation ob
tains op
timal ben
efit.