Sources of uncertainty and current practice for addressing them: analytical perspective Roy...
24
Sources of uncertainty and current practice for addressing them: analytical perspective Roy Macarthur [email protected]
-
Upload
marina-striplin -
Category
Documents
-
view
214 -
download
0
Transcript of Sources of uncertainty and current practice for addressing them: analytical perspective Roy...
Sources of uncertainty and current practice for addressing them:
analytical perspective
Roy Macarthur
Analytical perspective
• Uncertainty about quantitative measurements
• Chemical, microbiological, biotechnological analytes.
• What analysts won’t tell you
• What analysts will tell you but you shouldn’t necessarily take on face value
• Uncertainty about qualitative detection
Quantitative analytical uncertainty
• A quantity associated with an analytical result.
• Expresses the range of values for true concentration in a sample that are consistent with the measurement result.
• Estimation of uncertainty is required by ISO 17025.
• Samples taken for official control ‘fail’ if result - uncertainty is over limit (Codex, EU).
• Upper limits for expected measurement uncertainty in European Legislation are used to qualify analytical methods for official control.
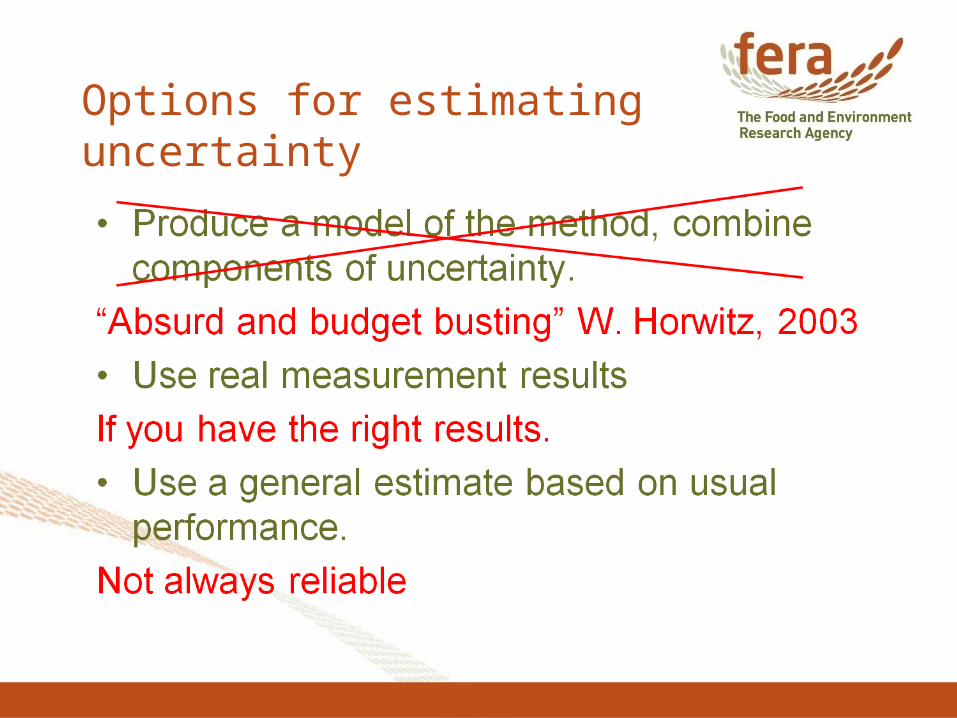
Options for estimating uncertainty
• Produce a model of the method, combine components of uncertainty
• Use real measurement results
• Use a general estimate based on usual performance
Options for estimating uncertainty
Using real measurement results
• Single laboratory validation and QAMeasurements undertaken within a laboratory to estimate or check variation, bias etc.
• Collaborative trial.Analysis of replicate samples in different labs using the same method.
• Proficiency testsAnalysis of replicate samples by different labs
using any method they like.
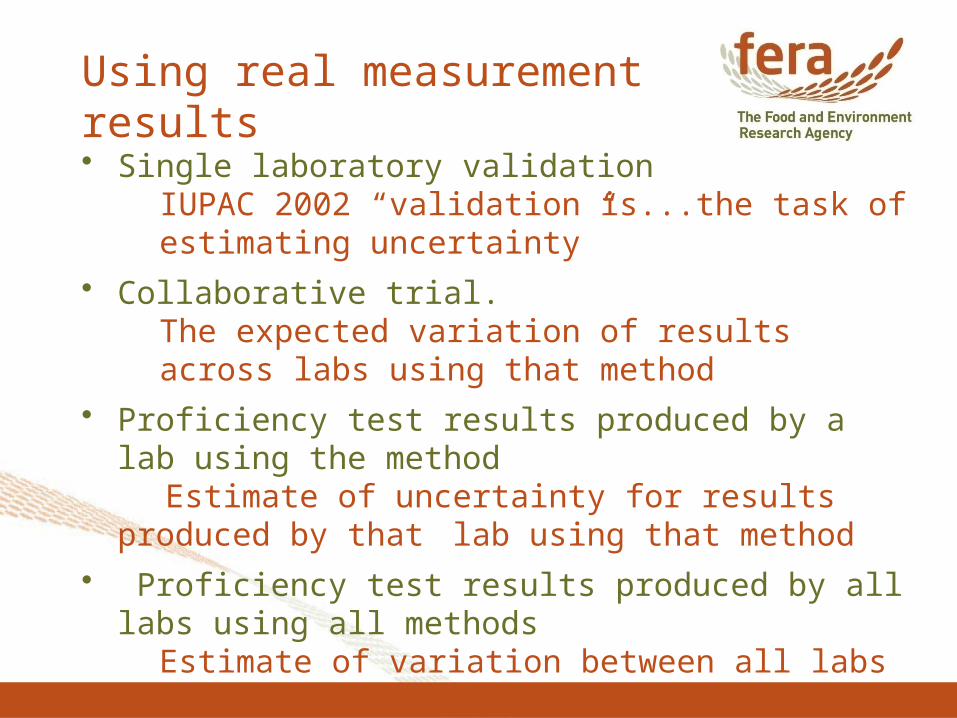
Using real measurement results
• Single laboratory validationIUPAC 2002 “validation is...the task of estimating uncertainty”
• Collaborative trial.The expected variation of results across labs using that method
• Proficiency test results produced by a lab using the method
Estimate of uncertainty for results produced by that lab using that method
• Proficiency test results produced by all labs using all methods
Estimate of variation between all labs and methods
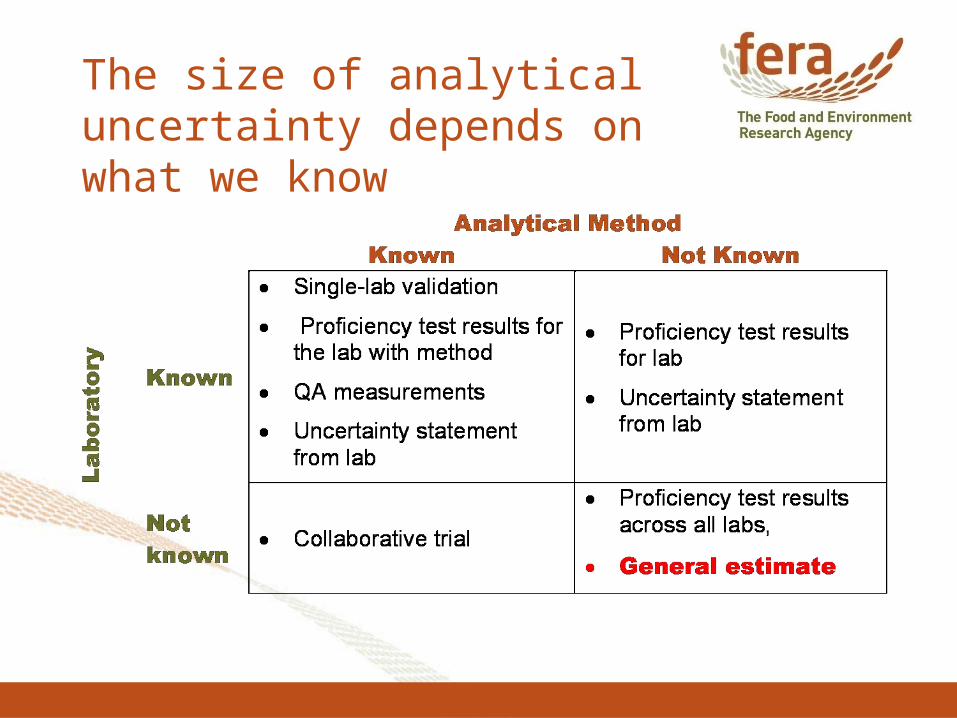
The size of analytical uncertainty depends on what we know
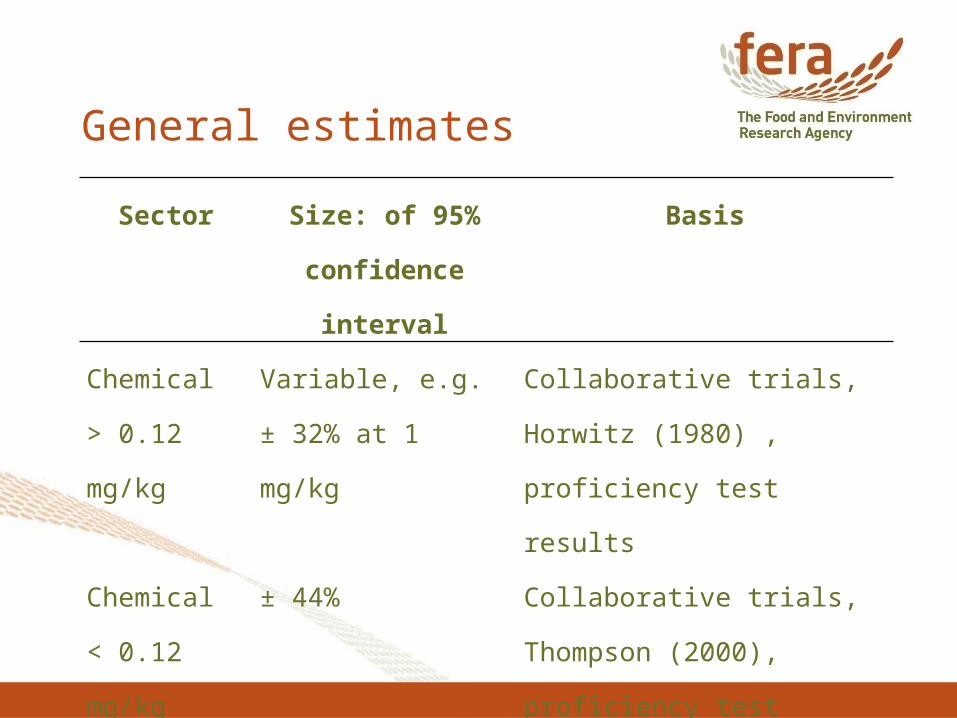
General estimates
Sector Size: of 95%
confidence interval
Basis
Chemical
> 0.12 mg/kg
Variable, e.g. ± 32%
at 1 mg/kg
Collaborative trials, Horwitz
(1980) , proficiency test
results
Chemical
< 0.12 mg/kg
± 44% Collaborative trials, Thompson
(2000), proficiency test results
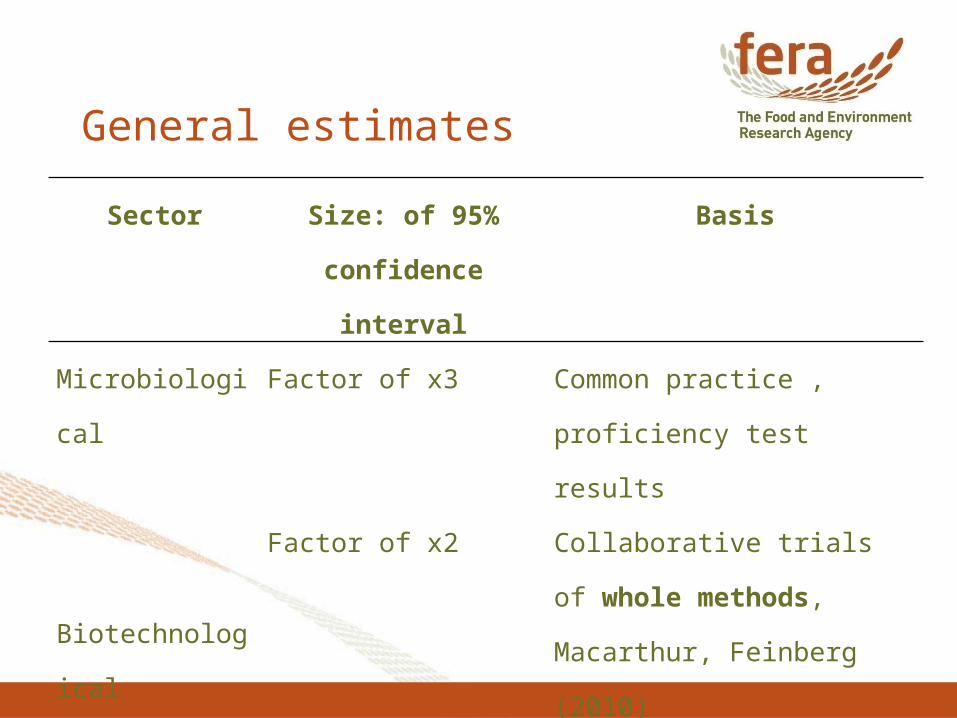
General estimates
Sector Size: of 95%
confidence interval
Basis
Microbiological Factor of x3 Common practice , proficiency
test results
Biotechnological
Factor of x2 Collaborative trials of whole
methods, Macarthur,
Feinberg (2010)
Factor of x3 Proficiency test results
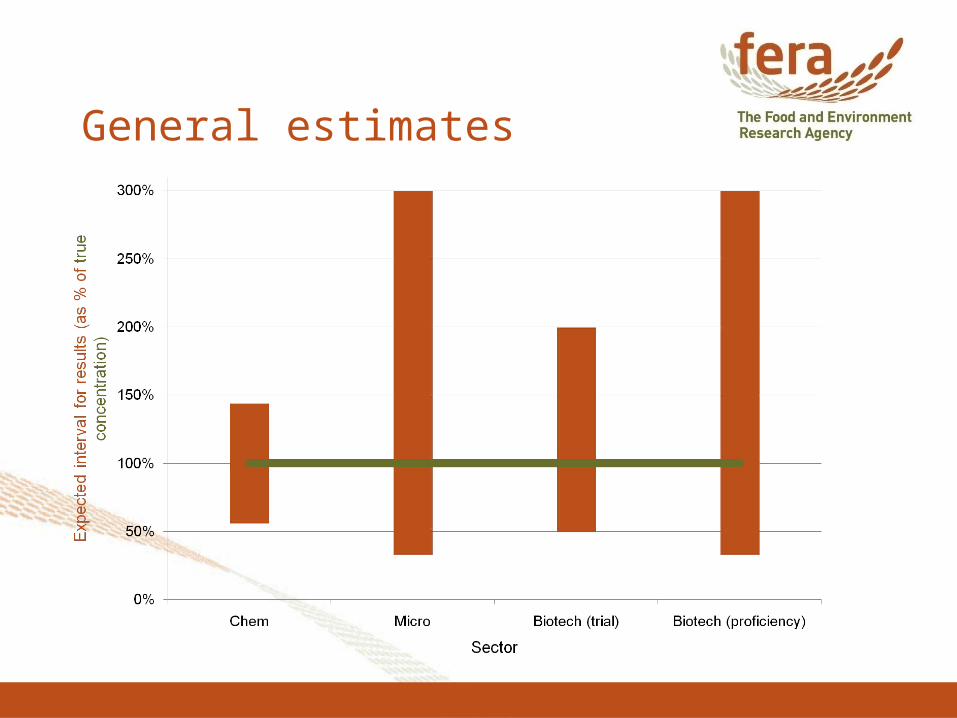
General estimates
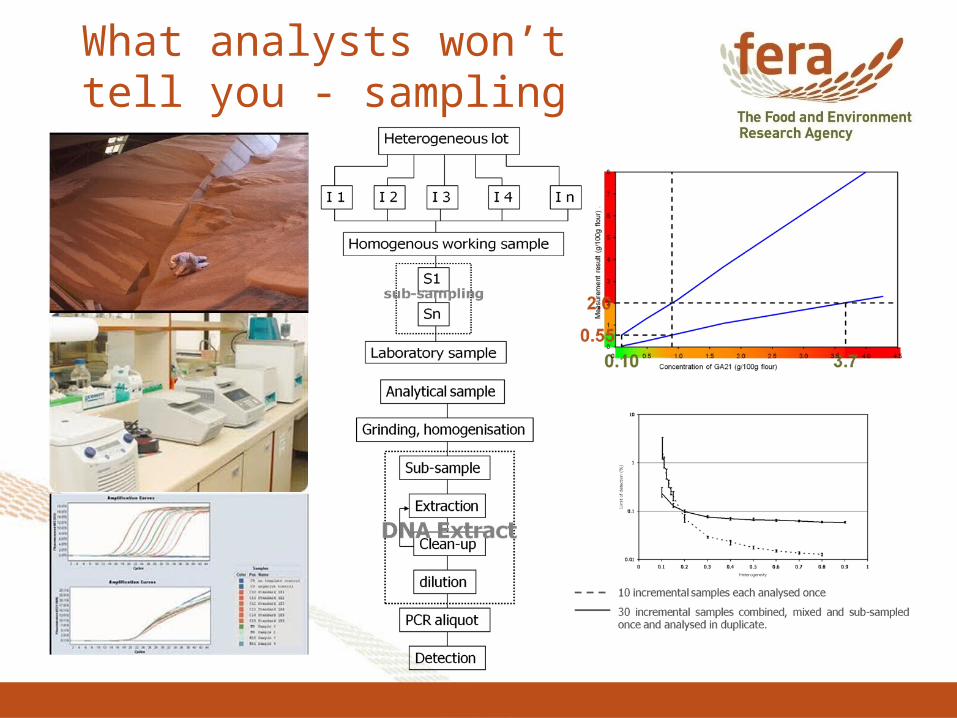
What analysts won’t tell you - sampling
What is the effect of sampling uncertainty?
• Depends on the ‘size’ of variation– Expressed as a variance, RSD, or hotspot
size• Depends on the ‘shape’ of the variation
– Expressed as a particular statistical distribution.
• We rarely know the size. We never know the shape.
• Size is more important than shape.
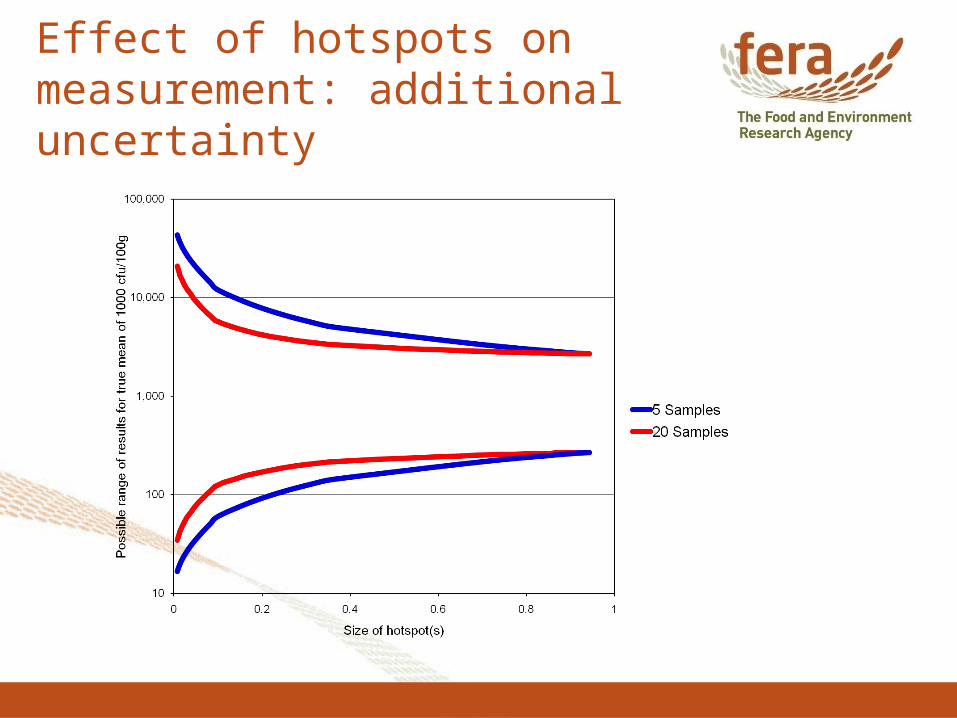
Effect of hotspots on measurement: additional uncertainty
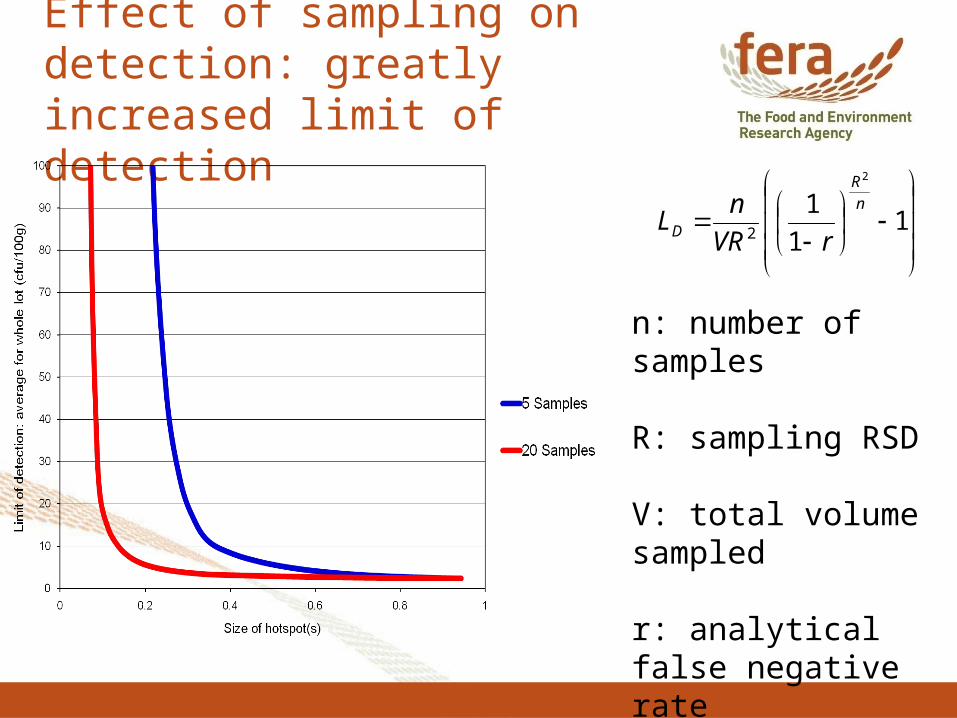
Effect of sampling on detection: greatly increased limit of detection
1
1
12
2
n
R
D rVR
nL
n: number of samples
R: sampling RSD
V: total volume sampled
r: analytical false negative rate
What analysts won’t tell you - blunders• Results produced when an analysis is not
done properly
• Includes testing the wrong sample, transcribing errors etc
• Generally ignored in collaborative trials, ISO5725 allows 2/9 results to be discarded.
• Considered not to be part of analytical uncertainty.

Proficiency test results reveal blunders
• About 5% of proficiency test results appear to be blunders
Royal Society of Chemistry Analytical Methods Committee, Technical Brief 49
Cadmium in food stuffs (mg/kg)
What analysts will tell you....LOD
• Different definitions and methods for calculating limit of detection can lead to estimates varying by a factor of 1000 (Lloyd Currie, 1968)
• At least 8 current definitions for limit of detection (MoniQA* project, last week).
* MoniQA, “Monitoring and Quality Assurance in the Food Supply Chain”, European Commission funded network of excellence. www.moniqa.org
• Check definition used.
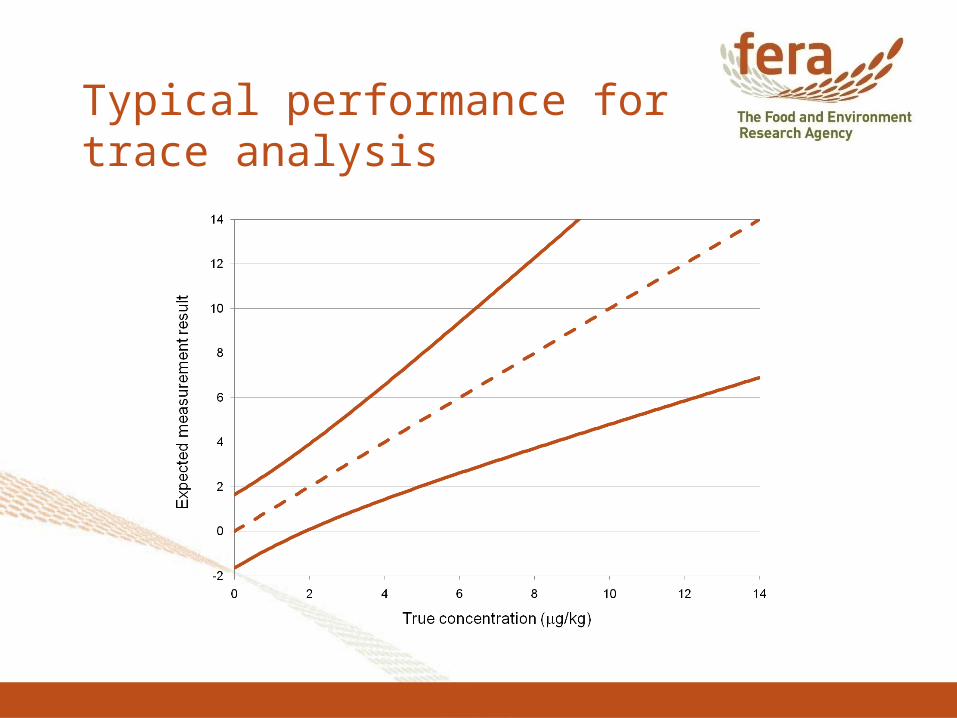
Typical performance for trace analysis
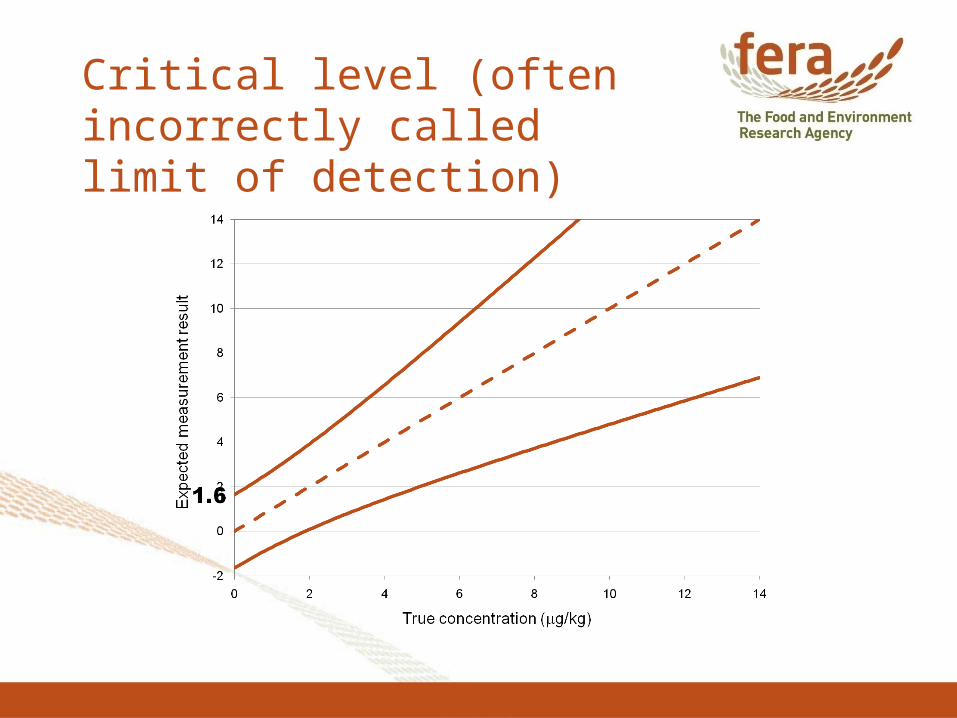
Critical level (often incorrectly called limit of detection)
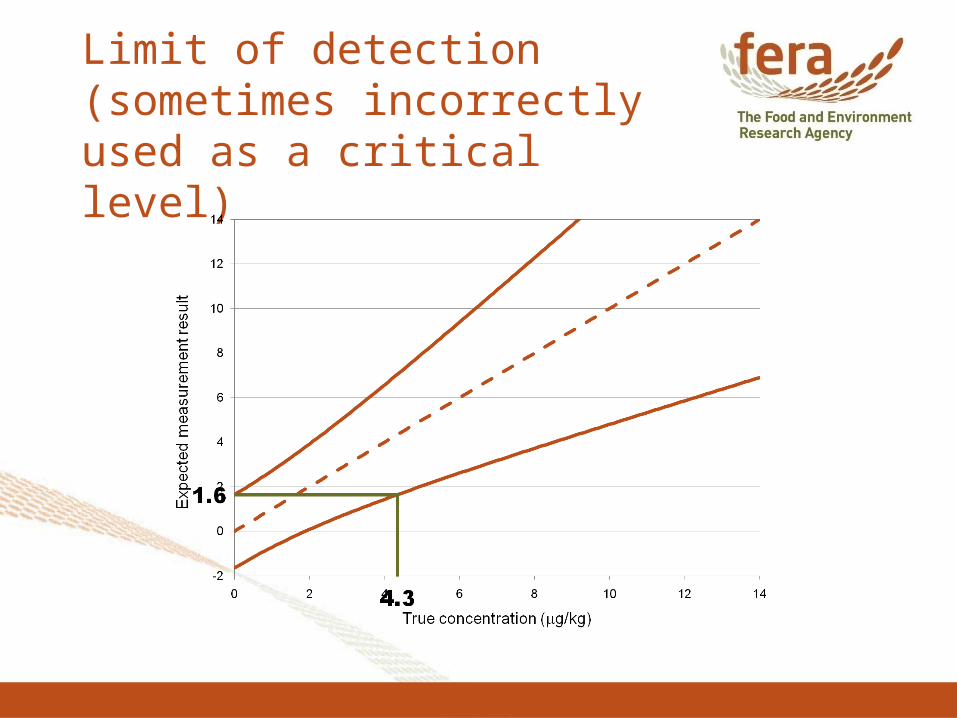
Limit of detection (sometimes incorrectly used as a critical level)
Qualitative methods of detection
• Increase in low cost, rapid methods of detection.
• No internationally accepted standard (correct, simple, broadly applicable) for validation and uncertainty.
• IUPAC / MoniQA and AOAC standards under development.
• Based on estimating probability of detection across a range of concentrations.
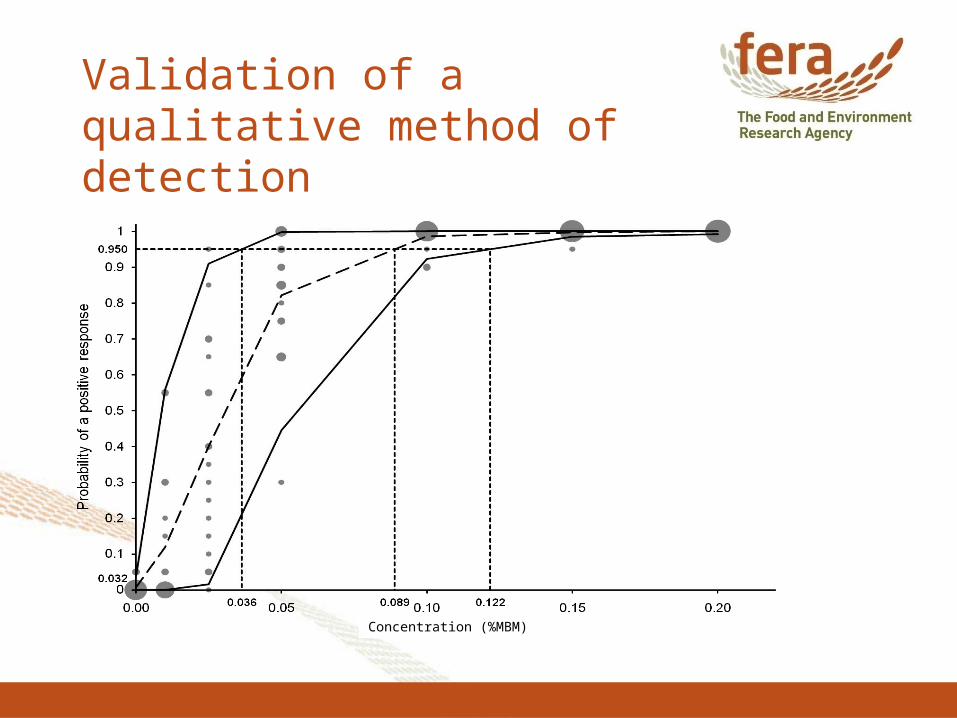
Validation of a qualitative method of detection
Concentration (%MBM)
Analytical perspective
• Use, proficiency test results, collaborative trials and single lab validation or “general estimates” for analytical uncertainty.
• Variation of proficiency test results gives a good estimate when little information is available
• Chemical <±44%, bio ×3, biotech ×2 to ×3• Be aware of sampling uncertainty and
potential blunders• Get basis for claimed limits of detection.