Sources of Information, Levels of Awareness and Adoption ...
88
SOURCES OF INFORMATION, LEVELS OF AWARENESS AND ADOPTION OF RENEWABLE ENERGY IN KEEKONYOKIE AND OLKERI WARDS, KAJIADO COUNTY SHEILAH NABACHENJE NDIEMA A RESEARCH PROJECT SUBMITTED TO THE SCHOOL OF JOURNALISM IN PARTIAL FULFILMENT OF THE REQUIREMENT FOR THE AWARD OF DEGREE OF MASTER OF COMMUNICATION STUDIES, UNIVERSITY OF NAIROBI NOVEMBER 2019
Transcript of Sources of Information, Levels of Awareness and Adoption ...
SOURCES OF INFORMATION, LEVELS OF AWARENESS AND
ADOPTION OF RENEWABLE ENERGY IN KEEKONYOKIE AND OLKERI
WARDS, KAJIADO COUNTY
SHEILAH NABACHENJE NDIEMA
A RESEARCH PROJECT SUBMITTED TO THE SCHOOL OF
JOURNALISM IN PARTIAL FULFILMENT OF THE REQUIREMENT FOR
THE AWARD OF DEGREE OF MASTER OF COMMUNICATION STUDIES,
UNIVERSITY OF NAIROBI
NOVEMBER 2019
ii
DECLARATION
This is to declare that this research project is my original work and has not been
presented for a degree in any other university for marking.
_____________________________________________________________________
Sheilah Nabachenje Ndiema Date
REG. No: K50/88419/2016
This project has been submitted under my approval as the university supervisor
_____________________________________________________________________
Dr. George Gathigi Date
University of Nairobi

iii
ACKNOWLEDGEMENT
I thank God for granting me good health to finish this project. I also thank my
parents Moses and Catherine Ndiema for their unconditional love and support
throughout this project. My sincere gratitude goes to my supervisor Dr. George Gathigi
for his academic and intellectual guidance and unconditional support throughout this
project. This would not have been possible without him. I also thank my sister Sharon
and brothers Kip and Sammy for their support throughout my coursework and project.
Special thanks to my friend Valentine Muriithi for her support throughout this project.

iv
ABSTRACT
This study explored the sources of information, levels of awareness and adoption of
renewable energy in Keekonyokie and Olkeri wards in Kajiado County. The study
sought to find out sources of information that can help guide provision of information
on renewable energy to promote its uptake. The study was informed by the ecological
model which describes the relationship between individuals and their environment at
different levels of interaction. The results of this study showed that the level of
information is more on the interpersonal level as the highest percentage of people
become aware about these sources of energy through word of mouth. It was evident
that there needs to be more effort in promoting awareness and enabling adoption on
these types of energy at the institutional, community and policy levels. The study was
also informed by the diffusion of innovations theory which explains how over time, an
idea or product gains momentum and spreads through a specific population. A
sequential exploratory design was used for the study where quantitative data was
collected and analysed first, then the results used to inform the qualitative bit.
Qualitative data was obtained using key informant interviews while quantitative data
was obtained using surveys. A sample of 398 respondents was used for the study. This
was arrived at by using Yamane’s sample calculation formula. Cluster sampling was
used to select respondents for quantitative data where the unit of analysis was
households which were clustered according to sub-locations. For qualitative data, a
sample of four respondents were chosen purposively. These respondents included two
members of staff from Keekonyokie slaughter house and one from Ngong wind power
station and one resident in Olkeri ward. During data analysis, qualitative data was
recorded, transcribed and organised into themes then analysed descriptively.
Quantitative data was processed by coding the closed ended questions and evaluating
the information using the SPSS programme and the findings represented in frequency
tables, percentages and graphs. This study focused on sources of information, levels of
awareness and adoption of alternative forms of renewable energy including biogas,
solar energy, briquettes and wind energy.It was found that word of mouth is the most
shared source of information for renewable energy in Keekonyokie and Olkeri Wards.
Television also ranked highly followed by formal education, social media and radio
respectively. It was also found that that the level of awareness of renewable energy in
the two wards increased with level of education. Elderly people aged sixty and above
showed less awareness of renewable energy sources as compared to younger adults. It
was also found that the most common form of renewable energy is biogas followed by
solar power. People had very little awareness on wind energy and briquettes. The study
also showed that availability and economic status were the main determining factors
for the type of energy people chose to use. The study recommends that it is important
to use interpersonal means to educate people about renewable energy as well as the
mass media in order to reach a wider audience. To promote adoption of the renewable
energy sources, the study recommends that relevant stakeholders should invest more in
socio-economic activities involving these types of energy.

v
ACRONYMS AND ABBREVIATIONS
NGO Non-Governmental Organization
LPG Liquefied Petroleum Gas
GHGs Green House Gases
WHO World Health Organisation
KENDBIP Kenya Domestic Biogas Program
KNBS Kenya National Bureau of Statistics
MTOE Million Tons of Oil Equivalent
FIT Feed in Tariffs
SPSS Statistical Package for the Social Sciences
KENGEN Kenya Electricity Generating Company
CSR Community Social Responsibility
SID Society for International Development
BP British Petroleum
vi
TABLE OF CONTENTS
DECLARATION.......................................................................................................... ii
ACKNOWLEDGEMENT ......................................................................................... iii
ABSTRACT ................................................................................................................. iv
ACRONYMS AND ABBREVIATIONS .................................................................... v
LIST OF FIGURES .................................................................................................... ix
LIST OF TABLES ....................................................................................................... x
CHAPTER ONE .......................................................................................................... 1
INTRODUCTION........................................................................................................ 1
1.0 Overview .................................................................................................................. 1
1.1 Background information .......................................................................................... 1
1.2 Statement of the problem ......................................................................................... 4
1.3 Justification .............................................................................................................. 6
1.4 Significance of the study .......................................................................................... 6
1.5 Research objectives .................................................................................................. 6
1.6 Research questions ................................................................................................... 7
1.7 Scope and Limitations of the study .......................................................................... 7
Operational definitions................................................................................................... 9
CHAPTER TWO ....................................................................................................... 10
LITERATURE REVIEW ......................................................................................... 10
2.0 Overview ................................................................................................................ 10
2.1 The ecological model ............................................................................................. 10
2.2 Green energy movement: A global perspective ..................................................... 12
2.3 The Diffusion of Innovations theory ...................................................................... 13
2.4 Renewable energy in Kenya .................................................................................. 15
2.5 Policy and legal framework ................................................................................... 16
2.6 The cost of renewable energy ................................................................................ 18
2.7 Renewable energy and livelihoods ........................................................................ 20
2.8 Benefits of renewable energy ................................................................................. 20
2.9 Sources of information and levels of awareness for renewable energy ................. 21
2.10 Word of mouth as a source of information .......................................................... 22

vii
CHAPTER THREE ................................................................................................... 24
METHODOLOGY .................................................................................................... 24
3.0 Overview ................................................................................................................ 24
3.1 Study design ........................................................................................................... 24
3.2 Study site and population ....................................................................................... 25
3.3 Research approach ................................................................................................. 25
3.3.1 Quantitative data ........................................................................................... 26
3.3.2 Qualitative data ............................................................................................. 26
3.4 Research method .................................................................................................... 27
3.5 Data types and sources ........................................................................................... 28
3.6 Sample size and sampling procedure and data collection ...................................... 28
3.6.1 Sample size ................................................................................................... 28
3.6.2 Sampling procedure ...................................................................................... 29
3.6.2.1 Cluster sampling .................................................................................. 29
3.6.2.2 Purposive sampling .............................................................................. 29
3.6.3 Data collection .................................................................................................... 30
3.7 Data collection tools .............................................................................................. 31
3.7.1 Structured questionnaires .............................................................................. 31
3.7.2 Interview guide ............................................................................................. 32
3.8 Validity and reliability of the instruments ............................................................. 32
3.9 Data analysis .......................................................................................................... 32
3.10 Data presentation ................................................................................................. 33
3.11 Ethics.................................................................................................................... 33
CHAPTER FOUR ...................................................................................................... 35
DATA PRESENTATION, ANALYSIS AND INTERPRETATION .................... 35
4.0 Overview ................................................................................................................ 35
4.1 Sample size and response rate by place of residence ............................................. 38
4.2 Age distribution by percentage .............................................................................. 38
4.3 Level of Education ................................................................................................. 39
4.4 Level of awareness for wind, solar biogas and Briquettes. .................................... 40
4.5 Main source of information for wind, solar biogas and briquettes ........................ 42
4.6 Quality of information sources .............................................................................. 46

viii
4.7: Sources of energy for daily needs ......................................................................... 47
4.8 Sources of energy preferred for cooking ............................................................... 48
4.9 Sources of energy preferred for lighting ................................................................ 50
4.10 Factors influencing choice of energy for cooking and lighting ........................... 50
4.11.1 Levels of awareness in relation to age ........................................................ 52
4.11.2 Level of awareness relation to level of education ....................................... 53
4.11.3 Sources of information in relation to age .................................................... 54
4.11.4 Sources of information according to level of education ............................. 55
4.11.5 Age and factors influencing the choice of energy for cooking and lighting
................................................................................................................................ 56
4.11.6 Level of education and factors influencing the choice of energy ............... 57
CHAPTER FIVE ....................................................................................................... 59
SUMMARY OF FINDINGS, CONCLUSION AND RECOMMENDATIONS .. 59
5.0 Overview ................................................................................................................ 59
5.1 Sources of information for renewable energy in the two wards ............................ 59
5.2 Levels of awareness on renewable energy in Keekonyokie and Olkeri wards ...... 60
5.3 Levels of adoption of renewable energy in Keekonyokie and Olkeri wards ......... 60
5.4 Conclusion ............................................................................................................. 61
5.5 Recommendations .................................................................................................. 62
REFERENCES ........................................................................................................... 65
APPENDICES ............................................................................................................ 68
APPENDIX 1: QUESTIONNAIRE ............................................................................ 68
APPENDIX II. INTERVIEW GUIDE ........................................................................ 72
APPENDIX III. : CASE SUMMARY ......................................................................... 74
APPENDIX IV: LINE TRANSECT OF KEEKONYOKIE AND OLKERI WARDS
...................................................................................................................................... 75
APPENDIX V: CERTIFICATE OF FIELDWORK.................................................... 76
APPENDIX VI: CERTIFICATE OF ORIGINALITY ................................................ 77

ix
LIST OF FIGURES
Figure 2. 1: Diffusion of innovation adopter categories .............................................. 15
Figure 4. 1: Sources of cooking fuel in Olkeri Ward ………………………………..35
Figure 4. 2: Sources of cooking fuel in Keekonyokie Ward ........................................ 36
Figure 4. 3 : Source of lighting fuel in Olkeri Ward .................................................... 36
Figure 4. 4 : Source of lighting fuel in Keekonyokie Wards ....................................... 37
Figure 4. 5 : Age distribution by percentage................................................................ 39
Figure 4. 6 : Level of education of Keekonyokie and Olkeri residents ....................... 40
Figure 4. 7 : Quality of information sources ................................................................ 46
Figure 4. 8: Sources of energy for daily needs ............................................................ 48
Figure 4. 9: Levels of awareness in relation to age ...................................................... 53
Figure 4. 10: Level of education in relation to awareness ........................................... 54
Figure 4. 11: Sources of information in relation to age ............................................... 55
Figure 4. 12: Sources of information in relation to level of education ........................ 56
Figure 4. 13: Age and factors influencing the choice of energy .................................. 57
Figure 4. 14: Level of education and factors influencing the choice of energy ........... 58

x
LIST OF TABLES
Table 4. 1: Population distribution, sample size and response rate ............................. 38
Table 4. 2: I am aware about the following sources of renewable energy ................... 42
Table 4. 3: Main source of information on renewable energy ..................................... 45
Table 4. 4: Sources of energy preferred for cooking ................................................... 49
Table 4. 5: Preferred source of energy for lighting ...................................................... 50
Table 4. 6: Factors influencing choice of energy for cooking and lighting ................. 51

1
CHAPTER ONE
INTRODUCTION
1.0 Overview
This chapter presents a background research on renewable energy both globally and
locally. The chapter also highlights data from the Kenya National Bureau of statistics
which discusses the sources of energy for cooking and lighting in Kajiado County.
Further, objectives have been highlighted and the problem of the study.
1.1 Background information
Renewable energy has presented opportunities for households in developing
countries around the world. More than 1.5 billion people in third-world countries have
not been connected to the electrical grid, therefore, depend on traditional fuels to carry
out heating and cooking functions. Approximately 3 billion people depend on firewood
and charcoal for cooking and heating purposes globally. (Langbein, 2017). While these
fuels are readily accessible to households in rural locations, they are very harmful to
the environment. For instance, the dependence on fuels such as firewood and charcoal
leads to forest degradation as people have to cut down trees to make charcoal or process
them into small branches or logs. Deforestation also causes climate change due to the
lack of enough vegetation to absorb greenhouse gases such as carbon dioxide, nitrous
oxide, and methane, which are present in our atmosphere. Breathing these compounds
may cause breathing problems, cardiovascular illnesses, and cancer. The gases also
pollute the air and compromise the quality of water in an area. Second, the increased
use of traditional biomass fuels such as charcoal and firewood leads to deforestation as
trees are cut down to produce logs and charcoal. The burning of these materials also
generates indoor smoke, which causes respiratory problems such as bronchitis,
pneumonia, lung cancer, and perinatal diseases. Smoke-induced illnesses result in more
2
than 4 million deaths globally every year (Langbein, 2017). The World Health
Organisation (WHO) reports that this risk factor causes more deaths than tuberculosis
or malaria (Langbein, 2017).
Besides, the use of traditional fuels such exposes families to the health hazards
emanating from indoor air pollution. These negative effects and risks emphasise the
importance of adopting and embracing green and inclusive energy technologies.
The concept of green or sustainable energy entails the supply and use of energy
for the wellness of households with respect to conserving and regenerating scarce
resources for future generations. While all forms of energy affect livelihoods and the
environment, their extent varies. Renewable energy sources such as solar, wind, and
biomass, for instance, are cleaner and friendlier to the environment as compared to
energy from fossil fuels such as coal, diesel, and petroleum. Renewable energy is also
advantageous because it reduces the costs that families would have incurred in
healthcare by reducing harmful emissions in the air and enhancing water quality.
Communities that adopt this form of energy will not face health risks such as breathing
problems, different types of cancer and heart ailments, which are associated with fossil
fuels. Third, renewable energy is beneficial as it reduces the overdependence of
communities on imports such as oil. Generally, this form of energy is generated from
naturally existing sources such as sunlight, biomass, water, and wind, which are usually
readily available and inexpensive (Mohtasham, 2015). Locals can, therefore, access
these sources easily.
Despite the opportunities that sustainable energy present, households in Kenya
are yet to adopt them in mass. A majority of the population require electricity to heat,
light, and cook. However, this form of energy is expensive and inaccessible as most
rural areas are yet to be connected to the national grid. A report by Power Africa (2015)

3
established that only 20% of the populace had access to electricity as of July 2015.
While the government has outlined plans to ensure that every Kenyan household has
access to electricity by 2020, they have only focused on geothermal power production
at the expense of other potential renewable energy sources such as biogas, briquettes,
solar, and wind. In this regard, there is the need to marshal all stakeholders including
citizens, policymakers, the government, and non-governmental organisations (NGOs)
to enhance the access to relevant information concerning other sustainable energy forms
such as wind energy, solar energy, briquettes and biogas. This study explores the
different sources of information, levels of awareness and adoption of renewable energy
in Keekonyokie and Olkeri Wards in Kajiado County.
The research uses Keekonyokie and Olkeri Wards in Kajiado County to explore
different sources of information and how effective they are in enhancing uptake and
use of green energy sources such as biomass, solar energy, and wind energy. The
primary form of renewable energy for cooking in these two wards is biogas because
dung, which is the main raw material used in the production of biogas, is readily
available as the County is largely a pastoralist community. In addition, the fact that
Kajiado County has an average annual temperature of about 19oC and an annual rainfall
of 500 millimeters makes its semi-arid conditions favorable for biogas digesters.
In an inequality report prepared by Ngugi (2013) and published by the Kenya
National Bureau of Statistics and the Society for International Development – East
Africa in 2013, it was shown that 1.1%, 1.1%, 0.0%, and 12.8% of residents in the
county depend on electricity, biogas, solar, and liquefied petroleum gas (LPG) for
cooking fuel respectively. In comparison, 18.5%, 25.2%, and 40.8% rely on paraffin,
charcoal, and firewood for cooking and heating (Ngugi, 2013). In regard to lighting,
1%, 2.2%, 0.8%, and 0.4% of the residents depend on solar, fuelwood, pressure lamp,

4
and gas lamp for lighting. Lantern lamps, tin lamps, and electricity are the three
dominant energy sources for lighting in the county with 18.9%, 35.7%, and 40% usage
respectively. As expected in many counties in the country, the adoption of more
‘advanced’ energy sources in Kajiado County is gender-based. Most of the households
headed by women in the county use ‘less advanced’ or ‘traditional’ methods. For
instance, 53% of households headed by women use firewood for cooking while only
35% of homes headed by males use this cooking fuel (Ngugi, 2013). Similarly, more
male-headed families (44%) use electricity for lighting as compared to female-headed
households at 32%. This gender disparity is also characterized in aspects such as
housing, access to water, income distribution, and access to health, education, and
employment.
Levels of income in the county are unevenly distributed depending on the
occupations held by households. For instance, approximately 33%, 14.4%, and 14.2%
of residents are in work for pay employment, family business, and family agricultural
holding respectively. (Ngugi, 2013). The distribution of individuals into work for pay
and family business employment increases with a person’s level of education with
individuals with secondary or a higher level of education filling most of the positions.
The pattern is reversed in family agricultural holding employment as people with no
education or primary level of education occupying most of the positions.
This study will explore the sources of information that have been used to
encourage households in the county to embrace sustainable energy sources in their day
to day activities.
1.2 Statement of the problem
Despite the benefits presented by renewable energy, communities in
Keekonyokie and Olkei are yet to adopt it in mass. Households in the area are still using

5
traditional techniques such as charcoal and firewood for cooking and heating purposes
(KNBS, 2013). This is in spite of the fact that Kajiado County as a whole presents
unique opportunities for effecting the use of renewable energy sources. For instance,
given that communities living in the County are pastoralists, they can readily access
dung, which is the primary raw material for the production of biogas, from their
animals. The area’s climate of approximately 19oC temperature and 500 mm annual
rainfall also provides semi-arid conditions favorable for operating biogas digesters,
solar panels, and compressing and drying sawdust and coal dust to make briquettes.
Apart from a report published by the Kenya National Bureau of Statistics in
2013 that showed percentage distribution of households by source of energy for
cooking and lighting, the researcher did not come across any studies that have been
done in Kenya, to investigate sources of information, levels of awareness and levels of
adoption of renewable energy. There is inadequate literature linked to sources of
information and awareness levels on renewable energy. Scarcity of information on the
subject of renewable energy could be a major causative for low levels of adoption and
investment on renewable energy technologies. As shown by statistics from the KNBS,
in 2013, adoption of these types of energy was still very low. We do not know if
residents of Keekonyokie and Olkeri are aware about these types of energy, if so, what
are their sources of information, and what is their level of awareness now?
Many problems will arise if this gap persists. First, communities will incur
increased healthcare costs as they seek medical care, and the environment will continue
to suffer the effects of deforestation and use of fossil fuels. Apart from exposing people
and the environment to health hazards and degradation respectively, the persistence of
the gap also causes communities to over-depend on oil and diesel, which are imported
from foreign countries, at the expense of green energy, which can be generated from

6
raw materials and resources available in the locales. Enhancing communication with
the public could increase public awareness on risk factors relating to the use of unclean
energy as well as the benefits associated with the use and investment in renewable
energy.
With the above acknowledgment, this study seeks to find out the sources of
information, levels of awareness and levels of adoption of renewable energy in
Keekonyokie and Olkeri Wards of Kajiado County, to help guide provision of
information on different forms of renewable energy to promote their uptake.
1.3 Justification
Having access to information about green energy is critical to enabling citizens
to more fully participate in discussions and activities aimed at increasing the supply of
renewable energy and reduction of carbon intensive energy sources. This study will
communication about green energy more efficient and effective. It will help in reducing
the time spent on patient searching of information avenues that are most suitable for the
provision of information on renewable energy in the area. The study will recommend
sources most likely to yield desired outcome in the promotion of renewable energy.
1.4 Significance of the study
Theoretically, this study is of significance to communication scholars in terms
of conceptualisation of communication techniques and strategies that would be
effective in promoting the use of renewable energy.
1.5 Research objectives
The study is guided by the following objectives:
a) To examine the main sources of information on renewable energy in
Keekonyokie and Olkeri Wards, of Kajiado County.

7
b) To investigate the level of awareness about renewable energy sources in
Keekonyokie and Olkeri Wards, of Kajiado County.
c) To examine the levels of adoption of renewable energy in Keekonyokie and
Olkeri Wards, of Kajiado County.
1.6 Research questions
The following research questions guided this study:
a) What are the main sources of information on renewable energy in Keekonyokie
and Olkeri Wards of Kajiado County?
b) What is the level of awareness of renewable energy sources in Keekonyokie and
Olkeri Wards of Kajiado County?
c) What is the level of adoption of renewable energy in Keekonyokie and Olkeri
Wards of Kajiado County?
1.7 Scope and Limitations of the study
The research was conducted in Keekonyokie and Olkeri Wards, which are in
Kajiado West and Kajiado North constituencies respectively. The study will be
specifically focused on sources of information, levels of awareness and adoption of
biogas, solar, briquettes and wind power in the two Wards.
Kajiado County has unique environmental and climatic conditions which are
favorable for the production of biogas, solar and wind power. This study therefore
cannot be replicated in other counties with different conditions. The study tested
sources of information, levels of awareness and adoption of renewable energy in
Keekonyokie and Olkeri wards of Kajiado County. The indicators that were tested
include age and level of education. However, for future studies, it would be interesting
to find out if other indicators like gender, location, and level of income, profession and

8
cultural background have any kind of influence on people’s sources of information,
level of awareness and adoption of renewable energy.

9
Operational definitions
Renewable energy Energy generated from wind, solar, briquettes and
biogas.
Wind energy A form of energy produced by wind turbines.
Solar Energy A form of energy obtained through panels designed to
absorb the sun’s rays as a source of energy for generating
electricity or heating.
Briquettes Blocks of compressed coal dust used for fuel.
Electricity Power generated from the national electrical grid.

10
CHAPTER TWO
LITERATURE REVIEW
2.0 Overview
This chapter is a review the existing literature on renewable energy. The first
section is a discussion of the theoretical framework and approach, which looks at the
ecological model, the global energy movement and diffusion of innovations theory. The
second section is a review of the global and local situation of renewable energy by
discussing policy and legal frameworks, the cost of renewable energy, its implications
on livelihoods, and the benefits they present to communities that use them. Lastly, it
will look at how sources of information and levels of awareness influence adoption.
2.1 The ecological model
The ecological model describes the relationship between individuals and their
environment. The environment influences individuals’ behaviour and they impact their
environment in turn. As discussed by McLeroy, K. R., Steckler, A. and Bibeau, D.,
(1988), the ecological model exists in five interconnected parts. The first one is the
individual level. The individual facet of the ecological model concerns elements of the
individual such as age, gender, attitudes, skills, beliefs and knowledge. For instance, an
inequality report prepared by Ngugi, (2013) and published by the KNBS showed that
the adoption of more ‘advanced’ energy sources is gender-based. Most of the
households headed by women in Kajiado county use less advanced or traditional
methods as compared to men who use more advanced methods. Other factors such as
knowledge levels might also determine a person’s choice of energy source. For
instance, a person who is well informed about the health risks of using charcoal for
example, may opt for cleaner sources of energy.
The second level of the ecological model is the interpersonal level. This level
is concerned with the formal and informal social networks and social support systems,

11
including friendships, social groups, family, and work groups. For example, if one
member of a family participates in a social group that discusses about renewable energy
sources and their benefits, the individual could share this information with his/her
family and therefore the whole family will benefit from this information that arose from
the social group.
The third level of the ecological model is the institutional/organisational level.
This comprises of social institutions and organisations. For example a school can be
concerned for the wellbeing of children who have shown signs of health complications that
arose from the use traditional energy sources at home. Because of this, they organise classes
that will educate both the children and their parents about other cleaner energy sources for
the families to implement at home. This is an example of the organisational level impacting
families and individuals. The organisational level can include programmes, activities,
policies and resources at a local level.
At the community level, which is the fourth level of the ecological model, are
relationships between these organisations, as well as cultural norms and values. For
example the same school that offers lessons about alternative sources of energy for the
families, may be part of a coalition of community institutions that are trying to improve the
health and quality of life of their community by using cleaner energy sources. Another
factor on this level is to look at the pattern of community behaviour and thought. In the
case of encouraging the use of renewable energy, this concerns the culture of the
community in regard to the type of energy source. For example some communities have
traditional ‘ovens’ made of stones and mud, and are sculpted in a very specific way to keep
food warm throughout the day when they are out in the farm. These ovens use firewood.
It might be difficult to convince locals in that community to change from this to biogas for
example. This is because that will interfere with their social norm.

12
The public policy is at the highest level of the ecological model. They are laws and
regulations that impact the masses. For example, Kajiado County government could enact
polices that allocate funds or resources to social groups or individuals that have shown
initiative towards investing in these types of energy to encourage the people to participate
in economic activities involving renewable energy. Other policies could be those that
restrict behaviour such as cutting down of trees.
2.2 Green energy movement: A global perspective
Renewable energy entails the use of renewable power such as solar, wind,
hydroelectricity, geothermal and combustible renewables such as solid biomass and
liquid biofuels. The primary objective of using renewable energy is to reduce the
dependence on fossil fuels such as coal, petroleum, and diesel since their production
and consumption leads to increased emission of greenhouse gases (GHGs) in the
atmosphere. The World Bank has put great emphasis on sustainable energy because of
its ability to foster economic growth and wider social development. Access to
sustainable energy is crucial input for the attainment of multiple Millennium
Development Goals (MDGs) including poverty and hunger eradication, promoting
gender equality and women empowerment, combating diseases and child mortality, and
promoting environmental sustainability (World Bank, 2013). The World Bank also
recognises that gaining access to reliable power sources such as electricity improves
the quality of life of both adults and children. Introducing modern heating and cooking
solutions such as biogas and briquettes can transform the livelihoods of millions of
livelihoods in developing countries as it eradicates cardiovascular and respiratory
illnesses, which are triggered by the pollution associated with solid fuels such as
firewood and charcoal. Developed and developing countries have adopted renewable
energy in many processes including electricity generation. Statistics from British
13
Petroleum’s (BP) website indicate that renewable energy sources, excluding
hydroelectric energy, was responsible for about 8% of the total electricity generated
around the world in 2016 (BP, 2016). Nevertheless, global power generation increased
by about 40% as a result of renewable energy. Among the countries that lead in
renewable energy consumption include the United States, India, China, Germany,
Brazil, Spain, and the United Kingdom.
2.3 The Diffusion of Innovations theory
The diffusion of Innovations theory was first discussed in 1903 by French
sociologist Gabriel Tarde (Toews, 2003) who contrived the S-shaped diffusion curve,
followed by Ryan and Gross (1943) who introduced the adopter categories that were
later used in the current theory promoted by Everett Rogers. The theory explains how
an idea or product gains momentum and spreads through a definite social system or
population, over time. Katz (1957) is also credited for his introduction of the notion of
opinion leaders and opinion followers and how the media interrelates to influence these
two groups. The Diffusion of Innovation theory is every so often regarded as a valuable
change model for guiding technological innovation where the innovation itself is
modified and presented in ways that meet the needs of people across all levels of the
adopter categories. Apart from this, the theory stresses the importance of
communication and peer networking within the adoption process.
In summary, diffusion of innovation is simply the process that occurs as people
adopt a new way of life, product or idea. Rogers charted out this process, underlining
that in most cases, an initial few are open to the new idea and adopt its use. As these
early innovators ‘spread the word’ more and more people become open to it which leads
to the development of a bigger group of people. Over time, the innovative idea or
product becomes diffused amongst the populace until a saturation point is achieved.

14
Rogers distinguished five categories of adopters of an innovation: innovators,
early adopters, early majority, late majority, and laggards. For the case of renewable
energy for instance, the first individuals who adopt these energy sources are the
innovators. These would be very first individuals to try out renewable energy
technologies like for example briquettes which have only recently gained some
popularity as the best alternative to charcoal and firewood especially for people in rural
areas. Early adopters are those who try out new things and are not afraid to invest in
new products. This group is considerably larger than the ‘innovators’ group and often
they already know much about the product. Because of this knowledge, they play an
important role in word of mouth advertising with respect to the new product. The early
majority group are those that prefer to wait and see before making a purchase. The
product is bought in large numbers by this group of people causing a landslide in
demand. The late majority lags behind and will only buy the product after many other
people have bought it and its popularity is already lessening. The last group, the
laggards, are the group that does not like innovation or change. This group has to be
very sure that they are not making a bad buy. The product is also sold less often in this
‘late majority’ stage. The original five categories are demonstrated in the bell-shaped
curve image below. Rogers estimated the percentage of each category. These
percentages are very similar to the proportions found in a normal bell-curve.

15
Figure 2. 1: Diffusion of innovation adopter categories
Source: Everett Rogers, (1962)
2.4 Renewable energy in Kenya
Despite Kenya’s commitment towards adopting renewable energy, the country
still lags behind in terms of overall capacity consumption. The three primary energy
sources in the country are biomass (75%), petroleum (19%), and electricity (6%). In
their study, Kiplagat, Wang, and Li, (2011) established that the total primary energy
consumption in the country was approximately 3.6 MTOE (Million Tons of Oil
Equivalent) as of 2007. Like in most developing countries, non-commercial biomass
fuels such as charcoal and firewood were mainly consumed in the domestic sector by
households, while the consumption of electricity and petroleum fuels was prevalent in
the commercial, transport, industrial, and agricultural sectors. Despite having only 2%
forest cover, nearly three-quarters of the Kenyan populace rely on biomass in the form
of charcoal and wood fuel for cooking and heating. A report by Kamfor Company Ltd
(2002) revealed that the demand for wood fuel in the country was increasing at about
3% per year while it could only maintain a sustainable supply of 0.6% annually.
Nevertheless, the government of Kenya, through the Ministry of Energy, and
other for-profit and not-for-profit organisations like Hivos are encouraging households

16
to adopt renewable energy technologies to reduce the dependence on fossil fuels and
traditional biomass fuels such as charcoal and wood, which are unclean, inefficient, and
destructive to the environment. Biogas is one example of renewable energy
technologies that have been adopted by households in Kenya. A biogas system derives
energy from the anaerobic fermentation of solid wastes such as dung. During and after
fermentation, the system yields methane, which can be used to produce electrical or
heat power for households. In Kenya, the Kenya National Domestic Biogas Program
(KENDBIP) aims at promoting the use of small-scale biogas systems by households.
The initiative anticipates that encouraging the adoption of this innovation, families will
reduce their dependence on firewood, charcoal, and kerosene (Porras, Vorley, &
Amrein, 2015). According to estimates, Kenya has a biogas potential of serving about
1.25 million households (Kiplagat, Wang, & Li, 2011). This statistic is determined
according to households that have the capability of accessing sufficient dung and water.
The other example of renewable energy with a great potential in Kenya is
briquettes. Briquettes is a sustainable fuel produced by solidifying or compacting
biomass waste from materials such as sawdust, maize cobs, wheat straws, paper, and
coffee husks. These materials are mixed with a binding material like clay and
compacted using a machine (GVEP International, 2010). The resultant material is then
carbonised to eliminate a considerable quantity of smoke, which can pose health
hazards to humans and animals during combustion in indoor settings. The carbonisation
process functions by eliminating volatile compounds to achieve less pure carbon.
2.5 Policy and legal framework
While Kenya has quite a large share of renewable energy power production
(above 60%), it heavily depends on hydro sources to generate its electricity. This trend
has posed numerous challenges in terms of facilitating the provision of secure and
17
reliable energy services. For instance, Kenyan households have faced constant power
rationing during drought seasons as most of the dams do not have enough water for
power generation. Even though the country has not set an official target for renewable
energy, it has outlined several legal and policy frameworks under the Sessional Paper
No. 4 on Energy (2004), the Energy Act of 2006, and the Vision 2030 plan to steer its
populace towards the production and consumption of sustainable energy (Federal
Ministry for Economic Cooperation and Development, 2012). The Energy Act and the
Sessional Paper emphasise the importance of renewable energy sources in facilitating
independent and stable power supply in the country. The Act instructs the Minister of
energy to advocate for the use solar, wind, biogas, and municipal waste among others.
Through the Act, the Ministry of Energy in 2008 and 2010 issued a renewable energy
feed-in tariff policy that would ensure that the Kenya Power Company, the country sole
electricity buyer and distributor, will connect at least 0.3 GW (gigawatts) of wind
energy, 0.2 GW of biomass energy, 0.1 GW of solar energy, 0.1 GW of biogas energy,
and 0.5 GW of geothermal energy into the national grid system by 2028.
In a draft report by the Ministry of Energy and Petroleum (2015) and published
on the Energy Regulatory Commission’s website, the ministry outlined policies in
regard to renewable geothermal, solar and wind energy. The government will continue
to fund and support the development of geothermal power. It will also to promote
research and development in geothermal power production and streamline licensing to
attract investors in the projects. In addition, the government shall enforce compliance
by setting up regulatory requirement to ensure the best technologies are used to develop
geothermal power.
The government shall also promote research and development of biogas
technologies by supporting domestic and community-based programmes that promote

18
the development of biogas systems. It will also oversee the rolling out of biogas
programmes in public institution such as schools, hospitals, and prisons.
In regards to solar energy, the government will oversee awareness programmes
that aim at promoting the use of solar energy in communities. It will also enforce
regulation aimed at building codes on using solar systems to heat water and light
electrical equipment in homes. In addition, the government will promote research and
development on solar technologies in learning institutions. It will also enhance and
enforce penalties for vandalism and theft of solar systems.
The government also oversee the development of institutional capacity for the
use of wind technologies. It will provide organisations with incentives for the
development of wind technologies. It will also invest in transmission lines to facilitate
the linkage of wind energy to the national grid.
2.6 The cost of renewable energy
As stated earlier, the policy and legal frameworks of renewable energy in Kenya
is guided by the Session Paper No. 4 of 2004 and the Energy Act of 2006 respectively.
The government, through the Ministry of Energy, has formulated a feed-in-tariffs (FIT)
policy to improve the generation of renewable energy. The policy outlines the rates to
be charged for every unit of power produced through renewable means. According to a
report by the Energy Regulatory Commission (ERC), Kenya has a wind potential of
about 346 watts per square meter in some areas of Rift Valley, Coast, Nairobi, North
Eastern, and Eastern provinces. Despite this potential, the country has only managed to
harness a capacity of about 5 megawatts in the Ngong Hills wind plants. To mitigate
this situation and enhance the exploitation of wind energy, the Ministry of Energy’s
feed-in-tariff policy charges 12 US cents for every kilowatt-hour (kWh) of electrical
energy supplied and connected to the national grid (Energy Regulatory Commission,
19
2011). This duty applies to wind farms or plants with an effective generation capacity
of between 0.5 MW and 100 MW. In regard to solar photovoltaic cells, the government
allows private organisations a fixed tariff of 20 US cents per kilowatt-hour to supply
solar power. Individual producers are allowed a rate of 10 US cents per kilowatt-hour
for electricity supplied to the national grid. The FIT tariff also allows power suppliers
to supply biomass energy to the national grid at a cost of 8 US cents per kilowatt-hour
(Energy Regulatory Commission, 2011). In regard to geothermal energy, the Ministry
of Energy charges a tariff of 8.5 US cents per kilowatt-hour of electricity for up to 70
megawatts of geothermal power supplied to the national grid. The average cost of
electricity for a single moderate sized household is between ksh 1,000-2,500 per month.
The cost of solar on the other hand is fairly high in the installation stage because
a part from investing on a professional expert, a solar power system consists of several
units including the panel, the battery, a charge controller and an inverter. Depending on
the load, which is the electrical component or portion of a circuit that consumes active
electrical power, the number of batteries, panels and the size of inverter may vary. The
minimal cost of a simple solar power system for a two bedroom house with no electrical
equipment apart from TV and lighting is an average of Ksh 30,000.
According to report by the daily nation on September 8th 2018, to set up a biogas
system, one needs to have a qualified biogas digester designer and equipment. Financial
capability and manure-power consumption rate greatly determines the size of biogas
and therefore, what one can invest. Waste from two cows would produce 12m³ of biogas
which is sufficient an average sized household with two burners for cooking at an
average three hours daily .This would cost an average of Ksh 150,000. The cost of a
briquette compressing machine is about ksh 70,000.

20
2.7 Renewable energy and livelihoods
Renewable energy presents several opportunities to households. For instance, it
has the potential of improving the livelihood of women through economic and social
empowerment. For instance, the prevalent use of briquettes for cooking and heating has
presented an opportunity for women to turn it into an item of trade. Households in rural
and urban areas use briquettes for various domestic purposes including heating and
cooking. In the industrial setting, women who make briquettes can supply them to
poultry farmers who need them to produce warm conditions for their chickens.
Briquettes can also be sold to institutions such as schools and prisons that cook in mass
as a replacement for unclean wood fuel. Households that manufacture briquettes can
also export them to western countries for home heating during winters.
The use of sustainable energy also empowers women socially. For instance, the
use of biogas improves the self-esteem of households as it gives them the feeling that
they are leading healthy and positive lifestyles. Unlike wood fuel and charcoal, which
pollute indoor cooking environments, women who use biogas spend less amount of
time heating water and cooking meals for their families. They can, therefore, spend the
spared time attending to other chores or social activities such as school functions,
church, and women groups. They also do not have to worry about the spiraling costs of
liquefied petroleum gas (LPG) and kerosene as biogas is relatively cheaper.
2.8 Benefits of renewable energy
Renewable energy has presented many benefits to Kenyans. For instance, it has
led to the creation of employment opportunities for people who were previously jobless.
As discussed earlier, individuals and organisations have ventured into the briquette
business to generate income. In their report, Cohen and Marega, (2013) found that the
briquette business in Kenya employs between 9 and 80 people per enterprise. Evidently,

21
this business presents individuals with an opportunity to earn income as laborers,
distributors, brokers, or owners. Second, renewable energy benefits households as it
gives them an opportunity to diversify their energy supplies. As discussed earlier, about
75% of Kenyans depend on biomass (wood fuel and charcoal), petroleum (19%), and
electricity (6%) as their energy sources. New renewable energy technologies such as
briquettes, biogas, and solar power allow them to reduce their overdependence on these
sources. For instance, the installation of biogas systems in homes can provide
households with alternatives for heating and cooking in case kerosene prices rise or
weather conditions make charcoal or wood fuel inaccessible. Solar power might also
help small-scale households in lighting in places where electricity is inaccessible. As
documented earlier, only one-fifth of Kenyan are connected to the national grid. Third,
renewable energy improves the health of households. Renewable energy technologies
such as biogas, solar, wind, and briquettes are cleaner than charcoal, wood fuel, and
kerosene. Thus, communities that use them are likely to avert cancer, respiratory, and
other smoke-induced illnesses. Fourth, renewable energy reduces carbon emissions and
environmental degradation. As discussed earlier, while Kenya has a forest cover of only
2%, nearly three-quarters of its population rely on wood and charcoal fuel as the
primary source of energy. Naturally, the reliance on these archaic fuels results in the
depletion of forests, thus, causes environmental degradation. Therefore, adopting
renewable energy technologies will ensure our environment is protected for future
generations.
2.9 Sources of information and levels of awareness for renewable energy
Few studies have been done targeting information sources and levels of
awareness on renewable energy, however there are a few studies that have been done
relating to sources of information and levels of awareness in different sectors. A study
22
done by Scholars at the University of South Africa and University of Zululand, sought
to establish sources and channels of information access and use in the information and
knowledge society; a case of informal sector women entrepreneurs. The study found
that, although informal sector entrepreneurs possessed some information and
communication technologies, their location, demographic composition, poor education,
low economic status and occupation, negatively affect their ability to benefit fully from
the information and knowledge society. (Veli, J. Janneke, M. Mabel, M & Dennis. O,
2012). From this study, it is clear that information technologies play a vital role in
facilitating the creation, distribution, use, integration and manipulation of information
at a rapid speed, making it easier to choose from different sources presented by this era.
Another study done by Abdul Azeez O. Emmanuel and Fulorusho M. Ajide, (2015)
investigated the levels of awareness and prevailing attitudes of the people of Oshodi,
Nigeria towards biofuel energy. The study showed that 75% of the residents were aware
about biofuel energy while a further 65% were willing to use the technology if it
becomes available and an even greater number of respondents were willing to pay extra
for their household to have biofuel energy.
2.10 Word of mouth as a source of information
A few studies have also been conducted to evaluate different sources of
information. Jagdish N Sheth discusses three areas of research which provide a bulk of
evidence to support the powerful role that word of mouth plays in the diffusion of
innovations though an individual becomes aware of an innovation mostly from mass
media, it is the word of mouth sources that are mostly utilised by the buyer at the critical
stage of evaluating the innovation (Rodgers, 1962).
The second area of research is the hypothesis of the two step flow of
communication which asserts that the mass media influences a small group of

23
individuals called opinion leaders, who in turn influence the masses (already aware of
the innovation) to adopt the innovation (Katz ,1957). This finding provides evidence
that community leaders have a lot of influence in driving change among in
communities. In the case of Olkeri and Keekonyokie wards, local leaders can be very
important in encouraging adoption of innovations on renewable energy.
The third area of research is discusses the influence of reference groups in the
acquisition of products and services including innovation (Brooks & Bourne, 1957).

24
CHAPTER THREE
METHODOLOGY
3.0 Overview
This chapter focuses on the methodological approach of the study. The
researcher discusses the study design, the location of the study, the research approach,
data types and sources, population and sample, data collection tools and validity of the
instruments used. This study is useful for researchers looking to analyse quality and
quantity of information regarding renewable energy in Keekonyokie and Olkeri Wards
in Kajiado County.
3.1 Study design
The design of a study refers to the way a researcher guards against, and tries to
rule out, alternative interpretations of results (Punch, 2005). This study utilises
sequential explorative design. The researcher collected and analysed the quantitative
(numeric) data first. This was obtained by the use of questionnaires. The quantitative
data explores the sources of information and levels of awareness of renewable energy
in relation to the demographics of the participants.
The qualitative data was collected in the second phase to help explain or
elaborate on the quantitative results obtained in the first phase. The second, qualitative
phase builds on the first quantitative phase and the two phases are connected in the
intermediate stage in the study. The rationale for this approach is that the quantitative
data and their subsequent analyses provide general information about sources of
information for renewable energy in the two wards and the qualitative data and their
analyses refine and explain those statistical results by exploring participant’s views in
more depth through key informant interviews.

25
3.2 Study site and population
The study took place in Keekonyokie and Olkeri Wards in Kajiado County.
Keekonyokie is located in Kajiado West Constituency while Olkeri ward is located in
Kajiado North Constituency. The unit of analysis for quantitative data is households.
Keekonyokie ward has approximately 9,328 households while Olkeri ward has 11,049
households. Questionnaires were administered to a sample of this population in order
to obtain quantitative data. For qualitative data, key informant interviews were carried
out on a selected sample of four individuals.
3.3 Research approach
The mixed method approach was used in this research. As Creswell and Plano
Clark (2007) state: “The term ‘mixed methods’ refers to a methodology of research
that advances the systematic integration, or ‘mixing,’ of quantitative and qualitative
data within a single investigation or sustained program of inquiry. The basic premise of
this methodology is that such integration permits a more complete and synergistic
utilisation of data than using either quantitative or qualitative data collection or analysis
individually”.
There are many advantages to using a mixed method approach, one being that
it helps to provide a more in-depth understanding of the problem as well as provide rich
datasets. It also assists to increase the reliability and credibility of findings through
triangulation. Triangulation in research is the use of more than one approach to
researching a question, (Cohen & Manion, 2000). The objective is to increase validity
in the findings through the validation of a proposition using more than one measure.
The combination of findings from two or more rigorous approaches provides a more
comprehensive picture of the results than either approach could do alone.

26
3.3.1 Quantitative data
Quantitative data was obtained by carrying out a survey. This quantitative
approach was mainly targeted at quantifying frequencies on information sources, levels
of awareness and levels of adoption of renewable energy in relation to the demographics
of the public. The quantitative data was used to convey facts and reveal patterns in this
research by producing results that generalise results from a larger sample population,
compare and summarise.
Questionnaires were the instruments of data collection. These questionnaires
were distributed to individuals in homesteads which were sampled according to sub
locations. Each sub location was represented by 44 households. Each individual who
received the questionnaires represented a single household. The questionnaires had four
sections. The first section (A) contains biographical information which included name,
age, and area of residence and level of education. The second section (B) contains
information about levels of awareness and information sources. The third section (C)
contains information about sources of energy for daily needs while the last section (D)
contains information about factors influencing choice of energy for daily needs.
3.3.2 Qualitative data
Qualitative data was obtained from key informant interviews and was designed
to provide responses to questions that arise from findings obtained from quantitative
data. It was also designed to gather expert opinion about sources of information,
awareness levels and levels of adoption of renewable energy in the area. The researcher
will use an interview guide to collect qualitative data. The information derived from the
interviewees were aimed at revealing expert opinion on the different sources of
information, levels of adoption and factors influencing this adoption. The interviews
also sought to find out if there are any communication campaigns in the area that have
27
been used by stakeholders to encourage the use of renewable energy. In addition to this,
the interview also sought to find out, from the key informant interviews, if there are any
organisations that are actively involved in the promotion of renewable energy in the
area. Apart from this, the study also sought to find out from the key informant
interviews if there are any socio -economic activities associated with renewable energy
and finally, their expert opinion on what can be done to improve awareness and
ultimately, adoption of renewable energy.
The researcher used an interview guide (See Appendix II) to help her ask
specific questions relating to the research objectives. After a prior arrangement on
phone, the researcher met with participants at an agreed venue and time for the key
informant interviews. An audio recorder was used to record the interviews which were
later transcribed. The interviews took place in three different locations. The first one
was at the Ngong Hills wind power station. There, the researcher interviewed a member
of staff of Ken-Gen who is an operations manager. The second interview took place at
the Keekonyokie slaughter house where two administrators were interviewed. The third
respondent was a resident in Olkeri Sub location who makes briquettes out of charcoal
dust and uses the briquettes for his chick farming business.
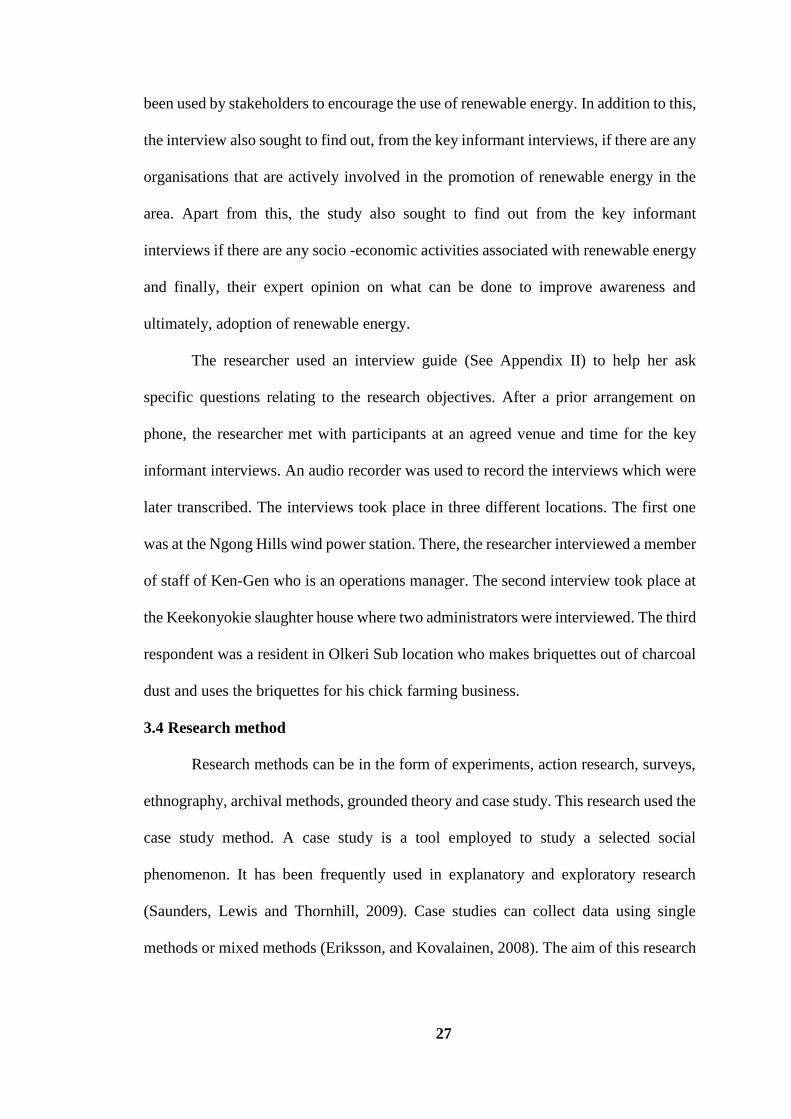
3.4 Research method
Research methods can be in the form of experiments, action research, surveys,
ethnography, archival methods, grounded theory and case study. This research used the
case study method. A case study is a tool employed to study a selected social
phenomenon. It has been frequently used in explanatory and exploratory research
(Saunders, Lewis and Thornhill, 2009). Case studies can collect data using single
methods or mixed methods (Eriksson, and Kovalainen, 2008). The aim of this research

28
was to have data that would unearth sources of information, levels of awareness and
levels of adoption of renewable energy in Keekonyokie and Olkeri Wards.
3.5 Data types and sources
Both surveys and key informant interviews provided primary data. Quantitative
data was obtained from the use of questionnaires. These questionnaires were filled by
individuals aged 15-65 and who were sampled by households and gender. Qualitative
data was obtained from key informant interviews. Participants for key informant
interviews were members of staff at the Ngong Hills Power station and Keekonyokie
slaughter house which hosts the Keeko –Bio project. One resident in Olkeri ward was
also interviewed. He is involved with the production of briquettes.
3.6 Sample size and sampling procedure and data collection
Sampling is the process of selecting a few (a sample) from a bigger group (the
sampling population) to become the basis for estimating or predicting the prevalence of
an unknown piece of information, situation or outcome regarding a bigger group.
(Kumar, 2005).
3.6.1 Sample size
Olkeri Ward has a total of 11,049 households while Keekonyokie Ward has
9,328 households. The total population for the two wards is 20,377 households.
The sample size for the two wards was calculated collectively using Yamane’s
sample calculation formula.
Therefore:
𝒏 =𝑵
𝟏 + 𝑵(𝒆)𝟐
Where 𝒏 = 𝒄𝒐𝒓𝒓𝒆𝒄𝒕𝒆𝒅 𝒔𝒂𝒎𝒑𝒍𝒆 𝒔𝒊𝒛e,𝑵 = 𝑷𝒐𝒑𝒖𝒍𝒂𝒕𝒊𝒐𝒏 𝒔𝒊𝒛𝒆 𝒂𝒏𝒅 𝒆 =
𝒎𝒂𝒓𝒈𝒊𝒏 𝒐𝒇 𝒆𝒓𝒓𝒐𝒓(𝑴. 𝒐. 𝑬) = 𝟎. 𝟎𝟓 𝒃𝒂𝒔𝒆𝒅 𝒐𝒏 𝒕𝒉𝒆 𝒓𝒆𝒔𝒆𝒓𝒄𝒉 𝒄𝒐𝒏𝒅𝒊𝒕𝒊𝒐𝒏𝒔.

29
𝟐𝟎, 𝟑𝟕𝟕
𝟏 + 𝟐𝟎, 𝟑𝟕𝟕(𝟎. 𝟎𝟓𝟐)
𝒏 = 𝟑𝟗𝟖
3.6.2 Sampling procedure
The study used purposive sampling for qualitative data while cluster sampling,
which is a probability sampling technique, was used for quantitative data. ‘For a
sampling design to be called a random or probability sample, it is imperative that each
element in the population has an equal and independent chance of selection in the
sample.’(Kumar, 2005). A sample of 398 households was used for the survey. These
households were clustered according to the sub-locations within the two wards.
3.6.2.1 Cluster sampling
Cluster sampling involves dividing a sample population into groups. In this
study, the sample population which is 398 household units were be divided according
to sub-locations within the two wards. According to information obtained from soft
Kenya website, Olkeri ward has a total of six sub-locations namely Matasia, lower
Matasia, Nkoroi, Olosurutia, Kahuho and Olkeri. While Keekonyokie has three sub
locations namely Keekonyokie, Oloikarere and Olosharo. 44 respondents were picked
purposively for each cluster. Each cluster was represented by 44 households. Each
household was represented by one respondent aged 18-64.
3.6.2.2 Purposive sampling
Purposive sampling was used to select respondents for qualitative data. Four
respondents were chosen for key informant interviews. Two of these respondents were
from Keekonyokie slaughter house which is host to the Keeko biogas project. One was
from Ngong Hills wind power station, and the final respondent was a resident of Olkeri
ward.

30
3.6.3 Data collection
The researcher started by collecting quantitative data from 398 respondents in
the two wards. This sample population was divided into clusters. Each of the clusters,
was represented by a single sub location. Both Keekonyokie and Olkeri are peri-urban
areas and some areas, especially around the shopping centres, are very populated with
the main housing units being rental houses. The researcher excluded rental apartments
and single room units that were within the shopping centres and concentrated on free
hold homesteads in the surrounding areas. This is because there is a higher probability
of integrating these sources of energy in free hold homesteads rather than rental housing
units where the main sources of energy is electricity for lighting and LPG gas for
cooking. This ensured that the information obtained from the respondents was not
homogeneous.
The researcher also excluded respondents that were younger than 18 years of
age, where necessary, the researcher and her four research assistants would help
respondents understand the questions by explaining or translating the questions. This
was especially for respondents who were poor in English. It was however noted that a
majority of the respondents were able to communicate in these two languages.
The researcher and her assistants accessed respondents by going door to door.
They would knock on the gates or doors of residents and started by introducing
themselves and the purpose of the visit. If the respondents agreed to it they would
proceed to give them questionnaires. Where respondents did not meet criteria for
selection, for instance when they found children the researcher and her assistants would
ask if there is any adult around, if not, they would leave. The survey started from
Keekonyokie sub location which is known for Keeko Biogas project at the
Keekonyokie slaughter house. The Keekonyokie slaughter house is located in a

31
somewhat populated shopping centre with many housing units being business premises
and rental houses. Although the Keekonyokie slaughter house is the main centre of
activity, the researcher did not focus here, instead she sought respondents in the
surrounding, less populated areas. The researcher then proceeded to Kahuho and Nkoroi
sub locations which are located along Magadi Road. (See appendix IV: Line transect of
Keekonyokie and Olkeri wards).The other sub locations which are located along Forest
line Road followed. These were Oloosurutia,lower Matasia Upper Matasia and Olkeri.
Lastly, the researcher concluded with Olosharo and Oloikarere Sub-locations which
were more remote. For qualitative data, the researcher pre-arranged the key informant
interviews on phone after obtaining the respondents’ phone numbers during a pre-visit.
On the date of the interviews. The researcher communicated with the interviewees on
phone and agreed on the venue and time of the interviews. The interviews were
recorded on a mobile phone voice recorder.
3.7 Data collection tools
The main tools of data collections were questionnaires and interview guides. According
to Wellington (2000), in carrying out a research, a researcher should use methods which
provide high accuracy, generalisability and explanatory power with minimum
management. The instruments supplement each other to close the gap which might be
left if one instrument only is used. The researcher was guided by the study objectives
when constructing these instruments.
3.7.1 Structured questionnaires
This study utilised self-administered questionnaires. The questionnaire (See
appendix I) contained close ended questions which were specifically designed to
provide answers to the research questions. The questionnaires were evenly distributed
according to gender and sub locations. Since the unit of analysis was households, each

32
questionnaire represented a single household. The researcher then collected the filled
questionnaires immediately to avoid losing track of the respondents, and to save time.
3.7.2 Interview guide
For the key informant interview, the researcher used an interview guide (See
appendix 2) to help her ask specific questions relating to the research objectives. After
a prior arrangement on phone, the researcher met with participants at an agreed venue
and time for the key informant interview. A mobile phone audio recorder was used to
record the interviews which were later transcribed.
3.8 Validity and reliability of the instruments
Validity, within the context of mixed methods is the ability of the researcher to
draw meaningful and accurate conclusion from all of the data in the study (John W
Cresswell, 2007) in terms of measuring procedures, validity is the ability of an
instrument to measure what it is designed to measure (Smith, 1991). In this study,
validity of the instruments will be measured by establishing a rational link between the
questions and the objectives of the study. Items and questions will be designed to cover
the full range of the issue or attitude being measured. In addition, the researcher ensured
that the coverage of each issue or attitude is balanced; that is, each aspect will had
similar and adequate representation in the questions or items.
3.9 Data analysis
The analysis was done systematically as per the objectives of the study. Since it
was a sequential analysis, quantitative data was analysed first then followed by
qualitative data. Quantitative data collected using questionnaires was processed by
coding the closed ended questions and entering the data into the computer. This was
analysed using the SPSS program.Qualitative data was recorded, transcribed and
organised into themes.

33
3.10 Data presentation
Qualitative data was presented descriptively while quantitative data was
presented in frequency tables, graphs and charts. Quantitative data that were collected
using questionnaires was processed by coding the closed ended questions and entering
the data into the computer to run a descriptive analysis including frequencies,
percentages and graphs. Finally, summary, conclusion and recommendations of the
study is discussed in chapter 4 and 5.
3.11 Ethics
The importance of ethical considerations is that they provide guidelines for the
researcher to abide by while conducting the study. Furthermore, they ensure that trust
and accountability are assured for the participants of the research. This study was
carried out within specific ethical guidelines. The aim of this study was communicated
to participants prior to engaging them in the research. Participants were assured of their
privacy and participation was purely voluntary. The participants were also well assured
that confidentiality and privacy would be maintained. The questionnaire did not include
the address of the participants and names were optional. They were requested to give
their consent to participate.
Before commencing field work, the researcher obtained a dully signed and
stamped Certificate Of Field work (Appendix V ) from the School of Journalism
before proceeding to the field for collection of data. After a successful completion
and submission of the study, a declaration of Originality Certificate (Appendix VI) was
also issued to the researcher after inspecting, verifying and approving the originality of
the study. A Certificate Of Corrections (Appendix VII) was issued to the researcher
from the School of Journalism and Mass communication upon successfully effecting

34
the recommendations as proposed by the University of Board of Examiners after the
final study defence.

35
CHAPTER FOUR
DATA PRESENTATION, ANALYSIS AND INTERPRETATION
4.0 Overview
This chapter discusses data representation, analysis and interpretation of sources
of information, levels of awareness and levels of adoption of renewable energy in
Keekonyokie and Olkeri Wards. While there are a wide variety of renewable energy
sources, this study focuses on wind, solar, biogas and briquettes. The final product of
wind and solar energy is electrical power but according to this study, electricity is
defined as energy obtained from the national power grid, which could, in fact, include
wind and solar energy. In this study though, wind and solar energy does not include
that which is part of the national power grid; it is rather that which is generated in small
scale by individuals.
A study by the Kenya National Bureau of Statistics (KNBS) in 2013 showed
energy distribution for cooking and lighting in Olkeri and Keekonyokie wards.
According to the findings, it is clear that adoption of renewable energy sources was still
very low. Figures 4.1, 4.2, 4.3 and 4.4 illustrate this.
Figure 4. 1: Sources of cooking fuel in Olkeri Ward
Source: KNBS, (2013)
1.3
20.2 21.4
1.7
20.1
35
0.1 0.20
5
10
15
20
25
30
35
40
Electricity Paraffin LPG Biogas Firewood Charcoal Solar Other
Per
can
tage
Source of energy
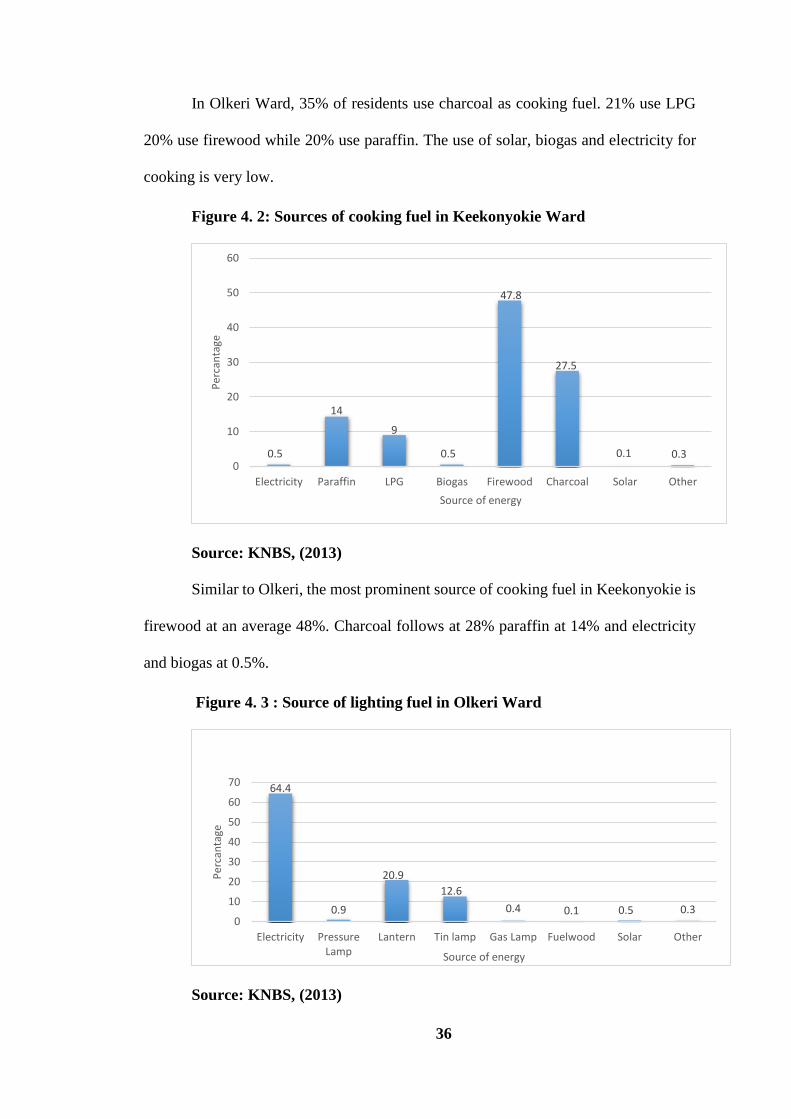
36
In Olkeri Ward, 35% of residents use charcoal as cooking fuel. 21% use LPG
20% use firewood while 20% use paraffin. The use of solar, biogas and electricity for
cooking is very low.
Figure 4. 2: Sources of cooking fuel in Keekonyokie Ward
Source: KNBS, (2013)
Similar to Olkeri, the most prominent source of cooking fuel in Keekonyokie is
firewood at an average 48%. Charcoal follows at 28% paraffin at 14% and electricity
and biogas at 0.5%.
Figure 4. 3 : Source of lighting fuel in Olkeri Ward
Source: KNBS, (2013)
0.5
14
9
0.5
47.8
27.5
0.1 0.30
10
20
30
40
50
60
Electricity Paraffin LPG Biogas Firewood Charcoal Solar Other
Per
can
tage
Source of energy
64.4
0.9
20.9
12.6
0.4 0.1 0.5 0.30
10
20
30
40
50
60
70
Electricity PressureLamp
Lantern Tin lamp Gas Lamp Fuelwood Solar Other
Per
can
tage
Source of energy

37
Electricity is the main source of lighting fuel in Olkeri Ward, leading at an
average of 64%. Lantern follows at 21% and tin lamp at 13%.
Figure 4. 4 : Source of lighting fuel in Keekonyokie Wards
Source: KNBS, (2013)
From the graphs, it is clear that the use of solar and biogas, which are part of
green energy sources on this study; were still very low as of 2013. It is also clear that
although most residents have access to electricity, it is mainly used for lighting. Most
people do not use electricity for cooking probably because of cost implications. They
have opted for cheaper alternatives such as charcoal and firewood which are unclean
and harmful to the environment.
According to the questionnaires (for individual households) and interview
schedule (for key informants), the data was represented in four sections. The first
section was the demographic characteristics of the respondents, this included age, and
level of education. The second section looked at the levels of awareness and sources of
information for renewable energy, the third section looked at sources of energy for daily
needs while the fourth section will be a cross analysis. It is however important to note
that electricity, which is the major source of lighting in the two regions, (KNBS, 2013)
36.8
0.9
23.1
34.7
0.91.6 1.7 0.2
0
5
10
15
20
25
30
35
40
Electricity PressureLamp
Lantern Tin Lamp Gas Lamp Fuel wood Solar Other
Per
can
tage
Source of energy

38
was largely excluded in this study. This is because the study was focused on alternative
sources of renewable energy that the locals can generate for themselves. LPG gas was
also largely excluded in the study because it is neither unclean nor renewable. These
sources of energy have however been mentioned in instances that show peoples energy
preferences for purposes of comparison.
4.1 Sample size and response rate by place of residence
The study was conducted in two Wards, Keekonyokie and Olkeri. A total of 398
respondents filled questionnaires. A sample size of 216 respondents participated in the
study in Olkeri and 182 represented Keekonyokie. Out of this, there was a total of 300
valid responses. 163 came from Olkeri and 137 were from Keekonyokie. Invalid
responses came from unfilled questionnaires or questionnaires with missing
information on age and level of education. Age and level of education was important
for the researcher because she used these two indicators for the cross analysis. The total
number of invalid questionnaires were 98. These were discarded.
Table 4. 1: Population distribution, sample size and response rate
Ward Sample Size Response rate
No. Percent No. Percent
Olkeri 216 54.3 163 41.0
Keekonyokie 182 45.7 137 34.4
Total 398 100.0 300 75.4
Source: Field survey, 2018
4.2 Age distribution by percentage
A majority of the population was 18-29 years. This was the highest majority
which represented 38.5% of the entire population. Respondents aged 30-39 years
followed at 30.3 % then 40-49 years at 21.6%. 50-59 years at 6.9 % and finally 60 and
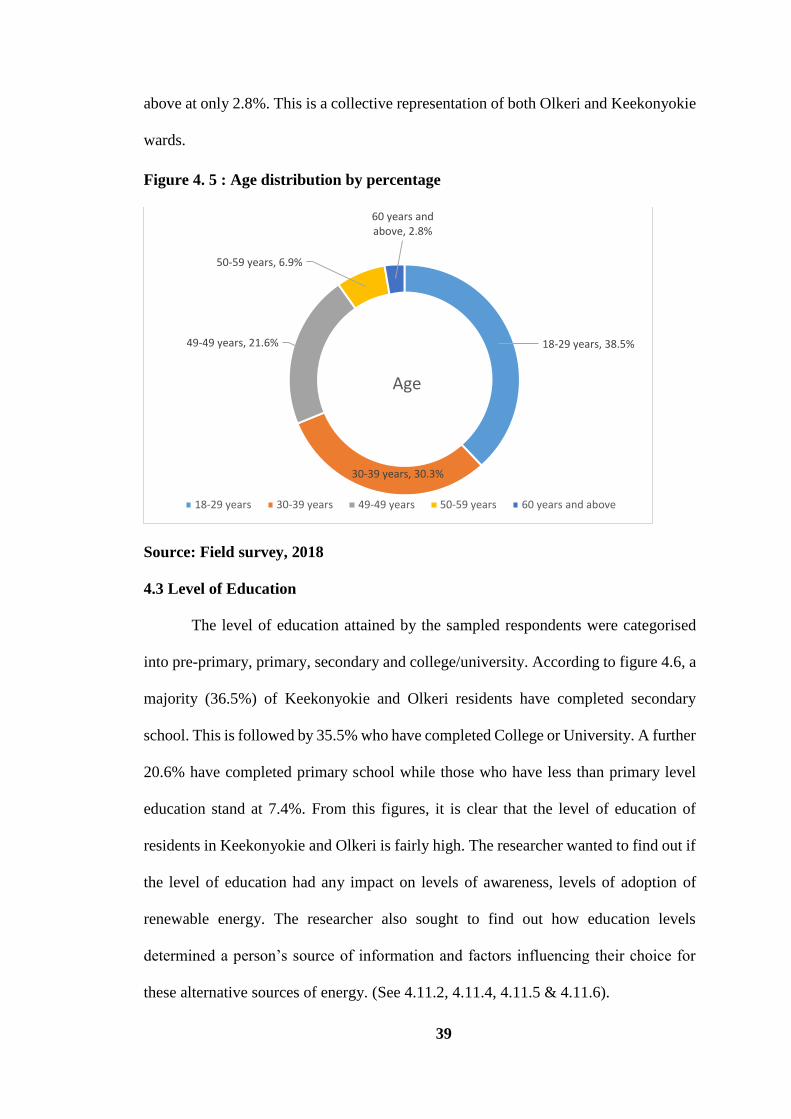
39
above at only 2.8%. This is a collective representation of both Olkeri and Keekonyokie
wards.
Figure 4. 5 : Age distribution by percentage
Source: Field survey, 2018
4.3 Level of Education
The level of education attained by the sampled respondents were categorised
into pre-primary, primary, secondary and college/university. According to figure 4.6, a
majority (36.5%) of Keekonyokie and Olkeri residents have completed secondary
school. This is followed by 35.5% who have completed College or University. A further
20.6% have completed primary school while those who have less than primary level
education stand at 7.4%. From this figures, it is clear that the level of education of
residents in Keekonyokie and Olkeri is fairly high. The researcher wanted to find out if
the level of education had any impact on levels of awareness, levels of adoption of
renewable energy. The researcher also sought to find out how education levels
determined a person’s source of information and factors influencing their choice for
these alternative sources of energy. (See 4.11.2, 4.11.4, 4.11.5 & 4.11.6).
18-29 years, 38.5%
30-39 years, 30.3%
49-49 years, 21.6%
50-59 years, 6.9%
60 years and above, 2.8%
Age
18-29 years 30-39 years 49-49 years 50-59 years 60 years and above
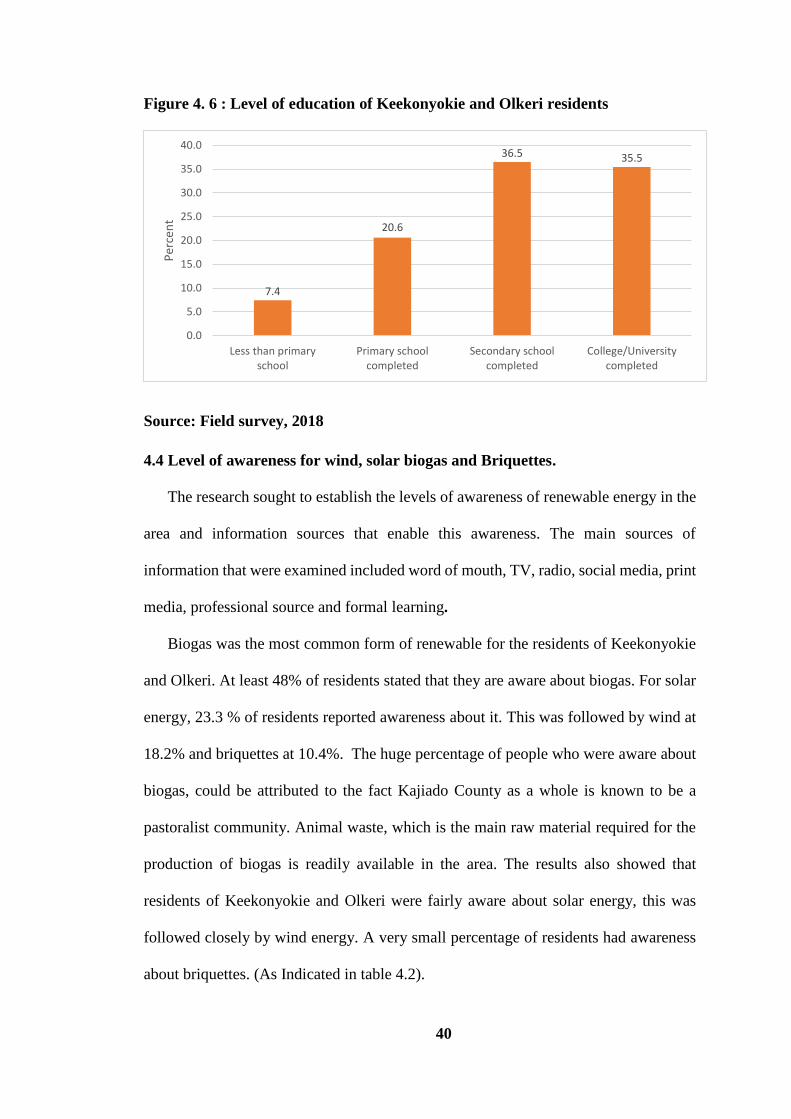
40
Figure 4. 6 : Level of education of Keekonyokie and Olkeri residents
Source: Field survey, 2018
4.4 Level of awareness for wind, solar biogas and Briquettes.
The research sought to establish the levels of awareness of renewable energy in the
area and information sources that enable this awareness. The main sources of
information that were examined included word of mouth, TV, radio, social media, print
media, professional source and formal learning.
Biogas was the most common form of renewable for the residents of Keekonyokie
and Olkeri. At least 48% of residents stated that they are aware about biogas. For solar
energy, 23.3 % of residents reported awareness about it. This was followed by wind at
18.2% and briquettes at 10.4%. The huge percentage of people who were aware about
biogas, could be attributed to the fact Kajiado County as a whole is known to be a
pastoralist community. Animal waste, which is the main raw material required for the
production of biogas is readily available in the area. The results also showed that
residents of Keekonyokie and Olkeri were fairly aware about solar energy, this was
followed closely by wind energy. A very small percentage of residents had awareness
about briquettes. (As Indicated in table 4.2).
7.4
20.6
36.5 35.5
0.0
5.0
10.0
15.0
20.0
25.0
30.0
35.0
40.0
Less than primaryschool
Primary schoolcompleted
Secondary schoolcompleted
College/Universitycompleted
Per
cen
t

41
Four key informants were interviewed. Two administrators at Keekonyokie
slaughter house, the third respondent, is in charge of maintenance and daily operations
at Ngong Hills wind power station and the fourth one is a resident in Olkeri, who
produces briquettes for his chic farming business. The respondent from Ngong Hills
wind power station stated that the media has been very instrumental in providing
information about KENGENs efforts to diversify its energy mix to include wind power
which currently contributes to about 10% of the total electric energy supply in the
country. The respondent also added that KENGEN has a Corporate Social
Responsibility (CSR) department whose main purpose is to educate the community
about the importance of conserving the environment through the use of clean energy
sources and the need by the government to achieve vision 2030 through generation of
electricity. He further stated that although residents in the area may be aware of
alternative clean sources of energy like wind and solar, they do not necessarily have an
in depth understanding of these technologies and therefore awareness may not
automatically lead to adoption. In the case of wind, solar, biogas and briquettes, the
community around Olkeri and Keekonyokie would need interpersonal means of
communication to enable physical demonstrations that may be critical in enabling a
better understanding of these technologies. The informant however acknowledges that
the level of awareness about green energy is also influenced by the level of education
of individuals. This coincided with the results of the study (See discussion on
4.11.2).From the findings on level of education in figure 4.6, it was shown that more
than 50 % of the residents in Keekonyokie and Olkeri have at least attained a secondary
level education. This shows that the level of education in the Keekonyokie and Olkeri
is fairly high. The question however, is whether level of education also is a major factor
influencing people’s choice of energy. (See discussion on 4.11.6)

42
Table 4. 2: I am aware about the following sources of renewable energy
Source of Energy Frequency Percent
Wind energy 79 18.2
Solar energy 101 23.3
Biogas 208 48.0
Briquettes 45 10.4
Total 433 100.0
Source: Field survey, 2018
The second respondent, a local who is involved with briquette production stated
that people within Olkeri area do not have proper knowledge about green energy. In his
neighbourhood for example, a few people have only recently begun to embrace this
type of energy after he introduced it to them. He gained interest in briquette production
after his chicks died from carbon monoxide poisoning. He had to seek an alternative
source of energy and briquettes was the best option since it burns longer and does not
produce smoke or carbon monoxide. He thinks that the media can be very instrumental
in promoting these types of energy, although he has seen some advertisements on TV
and social media, these were mainly by individuals and small business people. He
thinks the Government has a greater capacity to scale up awareness through media
promotion. He further suggested that the government can also, through relevant
departments that are close to the people, organise market demonstrations to show the
general public how briquettes are made and how they are used.
4.5 Main source of information for wind, solar biogas and briquettes
The results in this study show that word of mouth is the most common source
of information for renewable energy as reported by 31.9% of the respondents, is word
of mouth. This finding is in agreement with Jagdish N Sheth (1969) whose study on
43
‘Word of mouth in low risk innovations’ found three areas of research that provide a
bulk of information to support the existence of the powerful role that word of mouth
plays in the diffusion of innovations. The first area asserts that although people become
aware of an innovation mostly from the mass media, it is word of mouth sources which
are mostly utilised by the buyer at the critical stage of evaluating the innovation
(Rogers, 1962). It will be noted that if all media channels in this study were to be
combined, they would together have a considerably larger percentage as sources of
information for renewable energy. It is therefore true that most people become aware
about new innovations from the media, but few can agree on a specific media type;
however, a very large percentage agree on word of mouth as being their main source of
information for these innovations.
Other sources of information identified by respondents included the Tv, radio,
social media, print media, professional source and formal learning. From the key
informant interviews, one respondent who makes briquettes for his chic farming
business stated that through his briquette business, neighbors have become aware about
this type of energy through word of mouth. He has received positive feedback from
neighbors who have tried his product. He also said that the media is an important source
of awareness because of its capacity to reach a greater audience.
Another respondent from Keeko Biogas project noted that residents in the
surrounding area are pretty conscious about biogas due to the frequent attention the
slaughterhouse has received locally and beyond. Although he was not sure about levels
of awareness beyond Keekonyokie, he noted that efforts have been made by various
interest groups to educate the community within the area about biogas production and
some have even provided resources to some residents for this objective. Regarding the
media as a source of information, he had a rather controversial response. He stated that

44
Keeko biogas project has gained some media attention, different media personalities
and stakeholders have visited the project site to get more insight about the project.
Despite this publicity, they are yet to reap any benefits. First, researchers who have
visited the site never bring back any feedback for the information they gather, media
personalities also make news stories and documentaries about the project but instead of
getting positive attention, they have accused the media of stealing their ideas and selling
them to competitors. For this reason, they no longer allow the media in the premises.
He further stated that many researchers have also visited the site for information about
the project but none of them have ever given them any feedback. Because of this, he
was reluctant to divulge information about the project itself and only mentioned that
although have made steps towards commercialising the biogas, they have still not met
prerequisite standards to package and sale. They are currently only using the biogas
project as a waste management system and not a source of energy.
A key informant from Ngong Hills wind power station noted that KENGEN has
a CSR programme whose main aim is to educate the public about green energy by
organising gatherings with the local community leaders. This observation supports the
second area of Jagdish N Sheth’s research on which asserts that mass media influences
a small group of people called opinion leaders who in turn influence the masses through
word of mouth (Katz, 1757). This is also in agreement with the third area of research
which found that reference groups can influence the acquisition of products and
services including innovations. (Brooks 1957; Bourne 1957). Television was also
ranked relatively high followed by formal learning social media, radio and print media
respectively.
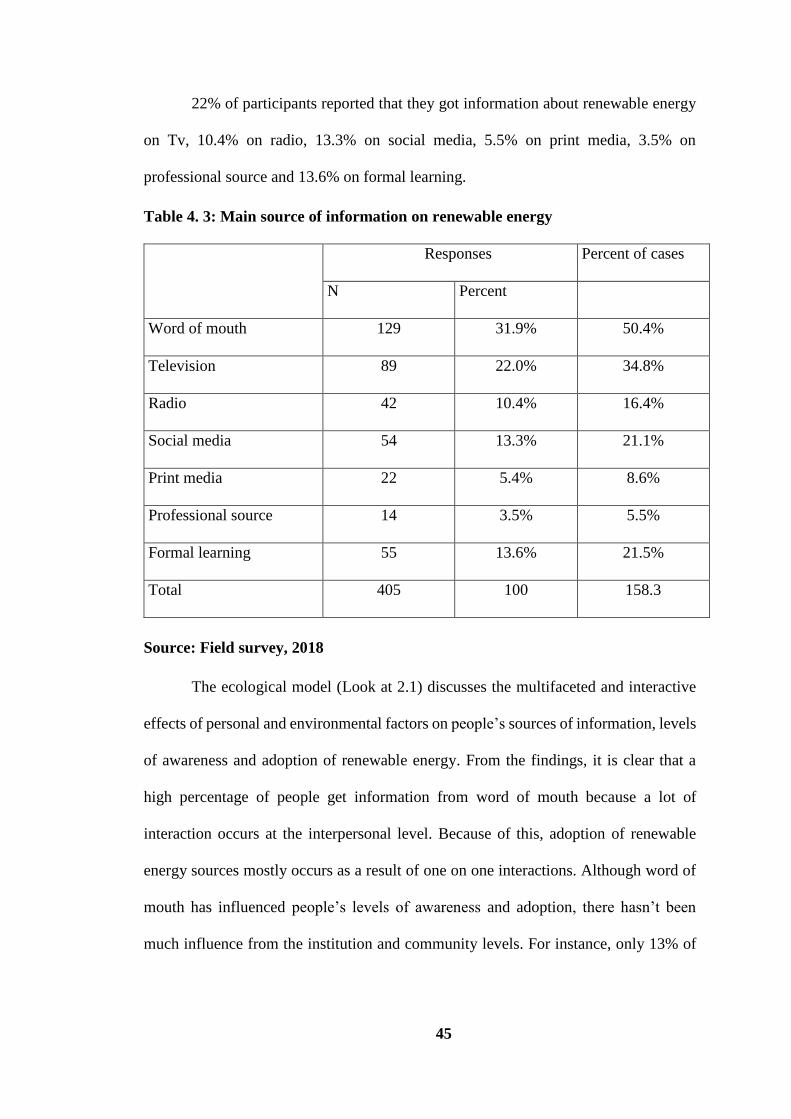
45
22% of participants reported that they got information about renewable energy
on Tv, 10.4% on radio, 13.3% on social media, 5.5% on print media, 3.5% on
professional source and 13.6% on formal learning.
Table 4. 3: Main source of information on renewable energy
Source: Field survey, 2018
The ecological model (Look at 2.1) discusses the multifaceted and interactive
effects of personal and environmental factors on people’s sources of information, levels
of awareness and adoption of renewable energy. From the findings, it is clear that a
high percentage of people get information from word of mouth because a lot of
interaction occurs at the interpersonal level. Because of this, adoption of renewable
energy sources mostly occurs as a result of one on one interactions. Although word of
mouth has influenced people’s levels of awareness and adoption, there hasn’t been
much influence from the institution and community levels. For instance, only 13% of
Responses Percent of cases
N Percent
Word of mouth 129 31.9% 50.4%
Television 89 22.0% 34.8%
Radio 42 10.4% 16.4%
Social media 54 13.3% 21.1%
Print media 22 5.4% 8.6%
Professional source 14 3.5% 5.5%
Formal learning 55 13.6% 21.5%
Total 405 100 158.3

46
residents reported awareness from formal learning, and 3.5% from professional
sources.
4.6 Quality of information sources
Participants indicated their level of agreement in regards to the information
sources being of high quality or low quality. According to table figure 4.7, majority of
the respondents were in agreement that word of mouth is of high quality. Tv and radio
also ranked highly as quality sources of information. This was followed by formal
learning then professional source. Social media and print media ranked almost equally.
The responses are indicated in figure 4.7.
Figure 4. 7 : Quality of information sources
Source: Field survey, 2018
Televis
ionRadio
Social
media
media
Word
of
mouth
Profess
ional
source
Formal
learnin
g
Strongly Agree 6.65 4.33 3.07 0.8 8.6 1.4 2.3
Agree 3.5 5.6 4.6 4.0 4.6 1.7 4.1
Not sure 3.1 3.2 4.4 5.1 1.1 4.2 4.3
Disagree 1.4 1.3 1.6 2.7 0.4 4.3 2.7
Strongly Disagree 0.4 0.2 0.5 0.6 0.1 2.0 1.4
0.00
1.00
2.00
3.00
4.00
5.00
6.00
7.00
8.00
9.00
Per
cent
47
4.7: Sources of energy for daily needs
Participants were asked to indicate their source of energy for daily needs.
Electricity was the most prominent source for lighting. This is because most areas in
Keekonyokie and Olkeri have electricity lines connected to the national grid. Using
electricity is easier and more convenient to most people in these areas. This is also
because electricity for lighting is fairly affordable as compared to other sources such as
solar power which require a substantial amount of capital for installation (look at
2.6).Charcoal on the other hand is the most prominent source of energy for cooking.
This is because it is a cheaper alternative to electricity and more preferable to firewood
which is smoky. It is however important to note that LPG gas which is a fairly common
source of energy for cooking was not included in this question. This is because LPG
gas is neither sustainable nor unclean and was not the main focus in this study. The
results showed that biogas, solar power and briquettes had the least frequent usage. For
instance 9.2% of respondents reported that they have never used biogas, 10.1% never
used solar power, 12.9% never used wind power and 11.9% have never used briquettes.
None of the respondents reported to have used wind power for their daily needs. It is
clear that even though there is some awareness on the ground about these types of
energy, adoption is still very low and in the case of wind energy, there is zero adoption.
A key informant from Ngong Hills wind power station stated that it is possible
for individuals to have their own small wind turbines for electricity generation. The
only important factor for consideration is that there should be no obstruction to wind.
In regard to cost, he noted that the cost of setting up a wind turbine is not much different
from solar. Briquettes accounted for less than 1% usage. This is a very small percentage
given that briquettes are much cleaner than the alternative, charcoal, which 5.5% of the

48
population indicated that they use daily. Only 0.3 % of the population reported that they
never use charcoal.
Figure 4. 8: Sources of energy for daily needs
Source: Field survey, 2018
4.8 Sources of energy preferred for cooking
A majority of respondents (30.9%) agreed that they would prefer electricity for
cooking. This is a high contrast to the collective 11.9% who reported to use electricity
either daily, one a week or once a month. From the results on source of energy for
cooking and lighting, it was also shown that a majority of those who use electricity, use
it for lighting. This could imply that although a fairly good percentage of people have
access to electricity, a very high majority cannot afford to use it for both cooking and
lighting. The results also show that 24.9% would prefer LPG followed by biogas at
22.5%. In the findings for sources of energy above, it was shown that only 2.6% of the
respondents use biogas. This sharp contrast between individuals who use biogas and
those who do not, but would like to do so, implies that there are other external factors
that contribute to these findings. In table 4.4, participants were asked to indicate the
Charc
oal
Keros
ene
Firew
ood
Electr
icity
Bioga
s
Solar
power
Wind
power
Briqu
ettes
Daily 5.5 2.4 4.7 9.6 1.7 1.5 0.5
At least once a week 2.8 2.4 1.5 2.1 0.4 0.4
At least once a month 1.6 2.1 2.0 0.2 0.1 0.2 0.1
Once every few months 2.0 2.4 2.3 0.4 0.3 0.3
Never 0.3 2.9 2.1 0.7 9.2 10.1 12.9 11.9
0.0
2.0
4.0
6.0
8.0
10.0
12.0
14.0
Per
cent
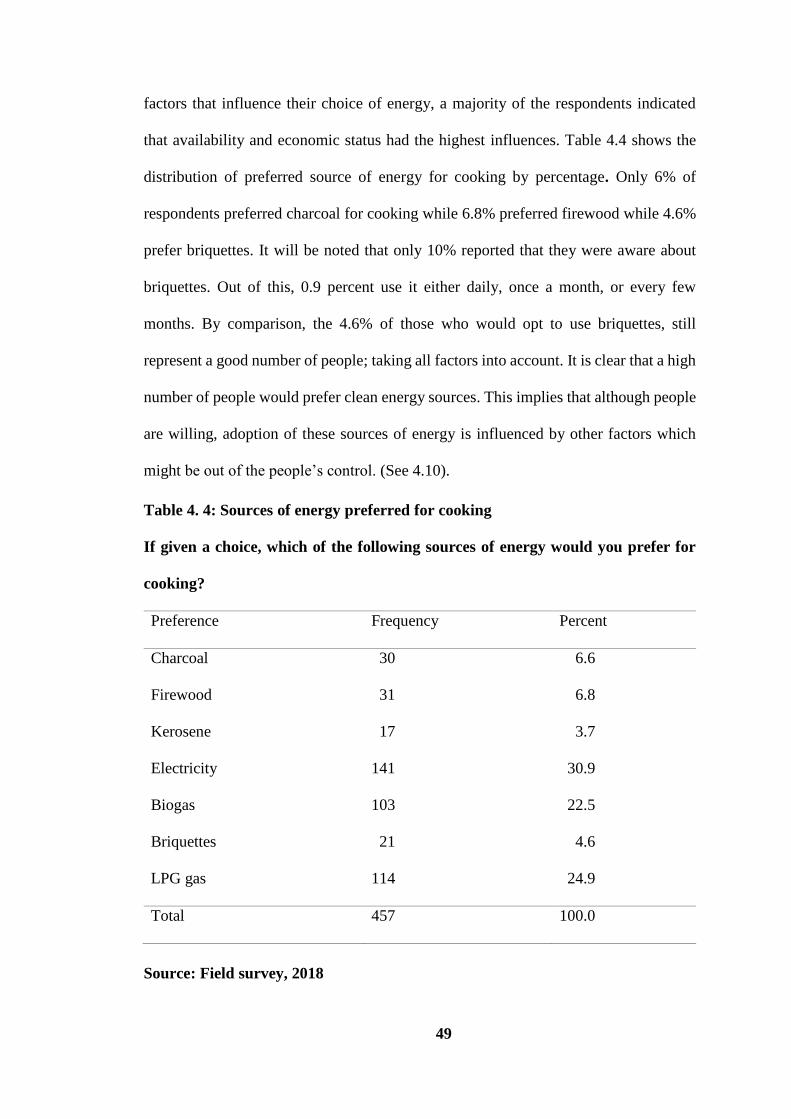
49
factors that influence their choice of energy, a majority of the respondents indicated
that availability and economic status had the highest influences. Table 4.4 shows the
distribution of preferred source of energy for cooking by percentage. Only 6% of
respondents preferred charcoal for cooking while 6.8% preferred firewood while 4.6%
prefer briquettes. It will be noted that only 10% reported that they were aware about
briquettes. Out of this, 0.9 percent use it either daily, once a month, or every few
months. By comparison, the 4.6% of those who would opt to use briquettes, still
represent a good number of people; taking all factors into account. It is clear that a high
number of people would prefer clean energy sources. This implies that although people
are willing, adoption of these sources of energy is influenced by other factors which
might be out of the people’s control. (See 4.10).
Table 4. 4: Sources of energy preferred for cooking
If given a choice, which of the following sources of energy would you prefer for
cooking?
Preference Frequency Percent
Charcoal 30 6.6
Firewood 31 6.8
Kerosene 17 3.7
Electricity 141 30.9
Biogas 103 22.5
Briquettes 21 4.6
LPG gas 114 24.9
Total 457 100.0
Source: Field survey, 2018
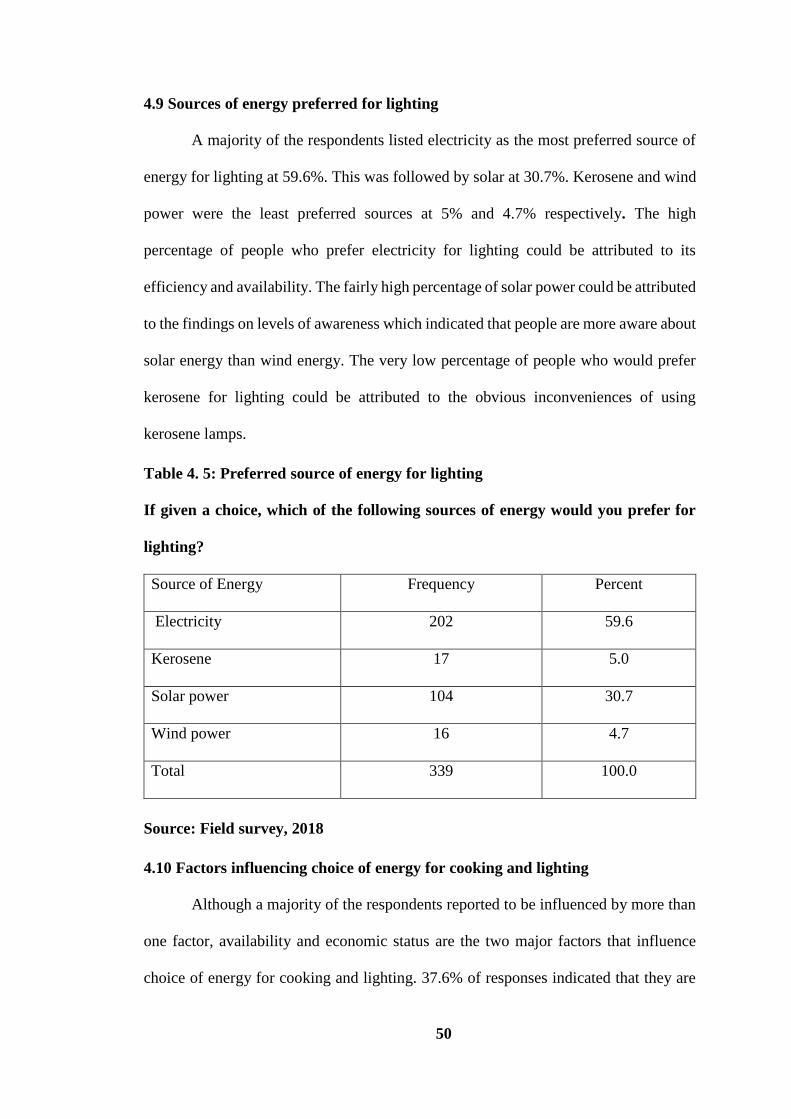
50
4.9 Sources of energy preferred for lighting
A majority of the respondents listed electricity as the most preferred source of
energy for lighting at 59.6%. This was followed by solar at 30.7%. Kerosene and wind
power were the least preferred sources at 5% and 4.7% respectively. The high
percentage of people who prefer electricity for lighting could be attributed to its
efficiency and availability. The fairly high percentage of solar power could be attributed
to the findings on levels of awareness which indicated that people are more aware about
solar energy than wind energy. The very low percentage of people who would prefer
kerosene for lighting could be attributed to the obvious inconveniences of using
kerosene lamps.
Table 4. 5: Preferred source of energy for lighting
If given a choice, which of the following sources of energy would you prefer for
lighting?
Source of Energy Frequency Percent
Electricity 202 59.6
Kerosene 17 5.0
Solar power 104 30.7
Wind power 16 4.7
Total 339 100.0
Source: Field survey, 2018
4.10 Factors influencing choice of energy for cooking and lighting
Although a majority of the respondents reported to be influenced by more than
one factor, availability and economic status are the two major factors that influence
choice of energy for cooking and lighting. 37.6% of responses indicated that they are

51
influenced by availability while 34.5% indicated that they are influenced by economic
status. A huge majority of people who cited availability as the main factor that
influenced their choice of energy could be attributed to the fact that people do not
actually have information about where to access the necessary equipment or
professional services to embrace these types of energy. Regarding economic status as
a major factor determining choice of energy, it was established that some of the
equipment used could also be costly, (Look at 2.6) for example, the key informant who
makes briquettes cited that the cost of buying a compressor machine for the briquettes
is about ksh 70,000. Most individuals do not have the capacity to invest that amount of
money on equipment and professional services. Effect on health influenced 11.4% of
the population while effect on environment influenced 6.1%, education level at 4.3%,
media and advertisement influenced 3.1% and finally peers 3.1 %.
Table 4. 6: Factors influencing choice of energy for cooking and lighting
Factors influencing choice of
energy for cooking and
lighting
Responses
N Percent Percent of
cases
Media and advertisement 18 3% 6.2%
Peers 19 3.1% 6.5%
Economic status 209 34.5% 71.6%
Availability 228 37.6% 78.1%
Effect on environment 37 6.1% 12.7%
Education level 26 4.3% 8.9%
Effect on health 69 11.4% 23.6%
Total 606 100% 207.5%
Source: Field survey, 2018
52
4.11 Multiple response questions
The research also sought to compare the sources of information in relation to
age and level of education. In addition to this, factors influencing choices of energy for
cooking and lighting were also compared to age and level of education. Finally, the
level of awareness of renewable energy sources were compared to age and level of
education.
4.11.1 Levels of awareness in relation to age
The findings showed that solar power is the most common form of renewable
energy among residents of Keekonyokie and Olkeri. A good number of the respondents
also showed awareness of biogas
followed by wind and lastly, briquettes. By age distribution, 18-29 year olds are more
aware about solar power and biogas 13.3% & 12.1 % respectively, as compared to wind
and briquettes 4.4% &2.4% respectively. Similar trends are shown for 30-39 year olds
who indicated 8.3% awareness for biogas, 15.9% for solar and 5.3% for wind energy.
For 40-49 year olds, biogas comes first as the most popular form of renewable energy
at 9.4%, this is followed closely by solar at 9.1%, wind at 3.8%, and briquettes at 8.3%.
50-59 year olds are also more aware about biogas at 3.5% than solar power which is at
2.4%. They also have equal levels of awareness for briquettes and wind energy which
was at 0.9%. The least informed age group is 60 and above. They showed no awareness
for wind energy and very little (1.5% &0.3%) awareness for solar and biogas
respectively.

53
Figure 4. 9: Levels of awareness in relation to age
Source: Field survey, 2018
4.11.2 Level of awareness relation to level of education
It was found that the level of education influenced the level of awareness that
Keekonyokie and Olkeri residents had about renewable energy sources. According to
the figure below, those with secondary school education had more awareness (15.2%)
about solar power than those who had college level education (14.5%). For biogas
however, those with college level education showed more awareness (13.6%) than
secondary school level (11.9%). For wind and briquettes, the level of awareness
increases with level of education from pre-primary to college/university level. The
results are indicated in figure 4.10.
4.4
5.3
3.8
0.9
13.3
15.9
9.1
2.4
1.5
12.1
8.3
9.4
3.5
0.3
2.4
3.2
3.2
0.9
0.0 2.0 4.0 6.0 8.0 10.0 12.0 14.0 16.0 18.0
18-29 years
30-39 years
40-49 years
50-59 years
60 years and above
Percent
Age
bra
cket
Briquettes Biogas Solar power Wind energy

54
Figure 4. 10: Level of education in relation to awareness
Source: Field survey, 2018
4.11.3 Sources of information in relation to age
The researcher sought to establish the main sources of information according to
age. A majority of respondents indicated that word of mouth was their main source of
information for renewable energy sources that they were aware of. The results showed
that word of mouth was the main source of information for 28-29 year olds, 30-39 year
olds and 40-49 year olds. Same results were reported for respondents who were 60 years
and above. 50 -59 year olds reported that television was their main source of
information. It should be noted that 60 year olds and beyond represented only 2% of
the population while 50-59 year olds represented 6.9%. Television was the second most
popular source of information for all age groups except for 50-59 year olds. The results
also showed that a huge majority of 18-29 year olds did not get information about
renewable energy on radio. Only 1.8% did. A fairly good number of 30-39 year olds
did indicated that they get information from radio (5.8%). This percentage reduced with
0.71.3
4.4
7.5
2
8.8
15.214.5
3.5
7
11.9
13.6
1.3
3.74.6
0
2
4
6
8
10
12
14
16
Less than primaryschool
Primary schoolcompleted
Secondary schoolcompleted
College/UniversityCompleted
Per
cen
t
Level of educationWind power Solar power Biogas Briquettes
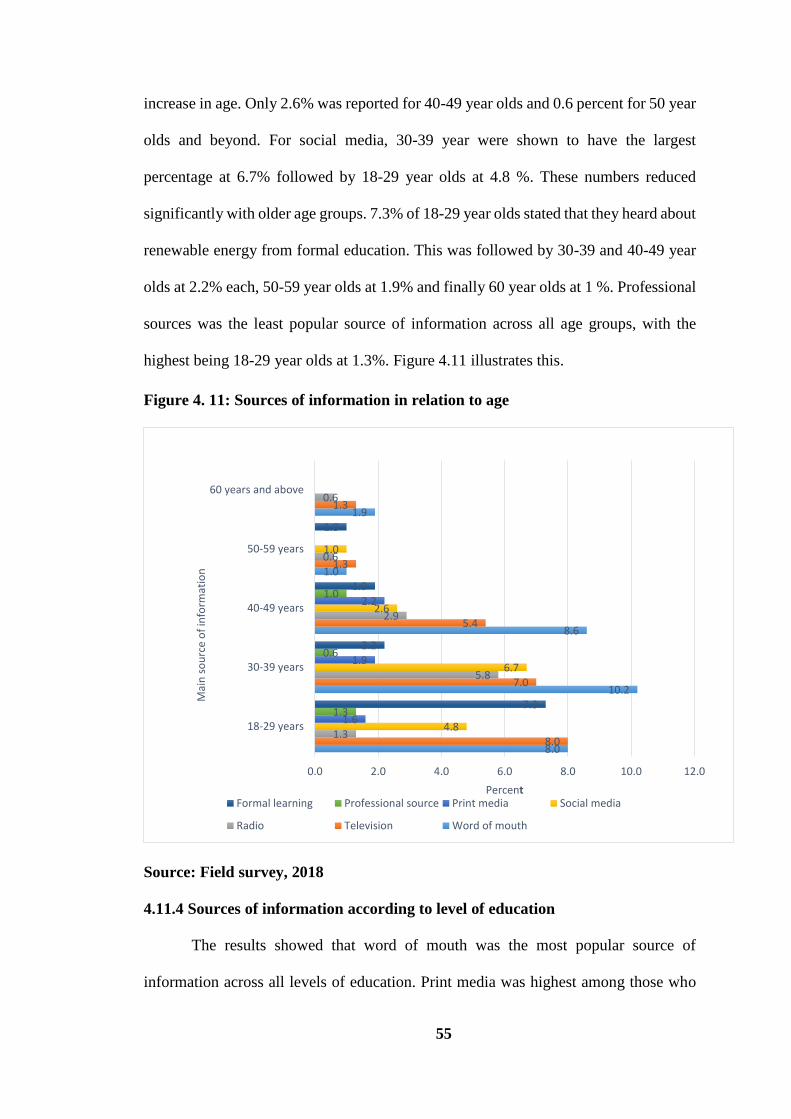
55
increase in age. Only 2.6% was reported for 40-49 year olds and 0.6 percent for 50 year
olds and beyond. For social media, 30-39 year were shown to have the largest
percentage at 6.7% followed by 18-29 year olds at 4.8 %. These numbers reduced
significantly with older age groups. 7.3% of 18-29 year olds stated that they heard about
renewable energy from formal education. This was followed by 30-39 and 40-49 year
olds at 2.2% each, 50-59 year olds at 1.9% and finally 60 year olds at 1 %. Professional
sources was the least popular source of information across all age groups, with the
highest being 18-29 year olds at 1.3%. Figure 4.11 illustrates this.
Figure 4. 11: Sources of information in relation to age
Source: Field survey, 2018
4.11.4 Sources of information according to level of education
The results showed that word of mouth was the most popular source of
information across all levels of education. Print media was highest among those who
8.0
10.2
8.6
1.0
1.9
8.0
7.0
5.4
1.3
1.3
1.3
5.8
2.9
0.6
0.6
4.8
6.7
2.6
1.0
1.6
1.9
2.2
1.3
0.6
1.0
7.3
2.2
1.9
1.0
0.0 2.0 4.0 6.0 8.0 10.0 12.0
18-29 years
30-39 years
40-49 years
50-59 years
60 years and above
Percent
Mai
n s
ou
rce
of
info
rmat
ion
Formal learning Professional source Print media Social media
Radio Television Word of mouth
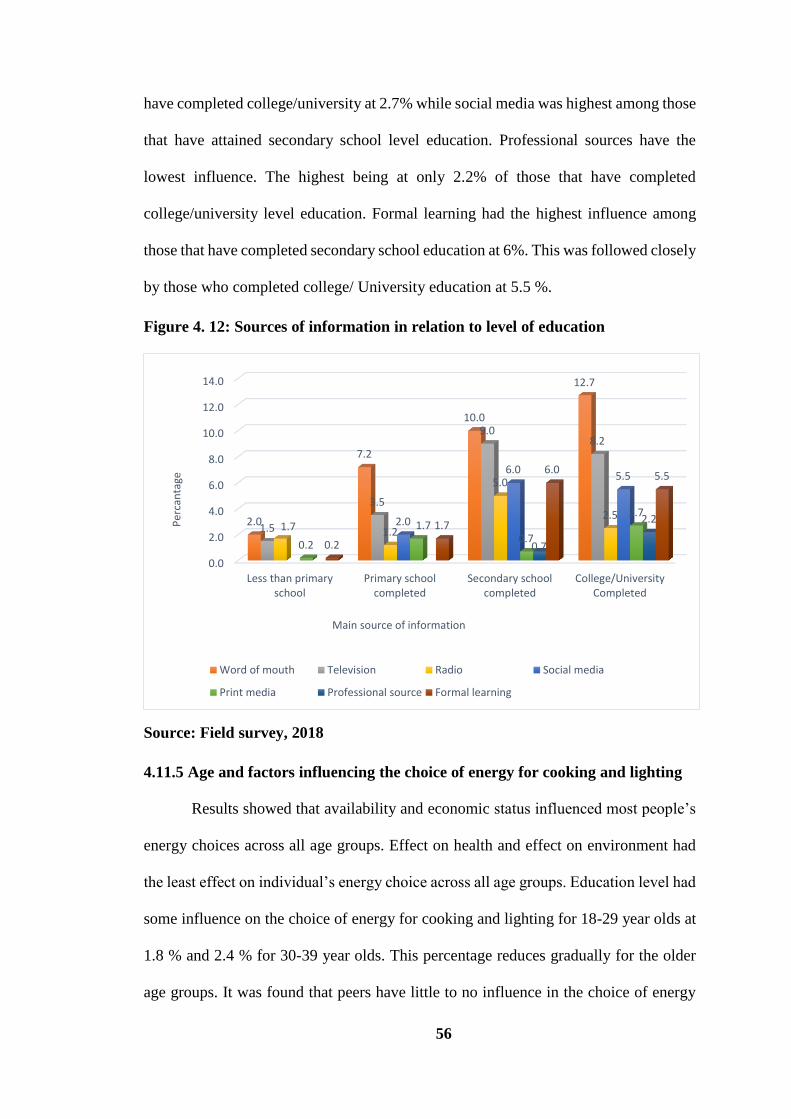
56
have completed college/university at 2.7% while social media was highest among those
that have attained secondary school level education. Professional sources have the
lowest influence. The highest being at only 2.2% of those that have completed
college/university level education. Formal learning had the highest influence among
those that have completed secondary school education at 6%. This was followed closely
by those who completed college/ University education at 5.5 %.
Figure 4. 12: Sources of information in relation to level of education
Source: Field survey, 2018
4.11.5 Age and factors influencing the choice of energy for cooking and lighting
Results showed that availability and economic status influenced most people’s
energy choices across all age groups. Effect on health and effect on environment had
the least effect on individual’s energy choice across all age groups. Education level had
some influence on the choice of energy for cooking and lighting for 18-29 year olds at
1.8 % and 2.4 % for 30-39 year olds. This percentage reduces gradually for the older
age groups. It was found that peers have little to no influence in the choice of energy
0.0
2.0
4.0
6.0
8.0
10.0
12.0
14.0
Less than primaryschool
Primary schoolcompleted
Secondary schoolcompleted
College/UniversityCompleted
2.0
7.2
10.0
12.7
1.5
3.5
9.08.2
1.7 1.2
5.0
2.52.0
6.05.5
0.2
1.70.7
2.7
0.7
2.2
0.2
1.7
6.05.5
Per
can
tage
Main source of information
Word of mouth Television Radio Social media
Print media Professional source Formal learning

57
for cooking and lighting across all age groups. Effect on environment and media
advertisements had very little influence as well.
Figure 4. 13: Age and factors influencing the choice of energy
Source: Field survey, 2018
4.11.6 Level of education and factors influencing the choice of energy
Participant responses indicated that economic status and availability were the
two major factors that determined choice of source of energy across all levels of
education. This trend was a similar comparison in relation to findings for age (above).
Effect on health had little influence on the choice of energy with the highest being 18-
28 year olds at 1.1%. On the other hand, effect on environment had very little influence
for college and university students with the highest being 2% for college and university
students. These findings for factors influencing choice of energy showed similar trends
across all classifications.
1.1 0.7 0.92.2
00.9 0.9 0.9 0.4 0
13.2
10.4
8.2
2.40.9
15.2
10.6
7.7
2.20.9
1.8 2.41.5
0.2 00
2
4
6
8
10
12
14
16
18-29 years 30-39 years 40-49 years 50-59 years 60 years and obove
Per
can
tage
Age bracket
Media advertisement Peers Economic status Availability Effect on environment

58
Figure 4. 14: Level of education and factors influencing the choice of energy
Source: Field survey, 2018
0.21.3 1.7
0.51.2
0.7 0.8
2.5
7.7
12.0 12.0
1.7
8.2
13.7 14.0
0.2 0.3
1.83.8
0.30.5
1.52.0
0.2
2.2
3.7
5.0
0.0
2.0
4.0
6.0
8.0
10.0
12.0
14.0
16.0
Less than Primary school Primary schoolcompleted
Secondary schoolcompleted
College/UniversityCompleted
Per
cen
t
Level of education
Media advertisement Peers Economic status Availability
Effect on environment Education level Effect on health

59
CHAPTER FIVE
SUMMARY OF FINDINGS, CONCLUSION AND RECOMMENDATIONS
5.0 Overview
This chapter presents the summary of the findings, conclusion and
recommendations. The summary of the findings is presented according to the objective
of the study in three sections. The first section has sources of information on renewable
energy, the second section has levels of awareness of renewable energy and the third
section has levels of adoption of renewable energy.
5.1 Sources of information for renewable energy in the two wards
Word of mouth, TV, radio, social media, print media, professional source and
formal learning were tested as sources of information for renewable energy in the two
wards. The findings indicate that word of mouth is the leading source of information
for renewable energy in the two wards. This shows that the level of interaction is more
on the interpersonal level. Although information is higher on the interpersonal level,
the scale of adoption is not as high. This is because there are other factors that influence
people’s choice of energy and also their levels of awareness about these types of energy.
(Discussed in 5.3)
It was also shown that awareness generally increased with level of education.
Levels of awareness also moderately high among people younger than 49 years old.
This dropped as age went up. This implies that younger people have more access to
information about renewable energy, and more so, younger people with higher level of
education. Media sources such as TV, radio, print media and social media collectively
contribute a significant percentage as information sources but individually, their
contribution is relatively low. These media sources have the potential of reaching wider
audiences than any other information source. It is therefore important that stakeholders
look into ways that information about renewable energy can be packaged effectively in

60
order to realise the full potential of these media as sources of information for renewable
energy.
5.2 Levels of awareness on renewable energy in Keekonyokie and Olkeri wards
The results showed that levels of awareness vary according to the source of
renewable energy. Biogas for instance is the most common form of renewable energy
followed by solar then wind and lastly briquettes. A majority of the respondents had
knowledge of at least two sources of renewable energy. Despite this, this knowledge
does not result in positive action when it comes to adoption of these sources. More than
three quarters of the respondents sighted availability and economic status as major
determinants of the type of energy they have adopted for cooking and lighting.
It was also established that individuals’ level of awareness of renewable energy
sources increased with their level of education. Individuals with high school level
education or higher showed more awareness than those with primary level education or
lower. Young adults (20-29) and middle aged (30-49) people showed more awareness
on all forms of renewable energy as compared to older people (50 and above).
5.3 Levels of adoption of renewable energy in Keekonyokie and Olkeri wards
The levels of adoption of solar energy, biogas and briquettes were still very low.
Less than one quarter of the respondents reported adoption of either of these sources of
energy. None of the participants had adopted wind energy. It was however noted that
adoption of biogas was higher than the rest of the energy sources. Solar energy followed
closely then briquettes. Although adoption is very low, a good number of respondents
showed willingness to adopt these kinds of energy especially solar and biogas. This
willingness was however influenced by a number of factors, mainly availability and
cost. In the case of briquettes for example, it would be cheaper and more easily available
for the community, if more people had invested in briquette making as an economic
61
activity. Not everyone has the capacity to invest in briquette making equipment or other
equipment needed for the production of biogas, solar energy or wind energy. There
needs to be more investment on these types of energy so that they become cheaper and
more accessible to the community. The results also showed that a majority of the
population are not highly influenced by risk factors associated with the use of unclean
sources. This finding implies that there needs to be more effort in the institutional level,
to enable access to information about risk factors associated with the use of unclean
energy sources renewable energy, and therefore promote adoption.
5.4 Conclusion
In conclusion, the results of this study show that word of mouth is the main
source of information of renewable energy and that people are more aware of biogas as
a source of renewable energy followed by solar and wind energy. Briquettes are the
least popular source of renewable energy. It was also found that awareness is generally
low among older people (60 and above) and those with low levels of education.
Television also ranked high as a quality source of information. This was followed by
social media which was ranked almost similar to formal learning then radio
respectively. A majority of the respondents were unsure about print media and
professional source as quality sources of information for renewable energy. Key
informant interviewees reiterated that people would be more knowledgeable about
these sources of energy through the media and interpersonal means.
Because adoption is still low, it implies that people within Olkeri and
Keekonyokie wards continue to use unclean sources of energy even though the
environmental conditions of these areas is favourable for renewable energy,
furthermore, most of the residents of Keekonyokie and Olkeri keep cows, goats, sheep
and other domestic animals. Animal waste is the only raw material required for the

62
production of biogas. If they do not utilise these resources, it means that they will
continue to bear the negative effects of using unclean energy sources which are is
harmful to both their health and to the environment. Furthermore, renewable energy
could improve the socio-economic status of the residents and also promote inclusion of
otherwise disadvantaged groups of people.
5.5 Recommendations
To promote cleaner sources of energy, residents of Keekonyokie and Olkeri
need to access sufficient and easy to understand information about renewable energy,
and relevant support from the community, institutional and policy levels. The
government, through the ministry of energy through the department of renewable
energy, could implement renewable energy projects that promote inclusivity among
residents of Keekonyokie and Olkeri. For example, women groups or ‘chamas’ and
youth groups in the area could be empowered by being given platforms where they can
access loans or resources that would enable them to specifically invest in renewable
energy. For example briquette making. A report by Cohen and Marega, (2013) found
that the briquette business in Kenya employs between 9 and 80 people per enterprise.
Such projects would not only encourage the use of clean energy sources, they would
also alleviate poverty through provision of employment.
As the study has established, individuals who acquire information about new
innovations from interpersonal sources have a greater influence both to themselves and
others. Interpersonal sources can therefore serve the purpose of informing them in
addition to influencing them. Community leaders should be at the forefront of
identifying and reaching out to residents who have the capacity to uptake various kinds
of renewable energy sources by organising or incorporating such discussions in
community forums. Skilled professionals in the green energy sector should also be at

63
the forefront in reinforcing such initiatives. This will empower members of the public
with adequate skills and adequate information that will enable them to embrace these
alternative energy sources.
The media, being a source for information that can reach wide audiences, should
package information in a way that the locals can relate to. For example, instead of
merely reporting or projects that are ongoing in the area, such as the Keeko biogas
project, they could organise documentary -like segments where they show the entire
process of production. Television showed great potential as an effective source of
information for the residents of Keekonyokie and Olkeri. Since a concern was raised
about lack of feedback, media practitioners, researchers and other stakeholders who
visit the area for matters regarding renewable energy should also follow up and provide
feedback to the locals who worked with them or provided information about ongoing
projects in the area.
The study also established that level of education has considerable influence on
levels of awareness. Awareness campaigns could be used in formal education
institutions, and the public to further increase levels of awareness. People with higher
education will interpret campaign materials better that those with lower education.
Awareness campaign publications should be short, simple and clear to be interpreted
by majority of the public who can read and understand.
The government through departments that are involved with the people at
grassroots level (such as the Ken Gen CSR campaign) could implement other
campaigns at local market places where they demonstrate the how briquettes are made.
Those who are already in the market can play a role in creating awareness at local levels.
He suggested social media campaigns and sensitisation through word of mouth. The
media can also play an important role in creating awareness as it has a wider reach.

64
More programmes and news article s about renewable energy can be contributory to
promoting uptake of these types of energy.
At the policy level, stakeholders should also work to ensure that there is
adequate investment on renewable energy in the area. This will promote adoption of
these energy sources because there will be an increase in supply. Increase in supply also
means that it will be cheaper for locals. The county Government of Kajiado could also
enact policies that restrict the use of certain kinds of energy such as charcoal. This will
force residents to look for alternative sources of energy.
65
REFERENCES
Abdul Azeez O. Emmanuel, Foluronsho M. Ajide. (2015)The analysis of perceptions
and attitudes towards biofuel energy consumption in Lagos, Nigeria. OAU
working paper series:OAUFSSC-16-032
Ball, S. J. (1981) Beachside Comprehensive, Cambridge, Cambridge University. vb
Bourne, F.S In R.Likert and S.P. Hayes,Jr. (eds), (1957). Some Applications of
Behavioural Research. Paris: UNESCO.
BP. (2018). Renewable energy.https://www.bp.com/en/global/corporate/energy-
0.economics/statistical-review-of-world-energy/renewable-energy.html.
Brooks,R.C, Howard, J.A And Sheth J.N, (1957),Word-of- Mouth Advertising in
Selling New Products.John Wiley &Sons, New York.
Cohen, Y., & Marega, A. (2013). Assessment of the briquette market in Kenya. GVEP
International.https://www.energy4impact.org/file/1712/download?token=T4J_
JRTl
DeWalt, K. M., & DeWalt, B. R. (2011). Participant observation. A guide for
fieldworkers. Lanham, MD:AltaMira Press.
Energy Regulatory Commission. (2011). Scaling-up renewable energy program
(SREP):.http://www.renewableenergy.go.ke/downloads/policy
docs/Updated_SREP_Draft_Investment_Plan_May_2011.pdf
Eriksson, P. and Kovalainen, A. (2008), Qualitative Methods in Business Research, 1st
ed, SAGE Publications Ltd., London.
Federal Ministry for Economic Cooperation and Development. (2012). Legal
frameworks for renewable energy: Policy analysis for 15 developing and
emerging countries. Bonn, Germany: GIZ.
Fowler, F. J., Jr. (1995).Improving survey questions. Thousand Oaks, CA: Sage.
Frances Pinter. Payne, S. (1951) The Art of Asking Questions. Princeton, NJ: Princeton
University Press.
Grant, A. M. (2010). It takes time: A stages of change perspective on the adoption of
workplace coaching skills. Journal of Change Management, 10(1), 61-77.
GVEP International. (2010). Kenya briquette industry study. Retrieved from
http://kerea.org/wp-content/uploads/2012/12/Kenya-Briquette-Industry-
Study_GVEP-International.pdf
Health Communication Capacity Collaborative. (2016). Social and behavior change
communication for emergency preparedness. Baltimore, MD: Johns Hopkins
Center for Communication Programs.
Howard,J.A. and Sheth,J. N. (1969),The Buyer behaviour. John Wiley &Sons New
York.
Kamfor Company Ltd. (2002). Study on Kenya’s energy demand, supply and policy
strategy for households, small-scale industries and service establishment.
Katz, E. (1957). The Two-Step Flow of Communication: an Up-To Date Report on a
Hypothesis. The Public Opinion Quarterly, 21 (1). pp. 61-78.
Katz,Elihu, (1957) The two step flow of communication: An Up-to-Date Report on
Hypothesis. Public Opinion Quaterly,Vol 21.

66
Kiplagat, J. K., Wang, R. Z., & Li, T. X. (2011). Renewable energy in Kenya: Resource
potential and status exploitation. Renewable and Sustainable Energy Reviews,
15, 2960-2973.
Kumar, R. (2005). Research Methodology. New Delhi: Sage publications.
Langbein, J. (2017). Firewood, smoke and respiratory diseases in developing countries:
The neglected role of outdoor cooking. PLOS One, 12(6), 1-14.
McLeroy, K. R., Steckler, A. and Bibeau, D. (Eds.) (1988). The social ecology of health
promotion interventions. Health Education Quarterly, 15(4):351-377.
Retrieved May 1, 2012,
Ministry of Energy and Petroleum. (2015). Draft national energy and petroleum
policy.https://www.erc.go.ke/images/docs/National_Energy_Petroleum_Policy
_August_2015.pdf
Mohtasham, J. (2015). Review article: Renewable energies. Energy Procedia, 74,
1289-1297.
Ngugi, E. (2013). Exploring Kenya’s inequality: Pulling apart or pooling together?
Nairobi, Kenya: Kenya National Bureau of Statistics and Society for
International Development. http://inequalities.sidint.net/kenya/wp-
content/uploads/sites/2/2013/09/Kajiado.pdf
Oppenheim, A. (1992) Questionnaire Design, Interviewing and Attitude Measurement.
London.
Payne, S. (1951). The Art of Asking Questions. Princeton, NJ: Princeton University
Press. Fowler, F. J., Jr. (1995).Improving survey questions. Thousand Oaks,
CA: Sage.
Porras, I., Vorley, B., & Amerein, A. (2015). The Kenya National Domestic Biogas
Programme: Can carbon financing promote sustainable agriculture? London,
United Kingdom: International Institute for Environment and Development.
https://hivos.org/sites/default/files/publications/pes_and_the_kenya_national_
domestic_biogas_programme.pdf
Power Africa. (2015). What Power Africa means for Kenya. Retrieved from
https://www.res4africa.org/wp-content/uploads/2016/05/Power-Africa-Fact-
Sheet.pdf
Press.
Robson, C. (2002).Real world research: A resource for social scientists and practitioner
researchers.
Rogers, E. M. (2003). Diffusion of Innovations. Fifth edition. Free Press: New York.
Ryan & Gross (1943). The Diffusion of Hybrid Seed Corn in Two Iowa
Communities, Rural Sociology 8 (March): 15
Saunders, M., Lewis, P. and Thornhill, A. (2008), Research Methods for Business
Students, 4th ed, Prentice Hall Financial Times, Harlow.
Sheth,J. N. (1968), Insights to consumer behaviour ( Johan Arndt Ed). Allyn & Bacon
Symbal Communication. (2018). The change communication model. Retrieved from
http://symbal.com/change-communication-model

67
Toews, D. (2003). The New Tarde: Sociology after the End of the Social Theory Culture
& Society 20 (5), 81-98.
Veli Jiyane, Janneke ,Mostert, Mabel Minishi and Moses Ocholla, (2012). Sources and
channels of information access and use in the information and knowledge
society: a case study of Hadish Municipality Kwa-Zulu Natal, South Africa.
IFLA
Wellington, J. (2000). Educational Research: Conteporary Issues and Practical
pproaches. London: Continuum.
World Bank. (2013).Towards a sustainable energy future for all: Directions for the
World Bank Group’s energy sector. Retrieved from
http://www.worldbank.org/content/dam/Worldbank/document/SDN/energy-
2013-0281-2.pdf (Cohen & Manion, 2000).ttps://softkenya.com/kenya/kajiado-
north-constitue

68
APPENDICES
APPENDIX 1: QUESTIONNAIRE
Title: Sources of Information, levels of awareness and adoption of renewable energy in
Keekonyokie and Olkeri Ward, Kajiado County.
Dear Respondent,
My name is Sheilah Ndiema, a student at the University of Nairobi pursuing a Master
of Arts in communication Studies. As part of the requirement, I am undertaking a
research study titled sources of Information, levels of awareness and adoption of
Renewable Energy in Keekonyokie and Olkeri Wards of Kajiado County. Please assist
me by completing the following questionnaires. All information provided will be
treated with utmost confidentiality. Your contribution will be highly appreciated.
SECTION A: Personal Information
I. Name of Respondent
(optional)………………………………………………………
II. Age a.(18-29) [ ] b.(30-39) [ ] c.(40-49) [ ] d.(50-59) [ ] e.(60 and
above) [ ]
III. Place of residence (Sub
Location)……………………………………………………..
IV. Level of Education
a). Less than primary School [ ]
b). Primary School Completed [ ]
c). Secondary School Completed [ ]
d). College/University Completed [ ]

69
SECTION B: Levels of awareness and sources of information for renewable energy
I. Which of the following sources of renewable energy are you aware about? (Tick
as appropriate)
a). Wind power [ ] b). Solar Power [ ] c). Biogas [ d).Briquettes [ ] e) None [ ]
II. What was your main source of information for the above sources? (Tick as
appropriate)
a) Word of mouth [ ] b)Television [ ] c)Radio [ ] d)Social Media [ ] d)Print
Media [ ] e) Professional source [ ] f) Formal learning [ ] g) Others [ ]
III. Which of the following sources of Information on Renewable energy has the
strongest quality?
RE Sources Strongly
Agree
Agree Not Sure Disagree Strongly
Disagree
Television
Radio
Social Media
Print media
Word of mouth
Professional source
Formal Learning

70
SECTION C: Sources of energy for daily needs
I. On a scale of 1-5 which of the following sources of Energy do you use for your
daily needs? Tick as appropriate.
Energy
Source
1.
Daily
2.
At least
once a week
3.
At least
once a
month
4.
Once every
few months
5.
Never
Charcoal
Kerosene
Firewood
Electricity
Biogas
Solar power
Wind power
Briquettes
LPG gas
II. If given a choice, which of the following sources of energy would you prefer
for cooking
a) Charcoal [ ] b)Firewood [ ] c) Kerosene [ ] d)Electricity [ ] e)Biogas
[ ]
f) Briquettes [ ] g) LPG gas [ ]
III. If given a choice, which of the following sources of energy would you prefer
for lighting?
a) Electricity[ ] b)Kerosene[ ] c) Solar power[ ] d) Wind power[ ]

71
SECTION D
General questions (tick as appropriate)
I. What influences your choice of energy for cooking and lighting?
a) Media advertisements [ ] b) Peers[ ] c) Economic status [ ] d) Availability[ ]
e) Effect on environment [ ] f) Education level [ ] g) Effect on heath[ ] others[ ]

72
APPENDIX II. INTERVIEW GUIDE
Dear respondent,
My name is Sheilah Ndiema, a student at the University of Nairobi pursuing a Master
of Arts in communication Studies. As part of the requirement, I am undertaking a
research study titled sources of Information, levels of awareness and adoption of
renewable Energy. This study will be conducted within Keekonyokie Ward, Kajiado
County. Please assist me by completing the following questionnaires. All information
provided will be treated with utmost confidentiality. Your contribution will be highly
appreciated.
I. Sex Male [ ] Female [ ]
II. What is the name of the organisation that you are working for?
III. What is your role?
IV. What are the main sources of information regarding renewable Energy in
Keekonyokie and Olkeri
V. Are there any Communication campaigns being used to encourage the use
of alternative forms of Renewable energy in Keekonyokie and Olkeri
VI. If so, what are they?
VII. Which organisations are sponsoring these campaigns?
VIII. Do you think the Media has been instrumental in advocating for use of
alternative sources of Renewable energy in Kajiado County?
IX. What can be done to improve awareness and understanding of issues
regarding alternative forms of Renewable Energy in Kajiado County?
X. In your own opinion, what is the level of awareness of Renewable Energy
among the residents ok Keekonyokie?
XI. What is the level of adoption of these sources?

73
XII. Which is the most popular source of clean energy in Keekonyokie? Why?
XIII. Which is the least popular/ why?
XIV. Do some of the residents of Keekonyokie produce/sell biomass materials
and solar energy equipment as part of their socio Economic activities?

74
APPENDIX III. : CASE SUMMARY
Valid responses were calculated as a percentage of the total number of valid
questionnaires. These valid responses were used to calculate frequency percentages and
the percentage of cases for the outlined questions.
Cases
Valid responses Missing responses Total
N percent N percent N percent
I am aware about the
following sources of
energy
291 97.0 9 3.0 300 100
Main source of
information for renewable
energy
255 85.0 45 15 300 100
If given a choice, which
of the following sources
would you prefer for
cooking
298 99.3 2 0.7 300 100
If given a choice, which
of the following sources
would you prefer for
lighting
289 96.3 2 0.7 300 100
What influences your
choice of energy for
cooking and lighting
292 97.3 8 3.7 300 100

75
APPENDIX IV: LINE TRANSECT OF KEEKONYOKIE AND OLKERI
WARDS

76
APPENDIX V: CERTIFICATE OF FIELDWORK

77
APPENDIX VI: CERTIFICATE OF ORIGINALITY

78
APPENDIX VII: CERTIFICATE OF CORRECTIONS