Sources of growth: A reconsideration and general equilibrium application to Indonesia
17
Pergamon World Development, Vol. 25, No. 10, pp. 1609-1625, 1997 © 1997 Elsevier Science Ltd All rights reserved. Printed in Great Britain 0305-750X/97 $17.00 + 0.00 PII: S0305-750X(97)OOO65-X Sources of Growth: A Reconsideration and General Equilibrium Application to Indonesia G. CHRIS RODRIGO George Mason University, Arlington, Virginia, U.S.A. and ERIK THORBECKE Cornell University, Ithaca, New York, U.S.A. Summary. - - A Computable General Equilibrium (CGE) model of Indonesia is developed in which total factor productivity growth in manufacturing is endogenously determined. Productivity growth is conceptualized as human and social capital accumulation, mediated by learning and institutional development stimulated by the trade regime. These factors are modeled as externalities determined by export growth and capital equipment imports. The model is used to analyze the gains deriving from the externalities, and subsidies that amplify their effects, leading Indonesia to acquire Korea-like institutions sooner. The growth and fiscal implications of such counterfactual simulations are analyzed in a realistic general equilibrium framework with a fully articulated public sector. © 1997 Elsevier Science Ltd Key words -- Asia, Indonesia, productivity simulation, trade externalities, human and social capital 1. MODELING PRODUCTIVITY GROWTH (a) Introduction Possibly the most topical issue in development theory is whether the "miracle growth" of East Asia can be emulated by other developing economies. Controversy also swirls around the contribution that human and social capital accumulation can make to overall growth, through education, economic liberal- ization and institutional reform. 1 The underlying problem is that the identification of the sources of growth is itself a controversial issue. While it is now common to view East Asian growth as near miraculous (Lucas, 1993; World Bank, 1993), other analysts (Krugman, 1994; Young, 1994, 1995; Kim and Lau, 1994) seem to downplay its significance. Their main argument is that success derives from factor accumulation devoid of efficiency growth, as if accumulation on such a scale is itself unremark- able, and as if Singapore's achievement is only marginally better than Sri Lanka's. Economic growth per capita can be analytically separated into two component s , the most palpable of which is the growth of capital per worker. Greater investment in machinery clearly leads to higher labor productivity. This component, deriving from "phy- sical capital accumulation" appears explicitly in the Solow model. But, productivity also derives from better organization, higher managerial efficiency and superior worker skill levels (i.e. the assimilation of X-efficiency gains), even when capital per worker is held constant. This invokes the concept of non- physical accumulations if such productivity-enhan- cing effects are conceptualized within a generalized capital accumulation framework. There is a growing realization that the neoclassi- cal growth framework with diminishing returns to capital and disembodied "technical progress," is inadequate to explain the sustained growth perfor- mance of the East Asian economies (Nelson and Pack, 1996; Fagerberg, 1994). The endogenous growth models proposed since 1986 to overcome this deficiency, generally posit the accumulation of a non-physical factor, knowledge or human capital, which is not subject to diminishing returns. While growing interest in endogenous growth models has certainly stimulated a closer re-examina- tion of the sources of growth, this body of theory has not evolved to the point where it supplies complete Final revision accepted: April 19, 1997. 1609
-
Upload
gchris-rodrigo -
Category
Documents
-
view
212 -
download
0
Transcript of Sources of growth: A reconsideration and general equilibrium application to Indonesia

Pergamon World Development, Vol. 25, No. 10, pp. 1609-1625, 1997
© 1997 Elsevier Science Ltd All rights reserved. Printed in Great Britain
0305-750X/97 $17.00 + 0.00 PII: S0305-750X(97)OOO65-X
Sources of Growth: A Reconsideration and General Equilibrium Application to Indonesia
G. CHRIS RODRIGO George Mason University, Arlington, Virginia, U.S.A.
and
ERIK THORBECKE Cornell University, Ithaca, New York, U.S.A.
Summary. - - A Computable General Equilibrium (CGE) model of Indonesia is developed in which total factor productivity growth in manufacturing is endogenously determined. Productivity growth is conceptualized as human and social capital accumulation, mediated by learning and institutional development stimulated by the trade regime. These factors are modeled as externalities determined by export growth and capital equipment imports. The model is used to analyze the gains deriving from the externalities, and subsidies that amplify their effects, leading Indonesia to acquire Korea-like institutions sooner. The growth and fiscal implications of such counterfactual simulations are analyzed in a realistic general equilibrium framework with a fully articulated public sector. © 1997 Elsevier Science Ltd
Key words - - Asia, Indonesia, productivity simulation, trade externalities, human and social capital
1. MODELING PRODUCTIVITY GROWTH
(a) Introduct ion
Possibly the most topical issue in development theory is whether the "miracle growth" of East Asia can be emulated by other developing economies. Controversy also swirls around the contribution that human and social capital accumulation can make to overall growth, through education, economic liberal- ization and institutional reform. 1 The underlying problem is that the identification of the sources of growth is itself a controversial issue. While it is now common to view East Asian growth as near miraculous (Lucas, 1993; World Bank, 1993), other analysts (Krugman, 1994; Young, 1994, 1995; Kim and Lau, 1994) seem to downplay its significance. Their main argument is that success derives from factor accumulation devoid of efficiency growth, as if accumulation on such a scale is itself unremark- able, and as if Singapore's achievement is only marginally better than Sri Lanka's.
Economic growth per capita can be analytically separated into two component s , the most palpable of which is the growth of capital per worker. Greater investment in machinery clearly leads to higher labor
productivity. This component, deriving from "phy- sical capital accumulation" appears explicitly in the Solow model. But, productivity also derives from better organization, higher managerial efficiency and superior worker skill levels (i.e. the assimilation of X-efficiency gains), even when capital per worker is held constant. This invokes the concept of non- physical accumulations if such productivity-enhan- cing effects are conceptualized within a generalized capital accumulation framework.
There is a growing realization that the neoclassi- cal growth framework with diminishing returns to capital and disembodied "technical progress," is inadequate to explain the sustained growth perfor- mance of the East Asian economies (Nelson and Pack, 1996; Fagerberg, 1994). The endogenous growth models proposed since 1986 to overcome this deficiency, generally posit the accumulation of a non-physical factor, knowledge or human capital, which is not subject to diminishing returns.
While growing interest in endogenous growth models has certainly stimulated a closer re-examina- tion of the sources of growth, this body of theory has not evolved to the point where it supplies complete
Final revision accepted: April 19, 1997.
1609

1610 WORLD DEVELOPMENT
and unambiguous guidelines for policy-oriented models. Yet the issues raised are so pressing that policy analysts cannot wait, but must cobble together explicit formulations from existing insights to examine the range of possibilities, such as, the economic case for policy intervention.
This paper is primarily concerned with modeling productivity growth for the manufacturing sector in Indonesia. The main question is the extent, sources and costs of the productivity premium that can be captured by policy intervention tailored along East Asian lines, beyond actually realized productivity. Also examined are the effects of a productivity surge on incomes, savings, investment and fiscal balance.
These issues are examined using a five-sector Computable General Equilibrium (CGE) model of the Indonesian economy, derived directly from the much more disaggregated and comprehensive Thor- becke (1991, 1992) model. In the present model total factor productivity growth is determined endogen- ously by export growth and equipment investment. A distinguishing feature of this study is that the promotion of productivity growth by policy mea- sures is examined along with the fiscal implications of such intervention within a realistic general equilibrium framework incorporating a fully articu- lated public sector.
Following the sharp oil-price decline of 1983-87, Indonesia undertook a program of wide ranging reforms designed to restructure its economy into a more competitive mold. Export of manufactures were to be promoted to reduce dependence on energy exports and the economy liberalized. This objective has been achieved to a substantial extent, without seriously affecting the government's ongoing devel- opment and social program (Thorbecke, 1991, 1992).
Nevertheless, Indonesia's productivity growth has been less than stellar by East Asian standards, especially since 1983. The commonly accepted measure of overall economic efficiency, total factor productivity growth (TFPG), is notoriously sensitive to variation in estimating procedure. 2 But the general pattern relative to other Asian countries is in no doubt at all: estimates for 1960-89 yield TFPG averages of around 1% per year or less, much less than the rates for Taiwan, Korea and Hong Kong (World Bank, 1993; Thomas and Wang, 1993). 3
Economic analysis is naturally concerned with understanding the reasons for the poor TFPG showing during the 1982/83-1987/98 adjustment period. It would be useful in addition, to investigate how this might have been improved upon. These questions are addressed to some extent in this paper. But the principal question examined is more specific: what is the upper limit on the productivity growth that could have been realized under the most optimistic of scenarios during the adjustment period?
That is to say, if by extraordinary political will,
East Asian-style economic institutions had been forced into existence in Indonesia by 1983, what levels of productivity growth could have been achieved? If such estimates can be made, then it provides an upper bound against which actual performance is assessed. An alternative way of posing the question is to ask what extra gains could have been realized from institutional reform, if this had been pushed through with the urgency displayed in Taiwan and Korea. In Taiwan, the KMT government forced through reform and moderniza- tion with the aim of building an industrial base to underpin military re-capture of the mainland. Korea, too, industrialized under regional Cold War pres- sures. The main goal of this exercise is to provide a quantitative answer to this question.
(b) Contemporary perspectives on productivity growth
In an influential paper, Lucas (1993) has devel- oped a penetrating analysis of how contemporary growth theory might begin to explain the miracle growth of the East Asian economies. Comparing the very different growth experiences of South Korea and the Philippines, which start from roughly the same economic situation in 1960, he argues that a "successful theory.., should.., offer the possibility of rapid growth episodes, but should not imply their occurrence as a simple consequence of relative backwardness." The question of whether catch-up potential is realized or not, depends on the "social capability" of nations (Fagerberg, 1994). Lucas (1993, p. 290) argues as follows:
The main engine of growth is the accumulation of human capital - - of knowledge - - and the main source of differences in living standards among nations is differences in human capital. Physical accumulation plays an essential but decidedly subsidiary role. Human capital accumulation takes place in schools, in research organizations, and in the course of producing goods and engaging in trade. Little is known about the relative importance of these different modes of accumulation, but for understanding periods of very rapid growth in a single economy, learning on the job seems to be by far the most central.
Lucas also recognizes that to sustain such accumulation, the economy must also be a large- scale exporter. His analysis needs to be completed by bringing in organizational change and the advance of business management practice which also contribute significantly to aggregate productivity. On top of the "within-firm" effects, there are efficiency gains to be realized from promoting, business friendly institu- tions in the host society. More efficient institutions reduce transaction costs and uncertainty associated

SOURCES OF GROWTH 161 |
with economic exchanges and thus contribute to human and social capital accumulation at a broad economy-wide level (North, 1989, 1993).
All of these deliberate and often involuntary accumulations of individual and social competence can be analytically separated into two categories: human capital associated with individuals and social (infrastructural) capital associated with the social milieu. These provide formal symmetry with direct physical capital (machinery and equipment) and physical infrastructural capital; however in the foregoing, the term "social capital" is preferred because it is already in currency. 4 In much of the earlier literature these effects have been ascribed to "externalities" and "scale effects."
The pace of accumulation of human and social capital depends on many factors, including the nature of domestic competition and the openness of the economy to international competitive pressures and technology flows. Formal education is the easiest to influence directly, but it is only one necessary condition for the advance of skill and efficiency deriving from better organization and management and institutional modernization, i.e. business-friendly changes in the social infrastructure. It is economically significant skill development, rather than the level of formal education, which is the key determinant of effective human capital, 5 even though the two terms are commonly used synonymously.
Skill development and institutional reform, which raise human and social capital, respectively, can be accelerated in two major ways. The first is intensification of competition in product and tech- nology markets, particularly through trade liberal- ization. That is why the discipline of exporting is seen as crucial to East Asian-style success. The evidence is now very strong that technical efficiency advance and technology development are accelerated by sharpened competition (Krueger, 1995; World Bank, 1993). The second way is the acquisition within the firm of advanced technology embodied in new equipment (usually imported from abroad for many developing countries). Clearly these processes are interrelated, since technology upgrading is accelerated by more competitive environments.
Early growth accounting emphasized the produc- tivity enhancing role of physical capital, treating the residual TFPG as disembodied technical pro- gress. This simple framework can be represented by equation 1.1, where L is the total input of labor, Y/L is output per worker (strictly output per unit of labor input), K/L is physical capital per worker and ce is the elasticity of output with respect to physical capital. This parameter is usually obtained from relative income shares under the perfect competition assumption, or sometimes estimated econometrically.
A(Y/L) A(K/L) AA - - - ~ ~ (I) (Y/L) (K/L) A
The residual A term carries most of the action: it represents all of the non-physical accumulation described above, everything commonly identified as total factor productivity growth! Thus the key features of the growth process are carried by a single exogenous determinant! In the "East Asian Mira- cle" (World Bank, 1993), the zXA/A term is decomposed into a part deriving from advance towards the technological frontier and another representing technical efficiency advance (X-effi- ciency gains). 6 These components are likely to be different for countries at different levels of techno- logical development. For example, nearly half the growth of output per worker in advanced countries derives from TFPG whereas in semi-industrial NICs, the relative contribution of TFPG is lower (Boskin and Lau, 1992; Kim and Lau, 1994).
Recent research has called into question many of the assumptions of growth accounting based on a strictly neoclassical framework (Nelson and Pack, 1996; Fagerberg, 1994). The evidence is strong that TFPG or efficiency growth is not "disembodied" or "neutral" as has been commonly assumed in the past, but correlated with capital accumulation, in parti- cular with investment in new equipment (De Long and Summers, 1991, 1992; Boskin and Lau, 1992). Lucas expresses the idea succinctly: "One cannot acquire skill as a computer programmer without a computer." This is an old insight that has reemerged into prominence (Nelson, 1964, 1981). It is supported by the empirically observed phenomenon that TFP growth is itself higher during periods of fast growth and high investment. 7
The empirical analyses of Hall (1990) and Boskin and Lau (1992) also subvert the traditional assump- tions of constant returns to scale and profit maximization with competitive output and input markets. This undermines the neat interpretation of the two terms in equation 1.1 which depend on income share indicating the contribution of physical capital. The resulting problems are discussed by Srinivasan (1995), who argues that "it is in general difficult to identify separately the effects of returns to scale and technical progress - - either one can be used as a substitute explanation for the other. ''s
The above arguments are consistent with the results of Levine and Renelt (1992). They found a "positive and robust correlation" between average growth rates and the average share of investment in GDP. They also found a similar relationship between the share of investment in GDP and the average share of trade in GDP. Exactly the same relationship was obtained if export/GDP or imports/GDP were substituted for the trade share. Finally they found

1612 WORLD DEVELOPMENT
that other likely determinants such as measures of trade policy were not robust when investment/GDP was included in the regression.
The conclusion is that the TFPG term in equation 1 is closely correlated with the first investment term. If the parameter c~ is too large, then the contribution of capital will be overstated and the estimated TFPG will be too low. This problem is not eliminated by econometric estimation if human capital effects are correlated with physical investment as they are bound to be in developing countries which import most of their equipment. With flexible functional forms, the real advance of human and social capital will be even more readily ascribed to physical capital rather than estimated separately.
(c) Modeling human and social capital accumulation
The main determinants of growth can be repre- sented by the linkages shown in Figure 1, where industrial activity is separated into export production and production for the domestic market. There are, of course, spillovers and externalities between the two sectors, represented by the arrows between them. Both types of activity lead to physical accumulation and also the accumulation of human and social capital. Both accumulations in turn raise productivity in symmetrical fashion. But exporting supplies a bigger boost, represented by thicker arrows, first by relaxing foreign exchange constraints for capital imports and second, by inducing faster human and social capital accumulation as explained above.
The modeling strategy adopted here is to first expand the residual term of equation 1 to include an export-related term as in equation 2. This formula- tion is in line with a genre of trade-growth models that represent the extra productivity-enhancing effect
of exports (Feder, 1986; de Melt and Robinson, 1990; Charts et al., 1996) and is consistent with the empirical results quoted above. In the foregoing formulations labor input growth is abstracted from to simplify the exposition, since this component is not central to the productivity growth issues examined here.
AY ~ zXX" X AA - - y - = i l l " +/32 • ~ - - - ~-t A (2)
The first term, on the right hand side, captures the impact of physical investment just as in equation 1. The second term models the productivity-enhancing effect of export growth, i.e. the non-physical accumulation resulting from exports, often referred to as the "export externality" effect. The export contribution is the product of the "export perfor- mance" AX/X and the "export orientation" S]Y . 9
The new residual term AA/A represents neutral productivity advance that is not associated with physical investment or export discipline; it derives from advances in health and education, general technological know-how, and growth in infrastruc- ture and institutions, beyond what can be ascribed to export pressure. I° This term is assumed to be negligibly small in the simulations that follow in Section 5. equation 2 can then be recast into the following form.
AY AK z2xX zS~A --~-- = c~ • ---~-- + r/• --~-- -~ A (3/
Here, the K/Y and X/Y ratios, which are specific to a country at a particular stage of development, are combined with the multipliers/31 and/32 (in equation 2), to form the parameters of equation 3. Thus c~=/31. K/Y is the elasticity of output with respect to physical
¢ INDUSTRIAL
ECONOMY I Production for I
export market
Production for domestic market I
I Productivit growth from human /
& social capital
Human & social capital I [ accumulation
x T, ~ Physical capital
accumulation I
Productivity growth from physical capital
Figure 1. Determinants of labor productivity: the extra gains from producing manufactures for export.
SOURCES OF GROWTH 1613
capital growth and rl=/32. X / Y is elasticity with respect to export growth or the parameter that defines the force of the export externality effect. Equation 3 can be operationalized in CGE form, and the export externality level equations used by de Melo and Robinson (1990), hereafter "DMR," are exactly equivalent to the dynamic form given above.
This equation does not, however, explicitly represent human capital effects that are closely correlated with capital investment, such as learning- by-doing gains from new technology embodied in new (largely imported) equipment. These gains enhance the effectiveness of physical capital, and can be represented in the first term with a higher c~ over and above the direct elasticity of physical capital. But since we wish to track the learning-by- doing human capital effect separately from the contributions of physical capital and exports, it would be better to represent it independently.
This can be done by adapting a formulation introduced by DMR, who propose that imported capital equipment enhances the effectiveness of all existing capital stock Ki in each sector through an externality-like effect. This idea is operationalized in equation 4 below, where K~q m is imported equipment capital, k m its value in the base year and ~ is the elasticity ~etermining the extent of the imported equipment externality, which is discussed below. Ki e is the effective, enhanced total capital stock and Meq is the previous years imports of machinery and equipment. Domestically produced equipment and machinery are assumed not to contribute to this enhancement.
K m m ,.. M m ~, : " : -~- e q / K e q ) K i K i (~q /K~q) Ki (1 • (4)
The form of the import externality adopted here is somewhat different from that of DMR, who include an import externality operating through imported heavy manufactures (assumed to be machinery and equipment), denoted by M,v. They assume that the capital stock for the whole economy Kis enhanced to an effective value /(" by machinery imports only over the base level /15I/4 as follows. ~ Ki = K e = (M/4/M_/4) v . R for values of M f t >/15//4 and K e : K for M/4 <_ M/4. The essence of this formulation is that only machinery imports in excess of the base year value contribute to extra productiv- ity growth. The form used here is felt to be more plausible, II since "learning-by-doing" productivity benefits from imported machinery continue to accrue for many years beyond installation. Hence the benefit deriving from a subsidy to new equipment is like a stream of "returns" on investment, albeit declining. This is important in assessing the impact of subsidies to imported machinery on growth.
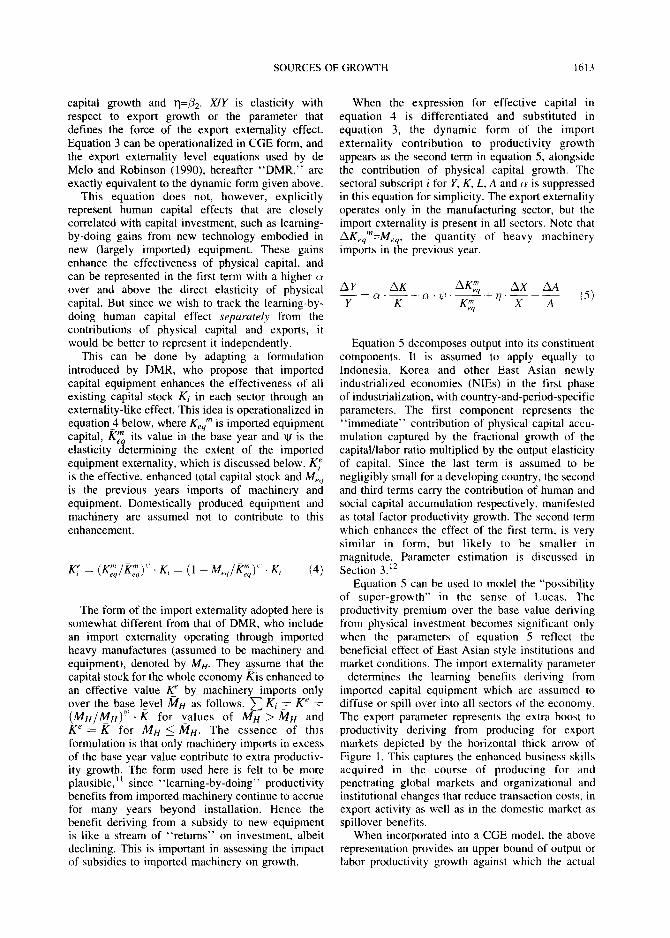
When the expression for effective capital in equation 4 is differentiated and substituted in equation 3, the dynamic form of the import externality contribution to productivity growth appears as the second term in equation 5, alongside the contribution of physical capital growth. The sectoral subscript i for 11, K, L, A and c~ is suppressed in this equation for simplicity. The export externality operates only in the manufacturing sector, but the import externality is present in all sectors. Note that AKeqm=Meq, the quantity of heavy machinery imports in the previous year.
A Y A K AK~"q A X A A - - = c~ • - - ~ ~ . t : , . + + ( 5 )
Y K --2-
Equation 5 decomposes output into its constituent components. It is assumed to apply equally to Indonesia, Korea and other East Asian newly industrialized economies (NIEs) in the first phase of industrialization, with country-and-period-specific parameters. The first component represents the "immediate" contribution of physical capital accu- mulation captured by the fractional growth of the capital/labor ratio multiplied by the output elasticity of capital. Since the last term is assumed to be negligibly small for a developing country, the second and third terms carry the contribution of human and social capital accumulation respectively, manifested as total factor productivity growth. The second term which enhances the effect of the first term, is very similar in form, but likely to be smaller in magnitude. Parameter estimation is discussed in Section 3.12
Equation 5 can be used to model the "possibility of super-growth" in the sense of Lucas. The productivity premium over the base value deriving from physical investment becomes significant only when the parameters of equation 5 reflect the beneficial effect of East Asian style institutions and market conditions. The import externality parameter
determines the learning benefits deriving from imported capital equipment which are assumed to diffuse or spill over into all sectors of the economy. The export parameter represents the extra boost to productivity deriving from producing tbr export markets depicted by the horizontal thick arrow of Figure 1. This captures the enhanced business skills acquired in the course of producing for and penetrating global markets and organizational and institutional changes that reduce transaction costs, in export activity as well as in the domestic market as spillover benefits.
When incorporated into a CGE model, the above representation provides an upper bound of output or labor productivity growth against which the actual

1614 WORLD DEVELOPMENT
performance of a newly industrializing country such as Indonesia can be assessed. The exercise provides for a more nuanced modeling of productivity growth beyond factor accumulation and "disembodied technical change."
2. INDUSTRIAL AND EXPORT TRENDS IN INDONESIA IN THE EIGHTIES AND BEYOND
The investigation of economic performance undertaken in this study is situated in the adjustment period of 1982-83 to 1987-88, which was a watershed for Indonesia. The rapid growth of the 1970s was sustained largely by oil, liquified natural gas and other non-renewable exports. During the period of slower growth which began with the first oil shock of 1982-83 (i.e. a drastic fall in the price of oil), the country embarked on a program of stabilization and structural adjustment (SSA) which steadily reduced dependence on resource-based exports.
Unlike most other countries that experienced SSA episodes, Indonesia initiated reform on its own volition, without World Bank-International Mone- tary Fund loans or conditionality. This was possible because of Indonesia's continued export strength and its conservative fiscal policies which made for a high international credit standing. Another crucial feature is that oil windfall profits were recycled into the agrarian sector (Thorbecke, 199 l).
Following the reforms, Indonesia's industrial growth accelerated. The share of manufacturing value added in GDP, which had grown from 8% in 1965 to 14% in 1985, then rose to 22% by 1991. Real manufacturing output has more than doubled from 1985-90. From 1988, following the second round of stabilization measures (1986-88), the economy entered a period of strong growth led by non-oil exports which, from 1990, are well in excess of oil exports (Bhattacharya and Pangestu, 1993; UNIDO, 1993).
Productivity-wise Indonesia's growth is seen as mostly "investment-driven" (World Bank, 1993), made possible by high levels of capital investment financed by oil and energy exports. For comparison, Korea's recovery from adjustment in the 1980s is seen as "productivity-driven" since labor productiv- ity grew around 6% per year over 1980-88. The figure for Indonesia in the same period is a low 2% per year, whereas over 1973-80, output per worker had grown by 6.8% per year on average (estimates from Summers and Heston, 1991 data). The low figure for the 1980s is clearly linked to a more difficult phase of restructuring from a weaker industrial base.
Estimates of total factor productivity growth, discussed in Section 1.1 above, confirm the above
conclusion. In the 1980s, the institutions, export orientation and industries characteristic of East Asia were definitely not in place in Indonesia. In this period, however, the share of processed foods and chemical fertilizers which had constituted the mainstay of Indonesia's industrial exports, declined sharply. The surge of manufactures exports reported above took place mainly in textiles and garments and wood processing and furniture. Presently, diversifi- cation has expanded to higher value-added indus- tries, and industries such as consumer electronics are being established on a significant scale (UNIDO, 1993).
3. THE PRODUCTIVITY SIMULATION MODEL
(a) Salient features of model
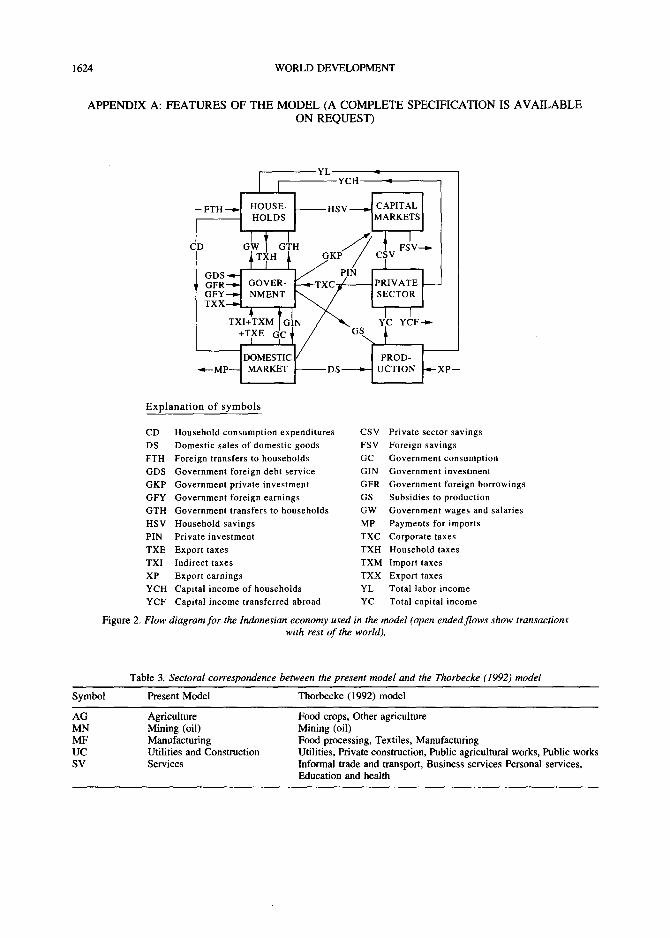
Productivity growth is simulated on a five-sector CGE model. The model derives partly from the highly detailed Thorbecke (1992) Indonesia model and partly from the export-led growth model of de Melt and Robinson (1990) referred to here as the DMR model. The present model is based on the data system of the Thorbecke model, including the 1980 OECD Indonesia Social Ac- counting Matrix (SAM). 13 Since the 1980 SAM, parameter values and model equations are docu- mented in the Thorbecke model, they are not repeated here. The equations that simulate produc- tivity growth, which are absent in the Thorbecke model, are detailed in Section 1.3 above. A complete formal specification of the model along with explanatory notes, are available on request. The 14 production sectors in the Thorbecke model are aggregated as indicated in Appendix A. The model closure specifications are given in Appendix B.
The justification for the simplification of sectoral structure is straightforward. The main objective of the exercise is to examine productivity effects operating through the manufacturing sectors, its exports and imports. Hence these have to be aggregated. Agriculture and mining are sufficiently distinct and large to warrant separate sectors. Finally, the four service sectors are combined into a single service sector. The remaining four sectors are grouped together in a utilities and construction sector which is relatively small. 14 The changing structure of the economy during 1980-87 is depicted in Appendix A.
The model has a more elaborate government sector than the DMR model; in fact the key revenue and expenditure categories of the Thorbecke model are retained, to better examine the fiscal implications of the productivity experiments. Tax rates, subsidies, transfers and other expenditures can be varied
SOURCES OF GROWTH 1615
exogenously according to government policy. In turn, final demand subsidies to manufacturing industry are endogenously determined through the operation of the model. A complete diagram of income and expenditure flows, inclusive of the government sector, are given in Figure 2 in Appendix A.
The model is calibrated with the base period capital and labor stocks. Then in each simulation experiment, the capital and labor stocks are en- hanced by the annual growth components, sector- wise, and a new equilibrium set of prices and quantities are found corresponding to the enhanced output capacity. It is thus a two-period model in which the one-year growth represents average growth performance over the five year period) 5 Some explanation and qualifications are warranted when this approach is compared to the DMR procedure; these are taken up in Section 4.
(b) Estimation of the productivity parameters
with appropriate levels of human and social capital. Hence it is necessary to use the most optimistic of feasible values, which range from the 1991 estimate of 0.05 to 0.1 which is the upper limit taken from Korea. For the experiments performed here, an intermediate export elasticity value of q--0.067 was chosen as a suitably conservative estimate for Indonesia. The import elasticity value of W---0.1 is used without modification since this is assumed to be independent of macroeconomic variables. 17
In all simulations disembodied productivity growth (of the £xA/A term) are assumed to be zero, unlike in the DMR exercise. DMR also factors in increasing intermediate input structure. This is justifiable for a 10-year simulation. This procedure is dispensed with in the present exercise, since comparable data for Indonesia are not available. In any case the main objective is to examine the possible growth bonus deriving from trade related human capital effects. These issues are discussed below.
Productivity growth in the model depends on the externality parameter values r I and ~, which are taken from the DMR simulation with the following corrections for Indonesia. In the DMR exercise, the import and export externality elasticities are worked out by a trial-and-error procedure. The DMR model is designed to represent physical accumulation and sectoral productivity growth as observed in Korea for 1975-85. To obtain the overall growth observed in Korea for this 10-year period, the DMR simulation finds it necessary to add together the productivity bonuses deriving from both the export externality and import externality with values of rl=~=0.1.
Since the possibility of crosscountry calibration was assumed for equation 5, the following adjusted parameter values can be derived for the present simulations. Since rI=132.X/Y the 1"1 value for Indonesia can be estimated from the manufactures exports X and GDP Y for the two countries. There is some uncertainty about what categories of published data should be considered as "manufactures" ex- ports, for purposes of this application. As a result, if Indonesia in 1983 is compared with Korea in 1975, the estimate can be narrowed to rl=0.01+0.005. For Indonesia in 1991, when non-resource exports had grown to exceed resource-based exports, the value is estimated to have risen to over 0.05) 6
It is clear that the 1983 estimate of the externality parameter would give negligible productivity gains by comparison with Korea since it is an order of magnitude smaller. The purpose of the simulation, however, is not to model what actually happened, but to determine what gains would have been possible in the early-to-mid 1980s had a Korean-style export oriented institutional structure been in place along
4. MODELING STRATEGY, POLICY INSTRUMENTS AND DATA IMPERFECTIONS
Successful modeling in economics involves a strong element of strategic simplification, possibly more than in other quantitative disciplines. The model must have enough structure to handle the problem under investigation, but not much more. The choices made here are examined in relation to this criterion and compared with both the DMR formulation and the Thorbecke (1992) real-cum- financial model.
The first issue relates to the selected simulation period, the 1982-83 to 1987-88 period of adjust- ment. The present model is based on the carefully constructed 1980 SAM appropriately updated. The required parameter values were also available from the more detailed Thorbecke model, though even here some assumptions had to be made in arriving at appropriate elasticities for the consolidated sectors.
The model simulates the annual growth rates during the 1982-83 to 1987-88 period on average. 18 The productivity growth scenarios, which reflect Korea-style institutions, are imposed as counter- factuals on the actual base run performance of the economy during this period. If there is no structural change in the model, a 10-year simulation ~ la DMR gives no more information than a single year's growth since there are no feedback effects in the model. Feedback would exist if investment was endogenous; but this would require a multiperiod dynamic formulation which neither DMR nor the present model possess.
An important question is whether the assessment of incremental productivity gains, is sensitive to
1616 WORLD DEVELOPMENT
assumptions of structural change in the model. To resolve this question, a simulation with structural change is attempted by making change assumptions similar to DMR, with the best available information. In general with rising industrialization and produc- tivity growth, exports and imports play a larger role in the economy. Since the productivity gains examined here depend on exports and imports, this exercise indicates their sensitivity to structural change in a general way.
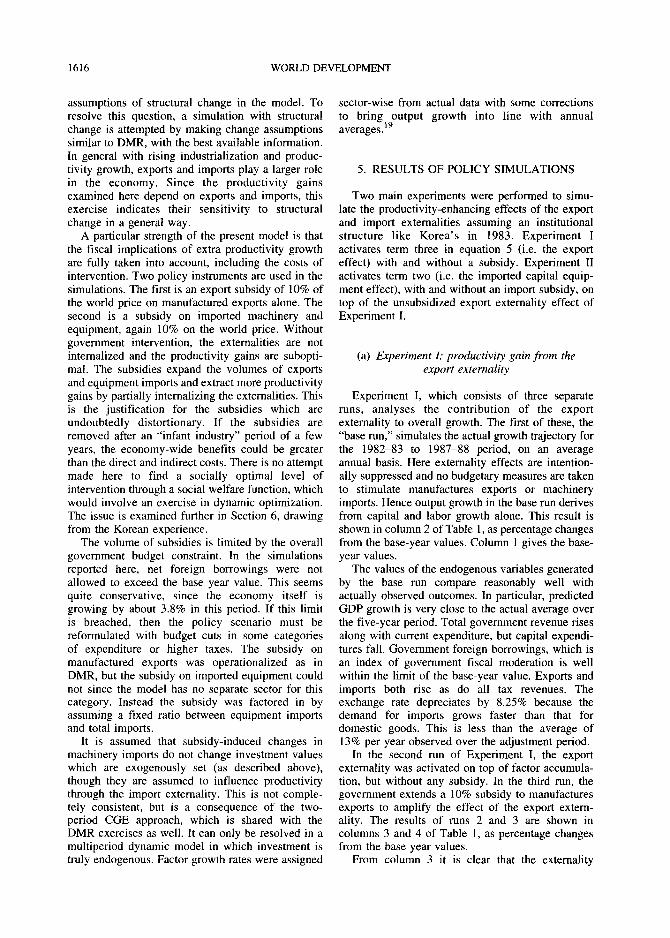
A particular strength of the present model is that the fiscal implications of extra productivity growth are fully taken into account, including the costs of intervention. Two policy instruments are used in the simulations. The first is an export subsidy of 10% of the world price on manufactured exports alone. The second is a subsidy on imported machinery and equipment, again 10% on the world price. Without government intervention, the externalities are not internalized and the productivity gains are subopti- mal. The subsidies expand the volumes of exports and equipment imports and extract more productivity gains by partially internalizing the externalities. This is the justification for the subsidies which are undoubtedly distortionary. If the subsidies are removed after an "infant industry" period of a few years, the economy-wide benefits could be greater than the direct and indirect costs. There is no attempt made here to find a socially optimal level of intervention through a social welfare function, which would involve an exercise in dynamic optimization. The issue is examined further in Section 6, drawing from the Korean experience.
The volume of subsidies is limited by the overall government budget constraint. In the simulations reported here, net foreign borrowings were not allowed to exceed the base year value. This seems quite conservative, since the economy itself is growing by about 3.8% in this period. If this limit is breached, then the policy scenario must be reformulated with budget cuts in some categories of expenditure or higher taxes. The subsidy on manufactured exports was operationalized as in DMR, but the subsidy on imported equipment could not since the model has no separate sector for this category. Instead the subsidy was factored in by assuming a fixed ratio between equipment imports and total imports.
It is assumed that subsidy-induced changes in machinery imports do not change investment values which are exogenously set (as described above), though they are assumed to influence productivity through the import externality. This is not comple- tely consistent, but is a consequence of the two- period CGE approach, which is shared with the DMR exercises as well. It can only be resolved in a multiperiod dynamic model in which investment is truly endogenous. Factor growth rates were assigned
sector-wise from actual data with some corrections to bring output growth into line with annual averages.
5. RESULTS OF POLICY SIMULATIONS
Two main experiments were performed to simu- late the productivity-enhancing effects of the export and import externalities assuming an institutional structure like Korea's in 1983. Experiment I activates term three in equation 5 (i.e. the export effect) with and without a subsidy. Experiment II activates term two (i.e. the imported capital equip- ment effect), with and without an import subsidy, on top of the unsubsidized export externality effect of Experiment I.
(a) Experiment 1: productivity gain from the export externality
Experiment I, which consists of three separate runs, analyses the contribution of the export externality to overall growth. The first of these, the "base run," simulates the actual growth trajectory for the 1982-83 to 1987-88 period, on an average annual basis. Here externality effects are intention- ally suppressed and no budgetary measures are taken to stimulate manufactures exports or machinery imports. Hence output growth in the base run derives from capital and labor growth alone. This result is shown in column 2 of Table 1, as percentage changes from the base-year values. Column 1 gives the base- year values.
The values of the endogenous variables generated by the base run compare reasonably well with actually observed outcomes. In particular, predicted GDP growth is very close to the actual average over the five-year period. Total government revenue rises along with current expenditure, but capital expendi- tures fall. Government foreign borrowings, which is an index of government fiscal moderation is well within the limit of the base-year value. Exports and imports both rise as do all tax revenues. The exchange rate depreciates by 8.25% because the demand for imports grows faster than that for domestic goods. This is less than the average of 13% per year observed over the adjustment period.
In the second run of Experiment I, the export externality was activated on top of factor accumula- tion, but without any subsidy. In the third run, the government extends a 10% subsidy to manufactures exports to amplify the effect of the export extern- ality. The results of runs 2 and 3 are shown in columns 3 and 4 of Table 1, as percentage changes from the base year values.
From column 3 it is clear that the externality

SOURCES OF GROWTH 1617
Table 1. Experiment I: Gains from export externality with and without export subsidy; (annual average percentage change over adjustment period from row 7, column 2-4 as indicated)
Description of run Base year Factor growth Export externality Export externality (absolute values) alone alone + subsidy
Price level 1.00 1.00 1.00 Externality parameter .067 Export subsidy (% of
price) Export subsidy (% of
base GDP) Effective TFP growth % 0.49 Manufactures exports to 9.49 l 1.3 11.5 total exports ratio
(Base year values in RupiahTrillion) (Percentage change from base year values)
1.00 .067
10.0
0.43
0.87 12.0
Real GDP 48.4 3.65 4.14 4.52 Exchange rate 1.00 8.26 8.68 7.75 Total exports 16.2 7.00 7.67 7.03 Total imports 9.90 6.87 6.97 6.99 Manufactures exports 1.53 26.9 30.2 35.3 Govt. foreign 1.10 -7.67 - 10.4 -2.77
borrowings Total revenue 10.3 3.87 4.28 4.58 Current expenditures 6.95 7.44 7.65 10.3 Capital expenditures 4.49 2.61 2.61 4.18
generates nearly 0.5% of effective TFP (and GDP) growth over and above the 3.65% deriving from factor accumulation alone. The exchange rate rises slightly more as do exports and imports. Government current expenditures rise and capital expenditures fall, with respect to the base year, much as before. The budget deficit declines even further, since foreign borrowings decline by 14.6%. Government revenues are clearly boosted by the productivity gain.
The export subsidy of 10% raises the TFP contribution from 0.49% to 0.87% while incurring an extra expenditure of Rp.billion 208, which is 0.43% of base GDP. When other government expenditures were maintained at previous levels, the subsidy was found to raise foreign borrowing slightly above the base-year level. To operate within that limit government spending has to be cut somewhere else. Many possibilities exist, but the result given in column 4 is obtained with government consumption limited to a lower annual growth rate of 3% and government capital participation in private investment cut to 60% of the base year value instead of the originally planned reduction to 75%. With this cut, foreign borrowing falls under 2.78% of the debt limit. An alternative would have been to limit consumption to a 2% rise and reduce capital participation to 65%.
The export subsidy also raises the ratio of manufactures exports to total exports, but curtails the rise of total exports. As indicated above, factor expansion alone raises manufactures exports by 27%
in value. This rises to 30% with the externality and to 35% with the added subsidy. The extra benefit generated by the subsidy is, however, only Rp.billion 184 or 0.38% of GDP, which is less than the cost of the subsidy. But, productivity gain must be treated as a recurring dividend on investment rather than a one- shot boost, because it derives from human and social capital accumulation, as argued earlier.
Though less than the export-derived gains cap- tured by Korea, the TFP boost to GDP of 0.5~0.9% is still quite substantial. Further, this estimate is quite conservative since productivity-raising human and social capital spillover to other sectors is not included in the present model. When the value of the externality parameter was raised to 0.1 (the value used in DMR for Korea), the resultant TFP boost was found to be 0.78% without the subsidy and 1.23% with the subsidy. While this might have been an optimistic prospect for Indonesia in the mid-1980s, it would appear quite feasible in the early 1990s.
(b) Experiment II: product ivi~ gains from export and import externalities
This experiment brings on board the additional sources of productivity growth in stepwise fashion in two extra runs, but without any export subsidies. The results, given in Table 2, are formatted to show the incremental effects as clearly as possible, on top of pure factor accumulation. The base year values shown in Table 1 are not repeated. Column I lists the

1618 WORLD DEVELOPMENT
Table 2. Experiment II: gains from import and export externalities with and without import subsidy; (annual average percentage change over adjustment period from row 5 down)
Description of run Export externality alone Export externality Export externality + import + import externality externality + import subsidy
Export externality parameter .067 .067 .067 Import externality parameter 0.10 0.10 Import subsidy (% of price) I0.0 Import subsidy (% of base 0.60 GDP) % % %
TFPG from export externality .49 .49 .49 TFPG from import externality .70 .70 TFPG from import subsidy .61 Total TFP growth .49 1.18 1.79 Contribution of factor growth 3.65 3.65 3.65 Real GDP growth 4.14 4.83 5.44
Exchange rate 8.68 8.91 9.46 Govt.foreign borrowings - 10.4 - 14.5 .085 Govt. total revenue 4.28 5.01 5.71 Govt. current expenditure 7.65 8.06 l 1.7 Govt capital expenditure -2.61 -2.61 -2.61
changes from the base year resulting from factor growth and export externality (sans subsidy). It is the same as run 2 reported in column 3 of Table 1, and requires no fiscal stimulus, but results from im- proved market conditions for domestic manufac- tures.
The same is true of the imported machinery externality without subsidies. This is brought in, in the next step, and shown in column 2. Now an extra 0.70 of TFP growth is obtained. The "fiscal dividend" from productivity growth cuts the govern- ment foreign borrowing requirement by 15% and the exchange rate rises by about 8%. Column 3 shows the effect of a 10% subsidy on imported capital equipment, which costs the government 0.6% of GDP. The subsidy provides an additional TFPG boost of 0.61%, thereby raising the total benefit from the imported equipment externality to 1.3%. The immediate costs and benefits from the import subsidy are somewhat higher than those associated with the export subsidy. The import subsidy is justifiable only if the benefits persist into later years, just as with the export subsidy.
As in the case of the export subsidy, the import subsidy entails some curtailment of government expenditures. Government consumption growth was limited to a 2% rise instead of the original 4%, but all other government current and capital expendi- tures were maintained at their planned values. Notice that the foreign borrowing limit is marginally breached to the extent of 0.085% in this case.
The total TFPG premium accumulated from the various sources is now quite substantial at 1.8% of GDP. If the export subsidy is applied as well, the
maximum TFPG gain would climb even further to around 2.2%. The combined scenario could not be simulated because of model limitations.
This run was repeated with the form of the imported machinery externality assumed here re- placed by that assumed in the DMR model. With this formulation, the import externality by itself does not generate any productivity growth because imports of manufactures do not rise above their base year quantity. But when the subsidy is applied, manu- factures imports rise by about 4% and a productivity bonus of 0.783 is realized. This is somewhat less than what is attributed to imports in Table 2 in total.
(c) Externalities with structural change
Experiments were carried out to test the sensitiv- ity of productivity gains examined here to limited structural change in the economy. The changes implemented in the DMR model for a 10-year period were annualized and introduced into the model. The changes are as follows. Exogenous productivity growth of 6% is introduced in the agriculture sector. In addition the input-output coefficients for inter- mediate inputs into agriculture from non-agricultural sectors alone, are raised by 3.42%. The coefficient indicating input from agriculture to manufacturing rises by 7.18%. These changes were found to affect the results reported in Tables I and 2 only margin- ally. Structural change adds about 0.5% of TFPG overall; this is the result of nearly 6% productivity growth in agriculture. Because of the extra growth,

SOURCES OF GROWTH 1619
government revenues are enhanced and the foreign borrowing requirement is reduced.
6. CONCLUSIONS
This paper reports a technique for modeling productivity gains deriving from East Asian-style outward-oriented policies and institutions, which work by promoting exports and encouraging faster deployment of imported production technology. These institutions and policies in turn induce faster accumulation of human and social capital. Since such accumulation cannot be quantified or measured satisfactorily, it is proxied by tractable measures of export growth, export orientation and the growth of imported machinery. These effects are modeled as externalities in an otherwise standard CGE model using well-established representations consistent with the empirically derived insights.
A particular feature of the present approach is that productivity effects, formerly treated as "external- ities" and scale effects are conceptualized as human and social capital accumulation. The contribution of education and health could also have been brought in as a separate source of productivity growth depen- dent on the level of technological advance of the economy. This has not been operationalized here, mainly because there is as yet no justifiable way of endogenizing this contribution in terms of known variables. Though in its early stages, the present approach sets up a methodology which can be further extended, to account for such effects as well.
Subject to the above limitations, it has been possible to derive estimates of the maximum achievable productivity growth possible in a real economy, at a particular stage of development, such that its determinants are not arbitrary but related to quantifiable, measurable variables based on a realistic CGE model. The model is also able to separately compute the gains from the impact of exports and imported capital equipment. Since the fiscal implications of productivity growth, both costs and benefits are assessed in a general equilibrium framework, the approach is particularly useful for policy analysis.
It is now possible to give an answer to the question about Indonesia's prospects as a dynamic East Asian economy? If the modeling procedures developed here are valid, then the prospects are good: with export and imported equipment related externalities, annual productivity gains of up to 1.2% are possible. This could be doubled to over 2% with modest export subsidies and subsidies to imported capital equipment, which are undoubtedly distor- tionary, but short-lived. The effects of normal structural change and autonomous productivity growth deriving from better education, health and
other general human capital effects, could contribute up to another 1%, though that has not been assessed here. Further, these estimates are derived with conservative assumptions: for example skill spillover across sectors is not allowed for, though there is strong evidence for its existence.
At it's maximum the share of TFPG in total GDP growth could rise to around 40%, a ratio that would lift Indonesia squarely into the ranks of the productivity-driven East Asian tigers (World Bank, 1993). Total GDP is also very high at around 6% per year. These are, of course, upper limits on realizable productivity gains and actual performance could be less. But the modeling exercise shows that the maximum TFPG gains also rise with rising income levels. Hence the gains predicted from a model calibrated with post-1990 data should be consider- ably higher.
It is important to emphasize that the productivity gains analyzed are potential benefits, possible only if the conditions that generate them are put in place. These conditions relate to institutional moderniza- tion, liberalization leading to competitive market conditions as in Korea and Taiwan and sustained efforts to develop health, education and other components of the social infrastructure. The model- ing results indicate that appropriate subsidies can accelerate the process. But if the above preconditions are absent, they cannot be created by the shuffling around of subsidies. It is well known that the use of subsidies to promote industrialization has succeded in only a few cases and only within specific institutional contexts.
In a recent book, Stern et al. (1995) evaluate the Korean heavy and chemical industry (HCI) drive, which was launched in 1973 and abandoned in 1979. In the 1960s, before HCI, all light manufactures exports were uniformly subsidized, with export targets set by the producers themselves, since these were the only sectors that could become internation- ally competitive in a relatively short space of time. But with the HCI drive, the government began to promote specific industries and firms in accordance with its industrial policy. Much of the debate on industrial policy hinges around the question of whether the HCI effort helped or hindered Korea's progress.
They conclude that at worst, detrimental effects were small and at best, HCI may well have accelerated Korea industrialization. 2° Following the liberalization of the 1980s and the progress made by then, the private sector could well have undertaken these initiatives without government assistance. They point out, however, that the post-1985 accel- eration of heavy industrial exports such as steel and automobiles would not have been possible without the earlier HCI program of the 1970s. What could perhaps be inferred is that for a country with a
1620 WORLD DEVELOPMENT
rapidly developing private sector, temporary protec- tion followed by general liberalization, could well accelerate the hazardous transition to more complex technologies which then lead to faster accumulation of specific industrial skills.
One way to model these facilitation processes would be as externalities within a static CGE framework, as at tempted in this paper. These externalities could also be construed as dynamic scale economies, which at the most fundamental level result from productivity gains deriving from the accumulation of "skill capital" in individuals and organizations and the formation of market-friendly institutions. This is an attempt to extend the scope of the standard neoclassical modeling framework with constant returns to scale and disembodied technical progress. 21
The model is not able to analyze the implications of subsidies to specific manufacturing sectors since these are not separately represented. Even with a more detailed model the international demand conditions for specific Indonesian manufactures, are not amenable to simple modeling. If the productivity stimulating effects of such a policy are similar to the effects modeled here, however, at least
the fiscal implications derived from the reported runs provide a rough guide to expected benefits.
The present model is also deficient in the following respect. It does not account for positive human capital spillover effects across sectors and for the mutually reinforcing interaction between pro- ductivity growth and investment. It is known that productivity growth in rapidly industrializing coun- tries promotes faster savings which in turn raise investment rates. Higher rates of investment accel- erate productivity growth, thereby completing a positive feedback loop. This could not be modeled in the present two-period model, in which investment is exogenous. Such a simulation requires a multi- period dynamic model. These deficiencies, however, understate the extent and scope of the potential benefits.
Even though the present model is not an entirely accurate representation of the Indonesian economy in the mid-1980s, the simulation has established the following result. The incremental productivity gains realized, are robust to fairly large variations (of up to 10%) of the sectoral output values, parameters and variables. Like other CGE models, it is thus adequate for estimating changes from base scenarios.
NOTES
1. A related issue is whether active industrial policy can push this process forward faster. The most ambitious current plan to force the pace of human capital accumula- tion in Indonesia has been the setting up of an aeronautics industry through the state-owned company IPTN, which is a heroic attempt to emulate Korean industrial policy success in steel and shipbuilding. IPTN is not expected to become internationally viable in the foreseeable future. The problem is that IPTN was not built on a natural pyramid of skills developed in related and supporting industries; it has therefore continued to draw excessive state subsidies. By contrast, the aircraft maintenance and service industry is doing quite well and is now authorized to overhaul and maintain engines produced by five major global companies (UNIDO, 1993).
2. Problems of TFPG estimation are discussed in Nelson (1964, 1981) and Fagerberg (1994).
3. TFPG of about 1-2% has been estimated for the high growth boom years 1967-81. Post-crisis TFPG falls to negative values, -2.5% during 1982-85 and - 1.1% during 1985-87; it turns positive again at 2.2% during 1988-91, when adjustment is transcended (Bhattacharya and Panges- tu, 1993).
4. These insights are now common (Fagerberg, 1994). A review of learning-by-producing and other non-physical accumulation activity, along with a more complete exposi- tion of the issues examined in this section, are given in Rodrigo (forthcoming). The concept of "social infrastrnc-
tural capital" is similar to the broader concept of "social capital" identified by Putnam (1993, 1995).
5. It appears that measures of formal education are only weakly correlated with productivity growth (De Long and Summers, 1992; Levine and Renelt, 1992). This is not inconsistent with the intuition that formal education is important. Education is a necessary but not sufficient condition for economic success, i.e. it is a complementary input into the growth process. Though education and literacy levels were high in Sri Lanka, little growth took place until market oriented reforms were instituted.
6. This decomposition derives from the work of Pack (1987, 1988) and Nishimizu and Page (1982) in identifying and estimating the importance of technical efficiency.
7. One important consequence of this is the setting up of a positive feedback loop linking capital accumulation to productivity growth which promotes greater savings and investment, thus completing the loop back to capital accumulation. Empirical evidence that the savings rate is positively related to the growth rate has recently been offered by Edwards (1995).
8. An approach to modeling trade policy in Korea based on increasing returns to scale, has been developed by de Melt and Roland-Hoist (1991a, b, 1994). This alternative approach, to that adopted here, is discussed in Note 21.
9. The intuition here is that increasing openness generates strong competitive pressures that accelerate

SOURCES OF GROWTH 1621
productivity growth through the drive for cost and quality gains. This is the direct effect of exports which is realized as technical efficiency advance. Greater openness and competitive pressure associated with the growth or promo- tion of exports also accelerates business-friendly institu- tional change which in turn contributes to productivity growth by reducing transaction costs for all business activity. The linkage with multinational business organiza- tions also accelerates institutional modernization. In addi- tion, competitive pressures compel finns to upgrade machinery and equipment faster, thereby promoting productivity growth deriving from new investment. But institutional change would be promoted by other domestic effects not associated with exports. Overall productivity growth would also be promoted by rising levels of education and health, the development of physical infra- structure and, not least, rising government efficiency (Rodrigo, forthcoming).
10. zXA/A now carries all non-physical productivity effects which are not captured by terms two and three. Thus its role is similar to that of the former Solow productivity factor, i.e. it is the "residual of the residual", but now the absolute magnitude of the "unexplained residual" has been reduced substantially.
l 1. It should be noted that in developing countries capital equipment is mostly imported. If it is assumed that technological progress (which is one component of productivity growth) is embodied in new equipment, then the contribution of this term is approximately the progress of the best practice frontier. This formulation is in line with the arguments of Nelson (1981), Nelson and Pack (1996) and the findings of De Long and Summers (1991, 1992), Boskin and Lau (1992) and Kim and Lau (1994). The simple intuition is that new equipment is the vehicle for skill-productivity progress in industrial activity through ' 'learning-by-doing.' '
12. The formulation of equation (5) could also be tested econometrically for significance and the parameters estimated, but it has not been possible to obtain adequate data on machinery and equipment investment for Indonesia or even Korea.
13. The model is based mainly on real variables. Financial variables that appear in the Thorbecke (1992) model are absent.
14. The de Melo-Robinson (DMR) model was developed specifically to study the effects of trade-related external- ities. The model has four sectors, agriculture, light manufacturing, heavy manufacturing and services. Here heavy manufacturing is mainly the capital goods sector. The DMR import externality, which captures the produc- tivity enhancing effect of new equipment (most of which is imported), operates exclusively through imports in this sector. The export externality operates through exports of both light and heavy manufactures. While DMR is particularly suitable for the study of trade externalities, a separation into heavy and light manufacturing was not possible here. Neither the Thorbecke model nor the OECD 1980 SAM provides data on these categories separately. As
a result, the two effects have to be examined in separate simulations.
15. In the DMR model, factor accumulation is similarly imposed exogenously, but on aggregate capital and labor stocks over a 10-year period. The model then allocates sector-wise factor enhancements in the course of finding the new equilibrium solution. When this procedure was tried out here, it was found that the resulting factor growth bore no relation at all to actual factor growth as obtained from published data. In response to the above problem, a different approach was adopted. Data on fixed capital stocks and annual investment values were available in Keuning (1991). Average annual investments by sector for 1980-85, were calculated and used to represent exogen- ously determined capital growth in the model. Labor growth was similarly taken from actual average labor force expansion rates. It is a closer representation of actual dynamics in the Indonesian economy and therefore preferable for studying the implications of the productivity enhancement effects which are the prime objective of this simulation.
16. Data for these estimates are taken from Pangestu (1992), UNIDO (1993) and World Bank (1993).
17. The total capital to output ratios were more or less the same for the two countries at the appropriate time periods. Hence the import elasticity value of 0.1 was used without change. From the Keuning (1991) survey, machinery and equipment was found to constitute 29.81% of the total capital stock in 1980. Of this, 74.8% was imported and the rest produced domestically. If these ratios are applied to the total average investment values in the simulation, the quantity of imported equipment and machinery capital works out to Rupiah billion 2659. This is almost exactly one-third of total machinery imports in the base year, which checks out well with the ratio obtained from trade data.
18. The present model is less ambitious than the DMR exercise which attempts to capture a decade of growth and structural change. In DMR, structural change is represented by exogenously changing the disembodied productivity factors sector-wise and modifying the coefficients in the Leontief intermediate demand input-output matrix. The data for these changes are taken from the well-known study "Industrialization and Growth" by Chenery et al. (1986) which provides a comprehensive catalogue of growth and structural change in industrializing countries. A similar exercise is carried out here, but the validity of the results obtained is questionable. Without directly estimated data on sector-wise productivity growth in Indonesia and reliable SAMs for two widely separated years (say 1988 or at least 1985 in addition to 1980), such an exercise would be a shot in the dark.
19. Output values resulting from nominal factor expan- sion data were not consistent with actually observed sectoral growth rates because of labor hoarding and capacity utilization problems which are quite common in Indonesia (Poot et al . , 1990). The segmentation of labor markets is actually allowed for, to some extent, by including sector-specific production functions and labor and capital returns that are allowed to differ across sectors.

1622 WORLD DEVELOPMENT
But there could be other structural constraints that block the adjustment of prices assumed in the CGE model.
20. Stern et al. (1995, pp. 183-191) argue that in the particular context of that period (1973-79), Korean firms would not have been able to build the Pohang Iron and Steel Complex and other large scale plants without government guarantees and hundreds of millions of dollars in credits. At this time, " the Korean economy... .like many other economies in the developing world, was a far cry from some free market ideal. The banks were government owned, and loans were made at subsidized rates at government direction. Much of the infrastructure-electric power for example- was also provided by state-owned enterprises. Imports of critical inputs were subject to government quotas." And so on. By the 1980s much of these controls had been dismantled and those that remained operated more in accordance with market principles. The use of subsidies in this context is clearly seen as an attempt to compensate for market imperfections.
21. A different approach is taken by de Melo and Roland- Holst (1991a, b, 1994). In these studies trade liberalization and protection are modeled for Korea with increasing returns to scale (IRTS) in some industrial sectors. The papers construct a theoretical rationale for Balassa's insight into the value of temporary protection in developing nations
to exploit learning effects and externalities associated with new industries. Their studies have the advantage that trade policy is modeled with an endogenously determined, imperfectly competitive market structure. They find that the costs and benefits of import tariffs and export subsidies greatly exceed the distortionary costs of protection derived under conditions of constant returns to scale. Illustrative calculations also show that with IRTS, the welfare gains or losses from trade policy intervention are sensitive to features of all industrial sectors and not just those subject to protection. These results explain why policies that have seemed to work in East Asia have led to inefficient monopolies in many other countries. Imperfect competition is absent in the present model. Indeed, the approach here which models productivity growth deriving from external- ities, is an alternative formulation. The relationship between such models and empirical evidence in general, is best summed up by Dani Rodrik's comment at the end of the first paper cited: "It has now become commonplace to point out that the markets of developing countries are rife with imperfect competition and unexploited scale econo- mies, on account of which trade liberalization can either go horribly wrong or magnify the conventional gains from trade. Since sensible theoretical models can be constructed to demonstrate the possibility of either outcome, we must rely on empirical evidence to fortify our intuition regarding likely scenarios."
R E F E R E N C E S
Bhattacharya, A. and Pangestu, M. (1993) Indonesia: development, transformations and public policy. World Bank, Washington DC.
Boskin, M. J. and Lau, L. J. (1992) Capital, technology and economic growth. In Technology and the Wealth of Nations, eds. N. Rosenberg, R. Landau and D. Mowery, pp. 17-55. Stanford University Press, Stanford CA.
Charos, E. N., Simos, E. O. and Thompson, A. R. (1996) Exports and industrial growth: a new framework and evidence. Journal of Economic Studies 23(1), 8-31.
Chenery, H., Robinson, S. and Syrquin, M. (1986) Industrialization and Growth: a Comparative Study. Oxford University Press, New York.
De Long, J. B. and Summers, L. H. (1991) Equipment investment and economic growth. Quarterly Journal of Economics 1116(2), 445-502.
De Long, J. B. and Summers, L. H. (1992) Equipment investment and economic growth: How strong is the nexus? Brookings Papers on Economic Activity, 157- 211.
Edwards, S. (1995) Why are saving rates so different across countries: an international comparative analysis. Work- ing Paper No. 5097, National Bureau of Economic Research, Cambridge.
Fagerberg, J. (1994) Technology and international differ- ences in growth rates. Journal of Economic Literature 32(3), 1147-1175.
Feder, G. (1986) Growth in semi-Industrial countries: a statistical analysis. In Industrialization and Growth: a Comparative Study, eds. H. Chenery, S. Robinson and M. Syrquin, pp. 263-282. Oxford University Press, New York.
Hall, R. E. (1990) Invariance properties of Solow's productivity residual. In Growth, Productivity, Unem- ployment, ed. P. Diamond, pp. 71-112. MIT Press, Cambridge MA.
Keuning, S. J. (1991) Allocation and composition of fixed capital stock in Indonesia: an indirect estimate using incremental capital value added ratios. Bulletin of Indonesian Economic Studies 27(2), 91-119.
Kim, J.-I. and Lau, L. J. (1994) The sources of economic growth of East Asian newly industrialized countries. Journal of the Japanese and International Economies 8, 235-271.
Krueger, A. O. (1995) East Asian experience and endogenous growth theory. In Growth Theories in the Light of the Asian Experience, eds. T. Ito and A. O. Krueger, pp. 9-36. University of Chicago Press, Chicago.
Krugman, P. (1994) The myth of Asia's miracle. Foreign Affairs 73(6), 62-78.
Levine, R. and Renelt, D. (1992) A sensitivity analysis of cross-country growth regressions. American Economic Review 82(4), 942-963.
Lucas, R. E. (1993) Making a miracle. Econometrica 61(2), 251-272.
Melo, J. de and Robinson, S. (1990) Productivity and externalities: models of export-led growth. WPS 387, World Bank, Washington DC.
Melo, J. de and Roland-Hoist, D. (1991a) An evaluation of neutral trade policy incentives under increasing returns to scale. In Trade Theory and Economic Reform: North, South and East; Essays in Honor of Bela Balassa, eds. J. de Melo and A. Sapir, pp. 82-98. Basil Blackwell, Cambridge MA.
SOURCES OF GROWTH 1623
Melo, J. de and Roland-Hoist, D. (1991b) Industrial organization and trade liberalization: evidence from Korea. In Empirical Studies of Commercial Policy, ed. R. Baldwin, pp. 287-310. University of Chicago Press, Chicago.
Melo, J. de and Roland-Hoist, D. (1994) Tariffs and export subsidies when domestic markets are oligopolistic: Korea. In Applied General Equilibrium and Economic Development: Present Achievements and Future Trends, eds. J. Mercenier and T. N. Srinivasan, pp. 191-215. University of Michigan Press, Ann Arbor.
Nelson, R. R. (1964) Aggregate production functions and medium-range growth projections. American Economic Review 54(5), 575-606.
Nelson, R. R. (1981) Research on productivity growth and productivity differences: dead ends and new departures. Journal of Economic Literature 19(3), 1029-1064.
Nelson, R. R. and Pack, H. (1996) Firm competencies, technological catch-up, and the Asian Miracle. Paper prepared for Conference in Honour of Gustav Ranis, Yale University, New Haven.
Nishimizu, M. and Page, J. M. (1982) Total factor productivity growth, technological progress, and techni- cal efficiency change: dimensions of productivity change in Yugoslavia, 1965-78. Economic Journal 92, 920-936.
North, D. C. (1989) Institutions and economic growth: an historical introduction. World Development 17(9), 1319- 1332.
North, D. C. (1993) The ultimate sources of economic growth. In Explaining Economic Growth: Essays in Honour of Angus Maddison, eds. A. Szirmai, B. Vanark and D. Pilat, pp. 65-75. North-Holland, Amsterdam.
Pack, H. (1987)Productivity, Technology and Industrial Development: a Case Study in Textiles. World Bank and Oxford University Press, New York.
Pack, H. (1988) Industrialization and trade. In Handbook of Development Economics, eds. H. Chenery and T. N. Srinivasan, Vol. I, pp. 334--380. North-Holland, Am- sterdam.
Pangestu, M. (1992) Towards non-oil exports. In The Dangers of Export Pessimism: Developing Countries
and Industrial Markets, ed. H. Hughes, pp. 250-276. ICS Press, San Francisco CA.
Poot, H., Kuyvenhoven, A. and Jansen, J. C. (1990) Industrialization and Trade in Indonesia. Gadjah Mada University Press, Yogyakarta, Indonesia.
Putnam, R. D. (1993) The prosperous community: social capital and public life. The American Prospect, 35--42.
Putnam, R. D. (1995) Bowling alone: America's declining social capital. Journal of Democracy 6(1), 65-78.
Rodrigo, G. C. (forthcoming) Trade, Technology and Productivity Growth in East Asia. Edward Elgar Publishing, London.
Srinivasan, T. N. (1995) Long-run growth theories and empirics: anything new? In Growth Theories in the Light of the Asian Experience, eds. T. Ito and A. O. Krueger, pp. 37-72. University of Chicago Press, Chicago.
Stern, J. J., Kim, J.-H., Perkins, D. H. and Yoo, J.-H. (1995) Industrialization and the State: the Korean Heavy and Chemical Industry Drive. Harvard University Press, Cambridge MA.
Summers, R. and Heston, A. (1991) The Penn world table Mark 5: an expanded set of international comparisons, 1950-1988. Quarterly Journal of Economics 56(2), 327- 368.
Thomas, V. and Wang, Y. (1993) Government Policy and Productivity Growth: Is East Asia an Exception? World Bank, Washington DC.
Thorbecke, E. (1991) Adjustment, growth and income distribution in Indonesia. World Development 19(11), 1595-1614.
Thorbecke, E. (1992) Adjustment and Equity in Indonesia. OECD, Paris.
Young, A. (1994) Lessons from the East Asian NICs: a contrarian view. European Economic Review 38, 964- 973.
Young, A. (1995) The tyranny of numbers: confronting the statistical realities of the East Asian growth experience. Quarterly Journal of Economics 110(3), 641-680.
UNIDO (1993) Indonesia: Industrial Development Review. United Nations Industrial Development Organization and Economist Intelligence Unit, London.
World Bank (1993) The East Asian Miracle. Oxford University Press, New York.
Appendix - overleaf
1624 WORLD DEVELOPMENT
APPE N D I X A: F E A T U R E S OF THE M O D E L (A C O M P L E T E SPECIFICATION IS A V A I L A B L E ON REQUEST)
YL • I I YCH
I HOL°S I
G[W I G ITH . / ~ ¢ FSIV--~ ITXH I GKP / C S V T I ? /
GDS ~---[ I ~ PIN/ r G F R - ~ GOVER- [--.4-TXC-~----~PRIVATE
GFY--~ NMENT ~ /" [ SECTOR I TXX--~ * ]l ~ / G I I
Explanat ion of symbols
CD Household consumption expenditures CSV Private sector savings DS Domestic sales of domestic goods FSV Foreign savings FTH Foreign transfers to households GC Government consumption GDS Government foreign debt service GIN Government investment GKP Government private investment GFR Government foreign borrowings GFY Government foreign earnings GS Subsidies to production GTH Government transfers to households GW Government wages and salaries HSV Household savings MP Payments for imports PIN Private investment TXC Corporate taxes TXE Export taxes TXH Household taxes TXI Indirect taxes TXM Import taxes XP Export earnings TXX Export taxes YCH Capital income of households YL Total labor income YCF Capital income transferred abroad YC Total capital income
Figure 2. Flow diagram for the Indonesian economy used in the model (open ended flows show transactions with rest of the world).
Table 3. Sectoral correspondence between the present model and the Thorbecke (1992) model
Symbol Present Model Thorbecke (1992) model
AG Agriculture MN Mining (oil) MF Manufacturing UC Utilities and Construction SV Services
Food crops, Other agriculture Mining (oil) Food processing, Textiles, Manufacturing Utilities, Private construction, Public agricultural works, Public works Informal trade and transport, Business services Personal services, Education and health

SOURCES OF GROWTH 1625
Table 4. Distribution of GDP for Indonesia by sector of origin at constant 1983 market prices (percentage of total)
Year Abbreviation 1980 1983 1987
Agriculture AG 24.6 22.8 23.3 Mining (oil) MN 24. I 20.7 13.8 Manufacturing MF 10.7 12.7 16.9 Utilities and Construction UC 6.3 6.3 5.5 Services SV 34.3 37.4 40.5 Total GDP 100. 100. 100. GDP value* (1980 Rp.Tr.) 48.9 54.1 63.2
Estimates taken from UNIDO (1993) and Poor et al. (1990) *This value of 1980 GDP is about 1% higher than the value implicit in the 1980 OECD SAM used as the primary data source in both the Thorbecke (1992) and IPS models.
A P P E N D I X B: S U P P L E M E N T A R Y N O T E S
The model follows the standard template for CGE models of developing countries used in Thorbecke (1991, 1992). The many household types of the Thorbecke model are replaced by a single household. This is justifiable since this study focuses on productivity rather than distributional effects. The small-country assumption is retained, so export and import prices are exogenously determined. In fact they are held constant except in the mining (oil) sector where prices declined by about 10% a year during 1983-88. A particular feature is the representation of indirect value- added taxes, import and export tariffs and subsidies and transport and trade margins. Taxes, savings, capital transfers, etc. are assumed to be linear functions of income.
Total sector-wise investment was assigned exogenously from observed average patterns over 1980-85 taken from the Keuning (1991) data. Sector-wise labor growth rates were obtained from Poor et al. (1990) and UNIDO (1993) estimates. In the capital market, private investment PIN is financed by government capital participation GKP, house- hold savings HSV and by a part of corporate savings CSV. The remainder of CSV is "saved" abroad as FSV.
In all simulations the pattern of actually observed exogenous changes, government expenditures and external closure rules were imposed mostly as in the Thorbecke (1992) model. Some of the closure conditions were varied for various experiments as described in Section 5. Existing final demand subsidies to manufacturing industry were maintained at calibrated levels.
Though government borrowing and amortization of foreign debt both rise over this period, net foreign borrowing falls by 8.3% on average in foreign exchange terms. This condition was not imposed exogenously, since net foreign borrowing is allowed to adjust to take up the shortfall in the government capital budget. Net borrowing, however, is not allowed to exceed the base-year dollar amount for any feasible solution. This criterion is used as a check on the feasibility of policy measures tested.
It is clear that fairly simple rules are assumed for the allocation of labor and capital incomes and the closure of the government's budget deficit. These assumptions clearly abstract somewhat from reality, but are unlikely to affect the productivity mechanisms being investigated.