Sources of China's Economic Growth, 1952-1999unpan1.un.org/intradoc/groups/public/documents/... ·...
25
Sources of China’s Economic Growth, 1952-99: Incorporating Human Capital Accumulation Yan Wang and Yudong Yao* The World Bank July 2001 Abstract China’s performance in economic growth and poverty reduction has been remarkable. There is an on-going debate about whether this growth is mainly driven by productivity or factor accumulation. Few studies however have incorporated annual data on China’s human capital stock, and thus contained an omission bias. In this paper, we construct a measure of China’s human capital stock from 1952-1999, and employ it in our growth accounting analysis. We found that, first, the accumulation of human capital was quite rapid and it contributes significantly to growth and welfare. Second, after incorporating human capital, the growth of total factor productivity still plays a positive and significant role during the reform period 1978-1999. In contrast, productivity growth was negative in pre-reform period. Results are robust to changes in labor shares in GDP. The recent declining rate of human capital accumulation is a matter of concern, if China is to sustain its growth and welfare improvement in the next decade. JEL Classification Code : O40, O15, O53 ____________ * Senior Economist, and consultant, The World Bank. This is a part of an effort to assess China’s recent trends in growth and poverty reduction, for the purpose of training and capacity building. We thank Vinod Thomas for encouragement, and Deepak Bhattasali, Shaohua Chen, Aart Kraay, and Martin Ravallion for advice and comments. The views expressed here are entirely the authors’ and should not be attributed to the World Bank. Comments should be sent to [email protected] and [email protected]
Transcript of Sources of China's Economic Growth, 1952-1999unpan1.un.org/intradoc/groups/public/documents/... ·...
Sources of China’s Economic Growth, 1952-99:
Incorporating Human Capital Accumulation
Yan Wang and Yudong Yao*
The World Bank
July 2001
Abstract
China’s performance in economic growth and poverty reduction has been remarkable. There is an on-going debate about whether this growth is mainly driven by productivity or factor accumulation. Few studies however have incorporated annual data on China’s human capital stock, and thus contained an omission bias. In this paper, we construct a measure of China’s human capital stock from 1952-1999, and employ it in our growth accounting analysis. We found that, first, the accumulation of human capital was quite rapid and it contributes significantly to growth and welfare. Second, after incorporating human capital, the growth of total factor productivity still plays a positive and significant role during the reform period 1978-1999. In contrast, productivity growth was negative in pre-reform period. Results are robust to changes in labor shares in GDP. The recent declining rate of human capital accumulation is a matter of concern, if China is to sustain its growth and welfare improvement in the next decade.
JEL Classification Code : O40, O15, O53 ____________ * Senior Economist, and consultant, The World Bank. This is a part of an effort to assess China’s recent trends in growth and poverty reduction, for the purpose of training and capacity building. We thank Vinod Thomas for encouragement, and Deepak Bhattasali, Shaohua Chen, Aart Kraay, and Martin Ravallion for advice and comments. The views expressed here are entirely the authors’ and should not be attributed to the World Bank. Comments should be sent to [email protected] and [email protected]
- - 1
Sources of China’s Economic Growth, 1952-99:
Incorporating human capital accumulation
Yan Wang and Yudong Yao
The World Bank
“Ask what has been the most stunning economic event of the past century, and many people might cite the case of China in the two decades since it opened up. In that time the economy has grown more than fivefold, incomes have quadrupled, and 270m Chinese have been lifted out of absolute poverty. Yet with a couple more decades’ hindsight, that achievement might be superseded by what may now be about to happen in the world’s most populous country. ……The coming two decades, on the other hand, offer the possibility of an even more extraordinary pace of economic change.”
The Economist,
March 10th, 2001. p.23
1. Introduction
Few would deny China’s extraordinary growth performance, but the sources and sustainability of this growth have been the subject of heated debate. This paper contributes to this debate by investigating the determinants of China’s growth during the period of 1952-1999 using a simple growth accounting framework which incorporates human capital stock. By constructing a measure of human capital stock and comparing the growth experiences of the pre-reform and reform period, we try to shed light on the relative importance of factor accumulation (physical capital, labor and human capital) versus the growth of total factor productivity (TFP). There is an on-going debate about whether China’s rapid and sustained growth during the reform period after 1978 is mainly driven by productivity or factor accumulation. 1 On the one side, the literature (e.g. Chow, 1993; Borensztein and Ostry, 1996; Hu and Khan,
1 Heated debate initiated by Young (1995) on the source of growth in East Asian economies has spurred a growing literature on this subject. The author contends that the so-called “East Asian Miracle” is a myth because the engine driving the spectacular growth was fueled essentially by capital accumulation instead of total factor productivity (TFP) growth.
- - 2
1997) has reached a consensus on the fundamental sources of China’s rapid growth. In particular, Chow concludes2 that capital formation played a principle role in China's economic growth while there was nearly no technological progress from 1952 to 1980. However for the reform period since 1978, two growth accounting studies (Borensztein and Ostry, 1996; Hu and Khan, 1997) show that productivity has become the primary driving force of China's rapid economic growth. For example, Borensztein and Ostry (1996) find that the growth rate of total factor productivity (TFP), which was negative before reform, rose to an average 3.8 percent per year in the post-reform period when it accounted for more than one-third of the total increase in output. One the other side, Krugman (1994) has argued that, similar to the East Asian tigers, China will soon face a limit on growth since it depends heavily on a massive increase in inputs with only small improvement in productivity. Moreover, Young (2000) concludes that the productivity performance of China’s non-agricultural economy during the reform period is respectable, but not outstanding. More specifically, he finds that systematic understatement of inflation by enterprises accounts for 2.5% growth per annum in the non-agricultural economy during the reform period (1978-1998). The usual suspects, i.e. rising participation rates, improvements in educational attainment, and the transfer of labor out of agriculture, account for most of the remainder. As such, it is possible to transform the recent growth experience of China from the “extraordinary” into the “mundane”. This study takes a small step forward by (i) measuring the human capital more accurately, and (ii) taking advantage of improved China data in the recent years and estimate the sources of growth with less errors. First, we construct an annual variable of human capital stock for 1952-1999. The variable, educational attainment for population age 15-64, provides an annual measure of the human capital stock for the labor force during the pre-reform and the reform period. We build our human capital stock based on number of graduates at different schooling levels, rather than quinquenial data based on enrollment rates in Barro and Lee (2000) or Nehru, Swanson and Dubey (1995).3 By contrast, the studies of Chow (1993), Borensztein and Ostry (1996) and Hu and Khan (1997) do not incorporate human capital as an input in their aggregate production functions for the Chinese economy. Due to this reason, their measurements of productivity suffer from an omission bias and the estimated productivity as residual is exaggerated by the absence of human capital from the growth-accounting calculations. Moreover, Young’s (2000) estimation of human capital growth has several notable shortcomings. In particular, he disaggregates the labor force into various categories based on infrequent census data of population. In addition, each type of worker is weighted by the wage of that type based on the Household Survey files over a sub-sample period 1986-1992. Therefore, the obtained human capital growth is not an annual growth rate 2 Chow (1993) estimates production functions for China's aggregate economy and for five sectors: agriculture, industry, construction, transportation, and commerce--using annual data (some constructed by the author) from 1952 to 1980. 3 Our method avoids the problems of over-estimation due to high dropout and repeat rates which are often unreliable or under-reported. Independently, Wang 2000 developed a human capital stock using a different method than ours.
- - 3
and also cannot cover his whole sample period 1978-1998. This runs the risk of out-of-sample bias in the aggregated human capital series. Second, the data used in this study is updated based on Hsueh and Li (1999) which is more reliable. A major issue of the previous studies relates to possible measurement error, including problems with the deflators used to measure real output and real investment. The main problem has to do with the possible underdeflation of industrial output in the collective sector and the lack of an investment price index. Fortunately, Hsueh and Li (1999) provide a modified national income account based on their comprehensive review of Chinese national income accounting methodology and price indexes. In particular, Hsueh and Li (1999) make a great effort to improve the GDP deflator and investment deflator. In addition, previous studies rely on the self-estimated labor share by combining wage and employment data. Hsueh and Li (1999) provide data on provincial level compensation of labor as a percentage of provincial GDP for the reform period 1978-1995. To derive the aggregate share of labor, we simply need to take the average of provincial labor shares. We find that first, the accumulation of human capital was quite rapid and it contributes significantly to growth and welfare. Second, after incorporating human capital, the growth of total factor productivity still plays a positive and significant role during the reform period 1978-1999, in contrast to the negative productivity growth during the pre-reform period 1952-1977. Regarding the on-going debate, this paper proposes a middle-road answer to the sources of growth, and that is, both productivity growth and factor accumulation are very significant in accounting for China’s growth performance during the reform period. This paper will proceed as follows. Section 2 briefly introduces the growth accounting method. Section 3 is devoted to the data and measurement issues with a focus on how to construct the human capital stock. Section 4 details how we construct the human capital series. Section 5 discusses the results of growth accounting and also provides some sensitivity analysis on the results. Section 6 summarizes our findings and implications. 2. Methodology of Growth Accounting
Growth accounting essentially divides output growth into a component that can be explained by input growth, and a ‘residual’ which captures changes in productivity. Consider the following aggregate production function for the Chinese economy:
a)tHt(LatKtAtY −= 1
(1)
where Yt is real GDP, At is total factor productivity, Kt is the real capital stock, Lt is total employment, Ht is average schooling years of population age 14-65 and represents human
- - 4
capital stock. Hence LtHt is a skill-adjusted measure of labor input. Taking logs and differentiating totally both sides of equation (1) yields
)()1( ttttt hlkga∧∧∧
+−−−= αα (2)
where at is growth in Total Factor Productivity (TFP), gt is the growth rate of real GDP, the lowercase variables with a “hat” correspond to the growth rates of the uppercase variables described in equation (1). Equation (2) decomposes the growth rate of output into growth of TFP, and a weighted average of the growth rates of physical capital stock and skill-augmented labor. Under the assumption of constant returns to scale, these weights are given by the shares of these two inputs in aggregate output. TFP was called “measure of our ignorance” by Abramovitz (1956). It covers many components: innovation-based technology progress, imitation- led technology progress, institut ional change, efficiency change, omitted variables and measurement errors. TFP should not be equated with innovation-based technology change, although it often is. It is important to note that the decomposition of equation (2) remains valid under more general functional forms of the production function such as the translog production function used by Hu and Khan (1997) and Young (2000)4. The interpretation of the weights assigned to physical capital and skill-augmented labor as their share in aggregate output requires only the assumption of constant returns to scale. The Cobb-Douglas production function is chosen for simplicity.
According to equation (2), therefore, any errors in measuring the variables, errors due to omission of relevant inputs, will directly spill over into the measure of TFP. In addition, the production function parameters are central to the decomposition of output growth into contributions from physical capital, labor and productivity. If these sources of bias are successfully removed, the remaining portion of output growth unexplained by the combined rate of growth of all the inputs of production is the measure of "true" TFP. Despite all these possible flaws, this residual still is the work horse of empirical growth analysis. For example, the TFP residual is central to the recent debate on the “New Economy”. A significant proportion of this paper, as we shall see in the following sections, is devoted to reducing these biases. The next section describes the series Yt, Kt, Lt and Ht. 3. Data and Measurement Issues During the pre-reform period of 1952-77, the Chinese statistical system adopted the system of material product balances (MPS). The making of MPS was tailored to meet the needs of the central planning economy. The main aggregate indicators were total output value of society5 and national income. National income is value-added and comparable with GDP in the system of national accounts (SNA) adopted by the market-economy
4 It should also be clear that conventional growth accounting, imputing output elasticities based on market rewards, will not shed any light on the possible extent of externalities. 5 This is obtained by summing up gross output values and suffers from the double-accounting problem.
- - 5
countries. But national income does not account for the value-added of the service sector. Since the adoption of the comprehensive reform policy in 1978, China's statistical system has had to follow the international norm. Starting in 1985, SSB has received financial aid from the World Bank and the Asian Development Bank for further developing the national income accounts system, particularly for the estimation of GDP and its components in SNA and to make up the deficiency of MPS. SNA was completely implemented in the whole nation in 1992. Previously, data on China’s growth were usually compiled from three kinds of Chinese official statistics publications, (A) China Statistics Yearbook from 1981 to 1997 (issue 1982 is absent); (B) China Historical Statistics 1949-1989; and (C) Comprehensive Statistical Data and Materials on 50 Years of New China 1949-1998. However, three shortcomings of the above data have plagued the empirical work. First, there was no national GDP during the pre-reform period. As a result, the previous studies on China's national economy have used NI for the pre-reform period. Second, there was no national NI deflator to deflate NI for the pre-reform period 1952-77. Finally, there was no national investment deflator for the period 1952-1990. The SSB began to construct the fixed asset investment price index in 1991. With the support and cooperation of the SSB, Hsueh and Li (1999) have made significant progresses and published the most complete set of Chinese national income from 1952 to 1995 based on SNA in 1999 both at the national and provincial level. Their main contributions include the following. (1) Based on historical statistical data stored in SSB and existing NI data, they fill up the service sector omitted in MPS of China and construct GDP data for the pre-reform period 1952-77, which are directly comparable with those of the reform period 1978-95; (2) They provide real GDP, the investment growth rate and the corresponding deflators for the period 1952-95. Output Our data set covers a 48-year period (1952-1999). National GDP data and implicit GDP deflator come from the Hsuech-Li (1999) data set, covering the period 1952-95. GDP data and implicit GDP deflator from 1996 to 1999 are drawn from China Statistics Yearbook 1997, 1998, 1999 and 2000. We take 1995 as the base year to generate real GDP. Capital Stock To estimate the real capital stock for the aggregate economy each year, the standard perpetual inventory approach is used. Hsuech-Li data set provides national investment from 1952 to 1995. Investment is referred to gross fixed capital formation at the current price. The calculation of gross fixed capital formation is based on the total social fixed asset investment 6. Investment data from 1996 to 1999 is drawn from China Statistics Yearbook 1997, 1998, 1999 and 2000.
6 The ownership structure of investment is dramatically different between the pre-reform period and the reform period. For the pre-reform period, the investment is dominated by state-owned investment. During
- - 6
The lack of physical capital deflator is a major issue of Chinese statistics because the standard Chinese statistical sources do not report the price index of the fixed asset investment until 1991. The investment deflator used by Hu and Khan (1997) is drawn from three sources: For the pre-reform period 1952-1977, they use the implicit deflator for capital accumulation estimated by Chow (1993); for the period 1978-1990, they adopt the price series of building materials as a proxy; For the period 1991-1994, they use the official fixed asset investment index. A major shortcoming of Hu and Khan’s investment deflator is that the building materials price is unlikely to be a good proxy for the fixed asset investment. Alternatively, Young (2000) construct an implicit fixed asset formation deflator as a residual between GDP deflator and the deflators of other components of GDP including private consumption, government consumption, inventories and import and export. However, the inherent risk of Young’s complex method is that any measurement errors of the deflators of GDP, consumption, government consumption, inventories and import and export can pass on to Young’s “residual” investment deflator. Fortunately, Hsueh and Li provide an implicit investment deflator for the period 1952-1995. Hsueh and Li (1999) take the data from the Annual Report of Statistics on Investment in Fixed Assets. Prices of investment are determined by taking the weighted average of prices of machinery and equipment, and prices of construction and installation. The prices of investment have faced significant changes only after 1978. Within the pre-reform period 1952-1977, the prices of investment including construction materials for building houses and other buildings, and machinery and equipment, are basically controlled by the state, and there was no significant change. After 1978, as the pricing of production means was becoming decentralized, the prices of construction materials and machinery equipment increased significantly. SSB formally started compiling a price index for fixed asset investment in 1991. This price index has existed since 1991. Combining Hsueh and Li’s index from 1952-1995 and SSB’s index from 1996 to 1999, we can get real investment for the period 1952 to 1999. The investment deflator takes the prices of 1995 as 100%. To construct a time series of capital stock from 1952-1999, we need to know the average depreciation rate of capital and its initial level. According to the Perkins' (1988) method, the overall depreciation rate is 5%. An initial value of 175 billion Yuan is set for the aggregate capital stock in 1952 (at 1952 prices), the estimate used by Chow (1993) and Hu and Khan (1997)7. Quantity and Quality of Labor The sources of the Chinese labor statistics are annual administrative and survey-based estimates and the infrequently conducted population censuses8,which are reported in the
the reform period, however, investment includes investment of state-owned enterprises, investment of private firms and joint-ventures and Foreign Direct Investment. 7 An alternative way to calculate the initial capital stock in is set to 3 times National Income in 1951, which can be drawn from Hsuech-Li-Liu (1993) data set. 8 China conducted its first population census in 1954, subsequently, censuses were conducted in 1964, 1982 and 1990.
- - 7
China Statistical Yearbook. The SSB, using departmental reports and surveys, collected data on the “Total Labor Force of Society”. Referring to the working population, this series has a fairly stringent definition of employment requiring, for example, that young people in cities and towns with temporary employment earn, as a minimum, the wage level of local grade-one workers in order to be included in the series. In this paper, we use the data series on the Total Labor Force of Society to measure the labor input. Young (2000) shows that the overall growth of the working population is perfectly consistent with reasonable demographic and participation data. The Labor Force of Society data indicate a substantial movement of labor out of agriculture into the industrial and service sectors of the economy. 9 For example, labor force growth substantially exceeds the growth of the population. While the Labor Force of Society data series provides a reasonable measure of the overall growth of the labor force, it does not contain any information on the quality of workers, that is, changes in human capital stock over time. In analyzing the contribution of changes in educational attainment to the quality of labor, there are two approaches to measure the quality of labor force. One approach is to disaggregate the labor force by level of schooling, and often by other available characteristics such as age and gender. Changes in the number of employees at each level of schooling are then weighted by their marginal products, proxied by the mean income associated with each schooling level, to give the overall change in an index of ‘effective’ or qualityadjusted labor. This ultimately allows the researcher to quantify the proportion of output growth that can be directly attributed to increases in educational attainment.10 The calculation of the labor quality index assumes that differences in market rewards are interpreted as reflecting genuine differences in marginal products. The second approach is to use educational attainment as a proxy for the component of the human capital stock obtained at schools (Barro and Lee, 2000). A higher educational attainment indicates higher quality of workers. So far there have been a number of attempts to measure educational attainment across countries. Earlier empirical studies used school enrollment ratios or literacy rates. Mankiw, Romer, and Weil (1992) used the proportion of the adult population enrolled in secondary school as a proxy for human capital investment. Romer (1990) considers literacy a proxy for human capital stock and uses the change in the literacy rate. However, there are some conceptual difficulties with the use of school enrollment data for two reasons. First, these measures do not adequately measure the aggregate stock of human capital available contemporaneously as an input to production process11. In addition, in many empirical growth papers, it is not clear whether
9 The migration of labor out of agriculture is an essential feature of economic development and modernization, both historically in developed countries and currently in developing ones. 10 A prominent example is Jorgenson, Gollop and Fraumeni’s (1987) aggregate index of labor quality based on changes in the composition of total hours worked by age, sex, education, employment class and occupation. Due to the data availability limit, however, nearly all the studies which carry out a detailed disaggregation by level of schooling are restricted to the United States. 11 Temple (2000) emphasizes on the vocational training as another important aspect of human capital.
- - 8
school enrollment rates are intended to represent a flow of investment in human capital, or its stock. It is incorrect to use enrollment as a stock variable. As far as the first approach is concerned, it is difficult to apply it in the Chinese economy to obtain an annual quality index of labor during the pre-reform period and reform period. One main reason is that the published data on the relative labor incomes of Chinese workers by worker characteristic are basically non-existent. However, some survey data of the SSB’s Urban Household Survey and the Household Survey by the Chinese Academy of Social Sciences contains information on the characteristics and individual labor income of the members of the survey households for certain periods (see for example, Wang 1996). Young (2000) utilizes several household survey data of the SSB for the incomplete reform period 1986-1992 to arrive at a rough estimation of human capital growth during the whole reform period 1978-98 by using the relative wage estimates to weight the changing composition of the labor. He finds that the Chinese workers’ wages rise with educational attainment at a slower rate than in the other economies. Nonetheless, the survey files of the SSB for the years 1986-1992 and the Household Survey conducted by the Chinese Academy of Social Science are by no means a balanced sample (e.g. some provinces are not represented, while the samples are heavily biased towards better educated households). As a result, we adopt the second approach in the present study and use average schooling years of population aged between 15-65 as an approximation of the quality change of labor force for the entire period 1952-1999. The next section summarizes the main procedures for constructing the human capital stock series. 4. Human Capital Stock of China Development of China’s Education Education begins with kindergarten (ages 3-6) and continues with primary (ages 6-12) and secondary education (ages 12-18), which includes junior and senior secondary schools, specialized secondary schools, vocational schools, and technical training schools. Higher education, which includes universities and colleges as well as postgraduate programs, requires 4-5 years for a B.A. degree, 7-8 years for a Masters degree, and 10-11 years for a Ph.D. Around 70% of China’s population were without formal schooling after World War II (1937-1945) and the civil war (1945-1949). In the 1950s, there was a widespread movement to eradicate illiteracy. In the 1960s, the implementation of an obligatory/mandatory nine-year education policy began. This policy called for six years in primary school and three years in junior secondary school. While the implementation of this policy has been consistent in urban areas, it did not materialize in rural regions in terms of financial assistance. The enrollment growth at the primary level is slow compared to other levels because the coverage at this level was already extensive for a long time. Slower growth in enrollment in primary education also stems from declines in birth rates since 1970s and a reduction in dropout and repetition rates that reduced the
- - 9
proportion of students in the primary school-age range. By the mid-1990s, China had achieved virtually universal enrollment in primary education, but the quality vary a great deal. Only two-thirds of primary school students currently complete their entire primary cycle. In some remote and poor regions, completion rates were as low as 30 percent. Nonetheless, the percentage of no schooling has declined from 51.8% in 1964 to 16% in 1995. At secondary level, gross enrollment rates rose progressively but both enrollment rates and growth at this and the tertiary level remained low, relative to those of other Asian countries. Although government policies during the Great Leap Forward period created better educational opportunities for working class and peasants, famine and social conflict in the early 1960s thwarted that momentum. During the Cultural Revolution, all universities were closed between 1966 and the early 1970s in favor of several short-term training courses. Regular enrollment was restored in 1976, but China had already lagged behind Korea, Malaysia, Thailand and other Asian countries in terms of age cohort participation rates in higher education. In addition, completion rates are particularly low among poor regions and female students at the secondary level, many families lack the incentive to send their children in school, due largely to both economic and cultural factors. At the tertiary level, however, coverage is extremely low. China does lag behind other countries regarding some dimensions of educational progress. For instance, its rate of enrollment particularly in higher education is below both the average among all Asian countries and the rates found in some low-income countries. Methodology Using a perpetual inventory method, Barro and Lee (2000) construct a measure of human capital stock. Their data set comprises at least one observation for 142 economies, of which 107 have complete information at five-year intervals from 1960 to 2000. The percentage of the population who have successfully completed a given level of schooling—say secondary, tertiary, or post-primary schooling—is a straightforward way to show the population's attainment of skills and knowledge associated with a particular level of education. 12 With these data they can construct measures of average years of schooling at all levels for each country, which is taken as the human capital stock series. Following Barro and Lee (2000), the perpetual inventory method is adopted in this paper. The subsequent question is how to choose flow variables to the human capital stock. The distribution data of educational attainment by age cohort in the aggregate Chinese population are only infrequently recorded in the 1990 censuses, the 1987, 1995 and 1999 1% Sample Population Surveys, and the 1997 Survey on Population Change. Thus, we use new school graduates as flows that are added to the human capital stocks annually.
12 In practice, however, each cycle of education has significant variation in duration across countries. They also take account of this variation by using information on the typical duration of each level of schooling within countries.
- - 10
The number of graduates reflects the inflows of new school graduates to existing educational stock more accurately than the enrollment ratios used by Barro and Lee (2000). In the construction of average years of schooling, we take account of changes of national school duration over time. The initial figure of human capital stock in 1951 is 0.84 years of schooling per person, which is estimated based on the following schooling distribution assumptions: in 1951, 72% of the population were illiterate, 16% had incomplete primary, 8.4% completed primary, 2.7% had incomplete secondary, 0.1% completed high school, the rest were for higher education, about 0.6%. These assumptions are based on India’s education attainment distribution in 1960 from Barro and Lee data (1997, 2000). Given the population aged over 15-65 in 1951, we obtain the estimate of average schooling years in 1951. The data report educational attainments in the population in five categories: primary, junior secondary school, senior secondary school (high school), specialized secondary school (vocational school) and tertiary education. For these five categories, number of schooling years are 5, 8, 11, 12, 14.5, respectively. 13 Based on the perpetual inventory method, we construct current flows of adult population that are added to the stocks of the previous year. The data of annual graduates form the six schooling levels comes from “Comprehensive Statistical Data and Materials on 50 Years of New China 1949-1998”. The formulas for the various levels of schooling for the total population are as follows.
)()1( 31,1,1 +− −+−= ttttt JUNIORPRIHH δ ……………………………………..…..……..(3)
where Hjt is the number of graduates for whom j is the highest level of schooling attained; j=1 for primary, 2 for junior secondary school, 3 for senior secondary school, 4 for specialized secondary school and 5 for tertiary. If a person cannot complete the enrolled duration level and thus drops out from it, we take him as a graduate of the schooling level he had before. For example, a drop-out of the senior secondary school is
13 Tertiary education includes university and junior college education. Depending on different time periods, it usually takes a total of 15-16 years to complete a four-year university and takes 14-15 years to complete a three-year junior college. We take 14.5 as the number of schooling years for people who were reported as having completed tertiary education in China.
)4...(..........).........()1( 231,2,2 ++− −−+−= tttttt SPECIALSENIORJUNIORHH δ
)5(..............................).........()1( 5.31,3,3 +− −+−= ttttt HIGHSENIORHH δ
)6.(............................................................)1( 1,4,4 tttt SPECIALHH +−= −δ
)7......(............................................................)1( 1,5,5 tttt HIGHHH +−= −δ
- - 11
taken as a graduate of the junior secondary school. Since the national duration of different schooling levels are known, we can obtain the net number of graduates at each schooling level. The variable δ t is the annual mortality rate of the population and is drawn from “Comprehensive Statistical Data and Materials on 50 Years of New China 1949-1998” and China Statistical Yearbook 2000. The application of equations (3)-(7) generates our panel data set on educational attainment for the population from 1952 to 1999 at the five broad levels of schooling: primary, junior secondary, senior secondary, specialized secondary and tertiary.
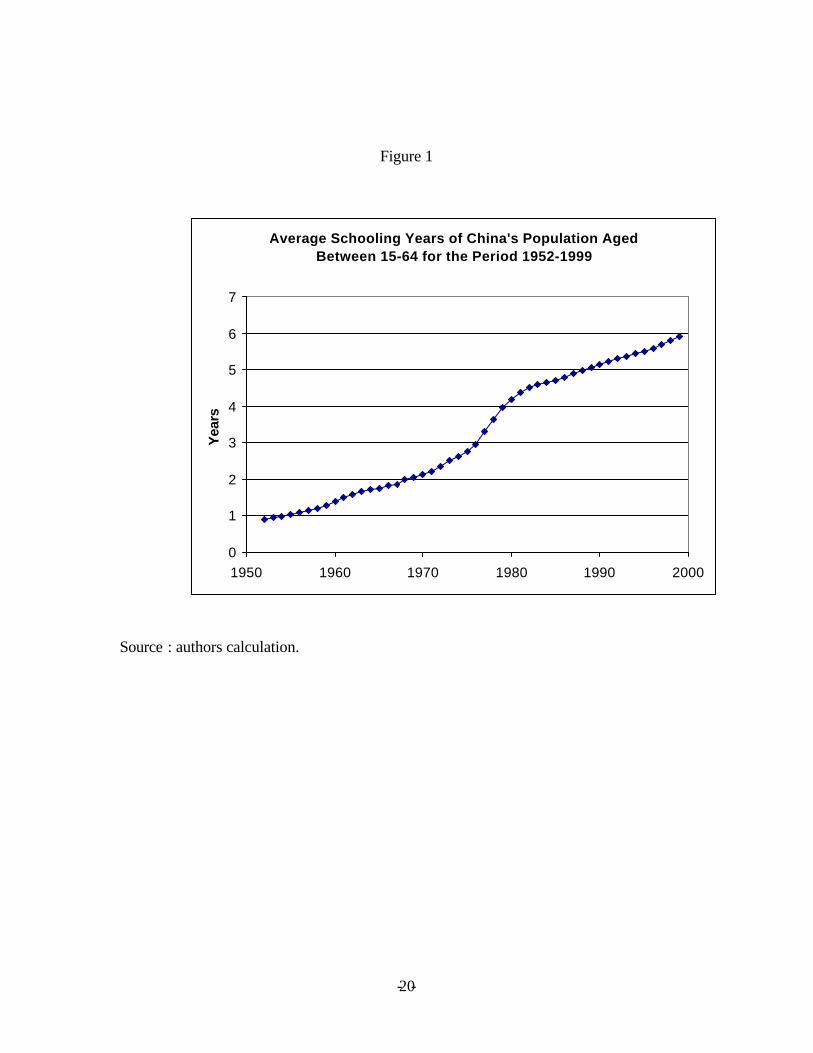
PopHHHHHht /)*5.14*10*11*8*5( 54321 ++++= (8) where ht is the human capital stock and represents the quality of employment at year t. Pop is the population aged between 15-64 taken from the World Bank data base.14 These data on the distribution of educational attainment at different levels among the population, combined with the information on the national duration of school at each level, generate the number of years of schooling achieved by the average person. Figure 1 shows the obtained human capital stock series over the period 1952-1999. One can see that on average the accumulation of human capital has been quite rapid over the years. There was a slow down in the 1960s and a sharp increase of the human capital stock for the period 1976-1980, reflecting the recovery from the total breakdown of the education system caused by the “Culture Revolution” 1966-1976, to a normal education system. [See Figure 1 ] However, these data have a number of shortcomings. First, the data may underestimate the “true” human capital stock because we only take the graduates as the flow to the corresponding schooling stock. The additional schooling years of those who dropped out do not count. Second, the measure of educational attainment does not take account of the skills and experiences gained by individuals after their formal education. Third, the measure does not take account of differences in the quality of schooling cross regions and over time. In particular, the quality of education during the Culture Revolution period was rather poor but education completed in those years was treated the same as in other years. Nonetheless, our estimates of educational attainment provide a reasonable proxy for the stock of human capital for the pre-reform period 1952-77 and the reform period 1978-99. Labor Share The last problem comes from trying to estimate the share of national income attributable to capital and the share attributable to labor. Chow (1993) used a value of 0.40 for the
14 The World Bank data on population aged between 15-64 starts from 1960. We use the same proportion of this cohort in the whole population to project the data from 1952-1959.
- - 12
period 1952-1980. The labor shares estimated by Hu and Khan (1997) is 0.386 and 0.453 for the pre-reform period 1952-1978 and the reform period 1979-1994, respectively. The study by Li and others (1993) produced somewhat higher estimates for the labor income share in China, with an average value of 0.462 for the pre-reform period 1952-1978 and an average value of 0.536 for the reform period 1979-1994. The reason for Li and others’ (1993) higher share is that implicit housing subsidies (state-controlled rent) are included in labor compensation. Such implicit housing subsidies are not included here for labor compensation on the grounds that the imputed value of housing services is not counted symmetrically as part of the aggregate value added in Chinese official statistics. Young (2000) estimates the share attributable to labor using data and obtains a value of 0.60. In this study, labor income is taken from the average labor remuneration across China’s 28 provinces15 in the GDP data in Hsueh and Li’s National Account (1999). The latter is based on the primary distribution of the value-added created by the grassroots statistical units, which contain (1) industries at town level and above, (2) industries at the village level and below, and (3) urban or rural partnership and household industries. (1) For state-owned and collective-owned industries at town level and above, labor remuneration includes payable wages of the current year, payable welfare funds of the current year, and labor and unemployment insurance expenses and the labor union fees. (2) For industrial enterprise at village level and below, actual wages and welfare funds are obtainable from various surveys of the SSB. (3) For urban and rural partnership and household industrial enterprise, labor remuneration is in two parts: owner’s income and employees’ wages. The latter can be derived or estimated by referring to the number of employees and their wages provided under “Major Indicators of Urban and Rural Household Industry” in Annual Report of Industrial Statistics. By contrast, the official national accounts impute labor income to the self-employed, assuming that where self-employment is found (e.g. industry and construction), all income is labor income, and going so far as to conclude that the entire output of some sectors, e.g. personal and social services, contains no capital income component whatsoever, allocating all of the output of the sector between compensation of employees and depreciation. The overall economy-wide share of labor appears to remain about 0.5 over the entire reform period 1978-99, and thus used in this study. For the pre-reform period we adopt the figure used by Chow (1993) and Hu and Khan (1997), which is 0.4. The increase of labor share during the reform period relative to the pre-reform period is understandable because there was a bias towards capital accumulation under the central-planning regime before 1978. 5. Sources of Economic Growth
Table 1 summarizes the growth accounting results of the Chinese economy during the pre-reform period 1952-1977 and the reform period 1978-1999. According to this table,
15 Hainan and Tibet are not included.
- - 13
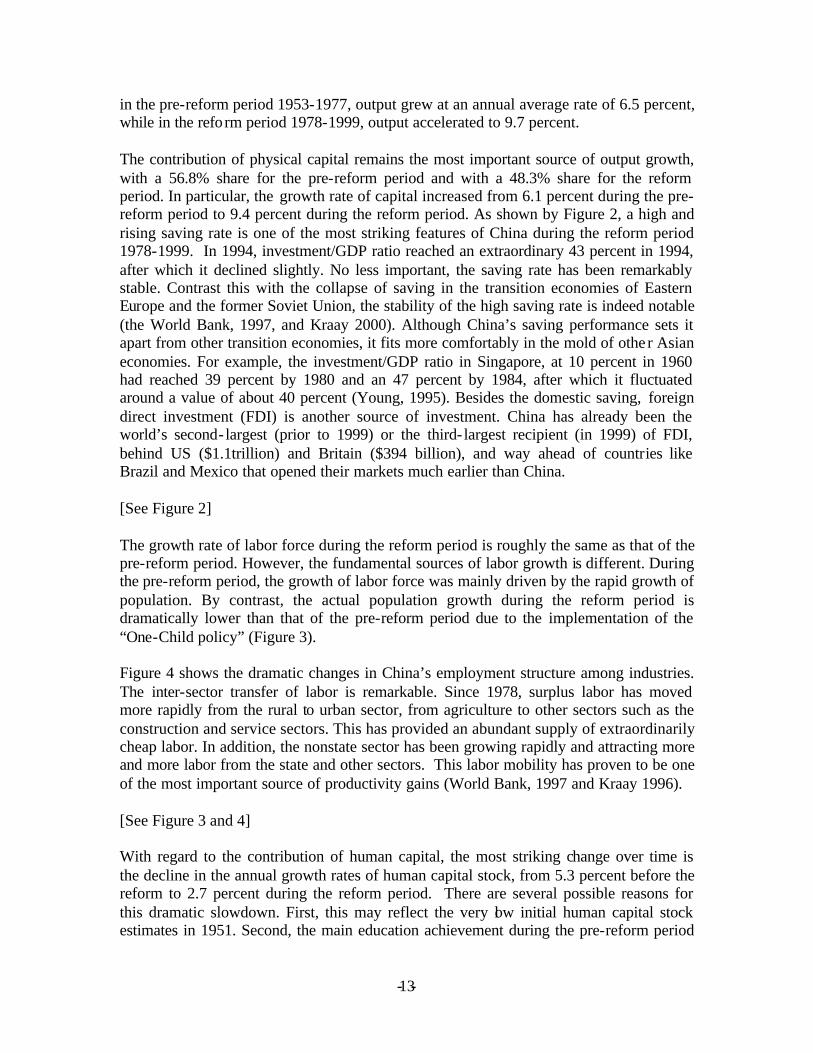
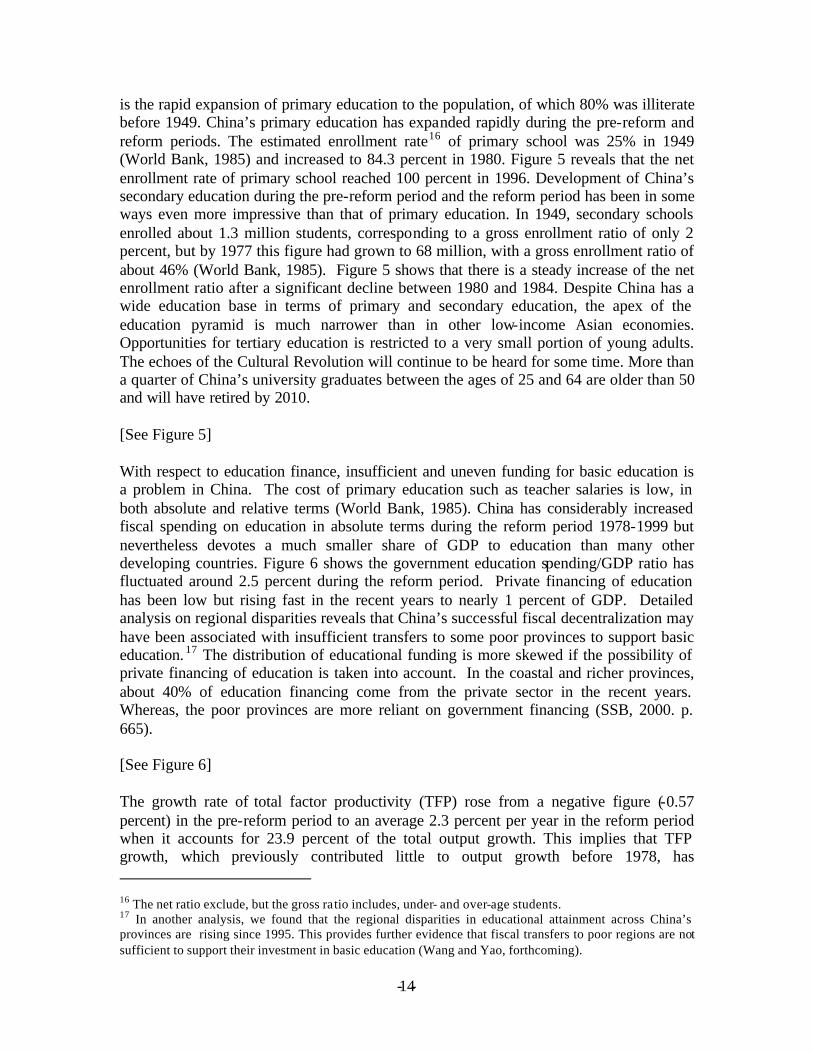
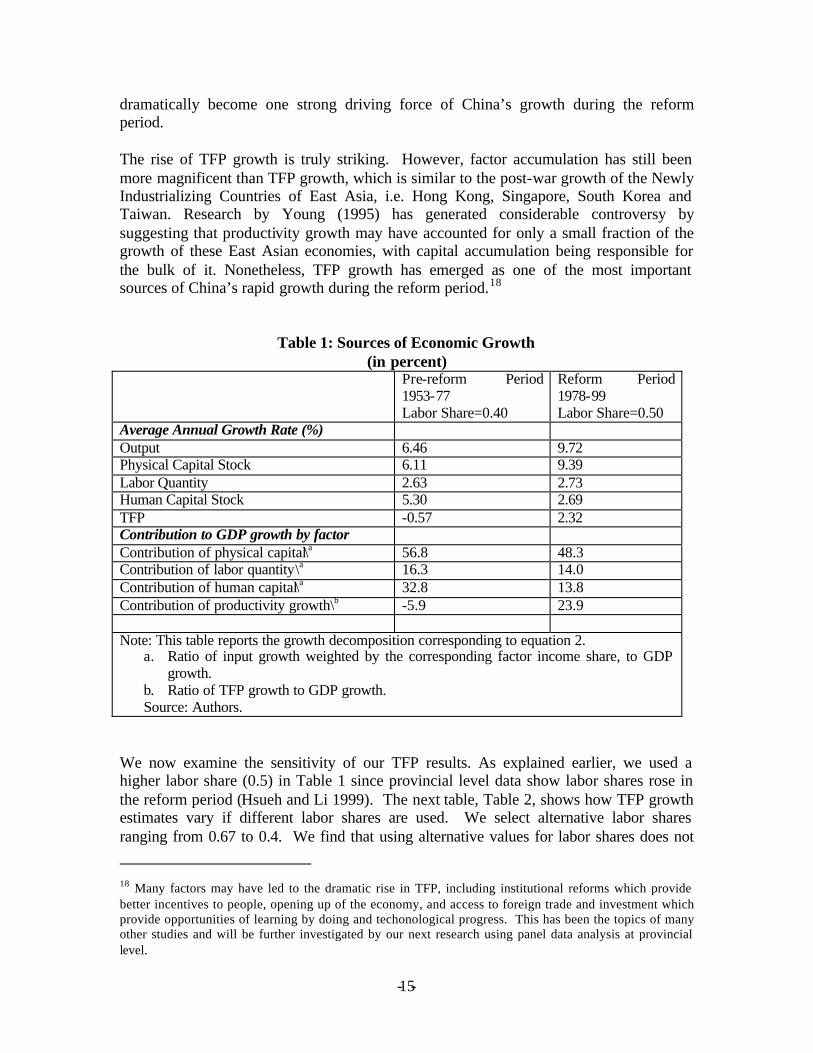
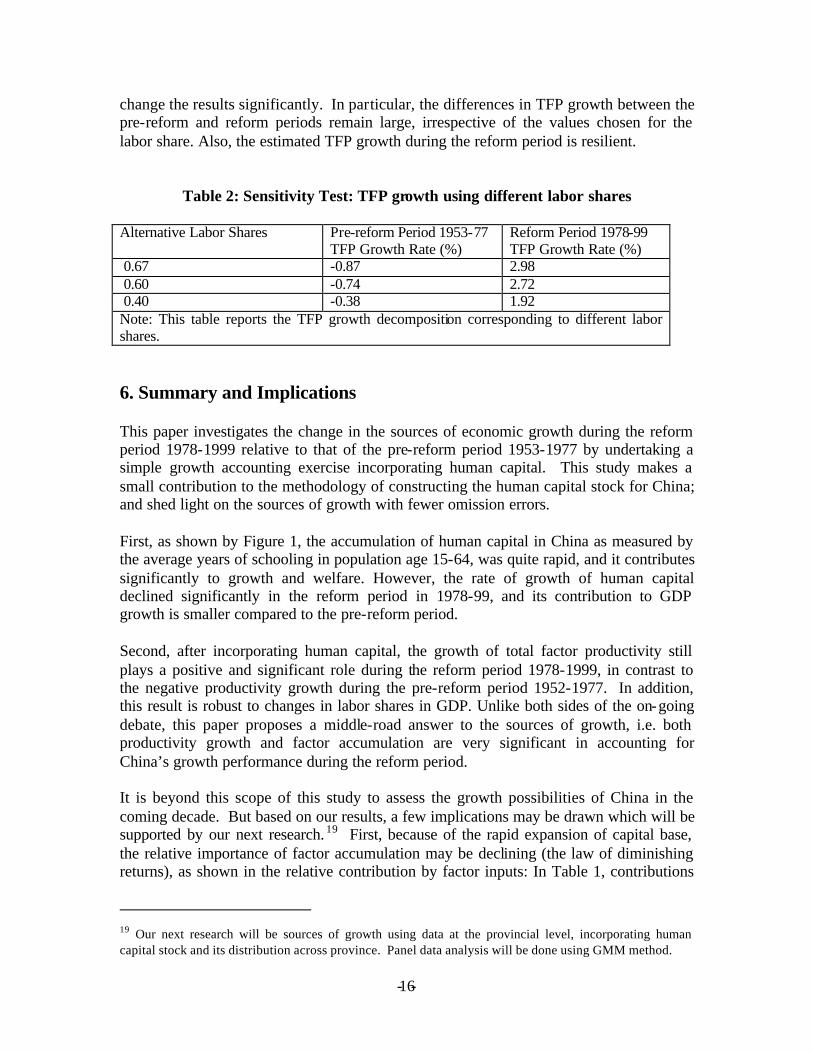
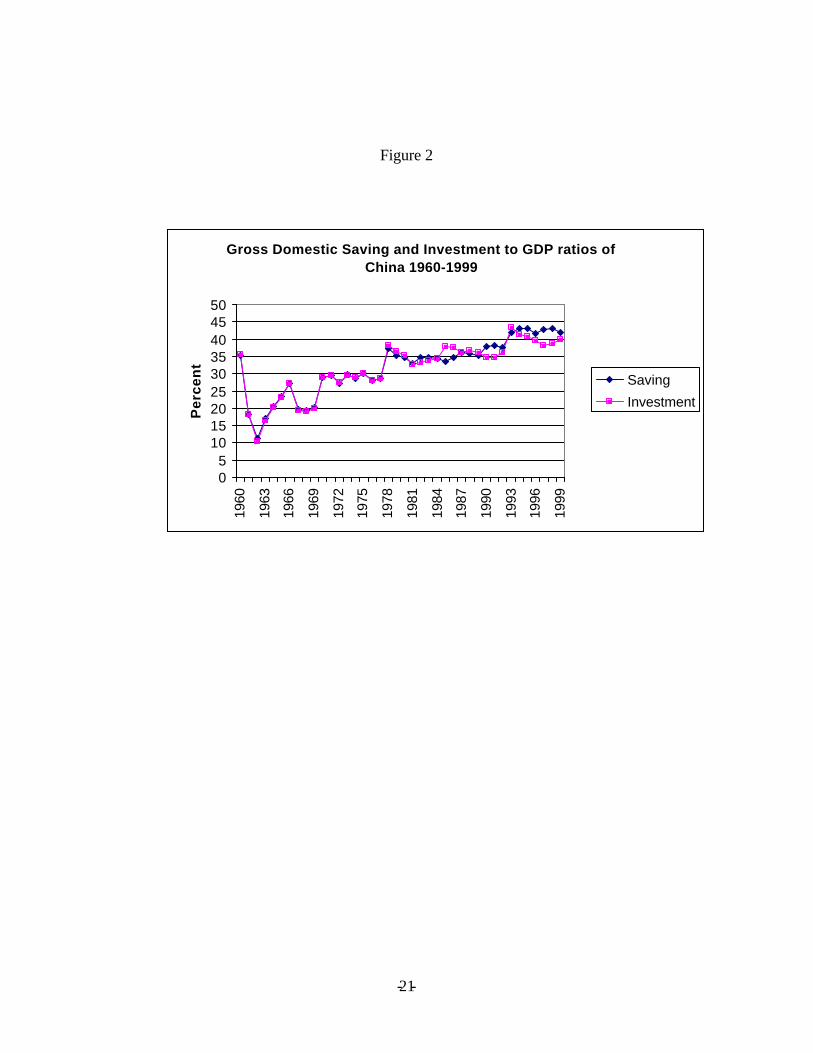
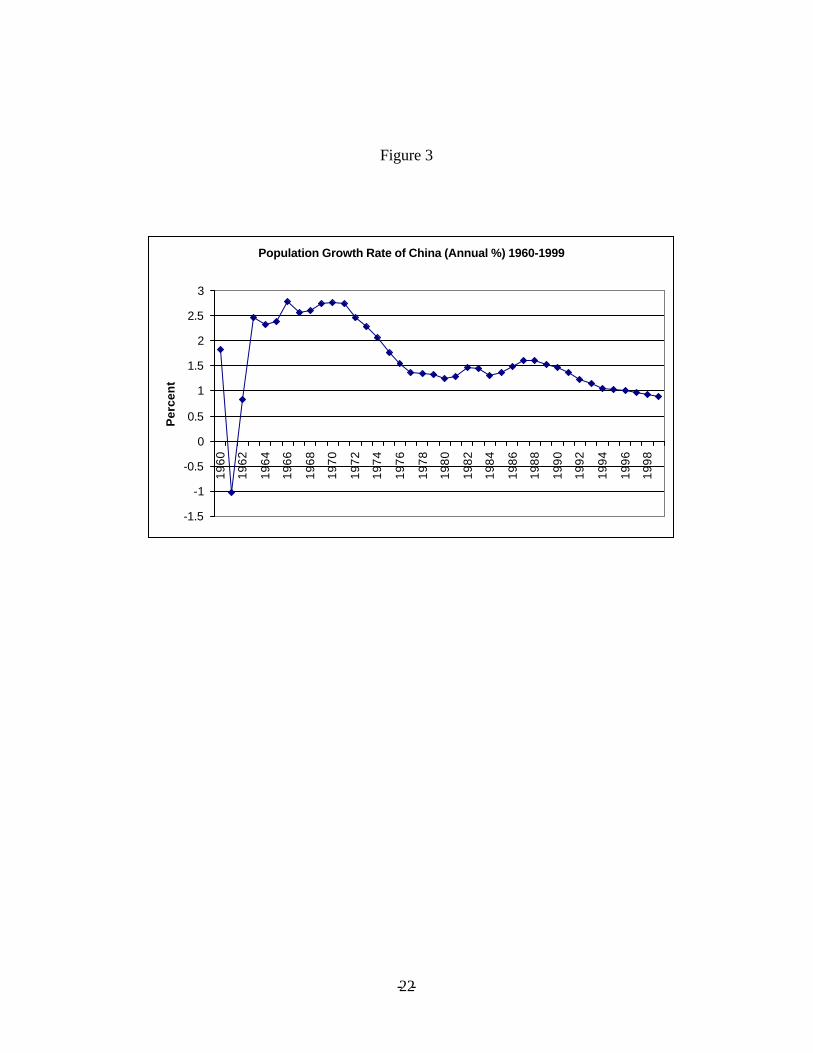
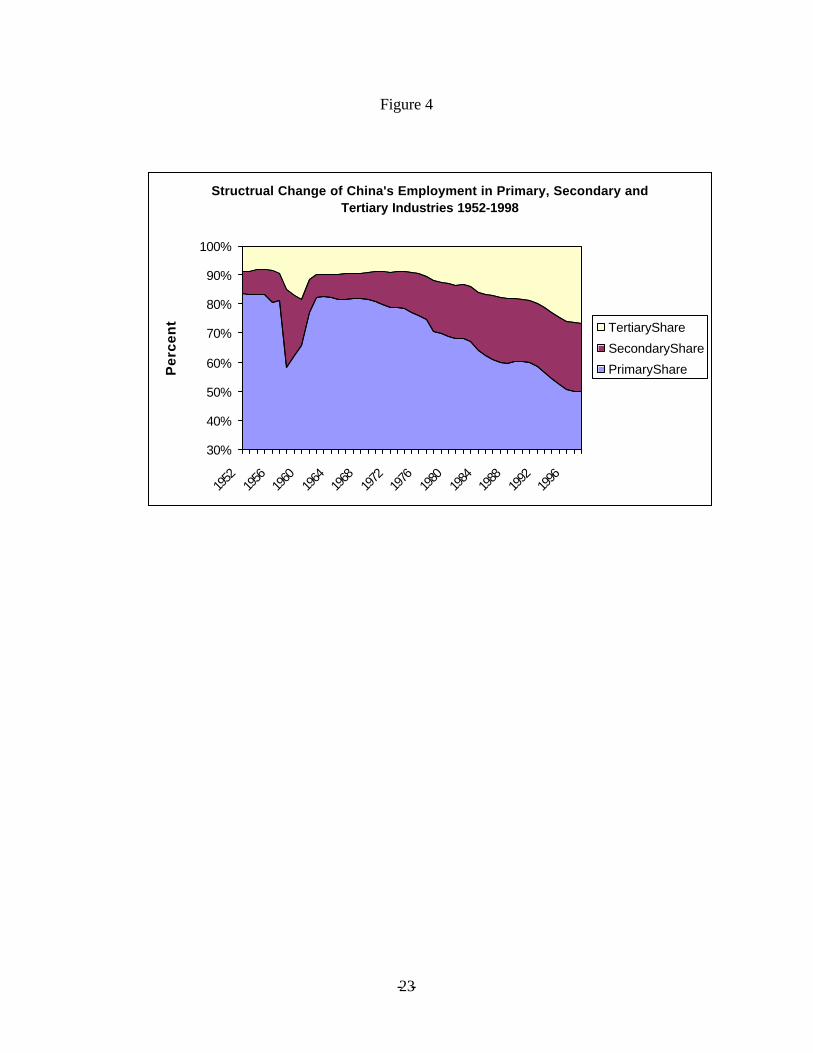
in the pre-reform period 1953-1977, output grew at an annual average rate of 6.5 percent, while in the reform period 1978-1999, output accelerated to 9.7 percent. The contribution of physical capital remains the most important source of output growth, with a 56.8% share for the pre-reform period and with a 48.3% share for the reform period. In particular, the growth rate of capital increased from 6.1 percent during the pre-reform period to 9.4 percent during the reform period. As shown by Figure 2, a high and rising saving rate is one of the most striking features of China during the reform period 1978-1999. In 1994, investment/GDP ratio reached an extraordinary 43 percent in 1994, after which it declined slightly. No less important, the saving rate has been remarkably stable. Contrast this with the collapse of saving in the transition economies of Eastern Europe and the former Soviet Union, the stability of the high saving rate is indeed notable (the World Bank, 1997, and Kraay 2000). Although China’s saving performance sets it apart from other transition economies, it fits more comfortably in the mold of othe r Asian economies. For example, the investment/GDP ratio in Singapore, at 10 percent in 1960 had reached 39 percent by 1980 and an 47 percent by 1984, after which it fluctuated around a value of about 40 percent (Young, 1995). Besides the domestic saving, foreign direct investment (FDI) is another source of investment. China has already been the world’s second- largest (prior to 1999) or the third- largest recipient (in 1999) of FDI, behind US ($1.1trillion) and Britain ($394 billion), and way ahead of countries like Brazil and Mexico that opened their markets much earlier than China. [See Figure 2] The growth rate of labor force during the reform period is roughly the same as that of the pre-reform period. However, the fundamental sources of labor growth is different. During the pre-reform period, the growth of labor force was mainly driven by the rapid growth of population. By contrast, the actual population growth during the reform period is dramatically lower than that of the pre-reform period due to the implementation of the “One-Child policy” (Figure 3). Figure 4 shows the dramatic changes in China’s employment structure among industries. The inter-sector transfer of labor is remarkable. Since 1978, surplus labor has moved more rapidly from the rural to urban sector, from agriculture to other sectors such as the construction and service sectors. This has provided an abundant supply of extraordinarily cheap labor. In addition, the nonstate sector has been growing rapidly and attracting more and more labor from the state and other sectors. This labor mobility has proven to be one of the most important source of productivity gains (World Bank, 1997 and Kraay 1996). [See Figure 3 and 4] With regard to the contribution of human capital, the most striking change over time is the decline in the annual growth rates of human capital stock, from 5.3 percent before the reform to 2.7 percent during the reform period. There are several possible reasons for this dramatic slowdown. First, this may reflect the very low initial human capital stock estimates in 1951. Second, the main education achievement during the pre-reform period
- - 14
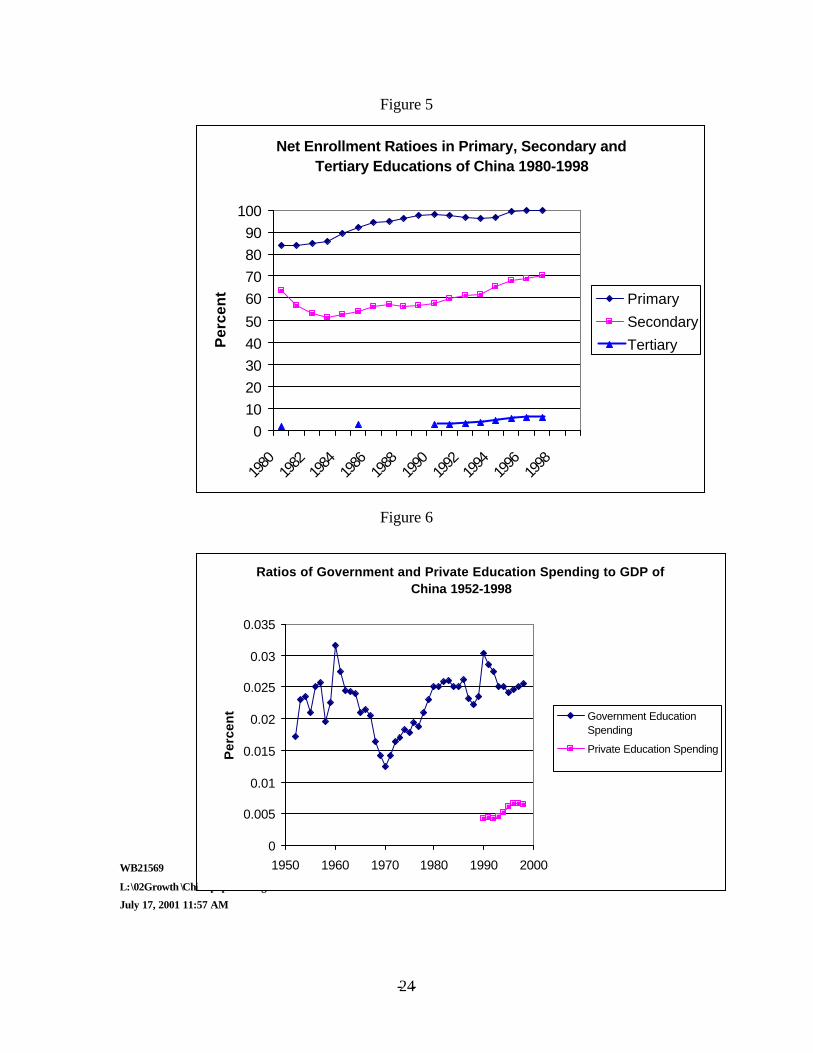
is the rapid expansion of primary education to the population, of which 80% was illiterate before 1949. China’s primary education has expanded rapidly during the pre-reform and reform periods. The estimated enrollment rate16 of primary school was 25% in 1949 (World Bank, 1985) and increased to 84.3 percent in 1980. Figure 5 reveals that the net enrollment rate of primary school reached 100 percent in 1996. Development of China’s secondary education during the pre-reform period and the reform period has been in some ways even more impressive than that of primary education. In 1949, secondary schools enrolled about 1.3 million students, corresponding to a gross enrollment ratio of only 2 percent, but by 1977 this figure had grown to 68 million, with a gross enrollment ratio of about 46% (World Bank, 1985). Figure 5 shows that there is a steady increase of the net enrollment ratio after a significant decline between 1980 and 1984. Despite China has a wide education base in terms of primary and secondary education, the apex of the education pyramid is much narrower than in other low-income Asian economies. Opportunities for tertiary education is restricted to a very small portion of young adults. The echoes of the Cultural Revolution will continue to be heard for some time. More than a quarter of China’s university graduates between the ages of 25 and 64 are older than 50 and will have retired by 2010. [See Figure 5] With respect to education finance, insufficient and uneven funding for basic education is a problem in China. The cost of primary education such as teacher salaries is low, in both absolute and relative terms (World Bank, 1985). China has considerably increased fiscal spending on education in absolute terms during the reform period 1978-1999 but nevertheless devotes a much smaller share of GDP to education than many other developing countries. Figure 6 shows the government education spending/GDP ratio has fluctuated around 2.5 percent during the reform period. Private financing of education has been low but rising fast in the recent years to nearly 1 percent of GDP. Detailed analysis on regional disparities reveals that China’s successful fiscal decentralization may have been associated with insufficient transfers to some poor provinces to support basic education. 17 The distribution of educational funding is more skewed if the possibility of private financing of education is taken into account. In the coastal and richer provinces, about 40% of education financing come from the private sector in the recent years. Whereas, the poor provinces are more reliant on government financing (SSB, 2000. p. 665). [See Figure 6] The growth rate of total factor productivity (TFP) rose from a negative figure (-0.57 percent) in the pre-reform period to an average 2.3 percent per year in the reform period when it accounts for 23.9 percent of the total output growth. This implies that TFP growth, which previously contributed little to output growth before 1978, has 16 The net ratio exclude, but the gross ratio includes, under- and over-age students. 17 In another analysis, we found that the regional disparities in educational attainment across China’s provinces are rising since 1995. This provides further evidence that fiscal transfers to poor regions are not sufficient to support their investment in basic education (Wang and Yao, forthcoming).
- - 15
dramatically become one strong driving force of China’s growth during the reform period. The rise of TFP growth is truly striking. However, factor accumulation has still been more magnificent than TFP growth, which is similar to the post-war growth of the Newly Industrializing Countries of East Asia, i.e. Hong Kong, Singapore, South Korea and Taiwan. Research by Young (1995) has generated considerable controversy by suggesting that productivity growth may have accounted for only a small fraction of the growth of these East Asian economies, with capital accumulation being responsible for the bulk of it. Nonetheless, TFP growth has emerged as one of the most important sources of China’s rapid growth during the reform period.18
Table 1: Sources of Economic Growth
(in percent) Pre-reform Period
1953-77 Labor Share=0.40
Reform Period 1978-99 Labor Share=0.50
Average Annual Growth Rate (%) Output 6.46 9.72 Physical Capital Stock 6.11 9.39 Labor Quantity 2.63 2.73 Human Capital Stock 5.30 2.69 TFP -0.57 2.32 Contribution to GDP growth by factor Contribution of physical capital\a 56.8 48.3 Contribution of labor quantity\a 16.3 14.0 Contribution of human capital\a 32.8 13.8 Contribution of productivity growth\b -5.9 23.9 Note: This table reports the growth decomposition corresponding to equation 2.
a. Ratio of input growth weighted by the corresponding factor income share, to GDP growth.
b. Ratio of TFP growth to GDP growth. Source: Authors.
We now examine the sensitivity of our TFP results. As explained earlier, we used a higher labor share (0.5) in Table 1 since provincial level data show labor shares rose in the reform period (Hsueh and Li 1999). The next table, Table 2, shows how TFP growth estimates vary if different labor shares are used. We select alternative labor shares ranging from 0.67 to 0.4. We find that using alternative values for labor shares does not
18 Many factors may have led to the dramatic rise in TFP, including institutional reforms which provide better incentives to people, opening up of the economy, and access to foreign trade and investment which provide opportunities of learning by doing and techonological progress. This has been the topics of many other studies and will be further investigated by our next research using panel data analysis at provincial level.
- - 16
change the results significantly. In particular, the differences in TFP growth between the pre-reform and reform periods remain large, irrespective of the values chosen for the labor share. Also, the estimated TFP growth during the reform period is resilient.
Table 2: Sensitivity Test: TFP growth using different labor shares
Alternative Labor Shares Pre-reform Period 1953-77 TFP Growth Rate (%)
Reform Period 1978-99 TFP Growth Rate (%)
0.67 -0.87 2.98 0.60 -0.74 2.72 0.40 -0.38 1.92 Note: This table reports the TFP growth decomposition corresponding to different labor shares. 6. Summary and Implications This paper investigates the change in the sources of economic growth during the reform period 1978-1999 relative to that of the pre-reform period 1953-1977 by undertaking a simple growth accounting exercise incorporating human capital. This study makes a small contribution to the methodology of constructing the human capital stock for China; and shed light on the sources of growth with fewer omission errors. First, as shown by Figure 1, the accumulation of human capital in China as measured by the average years of schooling in population age 15-64, was quite rapid, and it contributes significantly to growth and welfare. However, the rate of growth of human capital declined significantly in the reform period in 1978-99, and its contribution to GDP growth is smaller compared to the pre-reform period. Second, after incorporating human capital, the growth of total factor productivity still plays a positive and significant role during the reform period 1978-1999, in contrast to the negative productivity growth during the pre-reform period 1952-1977. In addition, this result is robust to changes in labor shares in GDP. Unlike both sides of the on-going debate, this paper proposes a middle-road answer to the sources of growth, i.e. both productivity growth and factor accumulation are very significant in accounting for China’s growth performance during the reform period. It is beyond this scope of this study to assess the growth possibilities of China in the coming decade. But based on our results, a few implications may be drawn which will be supported by our next research. 19 First, because of the rapid expansion of capital base, the relative importance of factor accumulation may be declining (the law of diminishing returns), as shown in the relative contribution by factor inputs: In Table 1, contributions
19 Our next research will be sources of growth using data at the provincial level, incorporating human capital stock and its distribution across province. Panel data analysis will be done using GMM method.
- - 17
by all factor inputs have declined in the reform period. And total factor productivity (TFP) growth becomes the driving force for China’s growth performance in the long run. The potential to further increase factor inputs is limited especially considering the rapidly aging population, a declining labor force in the future,20 and the constraints in natural resources. Second, past TFP growth was attributable to efficiency gains from market-oriented reforms and initial integration with the global economy which will continue to be important for future growth. Many of the “easy” reforms were implemented and the initial efficiency gains have been obtained. Next stage of TFP growth may involve more painful reforms. Moreover, efficiency gains due to reform are often one-shot gains and will eventually level off. Past TFP growth may be in the nature of a catching-up with technologies obtained from imitation. The imitation-based TFP growth is unlikely to persist over time. Further productivity growth would depend very much on two things: First, whether China can improve allocative efficiency by continuing reforms in the state and financial sectors, and by further global integration and allowing freer factor mobility across sectors, rural-urban, state and nonstate, etc. Second, whether China is able to transform itself from an imitation-based economy to an innovation-oriented economy, and continue its progress on industrial upgrading. Third, investing in human capital has immense potential in contributing to productivity growth and welfare. However, the declined growth rate of human capital accumulation is a matter of concern, especially considering China’s need for building an innovation-based knowledge economy. Funding for basic education is unevenly distributed and insufficient in some poor regions.21 Government spending on education as a ratio of GDP has been stagnated since 1984. Even though private financing is rising in some cities, its availability is not distributed evenly. The distribution of educational funding is more skewed if the availability of private financing is taken into account. Therefore, China needs to address its insufficient and uneven distribution of educational investment urgently, if China is to sustain its growth and welfare improvement in the next decade.
20 See Wang et al (2001) for implication of population aging and declining labor force on growth and pension system reform. 21 This will be the topic of our next research. Preliminary analysis using the standard deviation and gini indexes of education show a widening regional disparity in educational attainment across provinces.
- - 18
Reference Barro, Robert, and J. W. Lee. 1997. “International Measures of Schooling Years and Schooling
Quality.” American Economic Review, Papers and Proceedings 86(2): 218–23. Barro, Robert, and X. Sala -I-Martin. 1995. Economic Growth. New York: McGraw-Hill. Borensztein, Eduardo, and Jonathan D. Ostry. 1996. “Accounting for China’s Growth
Performance”, American Economic Review, 86(2):224-228. Chow, Gregory. 1993. “Capital Formation and Economic Growth in China,” Quarterly Journal of
Economics 108(3):809-42. Easterly, William, and Ross Levine. 2000. “It’s Not Factor Accumulation: Stylized Facts and
Growth Models.” Working Paper. World Bank, Washington, D.C. Available at http://www.worldbank.org/html/prdmg/grthweb/pdfiles/fact3.pdf.
Easterly, William, and Hairong Yu. 2000. “Global Development Network Growth Database.”
Available at http://www.worldbank.org/research/growth/GDNdata.htm. Ezaki, Mitsuo and Lin Sun, 1999. “Growth Accounting in China for National, Regional,and
Provincial Economies: 1981-1995”, Asian Economic Journal, 13(1): 39-73. Hu, Zuliu and Mohsin S. Khan, 1997. “Why is China Growing So Fast?” IMF Staff Papers. The
International Monetary Fund. Washington, DC. Kraay, Aart. 1996. “A Resilient Residual: Accounting for China’s Growth Performance in light of
the Asian Miracle.” World Bank Policy Research Department. Washington, DC. Kraay, Aart. 2000. “Household Saving in China”. World Bank Economic Review 14(3) : 545-70.
Washington DC. Krugman, Paul. 1994. “The Myth of Asia’s Miracle,” Foreign Affairs. 73(December): 62-78. Lucas, Robert E. 1993. “Making a Miracle.” Econometrica, 61(2):251-72. Mankiw, Gregory N., David Romer, and David N. Weil. 1992. “A Contribution to the Empirics
of Economic Growth.” Quarterly Journal of Economics 105(2): 407–37. Nehru, Vikram, Eric Swanson, and Ashutosh Dubey. 1995. “A New Database on Human Capital
Stock in Developing and Industrial Countries: Sources, Methodology, and Results.” Journal of Development Economics 46(2): 379–401.
Psacharopoulos, G. 1984. “ The Contribution of Education to Economic Growth: International
Comparisons.” In J.W. Kendrick, ed., International Comparisons of Productivity and Causes of the Slowdown. Cambridge, Mass: Ballinger Publishing Co.
Roemer, John E. 1993. “A Pragmatic Theory of Responsibility for the Egalitarian Planner.”
Philosophy and Public Affairs 22: 146–66. Romer, Paul. 1986. “Increasing Returns and Long Run Growth.” Journal of Political Economy
90(6): 1002–37.
- - 19
_____. 1990. “Endogenous Technological Change.” Journal of Political Economy 98(5): s71–102.
________. 1993. “Two Strategies for Economic Development: Using Ideas and Producing Ideas.”
Proceedings of the Annual World Bank Conference on Development Economics 1992 Supplement. World Bank Economic Review. Washington, D.C.
Sachs, Jeffrey, and Wing Thye Woo. 1997. “Understanding China’s Economic Performance,”
NBER Working paper no. 5935. National Bureau of Economic Research, Cambridge, MA.
Thomas, Vinod, et al. 2000. The Quality of Growth. New York: Oxford University Press. Thomas, Vinod, and Yan Wang. 1996. “Distortions, Interventions, and Productivity Growth: Is
East Asia Different?” Economic Development and Cultural Change 44(2): 265-288. Wang, Xiaolu, 2000. "Sustainability of China's Economic Growth" (chapter 1 and its appendix),
In Chinese. Economic Science Press, Dec. 2000, Beijing. Wang, Yan, Dianqing Xu, Zhi Wang and Fan Zhai. 2001. “Implicit Pension Debt, Transition
Cost, Options and Impact of China’s Pension Reform: A computable General Equilibrium Analysis.” Policy Research Working Paper 2555. The World Bank. Washington DC.
Wei, Shangjin. 1996. “Foreign Direct Investment in China: Sources and Consequences,” in Takatoshi Ito and Anne O. Kreuger, eds.,Financial Deregulation and Integration in East Asia ,
Chicago: University of Chicago Press. The World Bank. 1997. China 2020: Development Challenges in the New Century. The World
Bank, Washington DC. Young, Alwyn. 1992. “Tale of Two Cities: Factor Accumulation and Technical Change in Hong
Kong and Singapore.” NBER Macroeconomics Annual 1992. Cambridge, Massachusetts; and London: MIT Press.
_____. 1994. “Lessons from East Asian NICS: A Contrarian View.” European Economic Review
38(3–4): 964–73. _____. 1995. “The Tyranny of Numbers: Confronting the Statistical Realities of the East Asian
Growth Experience.” Quarterly Journal of Economics 110(3): 641–80. ____. 2000. “Gold into Base Metals: Productivity Growth in the People’s Republic of China
during the Reform Period.” NBER working papers 7856, August.
- - 20
Figure 1
Source : authors calculation.
Average Schooling Years of China's Population Aged Between 15-64 for the Period 1952-1999
0
1
2
3
4
5
6
7
1950 1960 1970 1980 1990 2000
Yea
rs
- - 21
Figure 2
Gross Domestic Saving and Investment to GDP ratios of China 1960-1999
05
101520253035404550
1960
1963
1966
1969
1972
1975
1978
1981
1984
1987
1990
1993
1996
1999
Per
cen
t
Saving
Investment
- - 22
Figure 3
Population Growth Rate of China (Annual %) 1960-1999
-1.5
-1
-0.5
0
0.5
1
1.5
2
2.5
3
1960
1962
1964
1966
1968
1970
1972
1974
1976
1978
1980
1982
1984
1986
1988
1990
1992
1994
1996
1998
Per
cen
t
- - 23
Figure 4
Structrual Change of China's Employment in Primary, Secondary and Tertiary Industries 1952-1998
30%
40%
50%
60%
70%
80%
90%
100%
1952
1956
1960
1964
1968
1972
1976
1980
1984
1988
1992
1996
Per
cen
t TertiaryShare
SecondaryShare
PrimaryShare
- - 24
Figure 5
Figure 6
WB21569
L:\02Growth \Chinapaper1wang+Yao7-16-01.doc
July 17, 2001 11:57 AM
Ratios of Government and Private Education Spending to GDP of China 1952-1998
0
0.005
0.01
0.015
0.02
0.025
0.03
0.035
1950 1960 1970 1980 1990 2000
Per
cen
t Government EducationSpending
Private Education Spending
Net Enrollment Ratioes in Primary, Secondary and Tertiary Educations of China 1980-1998
01020304050
60708090
100
1980
1982
1984
1986
1988
1990
1992
1994
1996
1998
Per
cen
t Primary
Secondary
Tertiary