Sources and pathways for nutrients and to water and … · 2016-10-28 · Sources and pathways for...
42
Sources and pathways for nutrients and to water and means of intervening CSG 14 th August 2014
Transcript of Sources and pathways for nutrients and to water and … · 2016-10-28 · Sources and pathways for...

Sources and pathways for nutrients and to water and means of intervening CSG 14th August 2014

• Sources , Pathways and Variability
• Targeting interventions
• Whatawhata case
Presentation format

Water Quality What is Water Quality?
A variable, often defined by communities, but good
quality may be water that is safely drinkable,
swimmable and fishable, supports cultural values
and healthy ecosystems. The three main issues
affecting water quality in rural settings are:
• Suspended sediments: that smother the beds of
rivers and estuaries
• Nutrients (nitrogen, phosphorus): that encourage
excess plant growth, algal blooms
• Faecal microbes: that affect human, and often
animal, health.

N 2 fixation
3
Urea - N Organic - N
NH 4 rapid
slow
Fertiliser N
120
60
370
Milk
Meat 65
250 75
dung urine
Feed N
20
On Farm Nitrogen cycling and losses
Values are kg N/ha/year
NO3
35
leaching
N2 O 5
ammonia
35

N2 fixation
Meat
Wool
Urea Organic - N - N
rapid NH4 NO3
slow
Fertiliser N 20
60
200
15
125 60
leaching
15
dung urine
N2O, N2
5
ammonia
15
Values are kg N/ha/year
Nitrogen cycling and losses

Sources

Nitrogen
(1) urine patches, (2) fertiliser, (3) effluent irrigation, (4) clover N-fixation, (5) rain/atmosphere
On Farm Sources of N
1 2 3
4

Sources of nitrogen entering streams in the Waikato region
Point Sources 3%
Dairy68%
OtherPasture
21%
Trees8%
Non-pasture<1%
Niwa data

Phosphorus
(1) fertiliser, (2) soil erosion, (3) animal excreta/effluent irrigation
Farm Sources of P
1 2 3

Point Sources 7%
Dairy42%Other
Pasture35%
Sediment9%
Non-pasture,trees7%
Niwa data
Sources of phosphorus entering streams in the Waikato region

Farm Sources of Sediment
(1) grazed pasture, (2) stream bank/bed erosion, (3) animal excreta, (4) animal tracks, (5) unpaved roading
1,2
3 4 5

Faecal microbes what are they?
faecal microbes
viruses bacteria protozoa
Indicator:
enteroviruses,
phages
Pathogens: human
enteroviruses and
adenoviruses,
noroviruses,
rotaviruses,
hepatitis A
Indicator: E.
coli
Pathogens:
E. coli,
Campylobacter
, Salmonella
Indicator:
Clostridium
perfringens
spores
Pathogens:
Giardia,
Cryptosporidium
Campylobacter
Crytosporidium
Rotavirus

(1) grazed pasture, (2) effluent irrigation, (3) wild and feral animals, (4) livestock in, or close to, waterways, (5) laneways connected to drains
Sources of Faecal Microbes
4
3
2
1
5

source
pathway
Critical source area
80% of losses come from 20% of area
CRITICAL SOURCE AREAS

Illustrating CSA

Pathways
The driving force behind contaminant transfer from land to
waterbodies is water, because it provides the energy and the
carrier for contaminant movement.

Location where a water quality
objective/ limit
has been set
The Challenge….Managing contaminant movement to waterways

H e a l t h y R i v e r s P L A N F O R C H A N G E
Technical Leaders Group
W a i o r a H E R A U T A K I W H A K A P A I P A I
The Water Cycle

Attenuation
Attenuation is the permanent loss or temporary
storage of nutrients, sediment or microbes during the
transport process between where they are generated
(i.e., in the paddock) and where they impact on water
quality (i.e., a downstream water body, such as a
lake).

Attenuation
• Generic attenuation processes include flow
attenuation, deposition, microbial transformations,
vegetation assimilation and other physical and
biogeochemical processes.

Attenuation
• These processes can alter pollutant concentrations
and loads by:
• (i) decreasing the mean concentration or load,
• (ii) decreasing variability of concentration or load,
• (iii) increasing the total

Time Lags
• Hydrological and biogeochemical processes that
result in long residence times of nutrient and
sediment pools in catchments, stream channels
and lakes and reservoirs.
• Such time lags, sometimes referred to as legacies,
reflect the fact that the land-cover conversion and
nutrient and sediment pollution may have occurred
for decades to centuries prior to what you see
today.

0
1
2
3
100
300
500
1995-97 2002-04 2005-07 2008-10
TP
loa
d (to
nn
e/h
a y
r-1) S
S lo
ad
(to
nn
e/h
a y
r-1)
SS
TP
Variability in time (Dairy monitor catchments)
Lag in response of suspended sediments (SS) and total phosphorus (TP)
to improved stock exclusion and reduced pond discharge in 1996

Variability through space and time Consequences for what and where

• Different land use types
result in different
contaminant losses
adding further spatial
variability
• The wide range of losses
within a land use is due to:
• climate
• soil type
• topography
• management
• Infers much gain can be
made
P lo
ss (
kg P
ha
-1 y
r-1)
0.0
0.5
1.0
1.5
2.0
2.5
3.0
3.5
8.0
10.0
N lo
ss (
kg N
ha
-1 y
r-1)
0
5
10
15
20
25
30
35
40
45
50
55
60
Land use
None Sheep Mixed Deer Dairy Arable/Veg
Se
dim
en
t lo
ss (
kg h
a-1
yr-1
)
0
1000
2000
3000
4000
5000
6000
None Sheep Mixed Deer Dairy Arable
Variability and land use types

Variability in performance
Farm nutrient efficiency and N losses to waterways
0
5
10
15
20
25
0 10 20 30 40 50 60 70 80 90
% offarms
N leached (kg N/ha/yr)
a) Waikato
Room for improvement
to low leaching levels

Targeting interventions; what are they? • An instrument (e.g. a sensor)
• A system (e.g. climate forecasting)
• A farm management practice (e.g. time of application of N
fertiliser)
• A product
• A catchment intervention (e.g. Riparian margins)
• Infrastructure (e.g. Irrigation scheme)
Included also are enablers of technologies such as decision
support tools e.g. Crop calculator

Farm Scale

Good Management Practice
Good
Managemen
t Practice
Numeric
catchment
limits for
nutrients
But how much when you’re farming well?

Good Management Practice
Examples:
• Whole farm (map, plan, skills)
• Land (erosion control, ground cover)
• Plant (fertiliser use, irrigation, crop residues)
• Animal (effluent, grazing)
• Other (waste, agrichemicals)

H e a l t h y R i v e r s P L A N F O R C H A N G E
Technical Leaders Group
W a i o r a H E R A U T A K I W H A K A P A I P A I
Nitrogen Interventions: Cost-effectiveness Low Impact (0-10%) Medium Impact (10-30%) High Impact (>30%)
High
Cost
• Restricted grazing
• Enhanced waste
water treatment
systems
• Winter housing and
manure management
Medium
Cost
• Supplementary
feeding, low N diet
• High sugar grass
• Improved irrigation,
farming practice
• Greater root activity
• Lipids or ionophores
• High tannins
• DCD North Island
• Duration control grazing
• Environmental
forecasting
• BioChar
• Soil processes, new
products & formulations
(commercial)
• Ryegrass N use
efficiency
• Constructed and
managed wetlands,
denitrification systems
• DCD South Island
• Match land to agricultural
use
• Diuretic supplementation
or N modifier
• Low N pasture
• Change Animal Type
• Optimal fertiliser
management
• Effluent management
• Gain in nutrient efficiencies
by nutrient management,
farm systems approach,
overseer,
• Precision agriculture -
targeted mitigation high N
areas
• Optimise timing of pasture
grazing / feed to lower N in
diet
• Groundwater assimilative
capacity
Low cost

Improve Production Efficiency: e.g. N
Improved production efficiency of N can be achieved with
higher genetic gain animals, better pastures and efficient use
of artificial N, optimizing stocking rates and use of animal
shelter e.g.: Scenario Profit
($/ha)
Productio
n
(kg MS/ha
N loss
(kg N/ha)
Baseline Canterbury dairy farm
(modelled)
2000 1500 40
Current breeding worth & better N
management
2150 1600 35
High breeding worth, low stocking
rate & better N management
2450 1750 20
High breeding worth, high stocking
rate & better N management
2500 2000 35

H e a l t h y R i v e r s P L A N F O R C H A N G E
Technical Leaders Group
W a i o r a H E R A U T A K I W H A K A P A I P A I
Phosphorus Interventions: Cost-effectiveness
Low Impact (0-10%) Medium Impact (10-30%) High Impact (>30%)
High Cost
• Buffer strips
• Natural and constructed
wetlands
• Aluminium sulphate to
pasture / cropland
• Sorbents in and near
streams
• Irrigation water use and
recycling
Medium Cost
• Effluent pond storage /
low rate application
• Tile drain • Restricted grazing
• Stream fencing
Low Cost
• Fertiliser management -
Optimize soil P, low
water soluble P fertiliser

Tools developed that provide real-time monitoring to
match the supply of water & nutrients with crop demand
to maximise productivity:
2013 • Crop calculators
• Water & irrigation management tools
• Variable rate irrigation
2016 • New crop calculators developed (e.g. onions, kiwifruit)
• Advanced climate and weather forecasting
• Advanced irrigation scheduling
Precision Farming Technology Options and Timeline

Next generation dairy farms P 21 II
• Waikato:
• Higher genetic merit cows, lower
stocking rate, lower replacement rate,
off-paddock periods in autumn/winter,
reduced N fertiliser inputs and
improved dietary balance

Catchment Scale

Buffers & contaminants
Stream bank stabilisation
RIPARIAN ZONE LIVESTOCK STREAM RIPARIAN ZONE LIVESTOCK STREAM
Setback
Filtering surface runoff
RIPARIAN ZONE LIVESTOCK STREAM
RIPARIAN ZONE LIVESTOCK STREAM
Filtering subsurface flow

Riparian fencing
Subsurface flow filtering
Grass filter strips
0 10 30 50 100 %
low medium high
sediment
phosphorus
nitrogen
sediment
phosphorus
nitrogen
sediment
phosphorus
nitrogen
Seepage wetlands sediment
phosphorus
nitrogen
Performance comparison

Waiokura WQ trends 2001/08
Parameter Trend Reasons
Sediment 40%
Riparian management
Faecal
bacteria 40%
Riparian management
Fewer Pond discharges
Nitrate N
14%
More cows/Increased N
fertiliser use
Total P
30%
Riparian management
Fewer pond discharges
Less P fertiliser used
More milk from catchment AND
environmental expectations being met
H e a l t h y R i v e r s P L A N F O R C H A N G E
Technical Leaders Group
W a i o r a H E R A U T A K I W H A K A P A I P A I
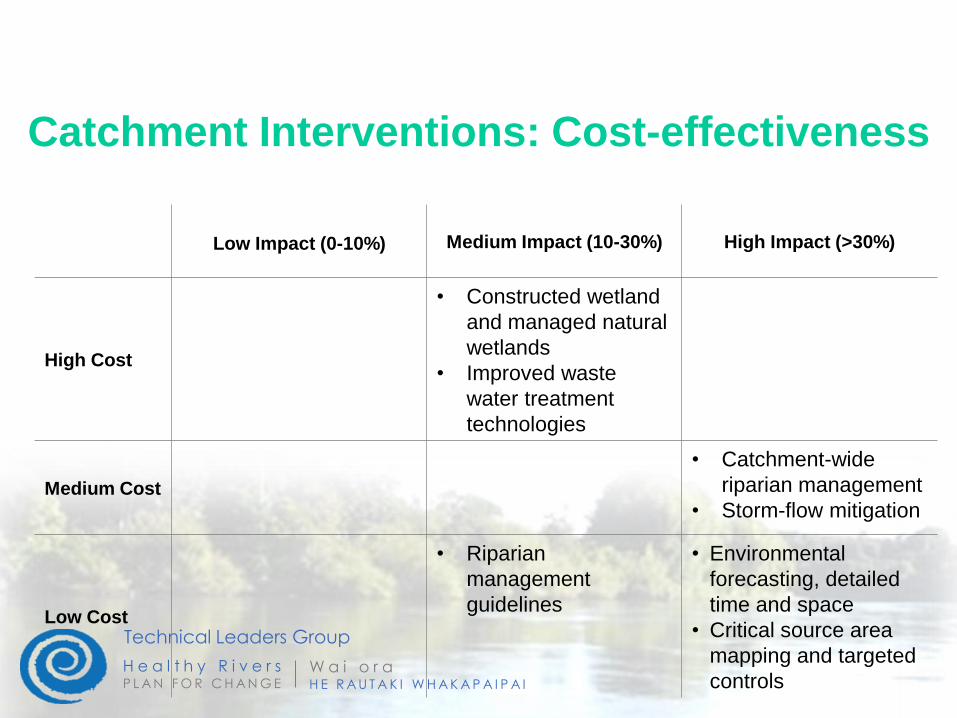
Catchment Interventions: Cost-effectiveness
Low Impact (0-10%)
Medium Impact (10-30%) High Impact (>30%)
High Cost
• Constructed wetland
and managed natural
wetlands
• Improved waste
water treatment
technologies
Medium Cost
• Catchment-wide
riparian management
• Storm-flow mitigation
Low Cost
• Riparian
management
guidelines
• Environmental
forecasting, detailed
time and space
• Critical source area
mapping and targeted
controls

Intervention
Sediment capping Lake Okaro (30 ha) modified zeolite application c.
$75,000 p.a. over 3 years
Phosphorus inactivation Lake Rotorua alum dosing $1M p.a.
Dredging Expensive although costs will vary considerably
depending on circumstances
Oxygenation/destratificati
on
Destratification trial in lake Rotoehu (790 ha):
$524,000
Hypolimnetic withdrawal Limited application so far in NZ but proven to be “low
cost” in Europe and USA.
Weed harvesting
Hornwort harvesting in Lake Rotoehu (790 ha):
$52,800 p.a.
$22/kg N and $165/kg P
Diversions Ohau Channel wall in Lake Rotoiti (124 ha):
$10 million
Ambulance at the bottom of the cliff- Catchment
Restoration interventions

Whatawhata Case
Whatawhata Case