SOURCES AND DISTRIBUTION OF NITRATE IN GROUND … FIELD IRRIGATED WITH SEWAGE TREATMENT-PLANT...
38
SOURCES AND DISTRIBUTION OF NITRATE IN GROUND WATER AT A FARMED FIELD IRRIGATED WITH SEWAGE TREATMENT-PLANT EFFLUENT, TALLAHASSEE, FLORIDA By Marian P. Berndt U.S. GEOLOGICAL SURVEY Water-Resources Investigations Report 90-4006 Prepared in cooperation with the CITY OF TALLAHASSEE, FLORIDA Tallahassee, Florida 1990
Transcript of SOURCES AND DISTRIBUTION OF NITRATE IN GROUND … FIELD IRRIGATED WITH SEWAGE TREATMENT-PLANT...
SOURCES AND DISTRIBUTION OF NITRATE IN GROUND WATER AT A FARMED FIELD IRRIGATED WITH SEWAGE TREATMENT-PLANT EFFLUENT, TALLAHASSEE, FLORIDA
By Marian P. Berndt
U.S. GEOLOGICAL SURVEY
Water-Resources Investigations Report 90-4006
Prepared in cooperation with the
CITY OF TALLAHASSEE, FLORIDA
Tallahassee, Florida 1990

DEPARTMENT OF THE INTERIOR MANUEL LUJAN, Jr., Secretary
U.S. GEOLOGICAL SURVEY Dallas L. Peck, Director
For additional information Copies of this report can bewrite to: purchased from:
District Chief U.S. Geological SurveyU.S. Geological Survey Books and Open-File ReportsSuite 3015 Federal Center, Building 810227 North Bronough Street Box 25425Tallahassee, Florida 32301 Denver, Colorado 80225
CONTENTS
PageAbstract ............................................................................ 1
Introduction ......................................................................... 1
Purpose and scope ................................................................ 2
Previous studies .................................................................. 2
Acknowledgments ................................................................ 2
Site description ...................................................................... 2
Topography ..................................................................... 2
Hydrogeology.................................................................... 3
Surficial aquifer .............................................................. 3
Upper Floridan aquifer ......................................................... 5
Effluent-spray irrigation............................................................ 5
Farming operation ................................................................ 5
Methods ............................................................................ 7
Installation of lysimeters ........................................................... 7
Installation of wells ............................................................... 11
Sampling and analysis of water samples ............................................... 12
Nitrogen isotope analysis ........................................................... 12
Changes in ground-water flow system due to effluent application .............................. 13
Sources of nitrogen ................................................................... 15
Initial ground-water quality ......................................................... 15
Precipitation ..................................................................... 15
Animal waste .................................................................... 16
Sewage treatment-plant effluent ..................................................... 16
Fertilizers ....................................................................... 16
Chemistry of subsurface water .......................................................... 16
Distribution of nitrate in ground water .................................................... 19
Distribution with depth ............................................................ 19
Distribution with time ............................................................. 19
Distribution with location .......................................................... 20
Determination of source of nitrogen in ground water ........................................ 25
Summary and conclusions .............................................................. 28
References .......................................................................... 31
ILLUSTRATIONS
Page Figures
1-7. Maps showing:
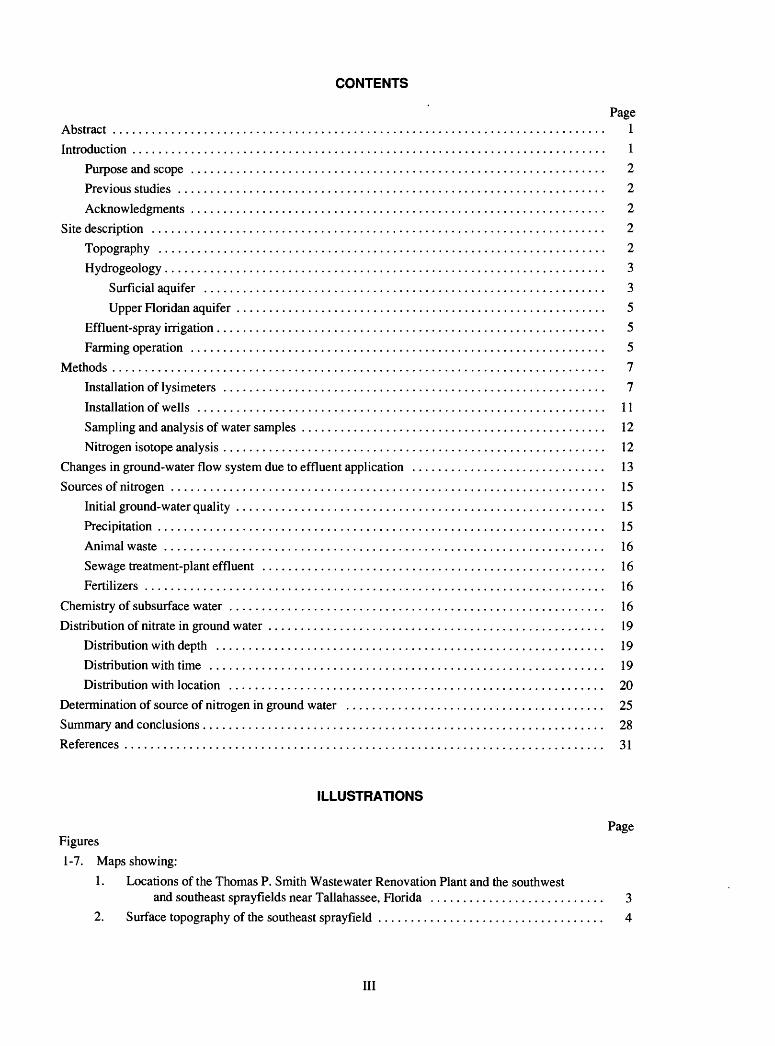
1. Locations of the Thomas P. Smith Wastewater Renovation Plant and the southwestand southeast sprayfields near Tallahassee, Florida ........................... 3
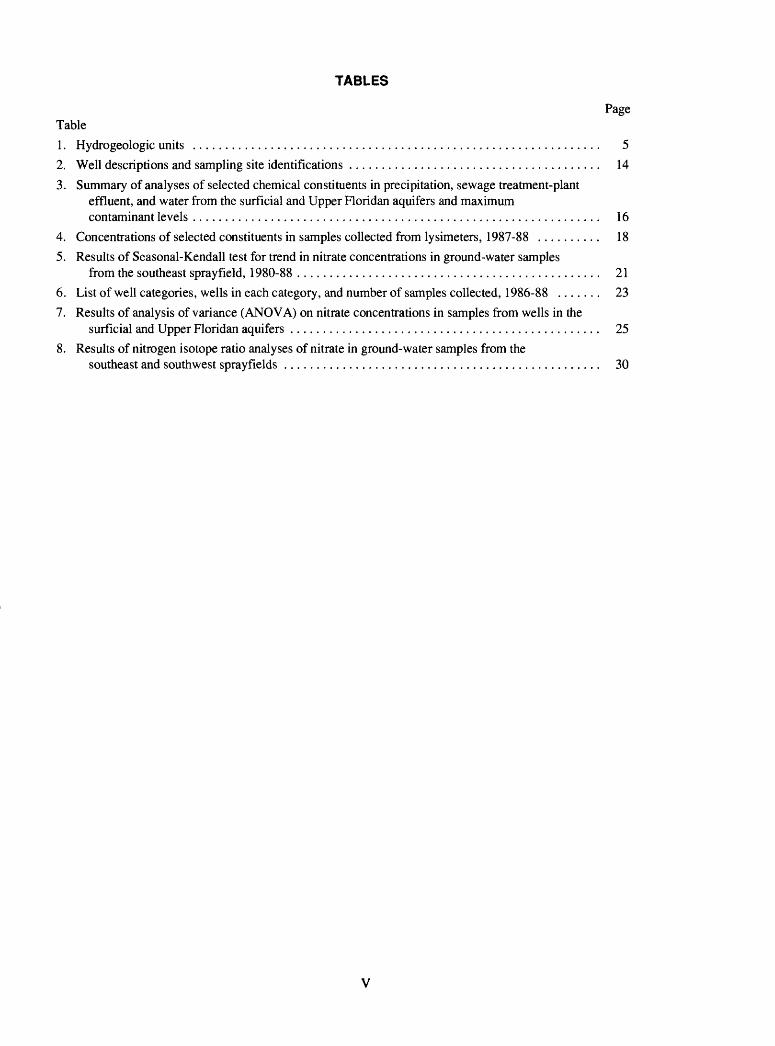
2. Surface topography of the southeast sprayfield ................................... 4
III

ILLUSTRATIONS
Page Figures Continued
3. Thickness of unconsolidated deposits at the southeast sprayfield ...................... 6
4. Altitude of the top of the Upper Floridan aquifer at the southeast sprayfield ............. 7
5. Altitude of the potentiometric surface of the Upper Roridan aquifer at the southeastsprayfield, March 10, 1988 ................................................. 8
6. Altitude of the potentiometric surface of the Upper Roridan aquifer, May 1985, inpart of northern Rorida .................................................... 9
7. Observation wells and center-pivot irrigation system at the southeast sprayfield ......... 10i
8. Bar charts showing monthly precipitation at the Tallahasseb Municipal Airport and effluentapplications at the southeast sprayfield, 1985-87 ................................... 11
9. Sketches of (a) lysimeter construction and installation and (b) relative depths of lysimetersand monitoring wells ......................................................... 12
10. Map showing locations of lysimeter clusters at the southeast sprayfield .................... 13
11. Graphs showing water levels in selected wells at the southeast sprayfield and at theTallahassee Municipal Airport, 1980-88 .......................................... 15
12. Bar chart showing monthly nitrogen applications from sewage treatment-plant effluent andinorganic fertilizers, 1985-87 ................................................... 17
13-15. Graphs showing:
13. Median concentrations of selected constituents in effluent, samples from theunsaturated zone collected in lysimeters, and ground-water samples from wells inthe surficial and Upper Roridan aquifers located adjacent to lysimeters, 1987-88 ..... 19
14. Maximum, minimum, and mean nitrate concentrations in ground water as a function ofwell depth at the southeast sprayfield, 1980-88 ................................. 20
15. Nitrate concentrations in ground water as a function of time for selected wells at thesoutheast sprayfield ...................................................... 22
16. Box plot showing total nitrogen and nitrate concentrations in effluent and six locationcategories of samples from wells, 1986-88 .................................... 24
17. Generalized north-south geohydrologic section showing ground-water flow paths beneaththe southeast sprayfield ....................................................... 26
18-19. Graphs showing:
18. Nitrate concentrations in ground water as a function of depth for clusters of wellslocated inside irrigated tracts: (a) wells 58, 39, and 38 sampled February 9, 1988, and (b) wells 54,6, and 7 sampled March 2,1987 ............................... 27
19. Nitrate concentrations in ground water as a function of depth for clusters of wells located outside irrigated tracts: (a) wells 29, 20, and 21 sampled March 8, 1988, and (b) wells 65, 45,44, and 43 sampled March 2,1988 ......................... 28
20. Map showing Thomas P. Smith Wastewater Renovation Plant and southwest sprayfieldshowing sampling locations for nitrogen isotope measurements ...................... 29
21-22. Graphs showing:
21. Nitrogen isotope ratio, 8 N, as a function of nitrate concentration in ground-watersamples from the southeast and southwest sprayfields ........................... 31
22. Nitrogen isotope ratio, 8 N, in ground water samples from the southeast andsouthwest sprayfields ..................................................... 31
IV
TABLES
Page Table1. Hydrogeologic units ............................................................... 52. Well descriptions and sampling site identifications ....................................... 143. Summary of analyses of selected chemical constituents in precipitation, sewage treatment-plant
effluent, and water from the surficial and Upper Floridan aquifers and maximum contaminant levels ............................................................... 16
4. Concentrations of selected constituents in samples collected from lysimeters, 1987-88 .......... 185. Results of Seasonal-Kendall test for trend in nitrate concentrations in ground-water samples
from the southeast sprayfield, 1980-88 ............................................... 216. List of well categories, wells in each category, and number of samples collected, 1986-88 ....... 237. Results of analysis of variance (ANOVA) on nitrate concentrations in samples from wells in the
surficial and Upper Floridan aquifers ................................................ 258. Results of nitrogen isotope ratio analyses of nitrate in ground-water samples from the
southeast and southwest sprayfields ................................................. 30
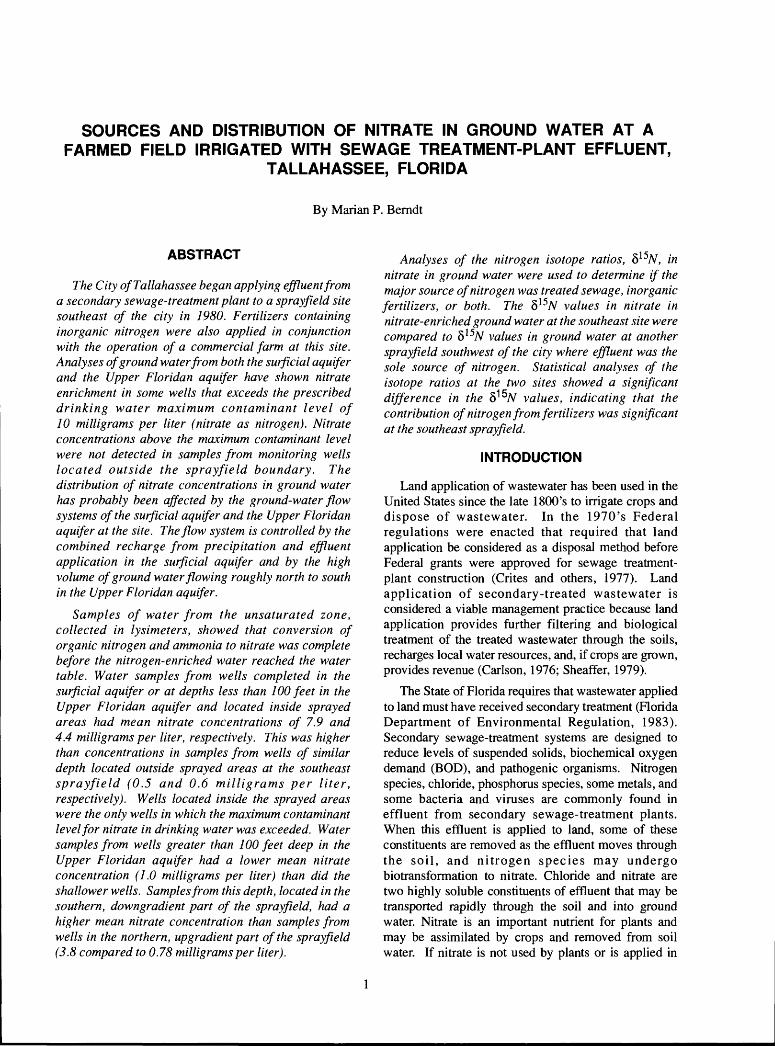
SOURCES AND DISTRIBUTION OF NITRATE IN GROUND WATER AT A FARMED FIELD IRRIGATED WITH SEWAGE TREATMENT-PLANT EFFLUENT,
TALLAHASSEE, FLORIDA
By Marian P. Berndt
ABSTRACT
The City ofTallahassee began applying effluent from a secondary sewage-treatment plant to a spray field site southeast of the city in 1980. Fertilizers containing inorganic nitrogen were also applied in conjunction with the operation of a commercial farm at this site. Analyses of ground water from both the surficial aquifer and the Upper Floridan aquifer have shown nitrate enrichment in some wells that exceeds the prescribed drinking water maximum contaminant level of 10 milligrams per liter (nitrate as nitrogen). Nitrate concentrations above the maximum contaminant level were not detected in samples from monitoring wells located outside the sprayfield boundary. The distribution of nitrate concentrations in ground water has probably been affected by the ground-water flow systems of the surficial aquifer and the Upper Floridan aquifer at the site. The flow system is controlled by the combined recharge from precipitation and effluent application in the surficial aquifer and by the high volume of ground water flowing roughly north to south in the Upper Floridan aquifer.
Samples of water from the unsaturated zone, collected in lysimeters, showed that conversion of organic nitrogen and ammonia to nitrate was complete before the nitrogen-enriched water reached the water table. Water samples from wells completed in the surficial aquifer or at depths less than 100 feet in the Upper Floridan aquifer and located inside sprayed areas had mean nitrate concentrations of 7.9 and 4.4 milligrams per liter, respectively. This was higher than concentrations in samples from wells of similar depth located outside sprayed areas at the southeast sprayfield (0.5 and 0.6 milligrams per liter, respectively). Wells located inside the sprayed areas were the only wells in which the maximum contaminant level for nitrate in drinking water was exceeded. Water samples from wells greater than 100 feet deep in the Upper Floridan aquifer had a lower mean nitrate concentration (1.0 milligrams per liter) than did the shallower wells. Samples from this depth, located in the southern, downgradient part of the sprayfield, had a higher mean nitrate concentration than samples from wells in the northern, upgradient part of the sprayfield (3.8 compared to 0.78 milligrams per liter).
Analyses of the nitrogen isotope ratios, 815Af, in nitrate in ground water were used to determine if the major source of nitrogen was treated sewage, inorganic fertilizers, or both. The 8 15Af values in nitrate in nitrate-enriched ground water at the southeast site were compared to 8 15Af values in ground water at another sprayfield southwest of the city where effluent was the sole source of nitrogen. Statistical analyses of the isotope ratios at the two sites showed a significant difference in the 815Af values, indicating that the contribution of nitrogen from fertilizers was significant at the southeast sprayfield.
INTRODUCTION
Land application of wastewater has been used in the United States since the late 1800's to irrigate crops and dispose of wastewater. In the 1970's Federal regulations were enacted that required that land application be considered as a disposal method before Federal grants were approved for sewage treatment- plant construction (Crites and others, 1977). Land application of secondary-treated wastewater is considered a viable management practice because land application provides further filtering and biological treatment of the treated wastewater through the soils, recharges local water resources, and, if crops are grown, provides revenue (Carlson, 1976; Sheaffer, 1979).
The State of Florida requires that wastewater applied to land must have received secondary treatment (Florida Department of Environmental Regulation, 1983). Secondary sewage-treatment systems are designed to reduce levels of suspended solids, biochemical oxygen demand (BOD), and pathogenic organisms. Nitrogen species, chloride, phosphorus species, some metals, and some bacteria and viruses are commonly found in effluent from secondary sewage-treatment plants. When this effluent is applied to land, some of these constituents are removed as the effluent moves through the soil, and nitrogen species may undergo biotransformation to nitrate. Chloride and nitrate are two highly soluble constituents of effluent that may be transported rapidly through the soil and into ground water. Nitrate is an important nutrient for plants and may be assimilated by crops and removed from soil water. If nitrate is not used by plants or is applied in
such large quantities that the nitrate load supplied exceeds the needs of plants, it may be transported to the water table and cause an increase in nitrate concentrations in ground water.
The City of Tallahassee began applying effluent from a secondary sewage-treatment plant to land on a 20.5 acre site southwest of the city in 1966. This southwest spray field is located adjacent to the Thomas P. Smith Wastewater Renovation Plant (fig. 1). Expansions of the southwest sprayfield in 1972 and 1977 have increased the total area to nearly 120 acres. Originally, the application rates were experimental and were used to determine optimum application rates and types of crops that could be grown without harming local water supplies (Overman, 1979).
In late 1980, a much larger sprayfield was opened 8 miles east of the original site (fig. 1). The total amount of land presently used for irrigation at the two sites is approximately 2,000 acres. The average amount of treated waste water applied from January 1985 to April 1988 was 15.4 Mgal/d (million gallons per day).
The new site, known as the southeast sprayfield, is presently operated as a commercial farm by a farmer under contract with the City of Tallahassee. Farming operations include the growing of forage crops (corn, sorghum, soybeans, and rye grass) that are irrigated with the treated sewage with supplemental application of commercial fertilizers (containing nitrogen, potassium, and sulfur) during the growing season.
The present study was undertaken in cooperation with the City of Tallahassee to determine if the procedure of applying effluent and commercial fertilizer to the land was resulting in nitrogen enrichment of the underlying ground water. The primary purpose of the study was to determine the sources and distribution of nitrate in ground water at the southeast sprayfield.
Purpose and Scope
This report describes the sources of nitrate in ground water at the southeast sprayfield. Primary sources include treated wastewater and fertilizers; secondary sources of nitrate are soils, animal waste, and precipitation. The distribution of nitrate as a function of depth, time, and location is also described and evaluated.
This study involved periodic sampling of the 60 wells located at the southeast sprayfield and analysis of the ground water primarily for nitrate nitrogen, chloride, ammonia nitrogen, organic nitrogen, and nitrite nitrogen. Nitrate nitrogen was used as the principal target variable and was emphasized during the 1986-88 sampling period. Also, 62 samples of ground water and effluent were collected for analysis of the nitrogen isotope ratio in nitrate. Nitrogen-isotope
samples were collected from the southeast and the southwest sprayfields in an attempt to distinguish between wastewater and fertilizer sources of nitrogen.
Previous Studies
Ssveral reports have been published describing the effects of spraying secondary-treated wastewater on the hydrology and ground-water quality at the southwest sprayfield (Slack, 1975; Yurewicz, 1983; Yurewicz and Rosfcnau, 1986). Nitrate and chloride have both increased in concentration in ground water at the southwest sprayfield, whereas phosphorus concentration, coliform bacteria concentration, and BOD have not increased. The irrigation at the southwest sprayfield, however, has not affected water levels or flow paths.
Similar results have been reported for the southeast sprayfield. Elder and others (1985) found that the spraying of the treated wastewater was not affecting water levels, but that concentrations of nitrate and chloride were increasing in ground water. In a more recent study of the southeast sprayfield, Pruitt and others (1988) found that nitrate and chloride concentrations had continued to increase in water from some wells. The amount of chloride and nitrate present in ground water from each well appears to depend on the location of the well (inside or outside of a spraying tract) and the depth of the well. Several organic compounds were detected in the treated wastewater and two of these compounds were detected in ground water at the sprayfield. However, concentrations of the two compounds never exceeded drinking water standards established by the Florida Department of Environmental Regulation (1985) and concentrations remained near the detection limit.
Acknowledgments
Tie author thanks William G. Leseman and Keith Turner of the City of Tallahassee for their help in supplying all the necessary technical information and documentation of the operation of the sewage-treatment plant and the sprayfield. Also, thanks are extended to Walter Vidak and R.L. Johnson, the managers of the farming operation at the southeast sprayfield, for providing information regarding the farming operations.
SITE DESCRIPTION
Topography
Ttie southeast sprayfield is located in the Woodville Karst Plain (Hendry and Sproul, 1966). In this area, limeistone of the Upper Floridan aquifer is overlain by deposits of sand and silt that contain discontinuous layers of clay. The highest land surface altitudes at the

84'20' 84° 10"
30"30'
0 1 2 3 KILOMETERS
SOUTHWEST SPRAYFIELD
ANDTHOMAS P SMITH
WASTEWATERRENOVATION
PLANT
SOUTHEAST SPRAYFIELD
30'20'
Figure 1. Locations of the Thomas P. Smith Wastewater Renovation Plant and the southwest and southeast sprayfields near Tallahassee, Florida. (Modified from Pruitt and others, 1988.)
southeast site are approximately 70 feet above sea level and are located in the northern part of the site (fig. 2). Numerous covered sinkholes in the limestone are responsible for depressions in the land surface. Some of these depressions were partially filled during construction of the sprayfield to smooth out the land surface for farming and operation of the tract spray units, although the land surface remains undulating. The land surface slopes downward toward the southern boundary of the site with altitudes as low as 20 feet.
Hydrogeology
Surficial Aquifer
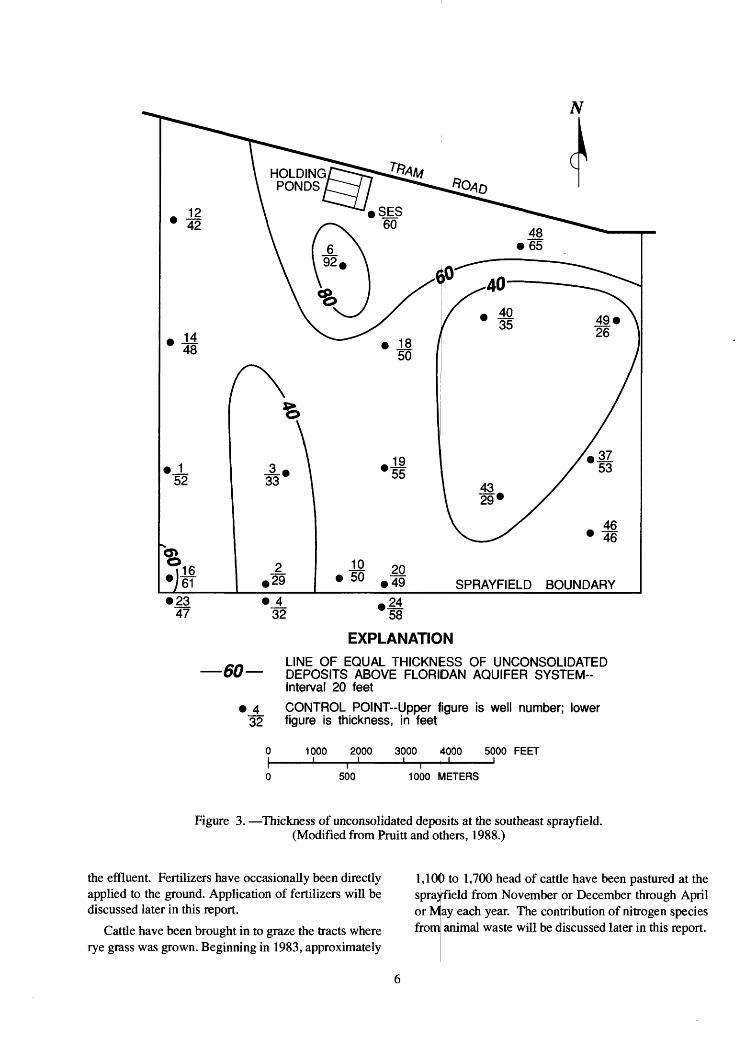
The lithology of the southeast sprayfield is shown in table 1. The surficial aquifer at the southeast sprayfield consists of permeable sand and silt interspersed with less permeable layers of clay and clayey sand. These unconsolidated deposits are approximately 30 to 60 feet thick throughout most of the study area (fig. 3).

SPRAYFIELD BOUNDARY
-30-
EXPLANATION
TOPOGRAPHIC CONTOUR-Shows altitude of land surface. Contour interval 10 feet. Hachures indicate depressions. Datum is sea level
1000 2000 3000 4000 5000 FEET
500 1000 METERS
Figure 2. Surface topography of the southeast sprayfield. (From Pruitt and others, 1988.)
Examination of deposits during the drilling in 1987 showed that the layers of clay vary in thickness, color, texture, and depth. One or more clay layers were penetrated at every location at which a new well was drilled.
The surficial aquifer is partly saturated with the water table generally following the contours of the land
surface. Depth to water in the surficial aquifer, as measured in all of the wells in this aquifer, ranges from 5 to 35 feet below land surface, although most water levels range from 15 to 25 feet below land surface. The water table generally is higher than the potentiometric surface of the Upper Floridan aquifer. Control data were hot sufficient to prepare a water-table map of the southeast sprayfield.

Table 1. Hydrogeologic units
[From Hendry and Sproul (1966), Schmidt (1979), and Miller (1982)]
Hydrogeologic Thickness Series Formation unit (feet)
Holocene to
Miocene
Miocene
Oligocene
Eocene
Fine sand and silt, clayey sand, and clay
St. Marks Formation
Suwannee Limestone
Ocala Limestone Avon Park Formation
Undifferentiated fine-grained elastics
Surficial aquifer
Floridan aquifer system
(includes Upper Floridan aquifer)
Confining unit
1 30-60
1,600
Unknown
'Thickness is much greater in buried sinkholes.
Upper Floridan Aquifer
The Upper Floridan aquifer is the uppermost unit of the Floridan aquifer system (Pruitt, 1988). The Floridan aquifer system is the principal source of water in the vicinity of Tallahassee and consists of a series of highly permeable carbonate rocks (table 1). The thickness of the entire Floridan aquifer system is approximately 1,600 feet at the southeast sprayfield (Miller, 1982). The altitude of the top of the Upper Floridan aquifer ranges from approximately 10 feet above sea level to approximately 40 feet below sea level (fig. 4). The St. Marks Formation and the Suwannee Limestone are the only two units of the Upper Floridan aquifer penetrated by observation wells at the southeast sprayfield.
The top of the Upper Floridan aquifer in the area of the southeast sprayfield is the St. Marks Formation of Miocene age. According to Hendry and Sproul (1966), the St. Marks Formation consists of silty to sandy limestones, up to 200 feet thick, that have been partially recrystallized and have undergone varying degrees of dolomitization. Prior to the deposition of the sediments that overlie it, the surface of the St. Marks Formation was exposed to chemical weathering and physical erosion. Solution channels began to form near the surface and have continued to enlarge with time. Solution of the limestone has also occurred at depth along fractures and bedding planes and has created a highly permeable formation of connecting solution channels.
Below the St. Marks Formation lies the Suwannee Limestone of Oligocene age. Solution channels are more extensive in the Suwannee Limestone than in the St. Marks Formation, making the Suwannee Limestone a more productive source of ground water (Hendry and Sproul, 1966).
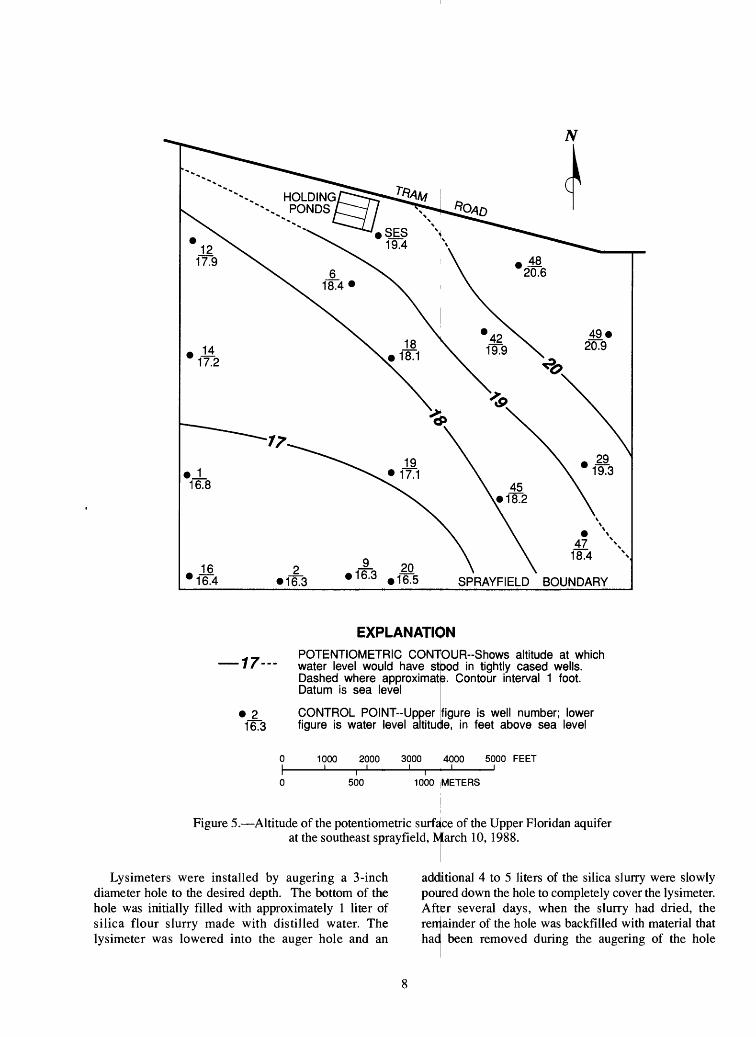
The potentiometric surface of the Upper Floridan aquifer at the southeast sprayfield in March 1988 is shown in figure 5. The general direction of ground-water flow in the area is to the southwest. The regional potentiometric surface for north Florida in May 1985 (fig. 6) indicates a ground-water flow direction more toward the south, and indicates that the potentiometric surface at the southeast sprayfield was lower in 1985 than in 1988. Historical records of water levels in wells at the southeast sprayfield and a well at the Tallahassee Municipal Airport showed that water levels in mid-1985, when the regional potentiometric surface map was prepared, were approximately 8 to 10 feet lower at both sites than in March 1988.
Recharge to the surficial aquifer is primarily through rainfall in the area. Recharge to the Upper Floridan aquifer is from the downward movement of water from the surficial aquifer and from rainfall in areas to the north of Tallahassee. Discharge is to natural springs to the south of Leon County and to pumped water-supply wells (Schmidt, 1979).
Effluent-Spray Irrigation
The 1,840-acre southeast sprayfield is divided into 13 circular tracts, each containing a center-pivot spray unit (fig. 7). The tracts range in approximate size from 100 to 180 acres. The tracts are numbered from 1 through 13. Tracts 1 through 7 have been irrigated since November 1980, tracts 8 through 11 since March 1982, and tracts 12 and 13 since March 1986.
There are four lined holding ponds at the southeast sprayfield. Only one of the four ponds is used on a daily basis. The retention of the effluent in the holding pond prior to spray application is generally less than 48 hours.
The monthly volume of sewage treatment-plant effluent applied at the southeast sprayfield from January 1985 through December 1987 is shown in figure 8. The average annual volume of effluent applied during 1985-87 was approximately 140 inches, which is double the average annual precipitation of approximately 68 inches for the same time period. The effluent application is relatively constant throughout the year, whereas precipitation mostly occurs in the summer months (fig. 8).
Farming Operation
The southeast sprayfield is operated as a commercial farm, growing rye grass, soybeans, and corn for cattle feed. The farming operation includes the use of fertilizers and some pesticides and herbicides which are applied through the center-pivot spray unit along with
10 2050 .1
SPRAYFIELD BOUNDARY
60
_32
EXPLANATION
LINE OF EQUAL THICKNESS OF UNCONSOLIDATED DEPOSITS ABOVE FLORIDAN AQUIFER SYSTEM-- Interval 20 feet
CONTROL POINT-Upper figure is well number; lower figure is thickness, in feet
1000 2000 3000 4000 5000 FEET
500 1000 METERS
Figure 3. Thickness of unconsolldated deposits at the southeast sprayfield. (Modified from Pruitt and others, 1988.)
the effluent. Fertilizers have occasionally been directly applied to the ground. Application of fertilizers will be discussed later in this report.
Cattle have been brought in to graze the tracts where rye grass was grown. Beginning in 1983, approximately
1,100 to 1,700 head of cattle have been pastured at the sprayfield from November or December through April or May each year. The contribution of nitrogen species from animal waste will be discussed later in this report.

SPRAYFIELD BOUNDARY
20-
__ -6
35 EXPLANATION
STRUCTURE CONTOUR--Shows altitude of the top of the Upper Floridan aquifer system. Contour interval 20 feet. Datum is sea level
CONTROL POINT-Upper figure is well number; lower figure is altitude of top of Upper Floridan aquifer system, in feet above or below sea level
1000 2000 3000 4000 5000 FEET
500 1000 METERS
Figure 4. Altitude of the top of the Upper Roridan aquifer at the southeast sprayfield. (Modified from Pruitt and others, 1988.)
METHODS
Installation of Lysimeters
Lysimeters are water-collecting devices that have a porous section into which water from the unsaturated zone is collected by drawing a vacuum inside the device. Each lysimeter is approximately 2 inches in diameter, 17.5 inches long, and constructed of polytetrafluoroethylene (PTFE). The porous section, which allows water to enter the lysimeter, is a 4-inch
long, 70-micrometer pore size section in the middle of the lysimeter (fig. 9a). The part of the lysimeter below the porous section acts as a reservoir for water after it is drawn into the lysimeter. A sample extraction tube and a vacuum tube are attached to the top of the lysimeter. The sample extraction tube extends through the entire length of the lysimeter and is used to remove water samples from the bottom of the lysimeter. The vacuum tube extends only to the top of the lysimeter and is used to draw a vacuum inside the lysimeter when the sample extraction tube is clamped closed.
16 - 3 «16.5 SPRAYFIELD
77
2 1673
EXPLANATION
POTENTIOMETRIC CONTOUR-Shows altitude at which water level would have stood in tightly cased wells. Dashed where approximate. Contour interval 1 foot. Datum is sea level
CONTROL POINT-Upper figure is water level altitude"
figure is well number; lower in feet above sea level
1000 2000 3000 4000 5000 FEET
500 1000 METERS
Figure 5. Altitude of the potentiometric surface of the Upper Floridan aquifer at the southeast sprayfield, March 10, 1988.
Lysimeters were installed by augering a 3-inch diameter hole to the desired depth. The bottom of the hole was initially filled with approximately 1 liter of silica flour slurry made with distilled water. The lysimeter was lowered into the auger hole and an
additional 4 to 5 liters of the silica slurry were slowly poured down the hole to completely cover the lysimeter. After several days, when the slurry had dried, the rem ainder of the hole was backfilled with material thathad been removed during the augering of the hole

85°0084°00'
3CT30'
3CTOO' -
EXPLANATIONSOUTHEAST SPRAYFIELD
_ POTENTIOMETRIC CONTOUR-Shows altitude at which water level would have stood in tightly cased wells. Contour interval 10 feet. Datum is sea level
PRECIPITATION COLLECTION SITE
OBSERVATION WELL
20 MILES
10 20 KILOMETERS
Figure 6. Altitude of the potentiometric surface of the Upper Fioridan aquifer, May 1985, in part of northern Florida. (Modified from Rosenau and Meadows, 1986.)
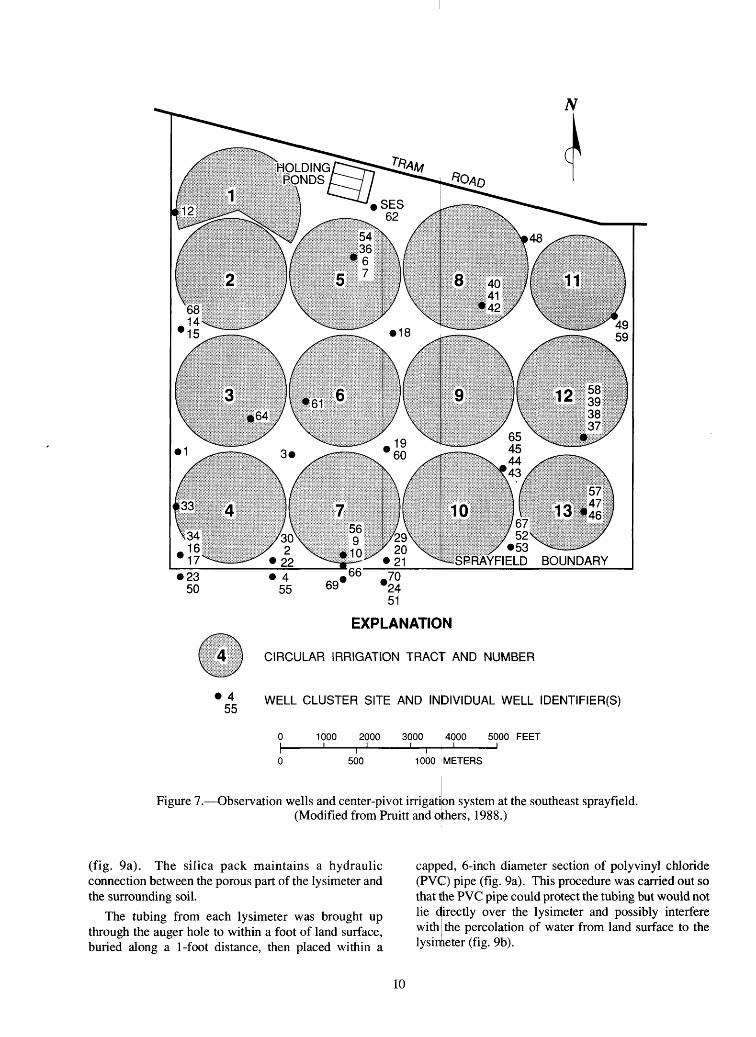
EXPLANATION
CIRCULAR IRRIGATION TRACT AND NUMBER
WELL CLUSTER SITE AND INDIVIDUAL WELL IDENTIFIER(S)
1000 2000 3000 4000 5000 FEET
500 1000 METERS
Figure 7. Observation wells and center-pivot irrigati(Modified from Pruitt and others
tion system at the southeast sprayfield. , 1988.)
(fig. 9a). The silica pack maintains a hydraulic connection between the porous part of the lysimeter and the surrounding soil.
The tubing from each lysimeter was brought up through the auger hole to within a foot of land surface, buried along a 1-foot distance, then placed within a
capped, 6-inch diameter section of polyvinyl chloride (PVC) pipe (fig. 9a). This procedure was carried out so that the PVC pipe could protect the tubing but would not lie directly over the lysimeter and possibly interfere with the percolation of water from land surface to the lysimeter (fig. 9b).
10

15
>.O(/> 2HUJ 10x<x&sias 5
DC Q.
I-
UJ .
025
u-f=iu m U.HI issg*«^ls g*1 5
20 -
PRECIPITATION
JFMAMJ JASONDJFMAMJ JASONDJFMAMJ JASOND
1985 1986 1987
Figure 8. Monthly precipitation at the Tallahassee Municipal Airport and effluent applications at the southeast sprayfield, 1985-87.
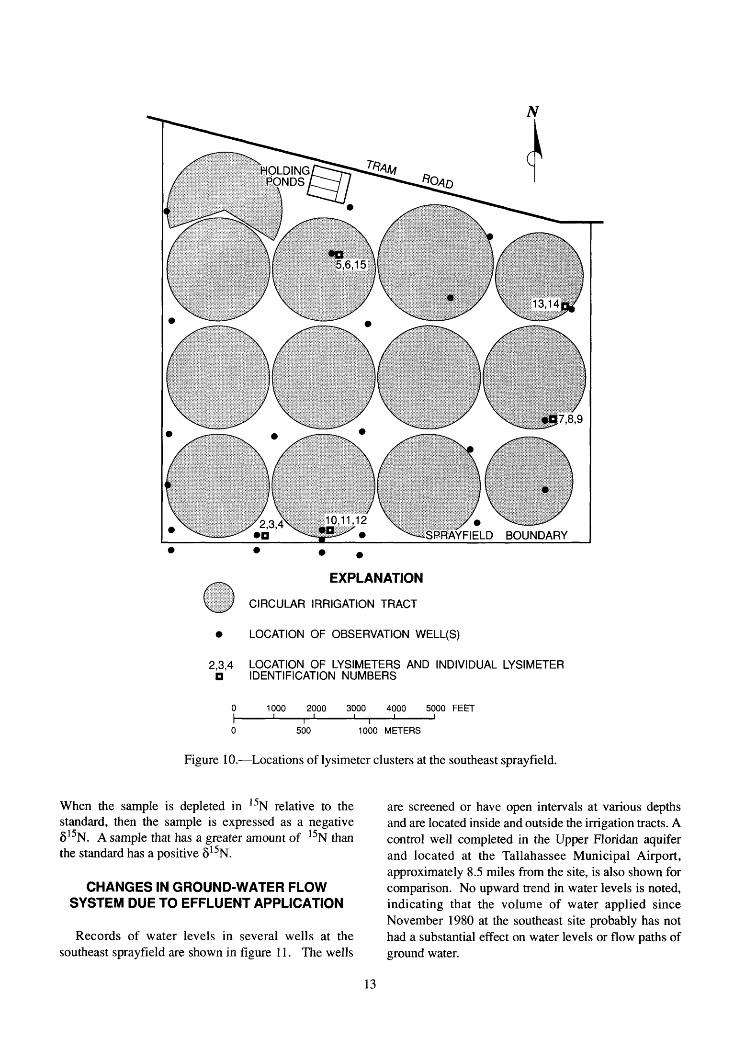
Clusters of three lysimeters were installed adjacent to monitoring wells at four locations at the southeast sprayfield in October 1987 (fig. 10). Two lysimeters were installed in circular tract 11. Lysimeters were installed approximately 3 feet apart and placed at three different depths. The first lysimeter was installed at a depth approximately 4 to 5 feet below land surface, the second, 8 to 10 feet below land surface, and the third approximately 13 feet below land surface.
Installation of Wells
From October 1979 to December 1981, before and shortly after irrigation began, 45 observation wells were installed at the southeast sprayfield. Of these, 36 wells were completed in the Upper Floridan aquifer. Several of the 10 wells that were completed in the surficial aquifer were often dry or were destroyed by cattle or farm equipment. Additional shallow wells were installed into the surficial aquifer during May and July 1987. Two wells were installed and completed in the Upper Floridan aquifer in 1986. The total number of wells sampled for this study included 38 wells
completed in the Upper Floridan aquifer and 20 wells completed in the surficial aquifer.
Wells completed in the Upper Floridan aquifer range in depth from 40 to 242 feet below land surface. The wells in the Upper Floridan aquifer are cased with either steel or PVC and are finished as open-hole.
The wells completed in the surficial aquifer at the southeast sprayfield are made of 2-inch diameter PVC pipe with a 5-foot section of slotted screen at the bottom. Depths range from 17 to 43 feet below land surface.
Many of the wells were installed in clusters of two or three, so that ground water from the two aquifers and from different depths within the Upper Floridan aquifer could be sampled. Well locations and local identifiers for each well are shown in figure 7. In addition, each well was assigned a unique 15-digit code identifying each well site by latitude and longitude. Information about each well, including construction, well depths, and land surface altitude, is given in table 2.
11

VACUUM TUBE SAMPLE EXTRACTIONTUBE
LAND SURFACE
BACKFILLED MATERIAL
NOT TO SCALE
LYSIMETER
POROUS PART OF LYSIMETER
SILICA PACK
MONITORING
SCREEN -I
NOT TO SCALE
LYSIMETERS
ft ft ft LANDSURFACE
UNSATURATED ZONE
^7 WATERTABLE
I I I I
(b)
SURFICIAL AQUIFER
UPPERFLORIDANAQUIFER
Figure 9. Sketches of (a) lysimeter construction and installation and (b) relative depths of lysimeters and monitoring wells.
Sampling and Analysis of Water Samples
Water in the unsaturated zone was collected by using lysimeters. A hand-operated vacuum pump was used to apply 60 to 70 centibars (8.7-10.1 pounds per square inch) of vacuum to the lysimeters. Samples were drawn through the sample extraction tube into collection bottles, using a peristaltic pump, approximately 20 to 25 hours later.
Wells in the Upper Floridan aquifer were sampled with a permanently installed submersible pump, after pumping at least two casing volumes of water from the well. Wells in the surficial aquifer were sampled by bailer or using a 1.7-inch diameter, hand-operated, positive displacement pump after removing three casing volumes of water, or bailing the well dry the day before sampling. Samples collected from the wells in the surficial aquifer occasionally had to be filtered to remove excessive amounts of suspended materials before analysis. Characteristics measured in the field include water level, pH, temperature, and specific conductance. Field analyses were done using prescribed U.S. Geological Survey procedures (Fishman and Friedman, 1985). The quality assurance on these analyses was ensured by a reference sample program with the U.S. Geological Survey Water Quality Service Unit at Ocala, Fla.
Samples were stored on ice in the field and were taken to the laboratory on the day of collection. Analyses were done at the City of Tallahassee Water Quality Laboratory using methods that follow
U.S. Geological Survey procedures (American Public Health Association, 1985; and Fishman and Friedman, 1985). The City of Tallahassee Water Quality Laboratory analyzes standard reference samples in cooperation with the U.S. Geological Survey.
Nitrogen Isotope Analysis
Samples for nitrogen isotope analysis were collected in 1-liter bottles. To prevent isotope fractionation by bacterial processes before analysis, the samples were kept on ice, frozen, then shipped frozen to the laboratory at the: University of Nebraska. Several duplicate
,es were run for quality assurance. The analysis ofen isotopes consists of comparing the ratio of two
stable isotopes of nitrogen, 14N and 15N, in a
analys nitrog of theknown standard to the ratio in the sample. The predominant form of nitrogen in the Earth's atmosphere (99.632 + 0.002 percent) is 14N (Nier, 1955; Junk and Svec, 1958; and Kreitler, 1975). Atmospheric nitrogen is used as the standard. The ratio of the sample to the standard is measured by converting the nitrogen species to nitiiogen gas and analyzing the gas by comparing the ratio of nitrogen of mass 29 to mass 28 using mass spectrometry (Kreitler, 1975). This ratio of sample to standard is expressed as 5 15N in parts per thousand (PPt):
15 _ ( 15W14N) sample - ( 15N/ 14N) standard6 1DN(ppt) = X 1,000N) standard
12
SPRAYFIELD BOUNDARY
EXPLANATION
CIRCULAR IRRIGATION TRACT
LOCATION OF OBSERVATION WELL(S)
2,3,4 LOCATION OF LYSIMETERS AND INDIVIDUAL LYSIMETER D IDENTIFICATION NUMBERS
0 1000 2000 3000 4000 5000 FEET
0 500 1000 METERS
Figure 10. Locations of lysimeter clusters at the southeast sprayfield.
When the sample is depleted in 15N relative to the standard, then the sample is expressed as a negative 8 15N. A sample that has a greater amount of 15N than the standard has a positive 515N.
CHANGES IN GROUND-WATER FLOW SYSTEM DUE TO EFFLUENT APPLICATION
Records of water levels in several wells at the southeast sprayfield are shown in figure 11. The wells
are screened or have open intervals at various depths and are located inside and outside the irrigation tracts. A control well completed in the Upper Floridan aquifer and located at the Tallahassee Municipal Airport, approximately 8.5 miles from the site, is also shown for comparison. No upward trend in water levels is noted, indicating that the volume of water applied since November 1980 at the southeast site probably has not had a substantial effect on water levels or flow paths of ground water.
13
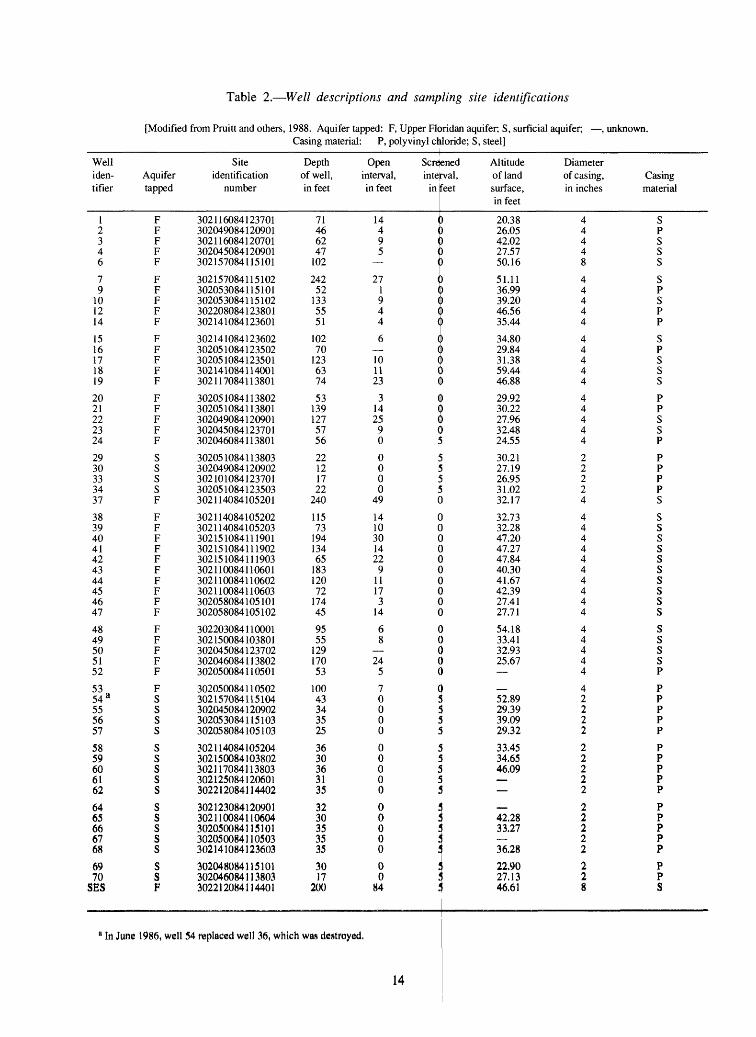
Table 2. Well descriptions and sampling site identifications
[Modified from Pruitt and others, 1988. Aquifer tapped: F, Upper Floridan aquifer; S, surficial aquifer; , unknown.Casing material: P, polyvinyl chloride; S, steel]
Well iden tifier
12346
79
101214
1516171819
2021222324
2930333437
38394041424344454647
4849505152
5354 a555657
5859606162
6465666768
6970
SES
Aquifer tapped
FFFFF
FFFFF
FFFFF
FFFFF
SSSSF
FFFFFFFFFF
FFFFF
FSSSS
SSSSS
SSSSS
SSF
Site identification
number
302116084123701302049084120901302116084120701302045084120901302157084115101
302157084115102302053084115101302053084115102302208084123801302141084123601
302141084123602302051084123502302051084123501302141084114001302117084113801
302051084113802302051084113801302049084120901302045084123701302046084113801
302051084113803302049084120902302101084123701302051084123503302114084105201
302114084105202302114084105203302151084111901302151084111902302151084111903302110084110601302110084110602302110084110603302058084105101302058084105102
302203084110001302150084103801302045084123702302046084113802302050084110501
302050084110502302157084115104302045084120902302053084115103302058084105103
302114084105204302150084103802302117084113803302125084120601302212084114402
302123084120901302110084110604302050084115101302050084110503302141084123603
302048084115101302046084113803302212084114401
Depth of well, infect
71466247
102
24252
1335551
10270
1236374
531391275756
22121722
240
11573
19413465
18312072
17445
9555
12917053
10043343525
3630363135
3230353535
3017
200
Open Sere interval, inte in feet in
14 14 19 15 (
_ 1
27 (1 (9 (4 (4 (
6 (_ 110 (
ened Altitude rval, of land :eet surface,
in feet
) 20.38) 26.05) 42.02) 27.57) 50.16
) 51.11) 36.99) 39.20) 46.56) 35.44
) 34.80) 29.84) 31.38
1 1 0 59.4423 0 46.88
3 0 29.9214 0 30.2225 0 27.96
9 0 32.480 5 24.55
0 5 30.210 5 27.190 5 26.950 5 31.02
49 0 32.17
14 0 32.7310 0 32.2830 0 47.2014 0 47.2722 0 47.84
9 0 40.3011 0 41.6717 0 42.39
3 0 27.4114 0 27.71
6 0 54.188 0 33.41 0 32.9324 0 25.6750
7 0 -0 5 52.890 5 29.390 5 39.090 5 29.32
0 5 33.450 5 34.650 5 46.0905 0 5
0 3 -0 5 42.280 3 33.2700
00
84
36.28
22.9027.1346.61
Diameter of casing, in inches
44448
44444
44444
44444
22224
4444444444
44444
42222
22222
22222
228
Casing material
SPSSS
SPSPPSPSSS
PPSSPPPPPS
SSSSSSSSSS
SSSSPPPPPPPPPPPPPPPPPPS
1 In June 1986, well 54 replaced well 36, which was destroyed.
14

HI
§sCO
w§CO<IDHI LL
111
§DC
I
25
20
15
10
5
25
20
15
10
5
35
30
25
20
15
WELLS OUTSIDE IRRIGATED TRACTS FLORIDAN
WELL 19
FLORIDAN WELL 17
WELLS INSIDE IRRIGATED TRACTS
i i ;
SURFICIAL WELL 54(36)
A / *-'
V.'V FLORIDANWELL 9
WELL AT TALLAHASSEE - MUNICIPAL AIRPORT
1980 1981 1982 1983 1984 1985 1986 1987 1988
Figure 11. Water levels in selected wells at the southeast sprayfield and at the Tallahassee Municipal Airport, 1980-88.
SOURCES OF NITROGEN
Initial Ground-Water Quality
The results of analyses of ground water from two wells at the southeast sprayfield collected prior to spray irrigation are given in table 3. Nitrate plus nitrite (as nitrogen), total Kjeldahl nitrogen (ammonia plus organic nitrogen), and phosphorus (total) concentrations were less than 1.0 mg/L in samples collected from the surficial aquifer and the Upper Floridan aquifer. Analyses of samples collected from the surficial aquifer and the Upper Floridan aquifer were similar.
Precipitation
Mean concentrations of nitrate plus nitrite nitrogen, and chloride, for samples collected at the National Trends Network site at Quincy, Fla., from March 1984
to January 1987 are given in table 3. The mean concentration of nitrate was 0.96 mg/L, and the mean concentration of chloride was 0.72 mg/L. Ammonia is not shown in the table because it was detected in trace amounts (<0.02 mg/L) in many samples.
The nitrogen contributed from precipitation for the area of the southeast sprayfield was estimated using the 1984-87 mean nitrate concentration of 0.96 mg/L and a mean annual precipitation rate (for 1985-87) of 67.51 inches. Precipitation records were available only up to 1987. Based on these estimates, the nitrogen contributed by precipitation was calculated to average 1.2 pounds of nitrogen per acre per month (14.7 pounds of nitrogen per acre per year). This estimated load is probably low because all nitrogen species were not included in the calculation.
15

Animal Waste Fertilizers
The amount of nitrogen derived from cow manure was calculated from estimates of the quantity of manure produced per head of cattle in a 4- to 5-month period (U.S. Environmental Protection Agency, 1977) and the reported percentage of nitrogen in cow manure (Martin and others, 1985). The estimated nitrogen load contributed by animal wastes from the 1,100 to 1,700 head of cattle ranged from 10 to 18 pounds per acre per year.
Sewage Treatment-Plant Effluent
Results of analyses of the sewage treatment-plant effluent show that mean concentrations of nitrogen species (total Kjeldahl and nitrate plus nitrite), phosphorus and chloride are much higher than in background ground-water samples or in precipitation (table 3). These mean concentrations are based on monthly samples collected from the holding pond at the southeast sprayfield.
The monthly concentration of total nitrogen and the monthly volume of effluent applied (1985-86 data) were used to calculate estimates of the monthly amounts of nitrogen applied for the period January 1985 to December 1987 (fig. 12). The effluent applications during this period were presumed to be representative of the effluent applications since 1980. The concentration of total nitrogen used for this calculation was the sum of nitrate plus nitrite nitrogen and total Kjeldahl nitrogen. The mean nitrogen application rate from effluent was calculated to be about 36.2 pounds of nitrogen per month per acre. The precipitation contribution of 1.2 pounds of nitrogen per month is negligible compared to the contribution from the effluent.
Inorganic fertilizers (primarily liquid ammonia) are used seasonally to supplement the nitrogen from the sewage treatment-plant effluent for crops, such as corn, that require large amounts of nitrogen at specific times during plant growth. The total amounts of fertilizers appliec and their compositions have been documented (Keith Turner, City of Tallahassee, written commun., 1981-88). The monthly applications of nitrogen from inorganic fertilizers averaged 16.9 pounds of nitrogen per acrs for the period January 1985 to December 1987. Although the average monthly application rate of fertilizers is roughly half that from effluent, the nitrogen from fertilizers in some individual months is twice the amount from effluent (fig. 12). This additional nitrogen from tie fertilizers is intended for utilization by the crops. But, if all the nitrogen from fertilizers is not utilized by the crops, it may be an additional source of nitrogen to the ground water.
CHEMISTRY OF SUBSURFACE WATER
The chemistry of nitrogen species, chloride, and phosphorus was studied in water from the unsaturated zone and ground water. Reduced species of nitrogen, such as ammonia and organic nitrogen, are easily converted under oxidizing conditions by microbial activity to form nitrite or nitrate. Nitrite is an unstable constituent that is rapidly converted to nitrate and is rarely detected in large quantities in ground water. Concentrations of nitrite in ground water at the southeast sprayfield have seldom exceeded trace amounts (0.02 mg/L). For this reason, nitrite is considered a negligible component of ground water and the analysis of nitrate plus nitrite can be considered to represent nitrate.
Table 3. Summary of analyses of selected chemical constituents in precipitation, sewage treatment-plant effluent, and water from the surficial and Upper Floridan aquifers and maximum contaminant levels
[Modified from Pruitt and others, 1988. Precipitation, mean of 82 samples from Quincy rain gage, March 1984-January 1987; effluent, mean of 19 samples from holding pond at sprayfield, 1985-86; well 54, surficial aquifer well (formerly well 36), one sample collected November 14, 1980; well SES, Upper Floridan aquifer well, mean of four samples collected in 1980; MCL, maximum contaminant level; (p), primary drinking water regulation; (s), secondary drinking water regulation; and NS, no standard available (Florida [Department of Environmental Regulation, 1985); <, less than]
Precipitation Constituent 1984-87
Nitrogen, nitrate 0.96 plus nitrite asnitrogen
Nitrogen, Kjeldahl Nitrogen, ammonia
as nitrogenPhosphorus, total Chloride .72
Effluent \N 1985-86
Fell 54 1980
7.7 <0.10
7.2 .41
5.6 .0843 3.4
Well SES 1980
0.30
.10
.04
.044.1
MCL
10 (p)
NSNS
NS250 (s)
16

80
111 OoDCi*Z DC
0<
60
2°- 40
52OZ
-°
>:~ 20
OEFFLUENTINORGANIC FERTILIZER
J F M A M J JASONDljFMAMJJASONDljFMAMJJASOND
1985 1986 1987
Figure 12. Monthly nitrogen applications from sewage treatment-plant effluent andinorganic fertilizers, 1985-87.
Nitrate and chloride are the principal constituents whose concentrations have increased above initial concentrations in ground water at the southeast sprayfield. Nitrate and chloride do not readily form compounds with soil materials, and they can be transported through the soils to the water table, whereas phosphorous, which is also present in the effluent, is easily retained by organic matter in soils and sediments (Hem, 1985). Total Kjeldahl nitrogen, nitrite, and phosphorus have not been found in concentrations greater than background levels in ground-water samples at the southeast sprayfield. Total Kjeldahl nitrogen and total phosphorus have been found in concentrations greater than background levels in water from the unsaturated zone, but not exceeding 1.5 mg/L.
Water from the unsaturated zone was collected in lysimeters bimonthly from December 1987 until June 1988. From December 1987 to January 1988, attempts to sample all 15 of the lysimeters were made, but from February to June 1988 the sampling was reduced to the two groups of lysimeters located in tracts 5 and 7 (fig. 10) that yielded samples of sufficient volume for chemical analysis. Sample volumes less than approximately 20 mL (milliliters) were not analyzed and after March 22, 1988, none of the six lysimeters
yielded samples in sufficient volume. Only 3 of the 15 lysimeters yielded samples during the 7 months of sampling. A total of 11 samples was collected in lysimeters from December 1987 to March 1988. The small number of samples collected was probably due to malfunction of the lysimeter or to lack of sufficient soil moisture around the lysimeter during sampling.
Samples were obtained from lysimeters 5, 6, and 10 and were analyzed for nitrate plus nitrite, total Kjeldahl nitrogen, total phosphorus and dissolved chloride (table 4). Nitrate concentrations ranged from 19 to 29 mg/L with a median concentration of 25 mg/L. Concentrations of total Kjeldahl nitrogen ranged from 0.60 mg/L to 0.91 mg/L, with a median of 0.78 mg/L. Total phosphorus concentrations ranged from 0.03 to 1.5 mg/L with a median of 0.13 mg/L, and dissolved chloride concentrations ranged from 17 to 50 mg/L, with a median of 44 mg/L.
Median concentrations of these constituents in water from the unsaturated zone were compared to median concentrations in the effluent and in ground water from the surficial and Upper Floridan aquifers for the period January 1987 through March 1988. The median concentrations in ground water were determined for
17

samples from two wells in the surficial aquifer (54 and 56) and four wells in the Upper Floridan aquifer (6,7,9, and 10) located in the two irrigated tracts where samples from lysimeters were obtained (fig. 7). The depths of wells in the surficial aquifer were 43 and 35 feet, whereas the depths of the wells in the Upper Floridan aquifer ranged from 52 to 242 feet.
Nitrate, total Kjeldahl nitrogen, phosphorus, and chloride concentrations showed much variability during transport of the effluent from the irrigation source, through the unsaturated zone, and to ground water in the surficial and Upper Floridan aquifers (fig. 13). The median concentration of nitrate was higher in the unsaturated zone than in the effluent, but the median concentrations decreased in ground water. Nitrate concentrations in the unsaturated zone were probably higher than those in the effluent due to the commercial fertilizer applications and to the oxidation of some of the reduced nitrogen species (total Kjeldahl nitrogen) to nitrate. The median concentration of total Kjeldahl nitrogen and total phosphorus was much higher in the effluent than in water from the unsaturated zone or
ground water (fig. 13). The median concentration of chloride was higher in samples from the unsaturated zone than in the effluent, but concentrations decreased in ground water.
The differences in the median concentrations of nitrate^ Kjeldahl nitrogen, and phosphorus in the effluent applied at the land surface and in water collected 4 to 13 feet below land surface indicate the types of reactions occurring in the upper soil zone, whereas the differences between nitrate and chloride concentrations in the unsaturated zone and ground water are probably due to dilution. The increase in nitrate concentrations, and the decrease in total Kjeldahl nitrogen concentrations in the samples from the unsaturated zone compared to the effluent concentrations, suggest that nitrification, in which ammonia and organic nitrogen are converted to nitrate and nitrite, occurred at depths less than the depths of the lysimeters. The low phosphorus concentrations in the unsaturated zone compared to the effluent indicated that pnosphorus was removed from solution in the soils
Table 4. Concentrations of selected constituents in samples collected from lysimeters, 1987-88
[Concentrations in milligrams per liter (mg/L); , not analyzed; lysimeters installed October 21-23,1987]
Lysimeter description
Lysimeter 5Depth: 10 feetLocated near
well SE-7
Lysimeter 6Depth: 4 feetLocated near
well SE-7
Lysimeter 10Depth: 13 feetLocated near
well SE-10
MeanStandard deviation
MedianNumber of samples
Date sampled
12-16-872-03-882-04-883-22-88
12-16-872-03-88
2-03-882-04-882-05-882-08-883-22-88
Nitrogen, Nitrogen nitrate Kjeldahl Phos- plus (organic phorus,
nitrite +ammonia) total
19242526
2229
2625232524
242.4
2511
0.67 0.13.78 .09
.07.70 .03
.64 1.5
.91 1.4
.63 .34
.80 .18- .05 1.2
.60 .05
.72 .47
.12 .61
.78 .138 11
Chlo ride
17444837
2635
4744495029
3911
4411
18

DC UJ
Z-J
-E
ii |-»j
zoo jO-1
5z
1O
40
35
30
25
15
10
5
n
^*"~~
*'''' ^ Nitrate Nitrogen \ o Total Kjeldahl Nitrogen \ Chloride \ n Total Phosphorus \
/Nf \ / x/ v/ / x/ « x
/ *U / V
¥ v v v
S::,^ V* '~*~=>Q___,_ _ ______^^
NOTE: Unsaturated zone includes lysimeters 5, 6, and 10. Surficial aquifer includes wells 54 and 56, and Upper Floridan aquifer includes wells 6, 7, 9, and 10.
Figure 13. Median concentrations of selected constituents in effluent, samples from the unsaturated zone collected in lysimeters, and ground-water samples from wells in the surficial and Upper Floridan aquifers located adjacent to lysimeters, 1987-88.
at depths less than 4 to 13 feet. The highest concentrations of phosphorus were found in the lysimeter samples from the lysimeter at a depth of 4 feet, the most shallow depth, indicating that phosphorus was still not completely removed at this depth. The median nitrate and chloride concentrations in ground water were half, or less than those measured in the unsaturated zone. Because nitrate and chloride are both highly soluble constituents in natural water, dilution with native ground water is the probable explanation for this decrease.
DISTRIBUTION OF NITRATE IN GROUND WATER
The variations in nitrate concentrations in ground water as a function of depth at the southeast sprayfield were studied to determine the extent of nitrate infiltration from surface sources. The changes in nitrate concentrations in ground water as a function of time were examined for trends. The concentrations of nitrate in ground-water samples were also compared based on location of wells, either inside or outside spray irrigation tracts, in order to assess the areal distribution and possible migration paths of this constituent in ground water.
Distribution with Depth
Ranges and means of nitrate concentrations as a function of depth are shown in figure 14 for all ground-water samples collected at the southeast site from November 1980 through April 1988. The pattern of nitrate concentrations demonstrated in figure 14 indicates that the greatest nitrate concentrations at the southeast sprayfield are primarily found in the shallow surficial aquifer. The highest nitrate concentrations in ground water were found in samples from relatively shallow wells, and concentrations decreased with depth. Eight of the wells sampled had nitrate concentrations which exceeded the MCL for nitrate: six wells in the surficial aquifer, 54, 56, 57, 58, 61, and 64; and two wells in the Upper Floridan aquifer, 9 and 47. The deepest well in which the MCL for nitrate was exceeded was 52 feet deep.
Distribution with Time
The Seasonal-Kendall nonparametric test for trend was used to determine if trends in nitrate concentrations exist and if the trends were statistically significant in ground water at the southeast sprayfield during the period 1980 through 1988. This method involves testing the randomness of concentrations with time, and takes into account any seasonality in the water-quality data and also values reported as below the detection limit (Hirsch and others, 1982). Smith and others (1987) described a "trend" as a "monotonic change in time, occurring as either an abrupt or gradual change with time." The p-values represent the likelihood that the variability in concentration with time is due to chance. For this analysis, trends were considered statistically significant for p-values <0.05.
Twenty-two wells had statistically significant upward trends in nitrate concentration from 1980 through 1988 (table 5). Of the 58 wells sampled, only 36 had sufficient historical data for inclusion in this trend analysis. The remaining 22 wells either had less than one sample per year or had been sampled for less than 5 years. Fifteen of the wells with insufficient data for the trend analysis were in the surficial aquifer, six of which had nitrate concentrations greater than the MCL.
Concentrations of nitrate in samples from four wells in the Upper Floridan aquifer (9,22,40, and 43) and one well in the surficial aquifer (54 (36)) that showed significant trends in nitrate concentration were plotted as a function of time in figure 15. The wells were selected to represent ground water in the two aquifers at different locations and at different depths. Wells 9, 22, and 54 (36) are located in the western half of the sprayfield where irrigation began in late 1980, and wells 40 and 43 are located in the eastern half of the sprayfield
19

O MAXIMUM
X MEAN
A MINIMUM
uX i >
1100 150
DEPTH, IN FEET
200 250
Figure 14. Maximum, minimum, and mean nitrate concentrations in ground water as a function of well depth at the southeast sprayfield, 1980-88.
where irrigation began in March 1982. Wells 9 and 40 are located inside irrigated tracts (directly beneath sprayers) and wells 22 and 43, are located outside irrigated tracts, but within the boundaries of the sprayfield (fig. 7). Well 54 is a replacement for well 36 which was destroyed by farm equipment. It was installed in June 1986 and drilled to the same depth as well 36 and is less than 20 feet from the original location of well 36.
Examination of the nitrate concentrations in ground water from the selected wells over time showed little or no change in concentration in the first year after spray irrigation began (fig. 15). But beginning about 12 to 14 months after irrigation with the sewage treatment-plant effluent began, notable trends were evident in nitrate concentrations in ground water. The greatest increase in nitrate concentrations, and where nitrate concentrations exceeded the MCL, were in samples from wells 9 and 54 located inside irrigated tracts where effluent has been applied since 1980. Samples from wells 22 and 43
located outside irrigated tracts also increased in nitrate concentrations, but the nitrate concentrations did not exceed the 10 mg/L MCL. Samples collected from well 40, located inside an irrigated tract in the eastern half of the sprayfield, have shown an increase in nitrate concentrations, but the nitrate concentrations have not exceeded 2.5 mg/L.
Distribution with Location
Wells at the southeast sprayfield were divided into categoric s based on a combination of aquifer, depth, andlocation in order to observe distribution of nitrateconcentrations and the relative importance of lateral and downwafd flow through the surficial aquifer and the upper 100 feet of the Upper Floridan aquifer (table 6). If ground-water flow through these two aquifers is mostly downward rather than lateral, the ground water collectec from wells located outside irrigated tracts should siow little or no nitrate enrichment from the sewage treatment-plant effluent or the fertilizers.
20
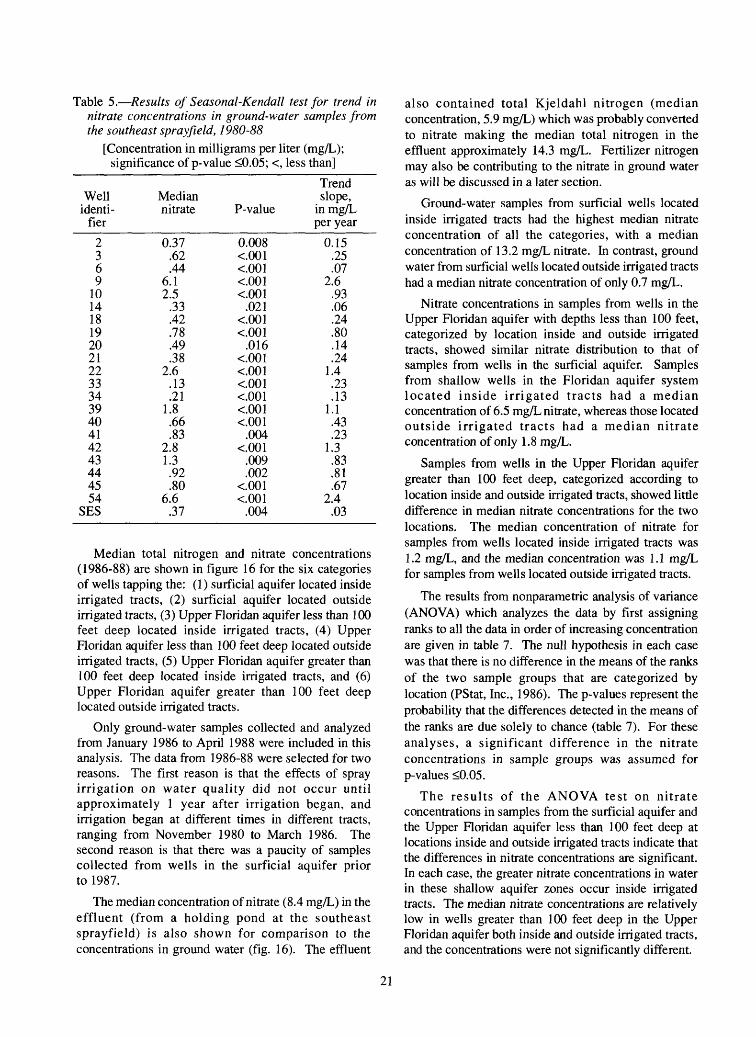
Table 5. Results of Seasonal-Kendall test for trend in nitrate concentrations in ground-water samples from the southeast spray field, 1980-88
[Concentration in milligrams per liter (mg/L); significance of p-value <0.05; <, less than]
Well identi
fier
2369
1014181920212233343940414243444554
SES
Median nitrate
0.37.62.44
6.12.5
.33
.42
.78
.49
.382.6
.13
.211.8.66.83
2.81.3.92.80
6.6.37
P-value
0.008<.001<.001<.001<.001
.021<.001<.001
.016<.001<.001<001<.001<.001<.001
.004<.001
.009
.002<.001<001
.004
Trend slope,
in mg/L per year
0.15.25.07
2.6.93.06.24.80.14.24
1.4.23.13
1.1.43.23
1.3.83.81.67
2.4.03
Median total nitrogen and nitrate concentrations (1986-88) are shown in figure 16 for the six categories of wells tapping the: (1) surficial aquifer located inside irrigated tracts, (2) surficial aquifer located outside irrigated tracts, (3) Upper Floridan aquifer less than 100 feet deep located inside irrigated tracts, (4) Upper Floridan aquifer less than 100 feet deep located outside irrigated tracts, (5) Upper Floridan aquifer greater than 100 feet deep located inside irrigated tracts, and (6) Upper Floridan aquifer greater than 100 feet deep located outside irrigated tracts.
Only ground-water samples collected and analyzed from January 1986 to April 1988 were included in this analysis. The data from 1986-88 were selected for two reasons. The first reason is that the effects of spray irrigation on water quality did not occur until approximately 1 year after irrigation began, and irrigation began at different times in different tracts, ranging from November 1980 to March 1986. The second reason is that there was a paucity of samples collected from wells in the surficial aquifer prior to 1987.
The median concentration of nitrate (8.4 mg/L) in the effluent (from a holding pond at the southeast sprayfield) is also shown for comparison to the concentrations in ground water (fig. 16). The effluent
also contained total Kjeldahl nitrogen (median concentration, 5.9 mg/L) which was probably converted to nitrate making the median total nitrogen in the effluent approximately 14.3 mg/L. Fertilizer nitrogen may also be contributing to the nitrate in ground water as will be discussed in a later section.
Ground-water samples from surficial wells located inside irrigated tracts had the highest median nitrate concentration of all the categories, with a median concentration of 13.2 mg/L nitrate. In contrast, ground water from surficial wells located outside irrigated tracts had a median nitrate concentration of only 0.7 mg/L.
Nitrate concentrations in samples from wells in the Upper Floridan aquifer with depths less than 100 feet, categorized by location inside and outside irrigated tracts, showed similar nitrate distribution to that of samples from wells in the surficial aquifer. Samples from shallow wells in the Floridan aquifer system located inside irrigated tracts had a median concentration of 6.5 mg/L nitrate, whereas those located outside irrigated tracts had a median nitrate concentration of only 1.8 mg/L.
Samples from wells in the Upper Floridan aquifer greater than 100 feet deep, categorized according to location inside and outside irrigated tracts, showed little difference in median nitrate concentrations for the two locations. The median concentration of nitrate for samples from wells located inside irrigated tracts was 1.2 mg/L, and the median concentration was 1.1 mg/L for samples from wells located outside irrigated tracts.
The results from nonparametric analysis of variance (ANOVA) which analyzes the data by first assigning ranks to all the data in order of increasing concentration are given in table 7. The null hypothesis in each case was that there is no difference in the means of the ranks of the two sample groups that are categorized by location (PStat, Inc., 1986). The p-values represent the probability that the differences detected in the means of the ranks are due solely to chance (table 7). For these analyses, a significant difference in the nitrate concentrations in sample groups was assumed for p-values <0.05.
The results of the ANOVA test on nitrate concentrations in samples from the surficial aquifer and the Upper Floridan aquifer less than 100 feet deep at locations inside and outside irrigated tracts indicate that the differences in nitrate concentrations are significant. In each case, the greater nitrate concentrations in water in these shallow aquifer zones occur inside irrigated tracts. The median nitrate concentrations are relatively low in wells greater than 100 feet deep in the Upper Floridan aquifer both inside and outside irrigated tracts, and the concentrations were not significantly different.
21

NIT
RA
TE
NIT
RO
GE
N
CO
NC
EN
TRA
TIO
N,
IN
MIL
LIG
RA
MS
P
ER
LI
TER
CTQ
£ §
_
CO
C
03-3
Eft
-i£-

Table 6. List of well categories, wells in each category, and number of samples collected, 1986-
Number ofWell category
Wells samples collected 1986-88
Inside irrigated tracts
Outside irrigated tracts
Upgradient
Downgradient
Surficial aquifer
54,56,57,58,61,64
29, 33, 34, 55, 59,60, 6265,66,67,68,69,7054, 56, 62, 68
29, 33, 34, 55, 56, 57,58, 60,61,64, 65, 66,69,70
37
37
21
53
Upper Floridan aquifer less than 100 feet deep
Inside irrigated tracts
Outside irrigated tracts
Upgradient Downgradient
9,39,42,47
1, 2, 3, 4, 12, 14, 16, 18,19,20,24,45,48,49, 52, 53 12, 14, 18, 42, 48, 49 1,2,3,4,9,16,19,2024, 39, 45, 47, 52, 53
40
68
23 85
Inside irrigated tracts
Outside irrigated tracts
Upgradient Downgradient
Upper Floridan aquifer greater than 100 feet deep
6,7, 10, 37, 38,40, 41,46SES, 15, 17,21,22, 43,44,50,51SES, 6, 7, 15,40,4110, 17, 21, 22, 37, 38,43,44,46,50,51
55
47
4755
The difference in the nitrate concentrations for these two categories of wells in the surficial aquifer indicates there is little lateral flow within the surficial aquifer and that the nitrate entering the surficial aquifer directly underneath the irrigated tracts is probably being primarily transported downward. This recharge may be retarded to some extent by the discontinuous layers within the surficial aquifer and between the surficial aquifer and the Upper Floridan aquifer.
For wells less than 100 feet deep in the Upper Floridan aquifer, concentrations of nitrate are greater in samples from inside the irrigated tracts than in samples from outside the tracts. As in the surficial aquifer, the principal direction of ground-water movement appears to be downward. Many of these wells are only 10 to
20 feet deeper than wells in the surficial aquifer, so this similarity is expected.
The ANOVA test on samples from wells in the Upper Floridan aquifer greater than 100 feet deep yielded a p-value greater than 0.05, which indicates there is no significant difference in the nitrate concentrations between samples collected inside and outside irrigated tracts (table 7). The absence of a significant difference in concentrations of nitrate in samples from wells in the Upper Floridan aquifer greater than 100 feet deep inside and outside irrigated tracts may indicate that lateral flow is more dominant here or that mixing with the ground water containing background concentrations of nitrate dilutes the nitrate contributed by the effluent and fertilizers.
23

EFFLUENT SURFICIAL AQUIFERUPPER FLORIDANAQUIFER, i DEPTH
LESS THAN 100 FEET
UPPER FLORIDANAQUIFER, DEPTH
GREATER THAN 100 FEET
Outlier (value farther than 1.5 times the interquartile range from the median)
Whisker indicates extent of data values to a distance 1.5 times interquartile range (interquartile range is distance between the 25th and 75th percentiles)
75th percentile
Number of samples
50th percentile
25th percentile
INSIDE TRACTS
OUTSIDE TRACTS
INSIDE TRACTS
OUTSIDE TRACTS
INSIDE TRACTS
OUTSIDE TRACTS
Figure 16. Total nitrogen and nitrate concentrations in effluent and six location categories of samples from wells, 1986-88.
Wells were further categorized by location upgradient or downgradient with respect to the ground-water flow direction (table 6). Upgradient wells are those in the northern area of the southeast sprayfield and downgradient wells are those within the sprayfield, but to the south, in the direction of ground-water flow.
Results for samples from wells in the surficial aquifer yielded a low p-value (less than 0.05), implying a significant difference in nitrate concentrations (table 7) in upgradient and downgradient wells. Results were unexpected, because lateral movement of ground-water flow and nitrate was considered negligible because of the significant difference in nitrate concentrations inside and outside the irrigated tracts. Median nitrate concentration in upgradient wells was 12.4 mg/L, much higher than the median of 2.97 mg/L for downgradient wells. A bias in the data may be causing these anomalous results, because one of the five wells categorized as upgradient in the surficial aquifer (well 54) has been sampled extensively since 1982. Because of this extensive sampling, samples from well 54 represented more than half of the 21 samples from upgradient wells in the surficial aquifer. Well 54 is located inside an irrigated tract and is one of the wells in which nitrate concentrations have exceeded 10 mg/L.
The statistical analysis of samples from wells less than 100 feet deep in the Upper Floridan aquifer, categorized by location upgradient or downgradient, yielded a p-value greater than 0.05. This implies there is no significant difference in nitrate concentrations throughout the area of the sprayfield at this depth in the Upper FJoridan aquifer. This also may imply that downward flow is not as dominant as previously suggested and that lateral movement of ground water at this depth is as important as downward flow.
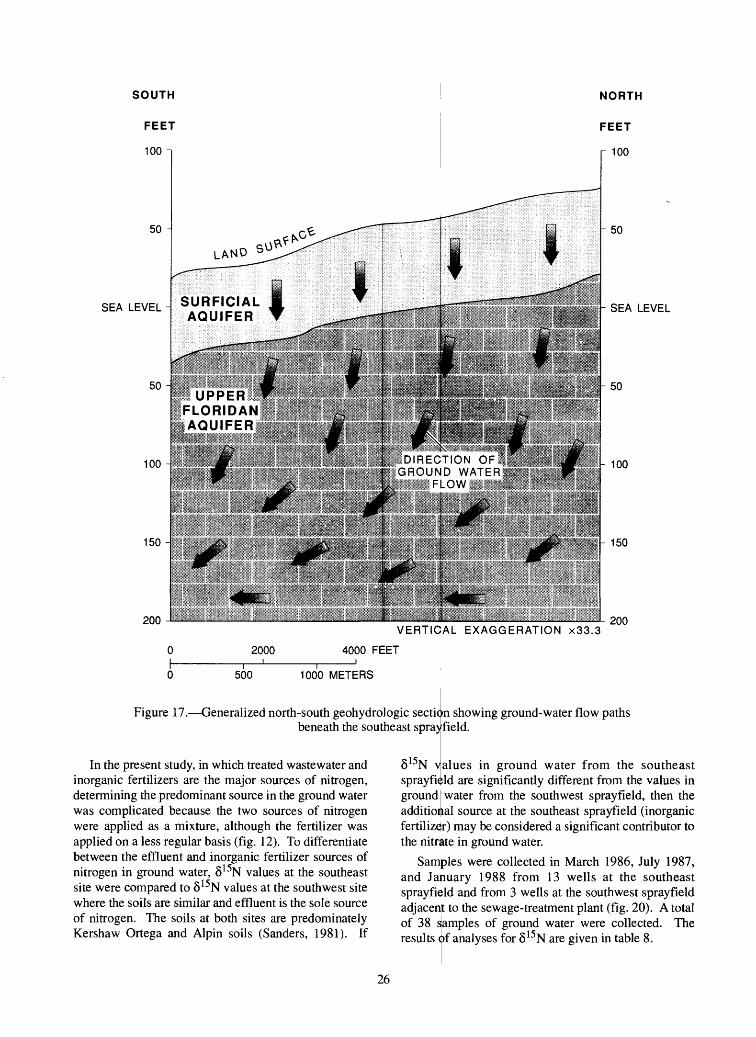
Analysis of samples from wells in the Upper Floridan aquifer categories shows a significant difference in nitrate concentrations (table 7) for upgradient and downgradient wells. The median nitrate concentration for the 45 samples from wells located in the upgradient part of the southeast sprayfield is 0.51 mg/L, compared to 4.28 mg/L nitrate for the 55 samples from wells located in the downgradient locations. This difference in concentrations of nitrate suggests that recharge in the upgradient part of the sprayfield affected water quality in the deeper part of the Upper Floridan aquifer in the southern, downgradient part of the sprayfielc^. The hypothesized ground-water flow paths at the southeast sprayfield are depicted in figure 17.
24
In addition to the statistical analysis of nitrate concentrations, several of the clusters of wells were sampled on the same day in order to observe the differences in nitrate concentrations with depth at sites inside and outside irrigated tracts. Nitrate concentrations as a function of sample depth were plotted for samples from well clusters located inside irrigated tracts (fig. 18). Highest concentrations were in samples from the shallowest well and concentrations decreased with depth. In contrast, nitrate concentrations in samples from well clusters located outside irrigated tracts were lowest in the shallowest wells and increased with depth (fig. 19). These observations are in accord with the ground-water flow paths depicted in figure 17, which indicates that flow through the surficial aquifer is mostly downward, while flow through the Upper Floridan aquifer is more lateral than downward.
DETERMINATION OF SOURCE OF NITROGEN IN GROUND WATER
Nitrogen isotope ratios in soil and ground water have been used by many investigators to determine the sources of nitrogen contamination. Studies using measurements of nitrogen isotope ratios, 8 15N, have been documented in reports by Kreitler (1975), Gormly and Spalding (1979), Spalding and others (1982), and Flipse and Bonner (1985). Kreitler (1975) and Kreitler and others (1978) determined that ranges in 815N values for nitrate in ground water and soil water could be established in areas where the primary sources of nitrogen contamination were known. Three general ranges in nitrogen isotope ratios, 8 15N, were defined for different sources of nitrogen contamination; inorganic fertilizer nitrogen with a range in 8 15N values of -3 to +2 ppt, organic soil nitrogen with a range from +2 to +8 ppt, and nitrogen from animal waste ranging from + 10 to+20 ppt.
The nitrogen isotope ratio in the source of nitrogen cannot be directly compared to the nitrogen isotope ratio of nitrate in the ground water affected by the source due to fractionation of the isotopes by processes occurring after the nitrogen enters the system. Fractionation processes include the combination of physical and chemical reactions that separate the isotopes of an element (Toran, 1982). This fractionation may preferentially remove the lighter isotope of nitrogen ( 14N), leaving the resulting nitrogen compound isotopically heavier than the nitrogen source. Kreitler (1975) concluded that ammonia volatilization or denitrification could leave the residual nitrate in ground water isotopically heavier than its surface source of fertilizer nitrogen.
Flipse and others (1984) demonstrated that there could be some difficulty in determining the difference in ground water between organic soil nitrogen sources and inorganic fertilizer sources of nitrogen due to fractionation. Flipse and Bonner (1985) assessed the difficulty in determining the difference between inorganic fertilizer and animal-waste sources of nitrogen contamination in ground water by nitrogen isotope fractionation studies. Nitrogen isotope ratios in ground water were used to determine if isotopes of nitrogen in inorganic fertilizers became fractionated by processes occurring during transport to ground water such that the ranges of 8 15N values in ground water would overlap with the higher range of 8 15N values from animal waste (+10 to +20 ppt). Nitrogen applied as fertilizer at a farm on Long Island, N.Y., became enriched in 815N from +0.2 ppt at application time to +6.2 ppt in ground water (Flipse and Bonner, 1985); also nitrogen isotope ratios in fertilizer applied at a golf course increased from -5.9 ppt at the time of application to +6.5 ppt in ground water (Flipse and Bonner, 1985). These studies show that there can be an overlap in 815N values in ground water from organic soil nitrogen and inorganic fertilizer nitrogen sources.
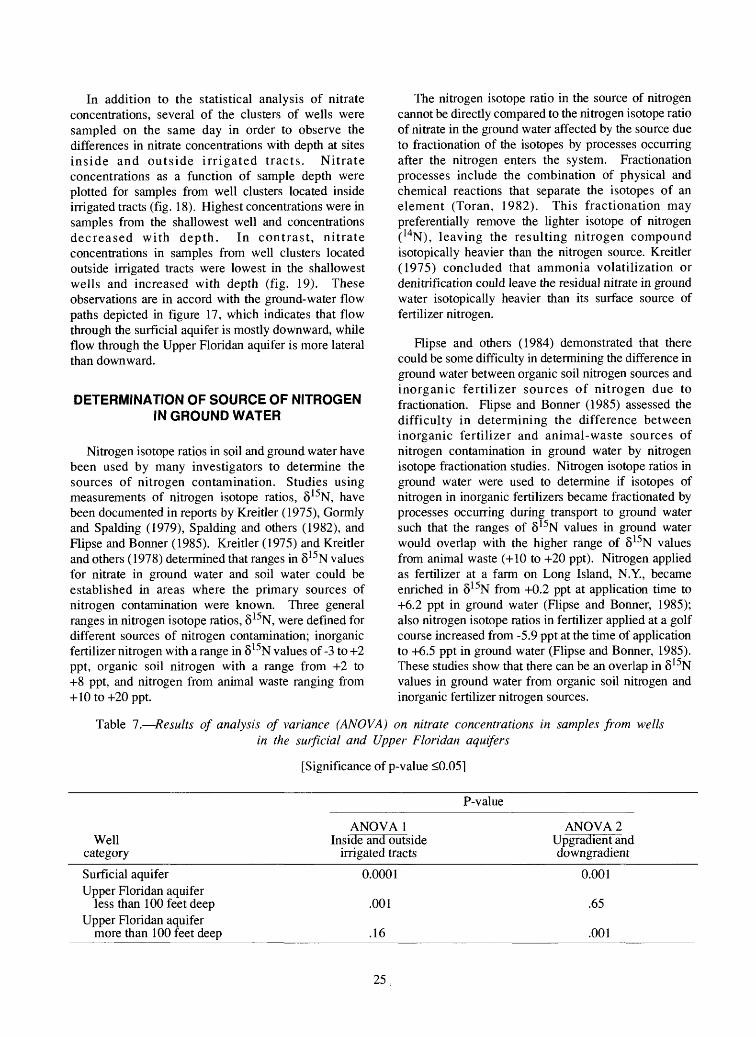
Table 7. Results of analysis of variance (ANOVA) on nitrate concentrations in samples from wellsin the surficial and Upper Floridan aquifers
[Significance of p-value <0.05]
P-value
Well category
ANOVA 1Inside and outside
irrigated tracts
ANOVA 2UJpgradient and downgradient
Surficial aquifer Upper Floridan aquifer
less than 100 feet deep Upper Floridan aquifer
more than 100 feet deep
0.0001
.001
.16
0.001
.65
.001
25,
SOUTH NORTH
SEA LEVEL -
UPPERFLORIDANAQUIFER
- SEA LEVEL
150 -
200VERTICAL EXAGGERATION x33.3
2000 4000 FEET
500 1000 METERS
Figure 17. Generalized north-south geohydrologic secticm showing ground-water flow pathsbeneath the southeast sprayfield.
In the present study, in which treated wastewater and inorganic fertilizers are the major sources of nitrogen, determining the predominant source in the ground water was complicated because the two sources of nitrogen were applied as a mixture, although the fertilizer was applied on a less regular basis (fig. 12). To differentiate between the effluent and inorganic fertilizer sources of nitrogen in ground water, 815N values at the southeast site were compared to 8 15N values at the southwest site where the soils are similar and effluent is the sole source of nitrogen. The soils at both sites are predominately Kershaw Ortega and Alpin soils (Sanders, 1981). If
ground
8 15N values in ground water from the southeast sprayfield are significantly different from the values in
water from the southwest sprayfield, then theadditional source at the southeast sprayfield (inorganic fertilizer) may be considered a significant contributor to the nitrate in ground water.
Samples were collected in March 1986, July 1987, and January 1988 from 13 wells at the southeast sprayfield and from 3 wells at the southwest sprayfield adjacent to the sewage-treatment plant (fig. 20). A total of 38 samples of ground water were collected. The results of analyses for 8 15N are given in table 8.
26

DC O
z
o
zffi8sill O O DC
< DC
25
20
15
10
0
20
15
10
(a)WELL 58
WELL 38
(b) WELL 54
WELL 6 WELL 7 Q
50 100 150 200
SAMPLE DEPTH, IN FEET BELOW LAND SURFACE
250
Figure 18. Nitrate concentrations in ground water as a function of depth for clusters of wells located inside irrigated tracts: (a) wells 58, 39, and 38 sampled February 9,1988, and (b) wells 54, 6, and 7 sampled
March 2,1987.
Nitrate concentrations in samples were plotted as a function of 815N values to determine if any correlation exists between these two values. Samples from the southwest sprayfield generally had higher 8 15N values, although nitrate concentrations at the southeast sprayfields had a greater range than those at the southwest sprayfield (fig. 21), but no linear correlation was noted between nitrate concentrations and 8 15N values.
Samples collected from the southeast sprayfield had a slightly larger range in 8 15N values than samples collected at the southwest sprayfield. The range in 8 15N values for ground-water samples collected at the southeast sprayfield was +5.4 to +12.2 ppt. According to the ranges described by Kreitler (1975) and Kreitler and others (1978), this corresponds to the categories where soil organic nitrogen and animal wastes are the
expected sources of nitrogen. If soil organic nitrogen contributed to the nitrogen isotope ratio, it would be expected to have the same influence at both sites. Samples collected at the southwest sprayfield had a range in 8 15N values from +8.9 to +16.7 ppt, which is a higher range of values than that for samples from the southeast sprayfield, and close to the range of +10 to +20 ppt expected for ground water with nitrogen from animal waste as a predominant source of nitrogen (Kreitler and others, 1978).
The 8 15N values for the two sites were plotted as a function of frequency to examine the range and distribution of 8 15N values (fig. 22). Only three samples from the southeast sprayfield overlapped with the range of values for samples from the southwest sprayfield, implying that there is a difference in the sources of nitrogen at these two sites.
27
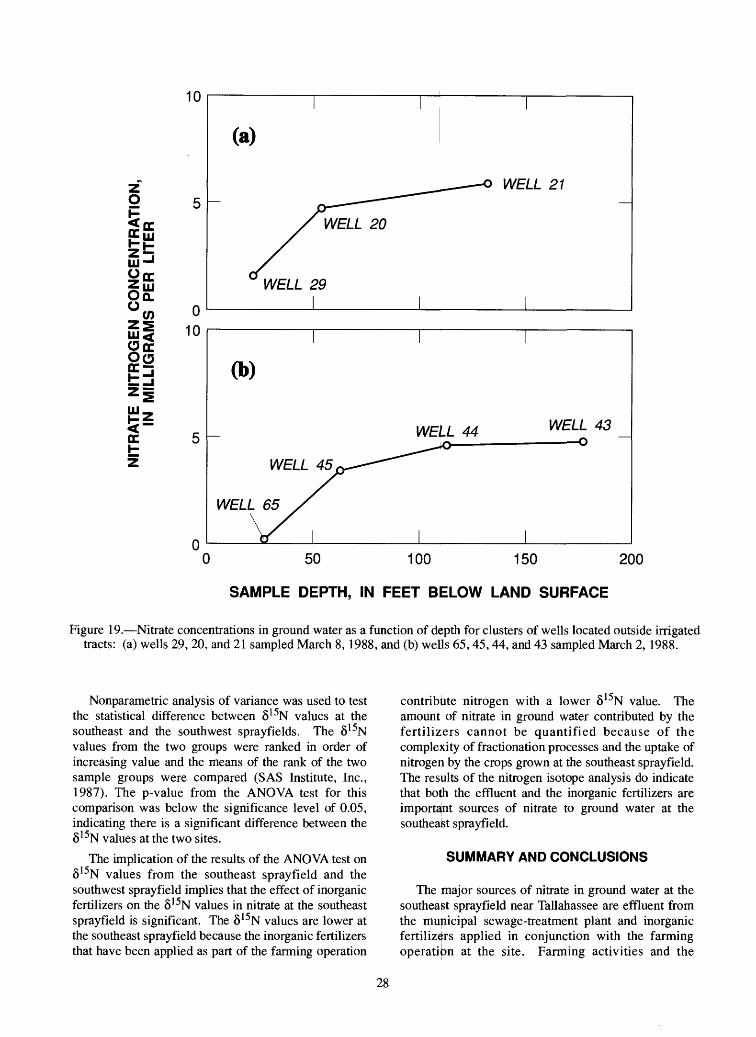
10
010
(a)
WELL 21
WELL 20
WELL 29
ODEO(3
ocz
0
(b)
WELL 44 WELL 43 o
WELL 45 ,
WE/./. 65
0 50 100 150 200
SAMPLE DEPTH, IN FEET BELOW LAND SURFACE
Figure 19. Nitrate concentrations in ground water as a function of depth for clusters of wells located outside irrigated tracts: (a) wells 29, 20, and 21 sampled March 8, 1988, and (b) wells 65,45,44, and 43 sampled March 2, 1988.
Nonparametric analysis of variance was used to test the statistical difference between 815N values at the southeast and the southwest sprayfields. The 815N values from the two groups were ranked in order of increasing value and the means of the rank of the two sample groups were compared (SAS Institute, Inc., 1987). The p-value from the ANOVA test for this comparison was below the significance level of 0.05, indicating there is a significant difference between the 8 15N values at the two sites.
The implication of the results of the ANOVA test on 8 15N values from the southeast sprayfield and the southwest sprayfield implies that the effect of inorganic fertilizers on the 8 15N values in nitrate at the southeast sprayfield is significant. The 8 15N values are lower at the southeast sprayfield because the inorganic fertilizers that have been applied as part of the farming operation
contribute nitrogen with a lower 8 15N value. The amount of nitrate in ground water contributed by the fertilizers cannot be quantified because of the complexity of fractionation processes and the uptake of nitrogen by the crops grown at the southeast sprayfield. The results of the nitrogen isotope analysis do indicate that both the effluent and the inorganic fertilizers are important sources of nitrate to ground water at the southeast sprayfield.
SUMMARY AND CONCLUSIONS
The major sources of nitrate in ground water at the southeast sprayfield near Tallahassee are effluent from the municipal sewage-treatment plant and inorganic fertilizers applied in conjunction with the farming operation at the site. Farming activities and the
28
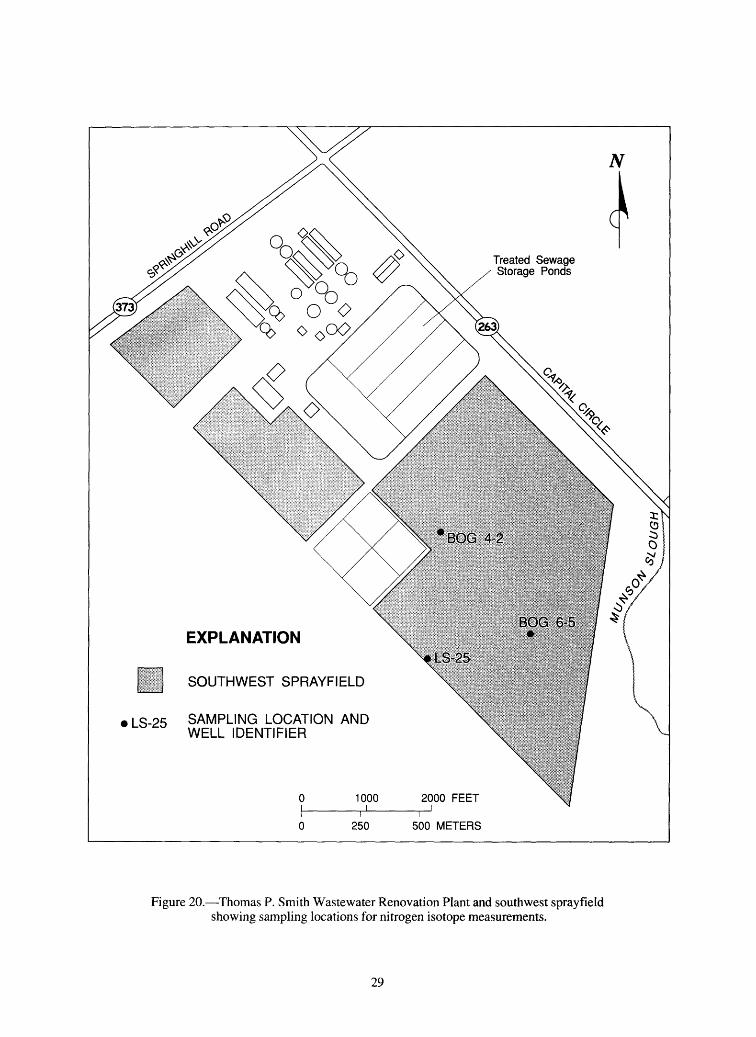
Treated Sewage Storage Ponds
EXPLANATION
SOUTHWEST SPRAYFIELD
LS-25 SAMPLING LOCATION AND WELL IDENTIFIER
1000 2000 FEET
250 500 METERS
Figure 20. Thomas P. Smith Wastewater Renovation Plant and southwest sprayfield showing sampling locations for nitrogen isotope measurements.
29

Table 8. Results of nitrogen isotope ratio analyses ofthe southeast and southwest
nitrate in ground-water samples from spray fields
[Nitrogen isotope ratio, 815N, reported in parts p^r thousand (ppt) relative to ___________standard of atmospheric nitrogenj , no data]________
Nitrogen igotope ratio. 6 15NWell January July March
identifier____________1988_________1987________1986
Southeast sprayfield
SE-9split sample
SE-10split sample
SE-12SE-22
split sampleSE-39SE-42SE-54SE-56SE-57SE-58SE-59SE-61
split sampleSE-64
split sample
10.9 ppt 5.9 ppt 9.2 ppt 6.5 9.412.4 6.7 7.4 10.0
6.47.58.25.97.6
12.27.16.07.26.86.87.47.97.6
5.4 6.5
6.5 5.8 7.0 6.6
6.8
LS-25split sample
BOG 6-5split sample
BOG 4-2
Southwest sprayfield
11.010.69.9
12.6
8.9
10.09.6
16.7
12.9
application of effluent at the sprayfield began in November 1980. An undetermined amount of nitrogen from each source has been utilized by crops over the years; however, nitrate concentrations in excess of 10 mg/L, the maximum contaminant level established by the State, were detected in samples from eight wells in the underlying surficial aquifer and the Upper Floridan aquifer. Concentrations of nitrate in samples from monitoring wells located outside the boundaries of the sprayfield in the downgradient direction were less than the maximum contaminant level.
The hydrogeology of the two aquifers at the southeast sprayfield controls the migration of nitrate in ground water. The surficial aquifer is predominantly sand that includes numerous clay lenses. The clay lenses are not continuous but may retard flow (recharge) through the aquifer. The Upper Floridan aquifer is a sequence of carbonate rocks in which sinkholes and extensive solution cavities have formed. Cavities and conduits within the Upper Floridan aquifer system form
highly permeable zones that can rapidly transport large volumes of ground water through some zones of this aquifer.
The chemistry of water in the unsaturated zone indicates that reduced species of nitrogen are converted to nitrate and that phosphorus is removed from solution before these constituents of the sewage treatment-plant effluent reach the water table. The unsaturated zone at the southeast sprayfield is approximately 15 to 35 feet thick. Water samples from the unsaturated zone were collecte^i in lysimeters from December 1987 through March 1988. Nitrate concentrations were higher in the unsaturated zone than in the effluent, whereas total Kjeldahl nitrogen and phosphorus concentrations were lower in the unsaturated zone than in effluent.
The pattern of nitrate enrichment in ground water is variable and is related to the flow systems of the two aquifers, as well as proximity of the sampling points to the irrigation and fertilizer source. In areas directly
30

15
10
O SOUTHEAST SPRAYFIELD
SOUTHWEST SPRAYFIELD
o o
o o
O
5 6 7 8 9 10 11 12 13 14 15 16 17
NITROGEN ISOTOPE RATIO (0/00)
Figure 21. Nitrogen isotope ratio, 815N, as a function of nitrate concentration in ground-water samples from the southeast and southwest sprayfields.
beneath farmed and irrigated tracts, samples from wells in the surficial aquifer and wells less than 100 feet deep in the Upper Floridan aquifer had the highest nitrate concentrations, whereas samples collected from wells not directly beneath irrigated tracts had statistically significant lower nitrate concentrations. Also, samples from wells in the Upper Floridan aquifer greater than 100 feet deep, located in the southern, downgradient part of the sprayfield, had higher nitrate concentrations than samples from wells of similar depth located in the northern, upgradient part.
The distribution of nitrate in ground water indicates the predominance of a downward direction of water flow in the unsaturated zone, the surficial aquifer, and the Upper Floridan aquifer to depths less than 100 feet. But, a lateral component of ground-water flow probably dominates in the Upper Floridan aquifer at depths greater than 100 feet, based on the distribution of nitrate in this part of the aquifer.
Analysis of the nitrogen isotope ratio, 815N, of nitrate in ground water was used to determine the relative amounts of nitrate in ground water contributed by effluent and by fertilizers at the southeast sprayfield. A statistical comparison was made between the 815N values of nitrate in ground water at the southeast sprayfield and those at the southwest sprayfield where no inorganic fertilizers have been applied. Results showed that the nitrogen isotope ratios at the two sites were significantly different from one another. This indicated that the addition of the inorganic fertilizers has contributed a significant amount of isotopically light
nitrogen to the nitrate found in ground water at the southeast sprayfield. The amount of nitrate in ground water contributed by fertilizers at the southeast sprayfield cannot be quantified because of the complexity of processes that affect the nitrogen isotope ratios and the unknown amounts of nitrogen from the two sources that are utilized by crops.
SOUTHEAST SPRAYFIELD
SOUTHWEST SPRAYFIELD
5.4-7.0 7.1-9.0 9.1-11.0 11.1-13.0 13.1-16.6
NITROGEN ISOTOPE RATIO (0/00)
Figure 22. Nitrogen isotope ratio, 8 15N, in ground- water samples from the southeast and southwest sprayfields.
REFERENCES
American Public Health Association, 1985, Standard methods for the examination of water and wastewater (16th ed.): Washington, American Public Health Association, American Water Works Association, and Water Pollution Control Federation, 1268 p.
Carlson, Christine, 1976, Land application of wastewater: A new look at an old idea: Washington, League of Women Voters, Current Focus, Publication no. 378, 8 p.
Crites, R.W., Esmay, J., Griffes, D., Olson, J., Powers, J., Shedden, R., Smith, R., and Uiga, A., 1977, Process design manual for land treatment of municipal wastewater: U.S. Environmental Protection Agency, EPA 625/1-77-008, p. 1-3.
31

Elder, J.F., Hunn, J.D., and Calhoun, C.W., 1985, Wastewater application by spray irrigation on a field southeast of Tallahassee, Florida: Effects on ground-water quality and quantity, 1980-82: U.S. Geological Survey Water-Resources Investigations Report 85-4006,41 p.
Fishman, M.J., and Friedman, L.C., eds., 1985, Methods for the determination of inorganic substances in water and fluvial sediments: U.S.Geological Survey Techniques of Water-Resources Investiga tions, book 5, chap. Al, Open-File Report 85-495, 709 p.
Flipse, W.J., and Bonner, F.T., 1985, Nitrogen-isotope ratios of nitrate in ground water under fertilized fields, Long Island, New York: Ground Water, v.23,no. 1, p. 59-67.
Flipse, W.J., Katz, E.G., Lindner, I.E., and Markel, Richard, 1984, Sources of nitrate in ground water in a sewered housing development, central Long Island, New York: Ground Water, v. 22, no. 4, p. 418-426.
Florida Department of Environmental Regulation, 1983, Land application of domestic wastewater effluent in Florida, final rule, effective date January 1984: Division of Environmental Programs, Bureau of Wastewater Management and Grants, 46 p.
1985, Public drinking water systems: Chapter 17-22, in Florida Administrative Code.
Gormly, J.R., and Spalding, R.F., 1979, Sources and concentrations of nitrate-nitrogen in ground water of the Central Platte Region, Nebraska: Ground Water, v. 17, no. 3, p. 291-301.
Hem, J.D., 1985, Study and interpretation of the chemical characteristics of natural water: U.S. Geological Survey Water-Supply Paper 2254, 263 p.
Hendry, C.W., Jr., and Sproul, C.R., 1966, Geology and ground-water resources of Leon County, Florida: Florida Division of Geology Bulletin 47, 178 p.
Hirsch, R.M., Slack, J.R., and Smith, R.A., 1982, Techniques of trend analysis for monthly water quality data: Water Resources Research, v. 18, p. 107-121.
Junk, G., and Svec, H.J., 1958, The absolute abundance of the nitrogen isotopes in the atmosphere and compressed gas from various sources: Geochimica et Cosmochimica Acta, v. 14, p. 234-243.
Kreitler, C.W., 1975, Determining the source of nitrate in ground water by nitrogen isotope studies: Bureau of Economic Geology, University of Texas at Austin, Report of Investigations, no. 83, 57 p.
Kreitler, C.W., Ragone, S.E., and Katz, E.G., 1978, 15N/ 14N ratios of ground-water nitrate, Long Island, New York: Ground Water, v. 16, no. 6., p. 404-409.
Martin, J.B., Jr., Ruffin, B.C., Donald, J.O., and Behrends, L.L., 1985, Applications of new technologies to livestock waste management, in Perspectives on nonpoint source pollution: U.S. Environmental Protection Agency, Office of Water Regulations and Standards, EPA 440/5-85-001, p. 218-220.
Miller, J.A., 1982, Thickness of the Tertiary limestone aquifer system, southeastern United States: U.S. Geological Survey Open-File Report 81-124, 1 sheet.
Nier, A.D., 1955, Determination of isotopic masses and abundances by mass spectrometry: Science, v. 121, p. 737-744.
Overman, A.R., 1979, Wastewater irrigation at Tallahassee, Florida: U.S. Environmental Protection Agency, EPA 600/2-79-151, 319 p.
Pruitt, IB., Elder, J.A., Johnson, I.K., 1988, Effects of treated municipal effluent irrigation on ground water beneath sprayfields, Tallahassee, Florida: U.S. Geological Survey Water-Resources Investigations 88-4092, 35 p.
PStat, Inc., 1986, PStat user's manual, Version 8: Boston, Duxbury Press, 852 p.
Rosenau, J.C., and Meadows, P.E., 1986, Potentiometric surface of the Floridan aquifer system in the Northwest Florida Water Management District, May 1985: U.S. Geological Survey Water-Resources Investigations Report 86-4183, 1 sheet.
Sanders, T.E., 1981, Soil survey of Leon County, Florida: Washington, D.C., U.S. Department of Agriculture Soil Conservation Service and Forest Service, 151 p.
SAS Institute, Inc., 1987, SAS/STAT guide for personal computers, Version 6 edition: Gary, N.C., SAS Institute Inc., 1028 p.
Schmidt, Walter, 1979, Environmental geology series, Ta llahassee sheet: Florida Bureau of Geology Map Series 90, 1 sheet.
Sheaffer, J.R., 1979, Land application of waste Important alternative: Ground Water, v. 17, no. 1, p. 62-68.
Slack, L.J., 1975, Hydrologic environmental effects of sprayed sewage effluent, Tallahassee, Florida: U.S. Geological Survey Water-Resources Investigations Report 55-75,73 p.
32

Smith, R.A., Alexander, R.B., and Wolman, M.G., 1987, Analysis and interpretation of water-quality trends in major U.S. rivers, 1974-81: U.S. Geologi cal Survey Water-Supply Paper 2307,25 p.
Spalding, R.F., Exner, M.E., Lindau, C.W., and Eaton, D.W., 1982, Investigation of sources of groundwater nitrate contamination in the Burbank- Wallula area of Washington, USA: Journal of Hydrology, v. 58, p. 307-324.
Toran, Laura, 1982, Isotopes in ground-water investigations: Ground Water, v. 20, no. 6, p. 740-745.
U.S. Environmental Protection Agency, 1977, The report to Congress, waste disposal practices and their effects on ground water: U.S. Environmental
Protection Agency, Office of Water Supply and Office of Solid Waste Management Programs, 512 p.
Yurewicz, M.C., 1983, Hydrologic data from an area southwest of Tallahassee, Florida, where municipal waste water effluent is applied by spray irrigation: U.S. Geological Survey Open-File Report 83-769, 153 p.
Yurewicz, M.C., and Rosenau, J.C., 1986, Effects on ground water of spray irrigation using treated municipal sewage southwest of Tallahassee, Florida: U.S. Geological Survey Water-Resources Investigations Report 86-4109, 52 p.
33 *U.S. GOVERNMENT PRINTING OFFICE:! 990 -731-097/00020