SOURCES, AIRBORNE CONCENTRATIONS, AND HUMAN EXPOSURE … · SOURCES, AIRBORNE CONCENTRATIONS, AND...
33
1 AIR TOXICS IN ALLEGHENY COUNTY: SOURCES, AIRBORNE CONCENTRATIONS, AND HUMAN EXPOSURE CMU: Jennifer Logue, Kara Huff-Hartz, Andrew Lambe, Allen Robinson, Neil Donahue, Mitch Small, Cliff Davidson ACHD: Roger Westman, Darrel Stern, Jason Maranche Pitt: Bernie Goldstein
Transcript of SOURCES, AIRBORNE CONCENTRATIONS, AND HUMAN EXPOSURE … · SOURCES, AIRBORNE CONCENTRATIONS, AND...

1
AIR TOXICS IN ALLEGHENY COUNTY:SOURCES, AIRBORNE CONCENTRATIONS, AND HUMAN EXPOSURE
CMU: Jennifer Logue, Kara Huff-Hartz, Andrew Lambe, Allen Robinson, Neil Donahue, Mitch Small, Cliff DavidsonACHD: Roger Westman, Darrel Stern, Jason MaranchePitt: Bernie Goldstein
2
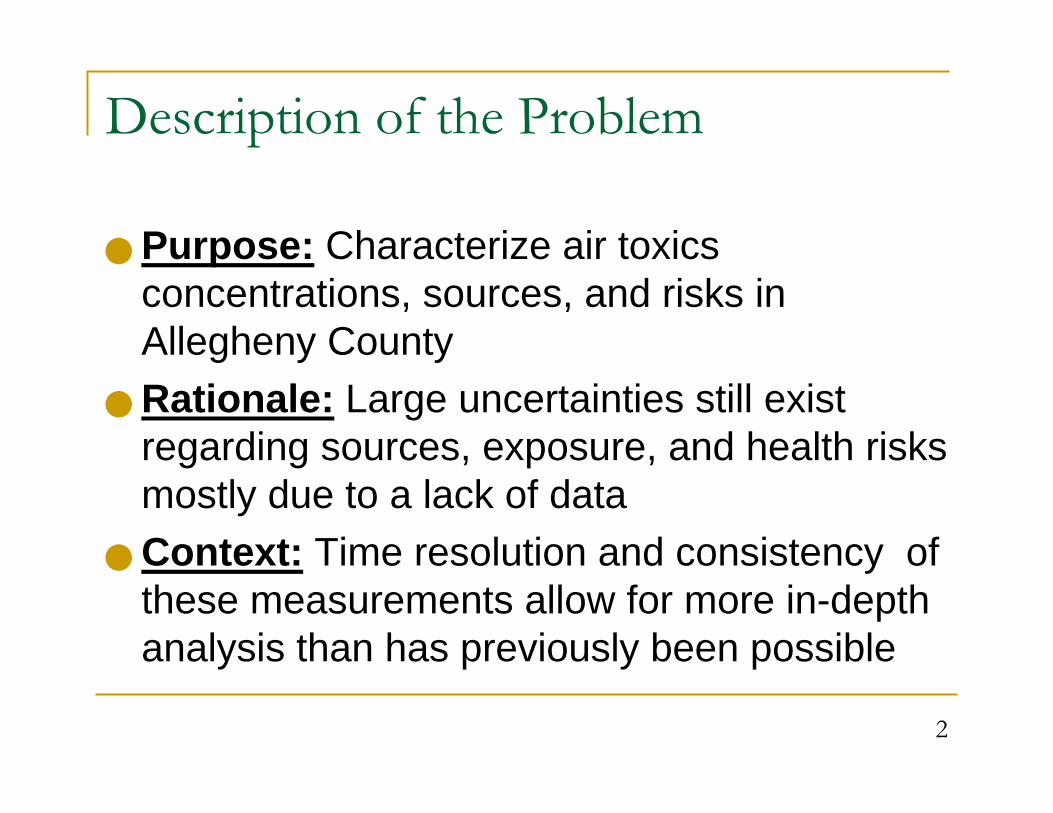
Description of the Problem
Purpose: Characterize air toxics concentrations, sources, and risks in Allegheny CountyRationale: Large uncertainties still exist regarding sources, exposure, and health risks mostly due to a lack of dataContext: Time resolution and consistency of these measurements allow for more in-depth analysis than has previously been possible
3
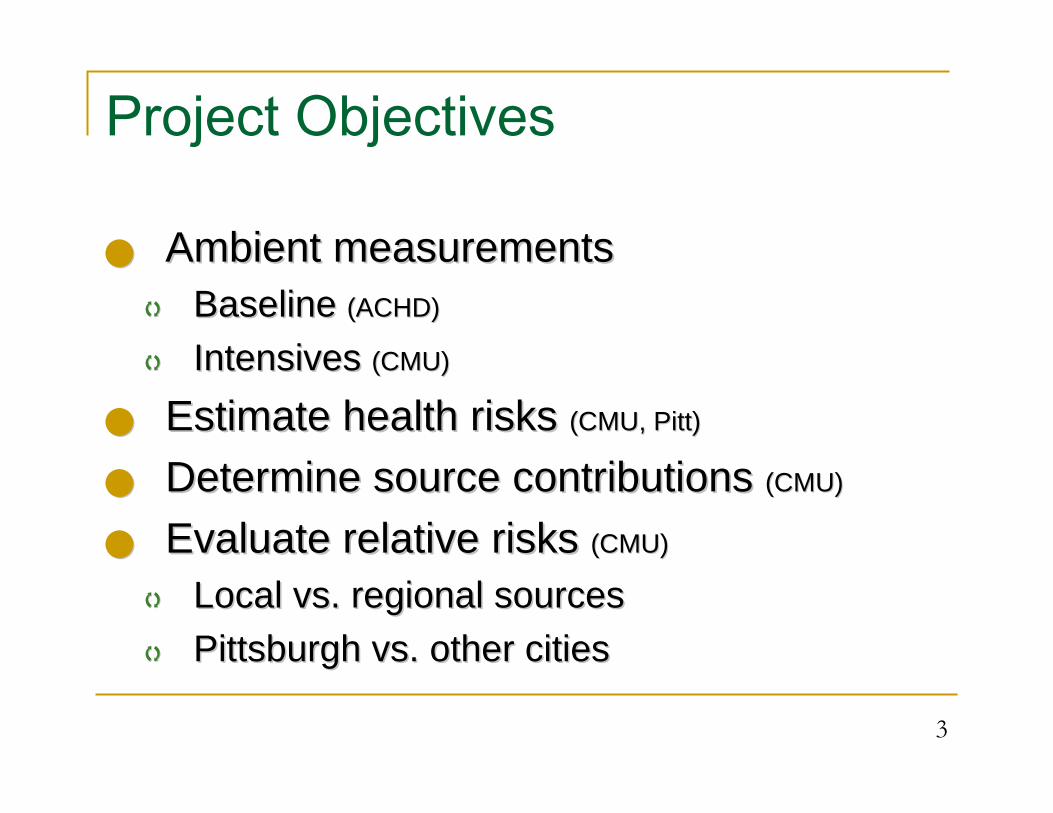
Project Objectives
Ambient measurementsAmbient measurementsBaseline Baseline (ACHD)(ACHD)
Intensives Intensives (CMU)(CMU)
Estimate health risks Estimate health risks (CMU, Pitt)(CMU, Pitt)
Determine source contributions Determine source contributions (CMU)(CMU)
Evaluate relative risks Evaluate relative risks (CMU)(CMU)
Local vs. regional sources Local vs. regional sources Pittsburgh vs. other citiesPittsburgh vs. other cities
4
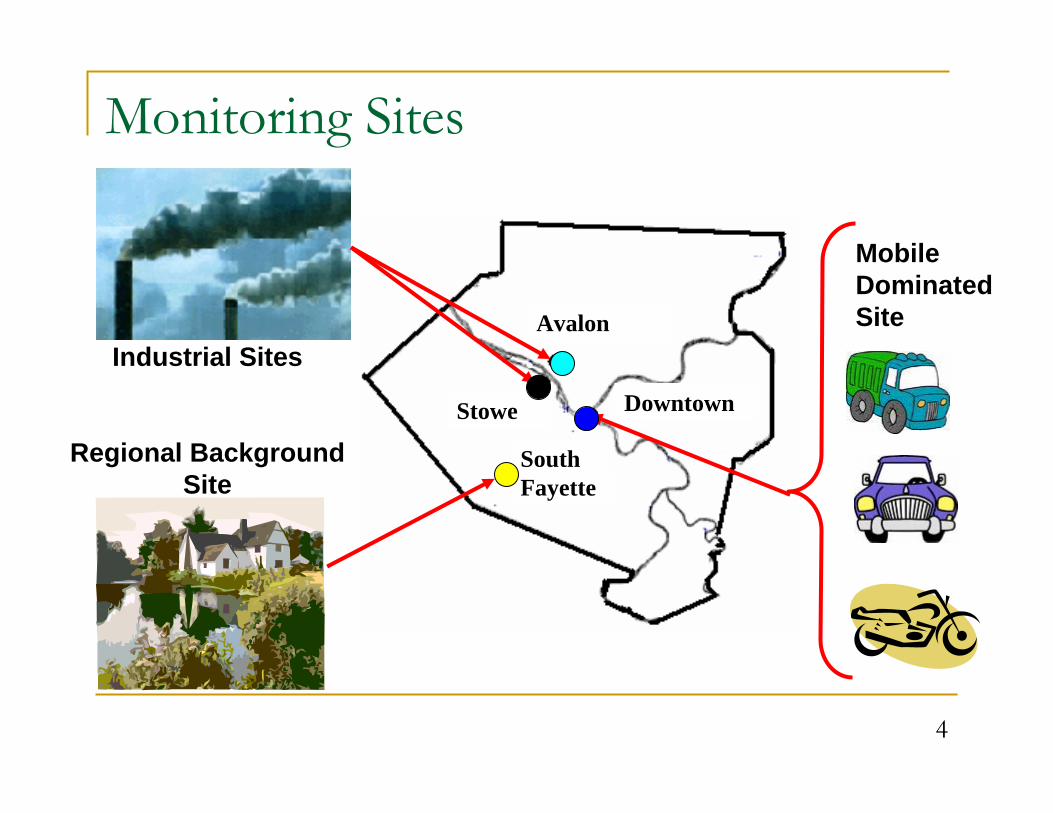
Monitoring Sites
Industrial Sites
Regional Background Site
Downtown
Mobile Dominated Site
Stowe
Avalon
South Fayette

5
Design and Implementation of Project
Two types of measurementsBaseline
4-sites24hr average concentrationsMeasured 1:6 for a yearCanisters (TO-15 standard)Cartridges (TO-11a standard)
Intensives3-sitesHourly measurements for 1 to 2 monthsGas and particle phase measurements

6
Automated Field InstrumentGas Chromatograph Mass Spectrometer/ Flame Ionization Detector (GCMS/FID)
(Millet JGR, 2005)
1 hour resolution
70+ compounds
Low detection limit(<.2μg/m3)

7
Compounds MeasuredToluene Chrysene Chloromethane2-Butanone (MEK) Benzo[ a]anthracene QuinolineMethyl alcohol Fluorene Benzo[k]fluorantheneStyrene Tetrachloroethene 1,1,2-TrichloroethaneBenzene Acenaphthene Chlorobenzene4-Methyl-2-pentanone (MIBK) Anthracene cyclohexaneNaphthalene o-Xylene 1-PropanolEthylbenzene Chloroform ChloroethaneCarbon disulfide p-Xylene AcrylonitrileMethyl-t-butyl either(mtbe) Vinyl chloride 1,2-Dichloroethane1,2,4-Trimethylbenzene Heptane 1,1-DichloroethaneIsopropylbenzene Ethyl acetate 1,1,1-TrichloroethaneEthylene oxide Trichloroethene Benzo[ b]fluoranthenePhenanthrene 1,1,2,2-Tetrachloroethane BromochloromethaneMethylene chloride Vinyl acetate PyridineMethyl methacrylate 1,4-Dioxane n-PropylbenzeneBromomethane Acrolein (Propenal) 1,2-DichlorobenzeneFluoranthene Acenaphthylene BromoformPyrene Benzyl chloridem-Xylene 1,4-Dichlorobenzene
*Simultaneous measurements of local meteorology and criteria pollutants

8
Measurement Inter-comparison
Toluene
Slope= 1.6
0
2
4
6
8
10
12
0 2 4 6 8 10 12
Hourly Measurments (microg/m3)
Can
iste
r Mea
sure
men
ts
(mic
rog/
m3)
Benzene
Slope=1.394
0
1
2
3
4
5
6
0 1 2 3 4 5 6
Hourly Measurments (microg/m3)
Can
iste
r Mea
sure
men
ts
(mic
rog/
m3)
Averaged Hourly Averaged Hourly
Slope= 1.6Slope= 1.4
Can
iste
r
Can
iste
r
Toluene Benzene
9
0
1
2
3
4
5
6
Styren
e
Tetrac
hloroeth
ylene
o-Xyle
nem &
p- Xyle
ne
1,3-di
chloro
benze
ne
1,2,4-
Trimeth
ylben
zene
Ethyl Ace
tate
1-Ethyl-
4-Meth
ylben
zene
1,3-B
utadien
eEthylb
enze
ne
1,3,5-
Trimeth
ylben
zene
1,4-D
ichlor
oben
zene
Benze
ne
Rat
io w
ith R
egio
nal B
ackg
roun
d
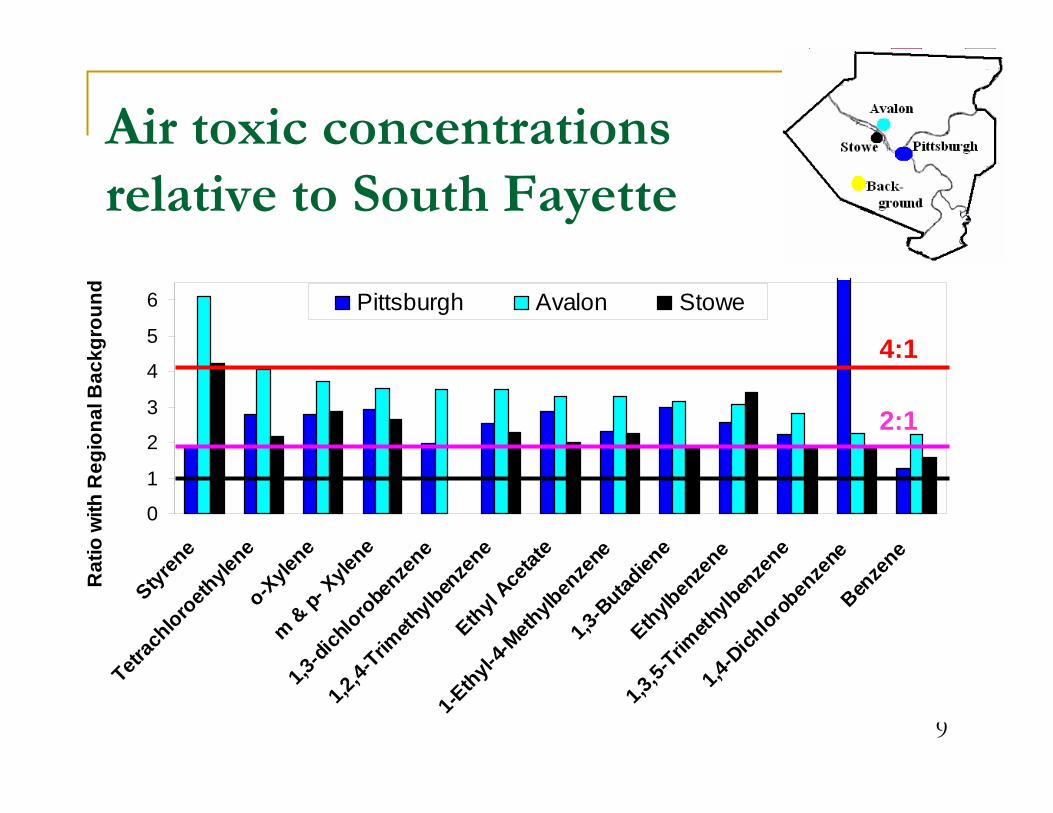
Pittsburgh Avalon Stowe
Air toxic concentrations relative to South Fayette
4:1
2:1
10
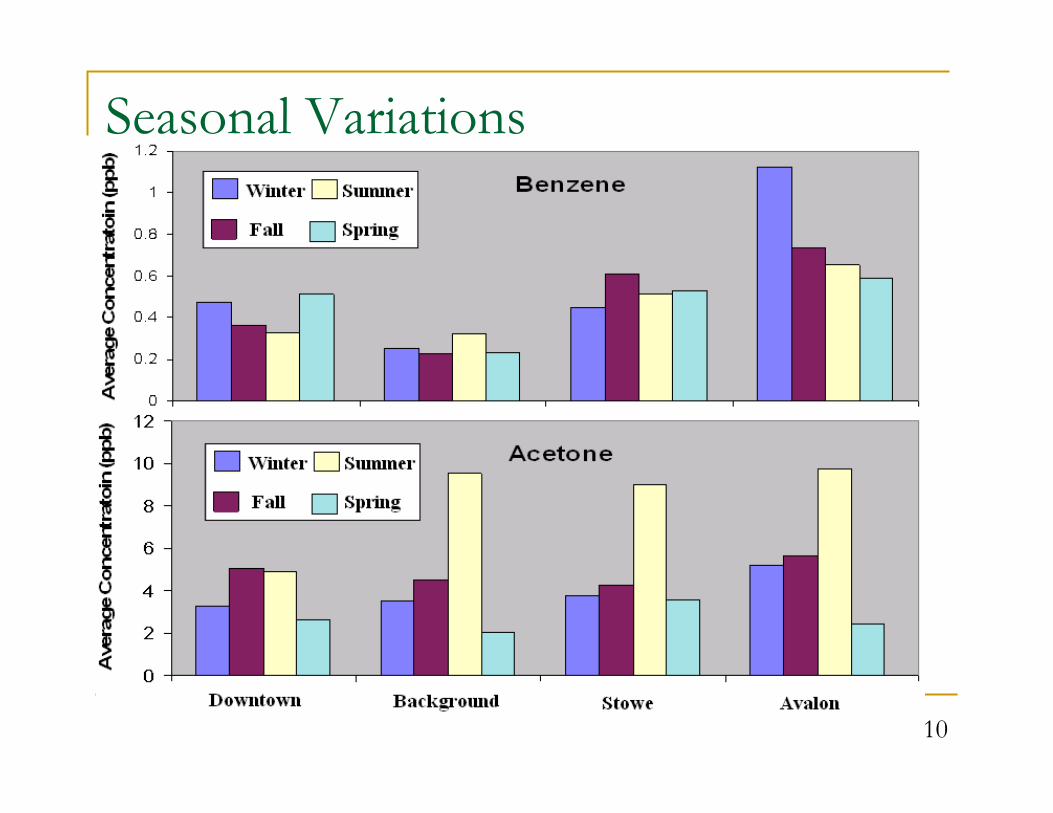
Seasonal Variations
11
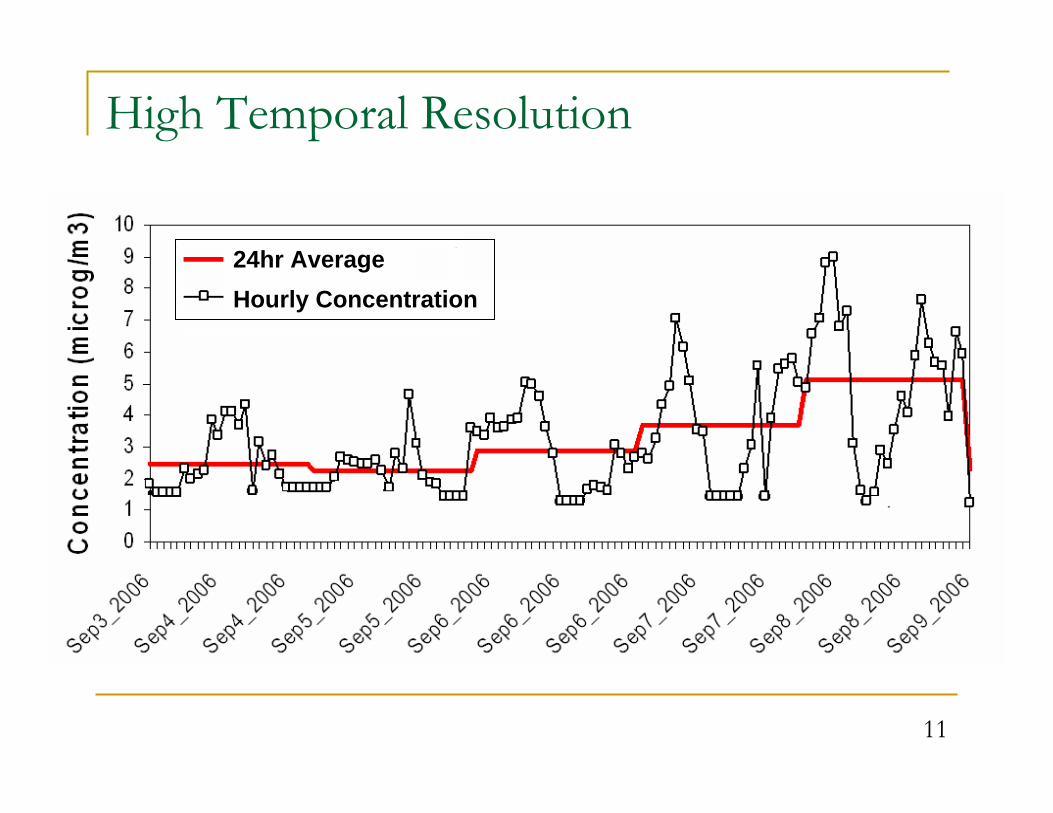
High Temporal Resolution
24hr AverageHourly Concentration
12
0.0
0.3
0.5
0.8
1.0
Styrene
Toluene
Benzene
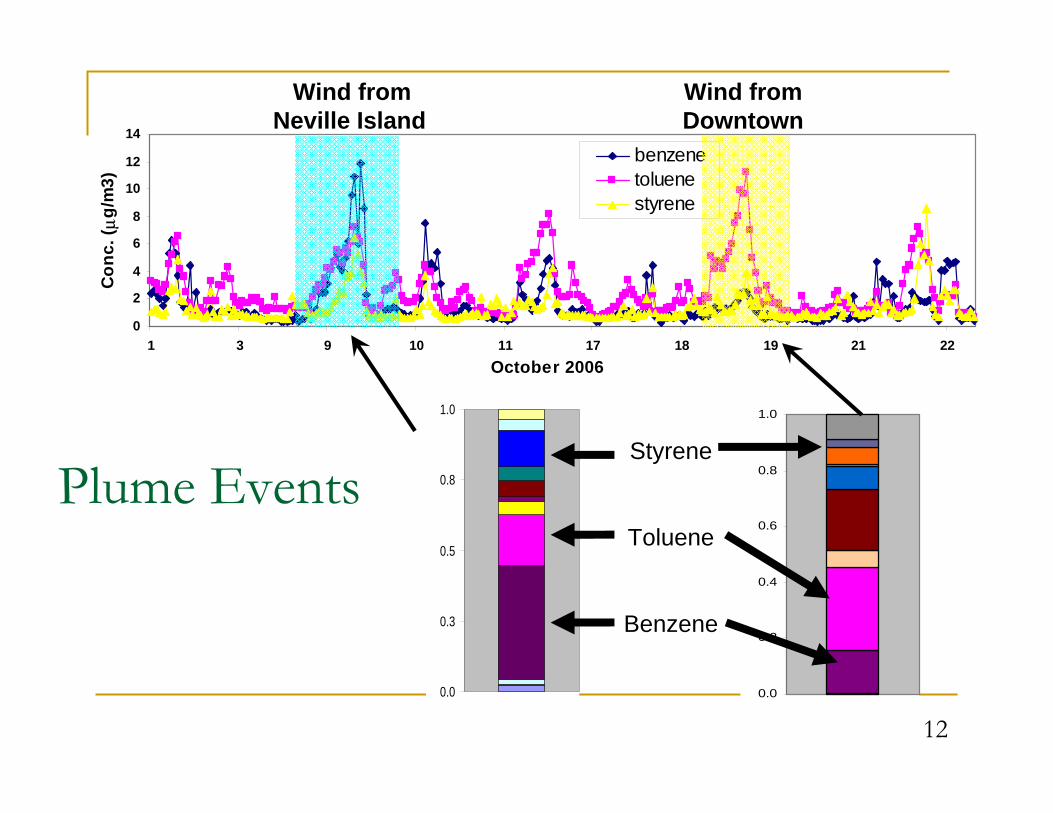
Plume Events
0.0
0.2
0.4
0.6
0.8
1.0
0
2
4
6
8
10
12
14
1 3 9 10 11 17 18 19 21 22October 2006
Con
c. ( μ
g/m
3)
benzenetoluenestyrene
Wind from Wind from Neville Island Downtown
13
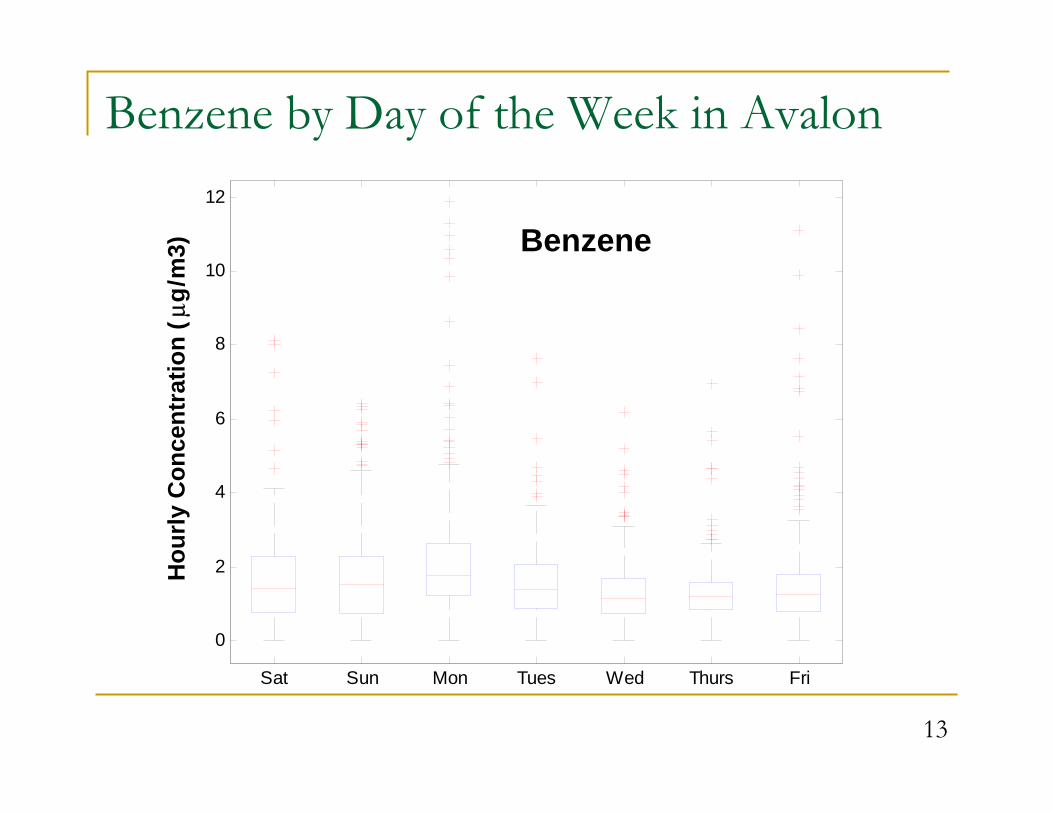
Benzene by Day of the Week in Avalon
Sat Sun Mon Tues Wed Thurs Fri
0
2
4
6
8
10
12C
once
ntra
tion
(mic
rogr
ams/
m3)Benzene
Benzene
Hou
rly C
once
ntra
tion
(μg/
m3)

14
Average Diurnal Patterns at Avalonbenzene
1
1.2
1.4
1.6
1.8
2
2.2
2.4
2.6
2.8
02:0
04:0
06:0
08:0
010
:0012
:0014
:0016
:0018
:0020
:0022
:00
Military Time
Con
cent
ratio
n(m
icro
g/m
3)
toluene
1
1.5
2
2.5
3
3.5
4
02:0
04:0
06:0
08:0
010
:0012
:0014
:0016
:0018
:0020
:0022
:00
Military Time
Con
cent
ratio
n(m
icro
g/m
3)
cyclohexane
0
0.05
0.1
0.15
0.2
0.25
02:0
04:0
06:0
08:0
010
:0012
:0014
:0016
:0018
:0020
:0022
:00
Military Time
Con
cent
ratio
n(m
icro
g/m
3)
styrene0.8
1
1.2
1.4
1.6
1.8
02:0
04:0
06:0
08:0
010
:0012
:0014
:0016
:0018
:0020
:0022
:00
Military Time
Con
cent
ratio
n(m
icro
g/m
3)
Con
cent
ratio
ns (μ
g/m
3)
Con
cent
ratio
ns (μ
g/m
3)
Time of day Time of day6am 12pm 6pm 6am 12pm 6pm

15
Estimating Lifetime Cancer Risk
BWIRfC
LADD apercentileth **,95=
SFLADDLIR *=
Lifetime Averaged Daily Dose:
Lifetime Individual Cancer Risk:
SF=Slope Factor
Linear No-Threshold Model:

16
Air Toxics Cancer Risks
0.E+00 5.E-06 1.E-05 2.E-05 2.E-05
Benzene
Carbon Tetrachloride
Trichloroethene
Butadiene, 1,3-
Chloroform
Tetrachloroethene
Dichlorobenzene,1,4-
Dichloroethane,1,2-
Hexachlorobutadiene
Methylene Chloride
Bromodichloromethane
Dichloropropane,1,2-
Lifetime Cancer Risk
StoweDowntownAvalonBackground
Risk=10-6
0E00 5E-6 1E-5 1.5E-05 2E-5

17
Non-Cancer Health Risks
ChronicAnnual 95th percentile canister data
Intermediate and AcuteMaximum hourly concentration at Avalon: 14 days to 1 year
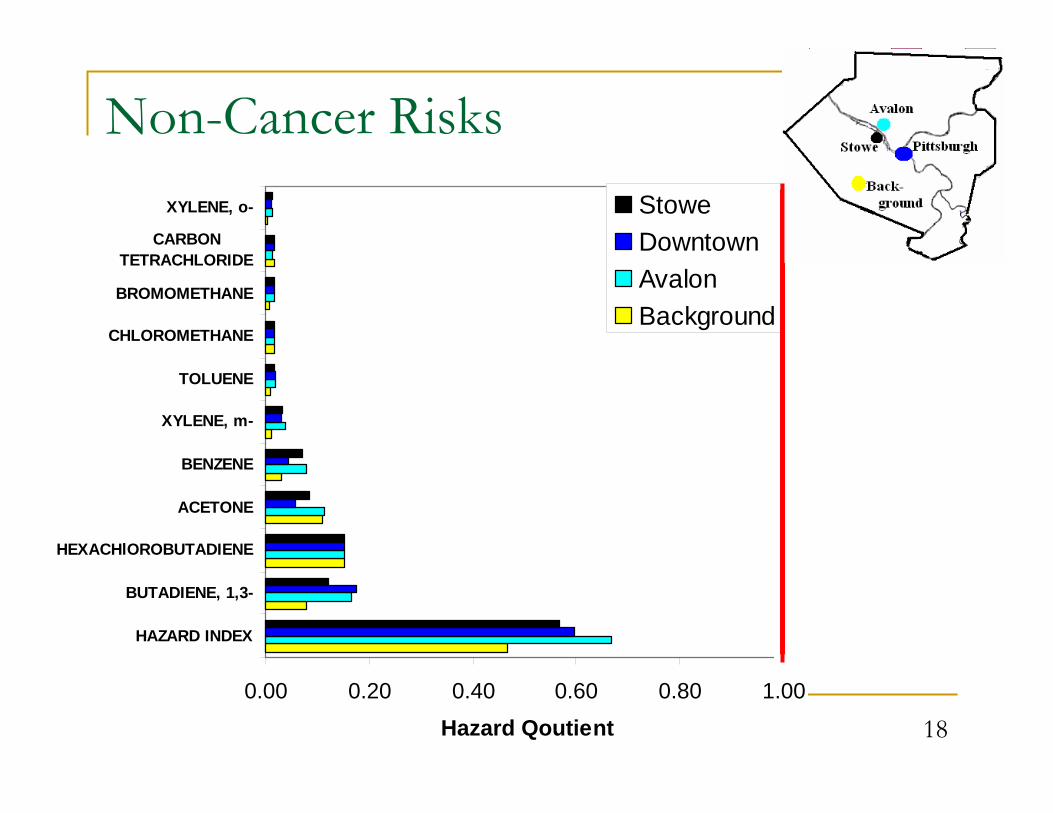
RfCionConcentratHQ =
HQ=Hazard Quotient RfC = Reference Concentration
18
Non-Cancer Risks
0.00 0.20 0.40 0.60 0.80 1.00
HAZARD INDEX
BUTADIENE, 1,3-
HEXACHlOROBUTADIENE
ACETONE
BENZENE
XYLENE, m-
TOLUENE
CHLOROMETHANE
BROMOMETHANE
CARBONTETRACHLORIDE
XYLENE, o-
Hazard Qoutient
StoweDowntownAvalonBackground

19
Comparison of Aggregate Air Toxics Risks
0.0E+00 5.0E-05 1.0E-04 1.5E-04 2.0E-04
PAHs Risk
HAP Risk (South Fayette)
HAP Risk (Stowe)
Metals Risk
HAP Risk (Avalon)
HAP Risk (Flag Plaza)
Lifetime Cancer Risk
(Background)
(Background)

20
1 2
0
5
10
15
20
25
30
35
40
Val
ues
Colu
How does Allegheny County compare to other cities?
1 2 3 4 5
0
0.5
1
1.5
2
2.5
3
3.5
Val
ues
Column Number
AvalonStoweDowntownBackground
1,3 Butadiene CCl4 Chlorform TCE Chloroethene
Con
cent
ratio
n ( μ
g/m
3)
Benzene Toluene
21
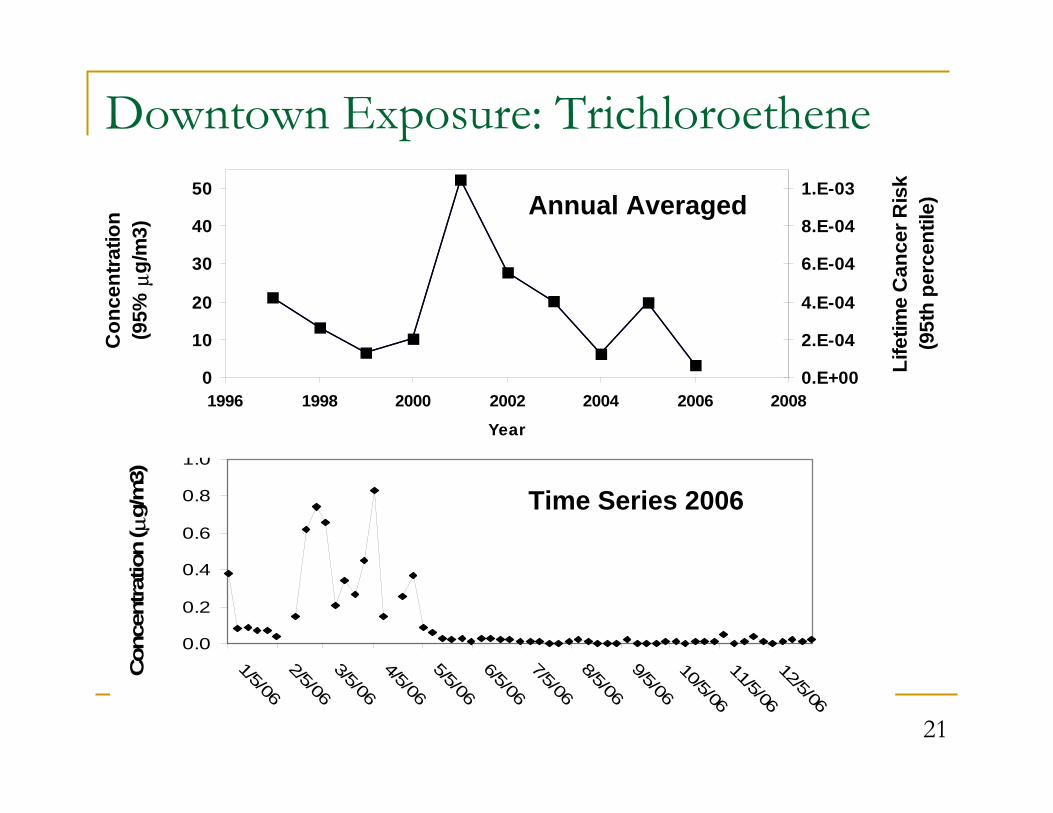
Downtown Exposure: Trichloroethene
0.0
0.2
0.4
0.6
0.8
1.0
1/5/062/5/063/5/064/5/065/5/066/5/067/5/068/5/069/5/0610/5/0611/5/0612/5/06
Con
cent
ratio
n ( μ
g/m
3)
0
10
20
30
40
50
1996 1998 2000 2002 2004 2006 2008
Year
Con
cent
ratio
n (9
5% μ
g/m
3)
0.E+00
2.E-04
4.E-04
6.E-04
8.E-04
1.E-03
Life
time
Can
cer R
isk
(95t
h pe
rcen
tile)Annual Averaged
Time Series 2006

22
Source Apportionment
Main issue: Associating sources and factorsEvent profilesSource profiles
GFX =PMF solves:
scores loadings

23
10 20 30 40
30
210
60
240
90270
120
300
150
330
180
0
Mobile Gasoline Factor
PMF Factor
Factor Contribution vs.
Wind Direction
300
60
90
120
150180
210
240
270
330
300
0
0.1
0.2
0.3
0.4
0.5
0.6
0.7
0.8
0.9
1
Pittsbur gh
Source Profile
Toluene Toluene
M/P Xylene
M/P Xylene
Benzene
Styrene

24
10 20 30 40 50
30
210
60
240
90270
120
300
150
330
180
0
Water Treatment Factor
PMF Factor
Factor Contribution vs.
Wind Direction
030
60
90
120
150180
210
240
270
330
300
ACSA
1
ACSA Emission Profile
Tetrachloroethylene
Toluene
25
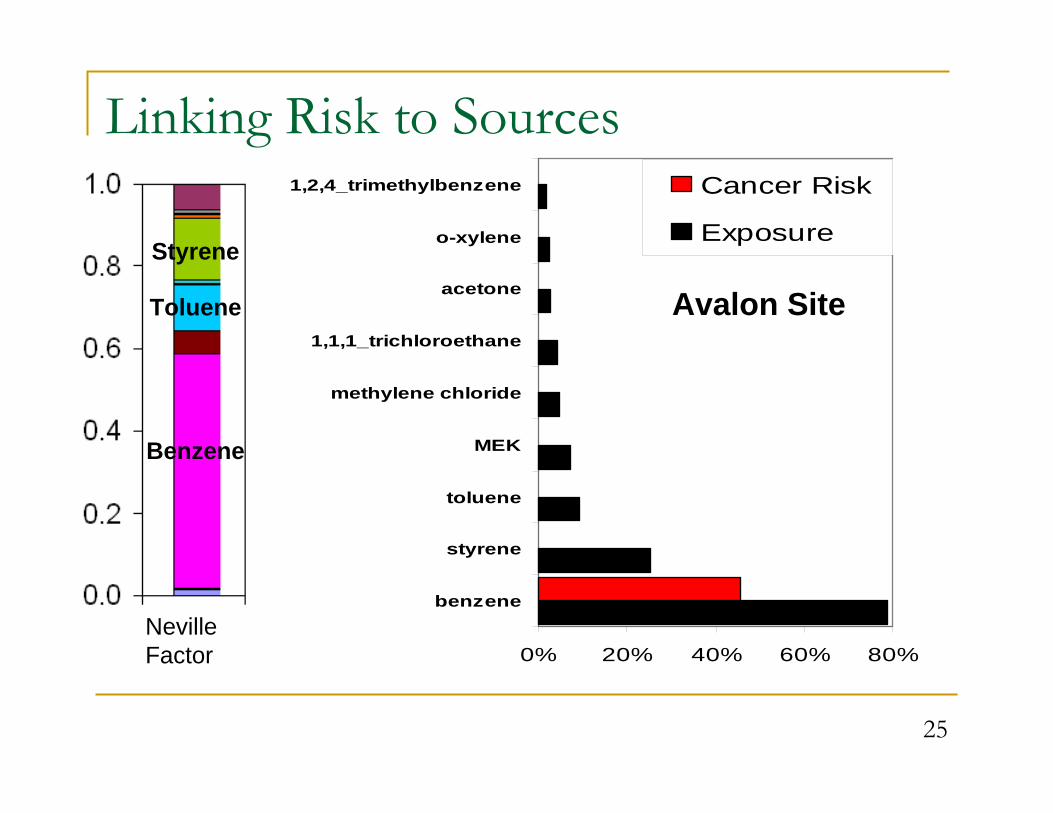
0% 20% 40% 60% 80%
benzene
styrene
toluene
MEK
methylene chloride
1,1,1_trichloroethane
acetone
o-xylene
1,2,4_trimethylbenzene Cancer Risk
Exposure
Linking Risk to Sources
Neville Factor
Benzene
Styrene
Toluene Avalon Site
26
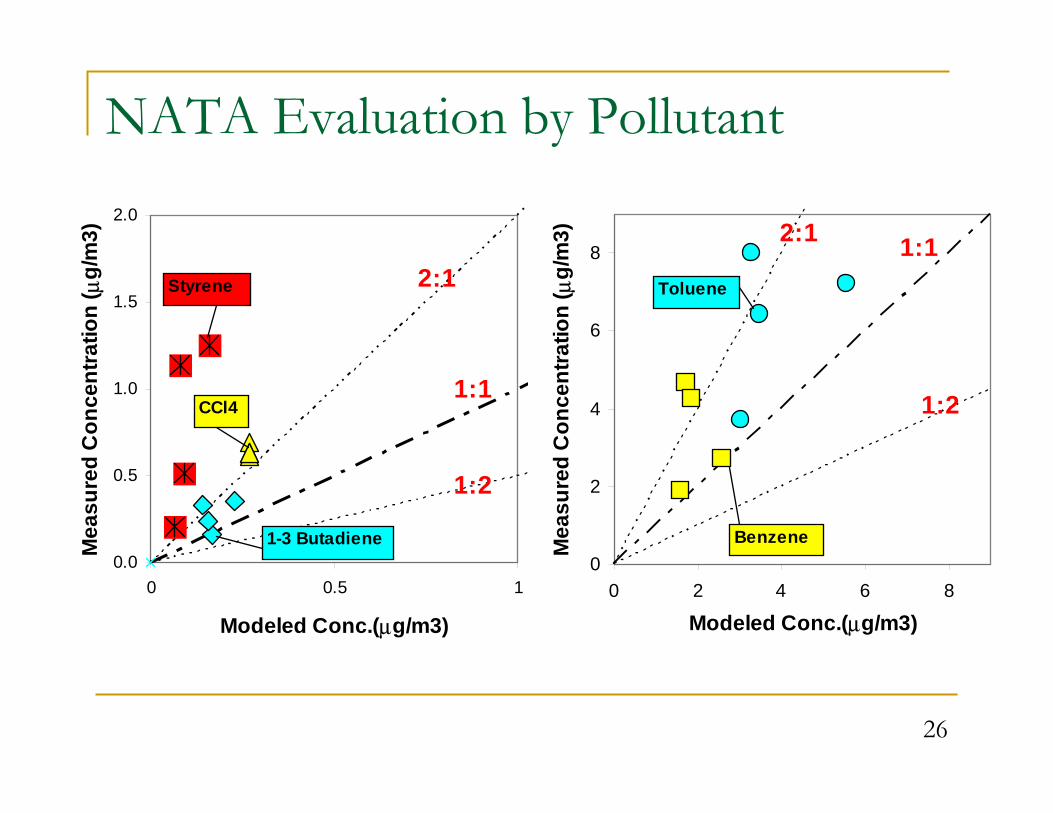
NATA Evaluation by Pollutant
0
2
4
6
8
0 2 4 6 8
Modeled Conc.(μg/m3)
Mea
sure
d C
once
ntra
tion
( μg/
m3) 1:12:1
1:2
Toluene
Benzene0.0
0.5
1.0
1.5
2.0
0 0.5 1
Modeled Conc.(μg/m3)
Mea
sure
d C
once
ntra
tion
( μg/
m3)
2:1
1:2
1:1
1-3 Butadiene
Styrene
CCl4

27
NATA Evaluation by Site
0
0.5
1
1.5
2
2.5
3
1,3-Butadiene Benzene Chloroform Toluene
Mea
sure
d / M
odel
ed
0
5
10
15
20
25
Styrene TCE
0
0 . 5
1
1. 5
2
2 . 5
3
1 , 3 - B u t a d ie n e B e n z e n e C hlo r o f or m T o lue n e
Avalon Stowe Downtown Background

28
NATA Evaluation: Source ApportionmentBenzene
0%
25%
50%
75%
100%
Downtown(NATA)
Avalon (NATA)
Background(NATA)
Stowe (NATA)
Avalon (PMF)
Downtown Avalon Background Stowe Avalon (PMF)
(NATA)
Background
Mobile
Point

29
Application of Results
Quantifying risk
Source Apportionment
Policy and funding decisions
NATA evaluation

30
Lessons Learned
Meeting all of our goals.
Design of the project was sufficient to meet goals and additional scientifically interesting work is being done using the results.
In retrospect

31
Future Work
IntensivesDowntownSouth Fayette
Expand and improve PMF analysisSynergistic risk modelsNATA evaluation

32
Acknowledgments
FundingClean Air FundEPA

33
Questions