Source-Separated Organics Feasibility Study Organics Feasibility Study ... 1600 Genesee Street...
96
Oneida-Herkimer Solid Waste Authority Source-Separated Organics Feasibility Study March 2017
Transcript of Source-Separated Organics Feasibility Study Organics Feasibility Study ... 1600 Genesee Street...

Oneida-Herkimer Solid Waste Authority
Source-Separated OrganicsFeasibility Study
March 2017

Oneida-Herkimer Solid Waste Authority
Source-Separated OrganicsFeasibility Study
March 2017
Prepared For:
Oneida-Herkimer Solid Waste Management Authority
1600 Genesee StreetUtica, New York 13502
Prepared By:
Barton & Loguidice, D.P.C.443 Electronics Parkway
Liverpool, New York 13088

Oneida-Herkimer Solid Waste Authority Source-Separated Organics Feasibility Study
260.055.001/3.17 - i - Barton & Loguidice, D.P.C.
Table of Contents
Section Page
1.0 Introduction ............................................................................................................ 1
2.0 Project Background ............................................................................................... 22.1 Current Organics Management .......................................................................... 22.2 OCSD Partnership ............................................................................................. 3
2.2.1 WPCP Upgrades ......................................................................................... 32.2.2 Anaerobic Digestion..................................................................................... 4
3.0 Commercial Source-Separated Organics Program ............................................... 63.1 Predicted Organics Volume................................................................................ 63.2 Commercial SSO Collection ............................................................................... 8
3.2.1 Collection Frequency ................................................................................... 93.2.2 Collection Containers................................................................................. 103.2.3 Collection Vehicles .................................................................................... 123.2.4 Other Design Considerations ..................................................................... 13
4.0 Source-Separated Organics Characterization ..................................................... 164.1 Predicted Organics Volume.............................................................................. 164.2 Predicted Organic Strength .............................................................................. 17
5.0 SSO Processing .................................................................................................. 185.1 Process Flow .................................................................................................... 185.2 Building Design and Layout.............................................................................. 185.3 SSO Processing Equipment ............................................................................. 19
5.3.1 Turbo Separator ........................................................................................ 19
6.0 Capital Cost ......................................................................................................... 226.1 Building ............................................................................................................ 226.2 Equipment ........................................................................................................ 226.3 Sanitary Sewer Upgrades ................................................................................ 226.4 Climate Smart Communities Grant ................................................................... 23
7.0 Operations and Maintenance (O&M) Cost Estimate ............................................ 247.1 Building O&M Costs ......................................................................................... 247.2 Equipment ........................................................................................................ 247.3 Commercial SSO Total Costs .......................................................................... 26
8.0 Impacts to Oneida-Herkimer Regional Landfill .................................................... 288.1 Airspace Utilization ........................................................................................... 288.2 Landfill Stability ................................................................................................ 288.3 Landfill Gas Production .................................................................................... 29

Oneida-Herkimer Solid Waste Authority Source-Separated Organics Feasibility Study
260.055.001/3.17 - ii - Barton & Loguidice, D.P.C.
9.0 Permitting and Environmental Review ................................................................. 31
10.0 Conclusions and Recommendations ................................................................... 32
TablesTable 1 - Diverted Commercial Organics ........................................................................ 6Table 2 - Authority Potential Food Waste Recovery ........................................................ 7Table 3 - Commercial SSO Collection Methods ............................................................ 12Table 4 - Anticipated Source-Separated Organic Waste Volumes ................................ 16Table 5 - Estimated Electrical Loads ............................................................................. 25Table 6 - New York State Planning Units Organics Tip Fee Comparison...................... 27
FiguresFigure 1 - Conceptual Site PlanFigure 2 - Conceptual Process Flow DiagramFigure 3 - Building Floor PlanFigure 4 - Processing Equipment Schematic
AppendicesAppendix A - Organics Processing Equipment SummaryAppendix B - Capital Cost EstimateAppendix C - Tip Fee to Cover CostsAppendix D - Landfill Gas Generation Modeling

Oneida-Herkimer Solid Waste Authority Source-Separated Organics Feasibility Study
260.055.001/3.17 E-1 Barton & Loguidice, D.P.C.
Executive Summary
Organics recovery opportunities, specifically for diverted food waste, areidentified in the Oneida Herkimer Solid Waste Authority’s (the Authority) Local SolidWaste Management Plan as a target for investigation during the current planningperiod. Recent legislation in neighboring states including Vermont, Massachusetts, andConnecticut now requires the separate collection of certain types of organics anddiversion from disposal facilities. In light of these changes and recent New York Statelegislative proposals with support from Governor Cuomo, organics diversion has thepotential to become a requirement in New York State. As a longtime leader in integratedsolid waste management, the Authority has begun evaluating options for organicsdiversion to find a practical and economical solution to maximize recovery and recyclingwithin its existing solid waste management system. This includes the collection,processing, and end use of the targeted organics.
The Authority, in partnership with the Oneida County Sewer District (OCSD), iscurrently evaluating the diversion of source-separated organics (SSO) from commercialentities in Oneida and Herkimer Counties. Commercial SSO is proposed to beprocessed and used as a high-strength feedstock to be co-digested with municipalsludge in the anaerobic digesters planned as part of upgrades to the Water PollutionControl Plant (WPCP). Delivery of the SSO and processing would occur at theAuthority’s Eastern Transfer Station (ETS) located in Utica, New York directly adjacentto the WPCP (see Figure 1). This feasibility study will specifically assess the quantity ofavailable organics, the type and sizing of the collection and processing equipment,including any upgrades to the ETS, and any potential issues for collection andprocessing, within the context of the current solid waste management system. Thestudy will also determine the economic feasibility and any impacts to existing solidwaste management facilities, along with the potential for expansion of the system toother organic waste streams located in the Authority’s service area.
Due to limited available information from surveys of targeted commercial entities,tonnage data for commercial facilities was calculated from similar facilities based onusage of each facility. This limited data set was compared to waste composition datafrom the New York State Department of Environmental Conservation’s (NYSDEC) StateSolid Waste Management Plan, Beyond Waste and actual landfilled tonnages.Combining the available survey data with the tonnage estimates and removing all foodwaste already diverted through donation or composting, resulted in available SSO forcollection totaling approximately 15,000 tons per year. Applying the waste compositionpercentages from Beyond Waste to actual waste generation numbers collected between2010 and 2015 from the Authority’s service area results in estimated available SSO of21,300 tons per year. This matches closely with the estimated total commercial SSOavailable, including food waste already allocated for uses such as donation and

Oneida-Herkimer Solid Waste Authority Source-Separated Organics Feasibility Study
260.055.001/3.17 E-2 Barton & Loguidice, D.P.C.
composting. Due to the anticipated incremental start to the organics diversion programbeginning with those mandated by New York State, a range of expected SSO of 5,000to 21,000 tons per year is assumed for sizing equipment. This assumes generatorparticipation of 100% which, although unlikely, will allow for processing equipment to beconservatively sized.
Key components of SSO collection methods impacting the design of the transferstation area for SSO receipt and processing include collection frequency, containertypes, and collection vehicle types, among others. Other factors impacting collectionand processing design are contamination in the SSO waste stream and anticipatedpeaks in commercial waste generation. In order to effectively design the waste receiptarea and SSO processing system, the type and frequency of waste collection vehicledeliveries, as well as expected contamination quantities in the waste stream, wouldneed to be identified. Some assumptions will need to be made, since waste collectionmethods vary throughout the Authority’s service area.
The critical components in the process flow for commercial SSO processing foranaerobic digestion are depackaging/contamination removal, particle size reduction,emulsification, flow equalization, and transportation. A brief summary of availableequipment for the processing of organics for anaerobic digestion is included in AppendixA. Processed feedstock will be piped directly into a holding tank or wet well in order toallow for flow equalization, and will be pumped out at a constant rate, or as directed bythe WPCP, to the anaerobic digester. Waste packaging material is conveyed separatelyout of the system for recycling or disposal. A schematic of the proposed process flow isincluded as Figure 2.
A cost estimate for the entire project, including the building addition, SSOprocessing equipment, and sanitary sewer upgrades but excluding this feasibility study,was developed totaling $2,655,000. This budget estimate includes a contingency of25% due to the uncertainties involved in the project, including quality and quantity ofwaste received, quality of feedstock required for the anaerobic digesters, and localhauler and generator participation and support. The largest expenditure anticipated forthe SSO processing facility is the building addition and modifications to the ETS.Estimates for the capital cost of the SSO processing equipment are based on theequipment manufacturer, desired process steps, and arrangement of equipment andinclude installation, piping, and loading equipment. Additional work required as part ofthe SSO processing project includes sanitary sewer upgrades, the cost of which hasbeen included in this capital cost estimate. Funding from the NYSDEC Climate SmartCommunities grant was pursued and granted totaling a maximum of $1,327,500available for the project. Refer to Appendix B – Capital Cost Estimate for additionalinformation.

Oneida-Herkimer Solid Waste Authority Source-Separated Organics Feasibility Study
260.055.001/3.17 E-3 Barton & Loguidice, D.P.C.
In combination with the capital costs, the O&M costs to operate the SSOprocessing system will determine the future tip fee for commercial SSO accepted at thetransfer station. In order to encourage generator participation in the source separationand separate collection of their organics, the future tip fee will likely need to be loweredfrom typical municipal solid waste (MSW), but the value will be determined by the coststo run the system. The tip fee must be economical for haulers but also allow forsustained operations of the processing equipment. In order to find the balance betweengenerator economics and operations the Authority will conduct a market study in 2017with haulers having previous experience with similar programs. This will allow for amore informed tip fee establishment in the future.
Removal of SSO from the waste stream for anaerobic digestion rather thanlandfilling will have several impacts to the existing solid waste managementinfrastructure and WPCP. Airspace consumption will decrease on an annual basis andextend the life of the landfill by approximately 1 to 7 years based on the maximum SSOtonnage available for diversion and which accounts for the increase in sludge from theWPCP requiring disposal, which is not related to this project. Diversion of organics fromthe landfill will decrease the moisture content and biodegradable fraction of the wastemass, resulting in less settlement and reduced landfill gas generation and energyproduction at the Authority’s landfill gas to energy (LFGTE) Facility. Reduction in peaklandfill gas generation from existing conditions is approximately 200 standard cubic feetper minute (scfm). Impacts to the WPCP are more difficult to quantify and includeincreased energy recovery and efficiency of the anaerobic digesters.
Several environmental review and permitting tasks will need to be undertaken forapproval of this project, including environmental review under the State EnvironmentalQuality Review Act (SEQRA), a modification to the transfer station’s existing Part 360permit, and an International Building Code review.
The separate collection and processing of commercial organics as a feedstockfor the WPCP anaerobic digesters will be feasible, given the information that is currentlyavailable. The Authority is likely to pursue implementation of a commercial SSOcollection program, given the results of this study and the funding available for capitalinvestments. It is recommended that additional information be pursued regardingexpected participation by generators and haulers, specifically regarding waste quantitiesand collection methods and frequencies. The Authority will conduct a market study toaid in determining project economics and refine estimations of the commercial SSOquantities available. It is not recommended to pursue a pilot program for food wasteprocessing, especially given the proven success of the chosen processing equipment inother service areas, due to the substantial capital investment for processing equipmentand transfer station modifications. Given the challenges identified herein for commercialorganics collection and the unknowns involved in the project, it is not recommended that

Oneida-Herkimer Solid Waste Authority Source-Separated Organics Feasibility Study
260.055.001/3.17 E-4 Barton & Loguidice, D.P.C.
source-separated residential organics diversion be pursued at this time. The Authoritywill continue to monitor potential New York State legislation and its effects on acommercial SSO collection program as it proceeds with implementation of the program.

Oneida-Herkimer Solid Waste Authority Source-Separated Organics Feasibility Study
260.055.001/3.17 - 1 - Barton & Loguidice, D.P.C.
1.0 Introduction
The purpose of this study is to assess the feasibility of the collection anddiversion of source-separated organics (SSO) from commercial and institutional entitieslocated in Oneida and Herkimer Counties. SSO diverted from the Oneida-HerkimerRegional Landfill, located in the Town of Ava, Oneida County, New York, would becollected and processed at the Eastern Transfer Station (ETS), located in the City ofUtica, for use as feedstock to be co-digested with sewage sludge in a plannedanaerobic digestion system. The anaerobic digestion system was designed as part ofsignificant upgrades planned for the Oneida County Sewer District’s (OCSD) WaterPollution Control Plant (WPCP) located in the City of Utica, Oneida County, New York.See Figure 1 – Conceptual Site Plan for the location of these facilities. This feasibilitystudy will specifically assess the quantity of available organics, the type and sizing ofthe collection and processing equipment, including any upgrades to the ETS, and anypotential issues for collection and processing, within the context of the current solidwaste management system. The study will also determine the economic feasibility andany impacts to existing solid waste management facilities, along with the potential forexpansion of the system to other organic waste streams located in the Authority’sservice area.

Oneida-Herkimer Solid Waste Authority Source-Separated Organics Feasibility Study
260.055.001/3.17 - 2 - Barton & Loguidice, D.P.C.
2.0 Project Background
Organics recovery opportunities, specifically for diverted food waste, areidentified in the Authority’s Local Solid Waste Management Plan as a target forinvestigation during the current planning period. In addition, recent legislation inneighboring states including Vermont, Massachusetts, and Connecticut now requiresthe separate collection of certain types of organics and diversion from disposal facilities.In light of these changes and recent New York State legislative proposals with thesupport of Governor Cuomo, commercial organics diversion has the potential to becomea requirement in New York State. As a long-time leader in solid waste management, theAuthority has begun evaluating options for organics diversion to find a practical andeconomical solution to integrate into its existing solid waste management system. Thisincludes the processing and end use of the targeted organics.
2.1 Current Organics Management
Although the Authority has a strong backyard composting program,including Authority-sponsored trailer load sales of home compost units, and anactive composting education program especially at local schools, disposal is theprimary outlet for organic waste generated in Oneida and Herkimer Counties.The Authority owns and operates the Oneida-Herkimer Regional Landfill, locatedin the Town of Ava, Oneida County, New York, which is the current disposallocation for Oneida and Herkimer Counties waste including most organics.Oneida and Herkimer Counties operate under flow control and all waste disposedis managed exclusively at the Authority’s facilities. Waste is collected at thesource and hauled directly to the landfill or to one of two transfer stations; theETS located in Utica, New York, or the Western Transfer Station (WTS) locatedin Rome, New York. Some municipalities collect their own waste or contract outhaulers for waste collection. In other cases, generators contract out haulersindividually or self-haul to the transfer stations. Organics are currently co-mingledwith other waste and managed together for collection and disposal purposes.Due to the many difficulties associated with residential waste collection, onlycommercial SSO will be considered for the purposes of this feasibility study, butlocal composting and donation of food waste will continue to be encouraged andfacilitated by the Authority. Residential organics will continue to be managed as aco-mingled waste stream with MSW.
Many commercial entities currently source separate organic wastes forother uses rather than disposal. Several grocers and restaurants donate food tolocal charities or not-for-profit organizations, such as churches, the RescueMission, and the Food Bank. Others send organics to a rendering plant or tofarmers for use as animal feed, as is the case for the largest generator of organic

Oneida-Herkimer Solid Waste Authority Source-Separated Organics Feasibility Study
260.055.001/3.17 - 3 - Barton & Loguidice, D.P.C.
waste in the region, FX Matt Brewery, with over 10,000 tons per year of organicwaste diverted. Still others compost SSO in lieu of disposal. Since these entitiescurrently have non-disposal outlets for SSO, they will not be included in thefeasibility study as potential waste streams. Only commercial organics currentlydestined for disposal in the landfill will be targeted for diversion.
The Authority currently operates a yard waste composting facility adjacentto the ETS to manage green waste collected within Oneida and HerkimerCounties. The facility processes yard waste in windrows to generate compost,which is marketed throughout the service area for use by homeowners andbusinesses. Although this facility, as well as smaller food waste compostingoperations, could make operational changes to incorporate food waste forcomposting, the large quantities potentially available for diversion make thisoption impossible as it is located in an area with no area for expansion. Inclusionof food waste in composting operations could complicate operations andpermitting of the facility as well as potentially impact the marketability of theproduct during transition from yard waste to combined composting with foodwaste. In addition, pursuing composting as an end use for organics will eliminatethe ability to recover energy from the product as in anaerobic digestion. As such,processing methods other than composting for diverted commercial SSO werepursued.
2.2 OCSD Partnership
In order to facilitate inclusion into its existing solid waste managementsystem, the Authority looked towards existing partnerships to ease the transitionand optimize the economics of an SSO diversion program. OCSD, which ownsand operates the WPCP located directly adjacent to the ETS in Utica, New York,currently partners with the Authority for the handling of sludge produced at theWPCP and leachate generated at the Oneida-Herkimer Regional Landfill. TheAuthority accepts the sludge produced at the WPCP for disposal at the landfilland OCSD accepts leachate generated at the landfill for treatment.
2.2.1 WPCP Upgrades
Upgrades to the WPCP are being undertaken by OCSD to increasethe plant’s treatment capacity and to add an anaerobic digestion system tohandle biosolids and recover gas for power production. Current plantoperations rely on two fluidized bed incinerators for biosolids disposal, butas part of the plant upgrades and recent changes to emissions standards,OCSD opted to pursue anaerobic digestion with combined heat and powerengines for biosolids disposal with electricity generation and waste heatrecovery. Two egg-shaped anaerobic digesters, 1.2 million gallons each,

Oneida-Herkimer Solid Waste Authority Source-Separated Organics Feasibility Study
260.055.001/3.17 - 4 - Barton & Loguidice, D.P.C.
are being constructed to manage a flow rate of 86,000 gallons per day ofmunicipal biosolids at the WPCP. The anticipated solids and organics tothe digesters are 5.6% total solids (TS) and 75% volatile solids (VS). Partof the inclusion of the anaerobic digestion system into treatmentoperations includes a relocated septage receiving building for the digestercomplex and will require the relocation of the 4” sanitary sewer force mainfrom the ETS. These upgrades are scheduled to be completed in 2018 foroperation of the anaerobic digesters estimated in 2019, which makes thetiming ideal to coincide with potential upgrades to the ETS to allow fororganics processing.
2.2.2 Anaerobic Digestion
Anaerobic digestion is being pursued as the end use of divertedorganics not only for the convenient siting and previous planning of such afacility adjacent to an existing Authority collection point (ETS), but alsodue to the advantages of anaerobic digestion over other options fororganics recycling or conversion. Energy recovery, including utilizingwaste heat and electricity on-site as well as selling excess power to thegrid, is an important factor in the economics of organics diversion.1 This isnot possible if composting is used as the end use for diverted organics.Using the previously planned anaerobic digester complex will conserveland area without impacting the operations or product marketability of theexisting composting facility, since construction of an entirely newanaerobic digestion or composting facility or expanding an existingcompost facility will not be required. Co-digestion of a high strength wastestream, such as processed SSO, with biosolids will increase biogasproduction and the efficiency of the anaerobic digesters at the WPCP,resulting in greater energy production and recovery than from municipalbiosolids alone.2 Literature on co-digestion of municipal biosolids and SSOsuggest biogas composition is approximately 55-70% methane,3
1 Technical Document on Municipal Solid Waste Organics Processing, Environment Canada, 2013.Available at:http://www.compost.org/English/PDF/Technical_Document_MSW_Organics_Processing_2013.pdf.Accessed September 2016.
2 Tapping the Energy Potential of Municipal Wastewater Treatment: Anaerobic Digestion and CombinedHeat and Power in Massachusetts, Shutsu Chai Wong, Massachusetts Department of EnvironmentalProtection, July 2011. Available at: http://www.mass.gov/eea/docs/dep/water/priorities/chp-11.pdf.Accessed September 2016.
3 Anaerobic Digestion of Biodegradable Organics in Municipal Solid Waste, Shefali Verma, ColumbiaUniversity, May 2002. Available at:http://www.compost.org/CCC_Science_Web_Site/pdf/Biogas/anaerobic%20Digestion%20of%20Biodegradable%20Organics%20in%20MSW.pdf. Accessed September 2016.

Oneida-Herkimer Solid Waste Authority Source-Separated Organics Feasibility Study
260.055.001/3.17 - 5 - Barton & Loguidice, D.P.C.
compared to 49% methane content in the landfill gas generated in theOneida-Herkimer Regional Landfill in 2015. This is a result of moreefficient biogas generation and collection during anaerobic digestion thanduring typical decomposition in a landfill with gas recovery for use in theLFGTE facility.

Oneida-Herkimer Solid Waste Authority Source-Separated Organics Feasibility Study
260.055.001/3.17 - 6 - Barton & Loguidice, D.P.C.
3.0 Commercial Source-Separated Organics Program
3.1 Predicted Organics Volume
Limited information is available on the total tonnage of SSO available fordiversion from commercial entities. The Authority surveyed many of thecommercial and institutional entities in their service area in order to estimate theamount of SSO that could potentially be collected. However, some of theinstitutions surveyed, including schools, hospitals, nursing homes, restaurants,hotels, and grocers, do not track the amount of food waste they produce.Tonnage data for these facilities was calculated based on usage of similar out-of-region facilities. For example, food waste generated at the schools wasestimated based on the number of students and a set waste generation rate perstudent. Combining the available survey data with the estimates resulted in anapproximate commercial SSO quantity of 31,700 tons per year. Commercialorganics already recovered for other uses are quantified in the Authority’sPlanning Unit Reports and are summarized in Table 1 below. Removing all foodwaste allocated towards other uses, such as donation or composting, resulted inavailable commercial SSO for collection totaling approximately 15,000 tons peryear. This assumes generator participation of 100% which, although unlikely, willallow for processing equipment to be sized conservatively.
Table 1 - Diverted Commercial Organics

Oneida-Herkimer Solid Waste Authority Source-Separated Organics Feasibility Study
260.055.001/3.17 - 7 - Barton & Loguidice, D.P.C.
All volume data was checked against the waste composition numbers perNYSDEC’s State Solid Waste Management Plan, Beyond Waste. Data collectedas part of the Beyond Waste Plan states that 46% of MSW is commercial,institutional, or industrial in origin, and that 25.2% of commercial and institutionalwastes are food scraps.4 Applying these waste composition percentages toactual waste generation numbers collected between 2010 and 2015 from theAuthority’s service area results in an estimated available SSO of 21,300 tons peryear (see Table 2). This matches closely with the estimated total commercialSSO available, including food waste already allocated for uses such as donationand composting. Based on the expected phasing of the SSO collection program,a range of expected tonnages of 5,000 to 21,000 will be used moving forward tosize equipment. This tonnage range assumes that in addition to larger generatorsthat may be mandated by state legislation to participate in organics diversion,that smaller generators not subject to the legislation will voluntarily participatebased on corporate green initiatives or economics.
Table 2 - Authority Potential Food Waste Recovery
Diversion of organics is anticipated to occur in a phased manner, withlarger generators (greater than 2 tons of SSO/week) participating first due tostate mandates, and other generators following as economics, green initiatives,and/or further mandates dictate. In order to further refine the amount of SSOinitially available one must take into account the effect of potential New YorkState Legislation. The potential SSO recycling legislation in New York State
4 NYS Solid Waste Management Plan, Beyond Waste, 2010.

Oneida-Herkimer Solid Waste Authority Source-Separated Organics Feasibility Study
260.055.001/3.17 - 8 - Barton & Loguidice, D.P.C.
would require generators of greater than 2 tons per week of food or food scraps,based on an annual average, to donate edible food and compost or recycle whatis not donated beginning in January of 2021. In addition, haulers orintermediaries, such as transfer stations, would need to ensure that SSO is takenultimately to a certified organics recycler such as an animal feed operation,renderer, compost facility, anaerobic digestion facility, or other approvedrecyclers. Generators within 50 miles of a viable facility would be required torecycle food scraps.
Based on generator surveys, the Authority estimates that there are aboutten area organics generators that would initially be mandated to recover theirorganics under the proposed State law. This does not include generators in theservice area that are currently recovering their organics through donation, animalfeed operations, or composting. Other smaller local generators that do not meetthe mandated generation levels have indicated to the Authority willingness toparticipate in a local organics recovery project. There are also a significantnumber of chain restaurants that have corporate “green” initiatives as part of theirmission statements. Many of these restaurants are likely to participate in anorganics recovery program. The Authority estimates that a combination of newlymandated large generators with no current recovery, and smaller voluntaryparticipants would generate approximately 5,000 tons of food and food scrapsper year. Due to the unknown factors associated with the proposed legislationand voluntary participation in the program, a sensitivity analysis was performedto determine the feasibility of the program for a range of tonnages from the initialphase estimation of 5,000 tons per year to the maximum available SSO currentlyestimated at 21,000 tons per year.
3.2 Commercial SSO Collection
Commercial waste collection methods vary throughout the Authority’sservice area. Haulers are contracted by municipalities or individuals forcollection, or waste is self-hauled to the transfer stations or residentialconvenience stations. Some municipalities collect commercial waste with theirown trucks and employees. As with waste and recyclables, commercial organicscollection will be conducted by haulers operating in the service area.
The reduced pickup quantities and potential for odor associated withorganics complicates separate collection of SSO from MSW. Separating wastestreams at the source lowers waste quantities for collection per route stop unlesscollected in split-body, or compartmentalized, trucks. This has the potential toincrease hauling costs due to multiple stops at each collection point. In addition,the potential for odors from organics may require consideration of modified

Oneida-Herkimer Solid Waste Authority Source-Separated Organics Feasibility Study
260.055.001/3.17 - 9 - Barton & Loguidice, D.P.C.
collection schedules from typical weekly pickup in order to limit odor issues andencourage participation. However, since total waste quantities are not anticipatedto change and tip fees will be reduced for organics to account for anticipatedincreased hauling costs, costs to generators are not anticipated to increasesignificantly. Since the Authority relies on many different haulers, both public andprivate, for waste collection, collection containers and pickup equipment will varythroughout the service area. The type of equipment used for collection will behighly dependent on specific haulers and the container type and size required foreach generator.
Key components of collection impacting the design of the transfer stationarea for SSO receipt and processing include collection frequency, containertypes, and collection vehicle types, among others. Other factors impactingcollection and processing design are contamination in the SSO waste stream andanticipated peaks in commercial waste generation. In order to effectively designthe waste receipt area and SSO processing system, some assumptions wouldneed to be made regarding the type and frequency of waste collection vehicledeliveries, as well as expected contamination quantities in the waste stream.Potential collection options implemented by haulers are discussed in thefollowing sections. Proper estimation of the collection vehicle types, wastequantities, and drop-off frequencies will allow for proper design of the SSOreceiving area and processing equipment.
3.2.1 Collection Frequency
The frequency of collection will be dependent on the amount ofwaste generated and the hauler. At a minimum, once weekly collection isrecommended to prevent significant odor and vector issues, withadditional pickups as necessary to account for peaks in SSO generation.These peaks could result from large events at schools, restaurants, hotels,or conference centers, loads of off-spec food received at grocery stores,or pickups following weekends or holidays. If odors or vectors become anissue, generators and/or haulers may consider multiple pickups per week.
The increased number of trips to each generator for separateMSW, recyclables, and organics collection may be offset by decreasingthe frequency of non-recyclable waste pickup. If the majority organicstream is removed from the MSW waste stream, longer time intervalsbetween MSW pickups could be possible, assuming generation quantitiesand odors allow. Larger collection containers for recyclables could also beconsidered for reduced pickup frequencies for recyclable materials.

Oneida-Herkimer Solid Waste Authority Source-Separated Organics Feasibility Study
260.055.001/3.17 - 10 - Barton & Loguidice, D.P.C.
More frequent collection will also minimize the required storagecapacity of both processed and unprocessed organics at the transferstation, as well as the design capacity for processing equipment. Althoughit is not anticipated that significant storage would be required due to thepotential for odor issues, large incoming quantities above the designcapacity of the processing equipment will require significantly morestorage capacity compared to a more equalized incoming waste volume.Quantities of waste unable to be processed during the permitted facilityoperational hours could potentially cause odor issues at the transferstation. Ideally, collection would occur at a rate that could be maintainedby the processing equipment within the operational hours of the transferstation in order to eliminate storage of organics and reduce the potentialfor odors.
3.2.2 Collection Containers
Containers used for SSO collection will be dependent on thequantity of waste generated as well as the equipment available to haulersfor pickups. Regardless of container size, several common features will berequired. Due to the high moisture content anticipated of the SSOcollected and the ultimate end use in an anaerobic digester, moisturecontent will need to be maintained. Containers will need to be watertightand completely enclosed to prevent leakage and odors. This could also beaccomplished through rubber gasket seals or the use of bags for organicscollection prior to placement in containers curbside. Some organicscollection programs have implemented container cleaning to limit odorsand encourage generator participation through on-site steam cleaning,collection of full toters with SSO for offsite emptying and empty containerexchange with cleaning at the processing location with hot water, use of apneumatic vacuum truck with sufficient suction for liquid removal, or theuse of bags for collection prior to placement in containers to preventcontact with odorous wastes. Due to the operational difficulties associatedwith container cleaning or exchange, this option is not being considered bythe Authority. For the purposes of equipment selection and sizing, the useof bags is recommended for the ease of use at the generation sources,containment of moisture and odors, and limitation of container double-handling. This will require a decontamination or depackaging step in theprocessing equipment for removal of the bags from the SSO.

Oneida-Herkimer Solid Waste Authority Source-Separated Organics Feasibility Study
260.055.001/3.17 - 11 - Barton & Loguidice, D.P.C.
Several container sizes for collection are available, as with typicalMSW or recyclables collection, and will vary with each commercialgenerator. Container size and type is dependent on the quantity of wastegenerated, pickup frequency, and the contracted hauler’s collectionvehicle. Smaller generators, such as smaller markets or bakeries, mayrequire only toters. This is similar to programs implemented for residentialSSO collection seen in other areas such as New England, where SSOdiversion is required, or other areas with local laws or pilot SSO programsin place. Toters are available in 32, 64, or 90-gallon sizes typically andcould accommodate up to approximately 530 lbs of SSO per week (90-gallon) depending on the number of toters and peaks in generation andassuming once weekly collection. Typical commercial entities such asschool districts, colleges, larger restaurants, health care and nursingcenters will require larger volumes for collection such as front loaddumpsters, which typically range from 2 cubic yards to 8 cubic yards insize. These would accommodate up to approximately 4.7 tons of SSO perweek assuming once weekly collection. Toters or front-loading dumpsterswould accommodate nearly all the commercial generators in the servicearea, assuming average weekly generation (i.e., not accounting forpeaks). Larger generators could require roll-offs or compactors for weeklySSO collection. None are anticipated in the service area based on currentdata collected. See Table 4 for a summary of the anticipated collectionmethods.

Oneida-Herkimer Solid Waste Authority Source-Separated Organics Feasibility Study
260.055.001/3.17 - 12 - Barton & Loguidice, D.P.C.
Table 3 - Commercial SSO Collection Methods
Table 3 - Commercial SSO Collection MethodsWaste
Generator SizeNo. of
GeneratorsContainer
Size1Container
TypeTruckType
UnloadingMethod
Up to 210 lbsper week
34 32 gal Toter Rear Loader orAutomated
Side Loader
Walkout
Up to 420 lbsper week
12 64 gal Toter Rear Loader orAutomated
Side Loader
Walkout
Up to 590 lbsper week
13 90 gal Toter Rear Loader orAutomated
Side Loader
Walkout
Up to 1.3 tonsper week
505 2 CY Front-loadDumpster
Front Loader MechanicalArm Unloading
Up to 5.3 tonsper weekLarge Generators(>2 tons/week)2
6 8 CY Front-loadDumpster
Front Loader MechanicalArm Unloading
10
Up to 23.7 tonsper week
0 40 CY Roll-Offs/Compactors
Roll-OffGarbage Truck
Tippingroll-offs
Greater than 23.6 tonsper week
0 Multiplepickups
per week
Roll-Offs/Compactors
Roll-OffGarbage Truck
Tippingroll-offs
Notes:1. Assumes once weekly pickup2. Large generators, defined by the NYSDEC as waste generators of more than 2 tons of organics per week, would be the first targeted by potential legislation for organics diversion.
3.2.3 Collection Vehicles
Collection vehicle types will be dependent on the type of containerused for collection at the generator as well as the individual hauler.Anticipated collection vehicles required for the quantities of wasteexpected range from pickup or stake-body trucks up to roll-offs. Front endor rear end loading packer trucks are expected to be used primarily.Larger capacity modified rendering trucks could also be used for largergenerators.
SSO pickup from toters depends on whether the toters are emptiedcurbside into the collection vehicle or taken full and exchanged with emptytoters. Collection vehicles could be as simple as a pickup or stake-bodytruck for collection of full toters and exchange with empty toters. Otheroptions include rear loading packer trucks for manual emptying of toters oruse of mechanical side arms for automated loading curbside.

Oneida-Herkimer Solid Waste Authority Source-Separated Organics Feasibility Study
260.055.001/3.17 - 13 - Barton & Loguidice, D.P.C.
For generators requiring front load dumpsters for collection(approximately 550 pounds to 4.7 tons generated per week), front endloading garbage trucks will be required for SSO collection. Odor control ismore difficult with the use of dumpsters for larger generators. Onepotential solution is the use of suction for waste collection. Vacuum hoseadaptations to collection vehicles would remove nearly all liquid with theSSO so as to prevent significant odor issues. As previously discussed,collection in bags is another potential solution for odor control whileretaining moisture. Use of multiple toters and/or multiple collections perweek is also an option for larger generators to limit odors as well asstreamline operations through the use of the same equipment andcontainers for every generator. Generators larger than 4.7 tons of SSOper week, would require roll-offs or compactors for SSO collection,however none are anticipated based on current data collection andestimates.
Factors impacting transfer station design include required truckclearances and methods for unloading. Both front end loading, rear endloading, and roll-off trucks require 25’ of vertical clearance and varyinglateral clearances. Front end loading vehicles require 16 feet-wide lateralclearance and 52-feet of service length for unloading and backing out.5Rear loading waste trucks unload by pushing waste out the back using apush plate and are anticipated to have similar clearance requirements.Roll-offs require 10 feet-wide lateral clearance and up to 75-feet of servicelength for unloading. Since the type of waste collection equipment isunknown, the maximum clearance requirements for front and rear-loadtrucks will be used for the SSO receiving area design. Roll-offs are notanticipated to be needed for commercial SSO collection.
3.2.4 Other Design Considerations
Although the processing equipment will include a step fordepackaging and/or removal of contamination, especially if use of bags forcollection is implemented, measures will still need to be taken to limitcontamination at the source. Although biodegradable bags have beensuccessfully used in collection for anaerobic digester feedstock, significanteducation for generators will need to be implemented to ensure the correct
5 Enclosure and Facility Design Guidelines for Refuse and Recycling Containers, City of WestSacramento, California, October 2010. Available at:http://www.cityofwestsacramento.org/civica/filebank/blobdload.asp?blobid=6013. Accessed October2016.

Oneida-Herkimer Solid Waste Authority Source-Separated Organics Feasibility Study
260.055.001/3.17 - 14 - Barton & Loguidice, D.P.C.
bags are used or to ensure removal of contaminants.6,7 Significantcontamination in the organics will cause issues for processing equipment.If excessive contamination is present, the processing equipment may notbe able to remove unacceptable materials in their entirety and may resultin contamination of the feedstock stream to the digester, or damage to theprocessing equipment. Certain hard or uncrushable materials such asrocks, pipes, etc. will not be able to be processed and could result inequipment damage.8 Other materials, such as glass, could be processedwith the SSO without damage to the equipment but would be undesirablein the anaerobic digesters. Estimates of the type and quantity ofcontamination will be necessary in order to properly size processingequipment as well as assess the tip fee for processing and disposal of theresidue at the landfill. Although the type and quantity of contamination willvary, estimates typically range from 5 to 10% by weight and could be asmuch as 20% by weight of incoming SSO9,10,11.
An important factor for minimizing contamination is education.Training by Authority staff should be implemented for each generator inorder to outline proper procedures for SSO disposal and identifyacceptable and unacceptable materials for disposal with SSO. Sufficienteducational information should be made available on or near the collectioncontainers to maximize the prevention of contamination at the source. Thiscould include signage, toter or dumpster labels, or cut sheets withacceptable materials. Additionally, haulers and equipment operatorsshould be trained on identification and safe removal of contamination, ifpossible, at all stages of collection and receipt prior to processing.Education on acceptable and unacceptable materials for SSO collection
6 Anaerobic Digestion of Compostable Bags, BioCycle, Vol. 54, No. 10, p. 40, October 2013. Available at:https://www.biocycle.net/2013/10/25/anaerobic-digestion-of-compostable-bags/. Accessed November2016.7 Performance Evaluation of Environmentally Degradable Plastic Packaging and Disposal Food ServiceWare – Final Report, Chico Research Foundation, California State University, June 2007. Available at:http://www.calrecycle.ca.gov/Publications/Documents/Plastics/43208001.pdf. Accessed November 2016.8 Personal correspondence with EV New England sales representative Corey Plucker via email, regardingScott Equipment Turbo Separator. September 13, 2016.9 Technical Document on Municipal Solid Waste Organics Processing, Environment Canada, 2013.Available at:http://www.compost.org/English/PDF/Technical_Document_MSW_Organics_Processing_2013.pdf.Accessed September 2016.10 Managing Compostable Bags at Anaerobic Digestion Plants, BioCycle, Vol. 53, No. 9, p. 37, September2012. Available at: https://www.biocycle.net/2012/09/18/managing-compostable-bags-at-anaerobic-digestion-plants/11 Anaerobic Digestion of Biodegradable Organics in Municipal Solid Waste, Shefali Verma, ColumbiaUniversity, May 2002. Available at:http://www.compost.org/CCC_Science_Web_Site/pdf/Biogas/anaerobic%20Digestion%20of%20Biodegradable%20Organics%20in%20MSW.pdf. Accessed September 2016.

Oneida-Herkimer Solid Waste Authority Source-Separated Organics Feasibility Study
260.055.001/3.17 - 15 - Barton & Loguidice, D.P.C.
and processing has been proven to be an important factor in thesuccessful implementation of similar programs12,13.
Another factor potentially impacting processing system design isthe peak waste generation rate. Data available to estimate commercialSSO generation rates is limited, and currently is available only as annualtotals. However, waste will not be generated and collected daily at theaverage daily tonnage based on the annual average tonnage; peaks ingeneration or collection will occur and will need to be processed in atimely manner. Operational days following holidays, long weekends, orevents will likely experience greater waste quantities. Peaks could alsooccur after weekends, when grocery stores and restaurants remain open,but haulers do not operate. Waste generation from schools will be limitedprimarily to fall, winter, and spring, truncating the number of days overwhich their yearly tonnage would be generated and collected. Peaks ingeneration would need to be factored into the sizing of equipment tomaintain functionality during periods of greater waste generation whileminimizing the required storage.
12 Source Separated Organic Materials Final Report, Town of Groton and Town of Stonington,Connecticut, July 2005. Available at:http://www.ct.gov/deep/lib/deep/compost/compost_pdf/groton_stonington_ssom_final_report.pdf.Accessed September 2016.13 Assessment of Residential Source Separated Organics Collection Options – A Study for the City ofMinneapolis, Foth Infrastructure & Environment, LLC, October 2013. Available at:http://www.ci.minneapolis.mn.us/www/groups/public/@publicworks/documents/webcontent/wcms1p-121817.pdf. Accessed September 2016.

Oneida-Herkimer Solid Waste Authority Source-Separated Organics Feasibility Study
260.055.001/3.17 - 16 - Barton & Loguidice, D.P.C.
4.0 Source-Separated Organics Characterization
4.1 Predicted Organics Volume
Although data from the specific waste targeted for collection is currentlyunavailable, significant literature is available from other SSO collection systemsregarding the properties of food waste to estimate the volumes to be processed.Using the estimated collected tons of SSO along with a number of assumptionsfrom literature and the operational hours of the ETS, the hourly throughput for theproposed processing equipment, including moisture addition, can be estimated.See Table 3 for assumptions and calculations. Based on the range of targetedmaterial of 5,000 to 21,000 tons per year and the estimated moisture addition ateach tonnage, the expected throughput for the processing equipment sizing istwo (2) to nine (9) tons per hour. Moisture addition totaling approximately 0.23gallons per minute during operation for every 1,000 tons of material processedwill be required in order to achieve a consistency of approximately 10% solids, asrequested by WPCP for anaerobic digestion and to be able to pump the material.This will increase the volumetric flow to approximately 770 to 3,400 gallons peroperational hour of the processing equipment. Moisture addition will be variablebased on incoming material consistency. In order to not upset digester functionwith this high strength waste stream, a constant flow rate to the anaerobicdigester complex should be maintained. This will require one or more tanks forstorage and equalization, to allow for a constant, lower pump rate to the digestercomplex during non-operational hours rather than batch dosing.
Table 4 - Anticipated Source-Separated Organic Waste Volumes

Oneida-Herkimer Solid Waste Authority Source-Separated Organics Feasibility Study
260.055.001/3.17 - 17 - Barton & Loguidice, D.P.C.
4.2 Predicted Organic Strength
The organic strength of a waste stream is a key component in theefficiency of anaerobic digestion. Literature values for organic strength varygreatly for different types of feedstocks. Organic strength is typically measured interms of the percent volatile solids (%VS) or the biodegradable organic fraction ofa feedstock. The organic fraction is typically expressed as a weight percentageor a ratio of volatile solids to total solids (VS/TS). Food waste is considered ahigh strength waste, as it has a high ratio of VS to TS. The anticipated VScontent of the SSO targeted for diversion is 4.25 to 9.0% VS, based onapproximately 5 to 10% TS of the SSO waste stream and 85 to 90% VS/TS. Thiswill change with the addition of moisture in order to pump the material to theanaerobic digester complex. In order to achieve a pumpable consistency withless than 10% TS, the addition of moisture with no added organic loading couldlower the organic strength. However, SSO material is not a homogeneousmixture and the organic strength is expected to vary based on the type of wastereceived. Digesters are sensitive to changes in organic strength, so the flow ofthis high strength material to the anaerobic digester will be designed to be asnear constant as possible. In comparison, the primary digester feedstock at theWPCP is municipal sludge which is typically homogeneous and has lowerorganic strength, ranging from 3 to 5% TS and 75 to 85% VS/TS. However,compared to the large quantity of sludge the anaerobic digesters are sized tohandle, the estimated quantity of SSO is small and unlikely to disrupt anaerobicdigester function.

Oneida-Herkimer Solid Waste Authority Source-Separated Organics Feasibility Study
260.055.001/3.17 - 18 - Barton & Loguidice, D.P.C.
5.0 SSO Processing
5.1 Process Flow
The critical components in the process flow for commercial SSOprocessing for anaerobic digestion are depackaging/contamination removal,particle size reduction, emulsification, flow equalization, and transportation.These process steps can be accomplished using any number of differentequipment or methods, depending on the type of system or manufacturer chosenas well as the desired feedstock consistency at the anaerobic digester. Theproposed system will include a waste unloading area for collection vehicles, aScott Equipment Turbo Separator Model T30 including liquid manifold andloading hopper, holding tank(s) for flow equalization, and pump for liquidconveyance to the anaerobic digester. The Turbo Separator T30 unit will performthe depackaging, particle size reduction, and emulsification operations requiredfor feedstock preparation. The end product will be piped directly into a holdingtank in order to allow for flow equalization, so that large batches aren’t pumpeddirectly to the anaerobic digester, which could disrupt the system. The feedstockwill be pumped out at a near constant rate, or as directed by the WPCP, to thesludge receiving building at the WPCP. A schematic of the proposed processflow is included as Figure 2.
5.2 Building Design and Layout
A separate area of the transfer station will be required to unload and sortcollected SSO for processing (see Figure 3 – Conceptual Building Floor Plan). Itis proposed to construct an addition to the current transfer station building forSSO processing. The building will need to be insulated and heated to maintainconsistency of the material and the function of the processing equipment duringthe winter. This will consist of a sloped tip floor for collection vehicle unloadingand push wall for the loading of the processing equipment. The tip floor will needto be large enough with sufficient horizontal and vertical clearance for theexpected collection vehicles to unload indoors. Given the high moisture contentexpected, the tip floor will need to be sloped and equipped with a sump or drainfor liquid collection. An epoxy coating may be necessary for any storage orstaging areas to protect the tip floor from deterioration by the commercialorganics materials. Collected liquid could be returned to the system through theliquid manifold in the processing equipment for moisture addition. A push wall willbe necessary for loading equipment to pick up unloaded waste to load into theTurbo Separator hopper for processing. Typical transfer station equipment, suchas a bucket loader or skid steer, will be used to consolidate unloaded waste andload the processing equipment. Given the small expected amount of commercial

Oneida-Herkimer Solid Waste Authority Source-Separated Organics Feasibility Study
260.055.001/3.17 - 19 - Barton & Loguidice, D.P.C.
SSO compared to the total waste received at the ETS, no additional mobileequipment is anticipated to be needed to maintain current operations. Sufficientclearance around the recessed tip floor and processing equipment will benecessary for maintenance and travel access for loading equipment. To theextent practicable, space for redundant equipment should be left in case ofunexpected SSO quantities or future expansion. Additional building designconsiderations include a truck loadout for processed SSO slurry in the event theWPCP or the pumping system cannot accept the processed SSO. Potential NewYork State organics recovery legislation would mandate intermediate facilities toensure organics are not disposed of in a landfill or at a waste-to-energy facility.
5.3 SSO Processing Equipment
5.3.1 Turbo Separator
The primary processing equipment required for the commercialSSO will be the Scott Equipment Turbo Separator Model T30, which willact as a depackager, shredder, and grinder. Several other manufacturersexist for similar equipment and systems. A brief summary of availableequipment for the processing of organics for anaerobic digestion includingequipment specifications and cost is included in Appendix A. Alternativelya custom system could be developed out of individual components ifdesired. For the purposes of this feasibility study, the Turbo Separator waschosen for its turn-key nature, ease of use, and known success fororganics processing at similar facilities. See Figure 4 – ProcessEquipment Schematic for more detail on the Turbo Separatorcomponents.
The Turbo Separator consists of several components to achievethe desired feedstock consistency. These include a loading hopper,several conveyors for material movement through the system, the mainTurbo Separator unit, liquid manifold, and organics pump or conveyor forremoval of material from the system. The Turbo Separator can be batchfed or fed continuously, depending on incoming tonnage and frequency ofhauler deliveries. SSO will be loaded into the hopper with a skid steer orbucket loader. Haulers could also tip directly into a below grade pit whichfeeds the system in place of the hopper to avoid double handling ofmaterial. However, this is not recommended. The loading of organics byETS staff into the processing equipment will allow for quality controlbetween the delivery and processing of waste. Staff would be able toidentify unauthorized items or materials that may damage equipment inorder to remove them prior to processing, which would not be possible if

Oneida-Herkimer Solid Waste Authority Source-Separated Organics Feasibility Study
260.055.001/3.17 - 20 - Barton & Loguidice, D.P.C.
haulers tip directly into the system. Waste loaded into the hopper feedsinto a twin screw infeed conveyor to reduce particle size and direct wasteinto the main compartment, the Turbo Separator.
The Turbo Separator is the main component of the processingsystem. Its primary function is particle size reduction and emulsification.The Turbo Separator also separates and removes the packaging and/orcontamination from the organics stream. The main unit can be equippedwith a liquid manifold for moisture addition at this step and other steps ofthe process if necessary. Although not required, in the case of processingSSO for digester feedstock, the addition of moisture will facilitate theemulsification and ability to pump the feedstock, if the moisture content ofthe incoming materials is not sufficient on its own. Controls on theprocessing equipment will assess the composition of the material output inorder to adjust the moisture content as necessary. The processed SSOwill be further mixed in the storage tank to maintain consistency. Currentestimates for moisture addition are approximately 0.23 GPM of liquideffluent or clean water for every 1,000 tons per year of material receivedat the facility to achieve the desired moisture content greater than 90%.Graywater from the WPCP may be used for moisture addition if feasible.Actual moisture addition will depend on actual waste quantities receivedand the consistency of the incoming material. The processed organicmaterial then passes through a screen, which can be customized to thedesired particle size for anaerobic digestion. Organics are piped directlyout the bottom of the system to a pump for conveyance or can be fed viasingle screw conveyor to a storage tank or vessel prior to pumping forremoval from the system. It is recommended that the Authority employ theorganics pump option as the final step in the process, so that organics canbe conveyed into one of the storage tanks for equalization prior totransport to the WPCP, rather than batch loading to the anaerobicdigesters which could disrupt their function.
The storage tanks will be located above grade and inside thebuilding. Two 25,000 gallon tanks are estimated to be required for threedays of processed SSO storage as well as for redundancy for tankmaintenance and cleaning. In order to maintain the pumpable consistencyof the processed SSO for anaerobic digestion, the tanks will need to beequipped with mixing capabilities. A submersible pump will conveyorganics at a constant rate of approximately 10 to 15 GPM, or as directedby the WPCP, to the anaerobic digester complex. Organics will bepumped through a 4” force main directly to the septage receiving buildinglocated at the anaerobic digester complex. The tanks will also be

Oneida-Herkimer Solid Waste Authority Source-Separated Organics Feasibility Study
260.055.001/3.17 - 21 - Barton & Loguidice, D.P.C.
equipped with a loadout system for transportation by truck in case of pumpdowntime or in the event the WPCP cannot accept the processed SSOmaterial, so that it can be transferred to other anaerobic digester facilities.
Packaging and contamination is removed from the Turbo Separatorapart from the organic material. Waste material is conveyed via singlescrew conveyor out of the system for disposal. The conveyor wouldtypically terminate over a dumpster or other means of waste collection inorder to collect the plastics for disposal or baling for recycling. Due to theproximity of the organics processing facility to the ETS tip floor, theexisting tip floor push wall could be modified so that the waste packagingcould be conveyed through the wall separating the two areas fordeposition of waste plastics directly onto the tip floor. This would eliminatethe need to transfer the material to the tip floor using mobile equipment,which would increase the time available for equipment to load the organicsprocessing equipment, as well as cut down on traffic between the organicsprocessing facility and the tip floor.

Oneida-Herkimer Solid Waste Authority Source-Separated Organics Feasibility Study
260.055.001/3.17 - 22 - Barton & Loguidice, D.P.C.
6.0 Capital Cost
6.1 Building
The largest expenditure anticipated for the SSO processing facility is thebuilding addition and modifications to the ETS. Some demolition of the existingbuilding could be required in order to construct the addition for the SSOprocessing equipment. The building size is estimated at 4,900 square feet for thebuilding structure, floor slab, and foundation. The building will also require a pushwall for the transfer station equipment to load the SSO processing equipment.The total building capital cost estimate is $815,000. See Appendix B – CapitalCost Estimate for more detail on individual components.
6.2 Equipment
Estimates for the capital cost of the SSO processing equipment rangebased on the equipment manufacturer, desired process steps, and arrangementof equipment. Estimates from EV New England, a Turbo Separator distributor,range based on processing equipment model and added components, if any. Therecommended setup for the Authority’s SSO processing equipment is estimatedat $239,660 for the T30 with organics conveyor, pump (up to 240 GPM), andspares kit. Additional estimates for processing equipment include SSOprocessing equipment installation and piping and loading equipment. It isanticipated that the existing equipment at the transfer station will be sufficient foroperation and loading of the SSO processing equipment, but additionalequipment is included in the cost estimate in case of unexpected participation orwaste quantities received. SSO processing equipment capital cost estimates total$550,000. Refer to Appendix B – Capital Cost Estimate for more detail.
6.3 Sanitary Sewer Upgrades
Additional work required as part of the SSO processing project includessanitary sewer upgrades. As part of upgrades to the WPCP, the septagereceiving building will be relocated adjacent to the new digester complex,requiring relocation of the sanitary sewer line from the ETS. Manholes would beinstalled at that time along the force main for access in case of issues with theaddition of organics pumping. Additional upgrades would include upgrades to thepump for increased capacity and the addition of one or more tanks forequalization of flows from the SSO processing equipment. Total capitalanticipated for sanitary sewer upgrades is estimated at $334,000. See AppendixB – Capital Cost Estimate for additional information.

Oneida-Herkimer Solid Waste Authority Source-Separated Organics Feasibility Study
260.055.001/3.17 - 23 - Barton & Loguidice, D.P.C.
6.4 Climate Smart Communities Grant
Oneida County has been awarded funding through the NYSDEC’s ClimateSmart Communities Grant through the New York State Consolidated FundingApplication for this project. This grant program offers a 50-50 match formunicipalities to implement climate change adaptation or mitigation projects,which includes food waste diversion. Although the Authority will be responsiblefor construction and operation of the facility, Oneida County applied for the grantgiven its significant interest in and support of the project, as it could greatlyimprove operation of the anaerobic digester complex at its WPCP. The grantbudget includes a conservative contingency of 25% as well as engineering,finance, legal and administrative fees estimated at 25% of the total. Thesecomprise a significant portion of the capital cost estimate due to the uncertaintiesinvolved in the project, including quality and quantity of waste received, quality offeedstock required for the anaerobic digesters, and local hauler and generatorparticipation and support. A cost estimate for the entire project, including thebuilding addition, SSO processing equipment, and sanitary sewer upgrades, andcontingencies but excluding this feasibility study, was developed totaling$2,655,000. The grant awarded to Oneida County, totals of 50% of the totalproject up to $1,327,500 with a 50% match from the Authority for the remainder.

Oneida-Herkimer Solid Waste Authority Source-Separated Organics Feasibility Study
260.055.001/3.17 - 24 - Barton & Loguidice, D.P.C.
7.0 Operations and Maintenance (O&M) Cost Estimate
In combination with the capital costs, the O&M costs to operate the SSOprocessing system will determine the cost of operations for the commercial SSOprocessing facility. In order to encourage participation in the source separation andseparate collection of organics, the future tip fee will likely need to be lowered fromtypical MSW, but how much will be determined by the costs to run the system. Theoperations and maintenance costs quantified include building heating, electricity tooperate equipment, and equipment maintenance.
7.1 Building O&M Costs
Building heating is required for freeze protection and will be minimal. Thebuilding heating load was modeled using Hourly Analysis Program (HAP) HVACSystem Design Software. Inputs to the model include building size, heating type,and desired interior temperature. The building size as currently designed is 70’by 70’ heated with natural gas to an interior temperature of 50°F. The interiortemperature is for freeze protection only, so higher temperatures will result inlarger heat loads and higher costs. No cooling was modeled for the building.Realistic assumptions for building materials and door sizes were input tocomplete the model. The estimated heating load for the building throughout theyear is 633 therms. At the facility’s natural gas cost of $2.55/therm, the totalannual cost to heat the building is $1,614.15. This will be nearly constantregardless of the amount of SSO accepted
Consideration could also be given to the feasibility of using waste heatfrom the anaerobic digester complex for building heating. Some, if not all, of theheat recovered from the anaerobic digesters has been allocated for use at theWPCP. However, discussions with WPCP for any excess waste heat above therequired uses at the plant could be pursued in lieu of natural gas heating at theprocessing facility for further cost and emissions savings.
7.2 Equipment
The SSO processing equipment will be operated using electricity. Theelectrical demand requirements vary for each tonnage in the expected range andare summarized in Table 5 below. The power requirements for individualcomponents of the Turbo Separator were provided by EV New England, theequipment representative. Operational hours are assumed based on thetonnages and an assumed processing rate of eight (8) tons per hour over the sixoperational days per week. The pump is assumed to run nearly constantly toprovide a continuous feed to the anaerobic digesters. Additional assumptions forlighting, receptacles, and miscellaneous mechanical and HVAC equipment were

Oneida-Herkimer Solid Waste Authority Source-Separated Organics Feasibility Study
260.055.001/3.17 - 25 - Barton & Loguidice, D.P.C.
included based on the building size and purpose and do not vary with tonnage.Based on electrical usage costs at the facility of approximately $0.11/kWh, theannual electrical costs range from $14,989.01 to $23,017.60.
Table 5 - Estimated Electrical Loads
BuildingAncillary Loads
SF W/SF kW Hours/Week Hours/Year KWHr/Year $/year
Lights 4,500 1.2 5.4 60 3,120 16,848 $1,853.28Receptors 4,500 1 4.5 60 3,120 14,040 $1,544.40Misc.Mechanical/HVAC 4,500 1 4.5 60 3,120 14,040 $1,544.40
Pump Loading HP kW Hours/Week Hours/Year KWHr/Year $/yearPump(up to 240 gpm) 10 7.5 168 8,736 65,171 $7,168.76
ProcessEquipment
Loads
HP kW Sensitivity AnalysisSSO Tonnages
Twin InfeedConveyor 7.5 5.6 Tons/Yr 5,000 10,000 15,000 20,000Twin InfeedConveyor 7.5 5.6 Hrs/Wk 9.5 19.5 29.0 36.0Waste PackagingConveyor 3 2.2 KWHr/Yr 26,165 53,708 79,873 99,152Separator 50 37.3 $/Year $2,878.17 $5,907.83 $8,786.00 $10,906.76OrganicsConveyor 3 2.2
Estimated Yearly Electrical Operations Cost
Total 71 52.9 $14,989.01 $18,018.67 $20,896.84 $23,017.60
Additional O&M cost considerations include equipment maintenance. Theprimary maintenance costs considered are parts replacements. Typical spareparts replacements are the paddles and screens inside the main Turbo Separatorunit. With an assumed replacement frequency of eight (8) paddles per year andeight screens every other year, as recommended by the manufacturer, theannual O&M costs for spare parts range from $860 to $5,072 with an average of$3,000 per year. Additional maintenance includes gear oil replacement forconveyors at approximately 5 gallons and $100 annually and a small amount ofbearing lubricant at approximately $10 annually.

Oneida-Herkimer Solid Waste Authority Source-Separated Organics Feasibility Study
260.055.001/3.17 - 26 - Barton & Loguidice, D.P.C.
7.3 Commercial SSO Total Costs
The capital and O&M costs, as well as the disposal cost for organics to theWPCP and the handling and disposal of waste residue removed from the SSOstream during processing, all factor in to the cost of operations for the SSOprocessing facility. See Appendix C for a summary of the capital and O&M costsused to develop the future tip fee at varying tonnages. For comparison, Table 6was developed with data from other New York State Planning Units with similarorganics diversion programs. At the time of this report, no known mandatoryCounty-wide SSO diversion programs were in place in New York State usinganaerobic digestion, but others exist using composting in Onondaga, Tompkins,and Ulster Counties. Due to the lower MSW tip fee in the Authority’s service areacompared to the other counties with SSO diversion programs, the use ofcomposting for recycling rather than anaerobic digestion, and the nature of theprogram (public vs. private), the difference in tip fee is less than in thecomparison counties. Composting generally has fewer O&M requirements andcosts associated with operations, resulting in lower tip fees for countiesimplementing composting as a means of organics processing. Private facilitiesgenerally operate in a larger service area than public facilities and may haveaccess to more tonnage outside the solid waste planning units. In addition,counties with higher MSW tip fees may be able to subsidize other programs withMSW revenue in order to keep SSO tip fees lower and encourage participation inareas where diversion is not mandated. Table 6 is a summary of the PlanningUnit comparison for other SSO diversion programs in New York State.

Oneida-Herkimer Solid Waste Authority Source-Separated Organics Feasibility Study
260.055.001/3.17 - 27 - Barton & Loguidice, D.P.C.
Table 6 - New York State Planning Units Organics Tip Fee Comparison
Table 6 - New York State Planning Units Organics Tip Fee ComparisonPlanning Unit Authority OCRRA Tompkins Ulster
Diverted Organics Type Commercial Residential/Commercial
Residential/Commercial
Commercial
Method for Organics Recycling AnaerobicDigestion
Compost Compost Compost
Facility Type Public Public Private PublicMSW Tip Fee ($/ton) $64.00 $84.00 $85.00 $103.00Food Waste Tip Fee ($/ton) TBD $35.00 $50.00 $20.00Difference in Tip Fee TBD 58% 41% 81%Planning Unit MSW andOrganic Waste (2015 PUReports)
179,793 347,096 58,335 123,758
Estimated CommercialOrganics Available forDiversion1,2
20,842 40,235 6,762 14,346
Recycled Food Waste (tons)Handled by Planning Unit(2015 PU Reports)
216 6,316 117.58 670.27
Recycled Food Waste (tons)Total within Planning Unit(2015 PU Reports) 17,112 97,500 9,0453 2,0334
Planning Unit Diversion Rate(recycled food waste handledby PU / estimated commercialorganics available in PU) 1% 16% 2% 3%Notes:1NYSDEC Beyond Waste, 46% of MSW is commercial/institutional/industrial, 54% is residential.2NYSDEC Beyond Waste, Appendix H, Table H-2: 25.2% of MSW from commercial entities/institutions is food scraps3Private facility – may import waste from outside of County.4An estimated 50% of food waste handled within the Planning Unit is imported from outside of Ulster County.

Oneida-Herkimer Solid Waste Authority Source-Separated Organics Feasibility Study
260.055.001/3.17 - 28 - Barton & Loguidice, D.P.C.
8.0 Impacts to Oneida-Herkimer Regional Landfill
Removal of SSO from the waste stream for anaerobic digestion rather thanlandfill disposal will have several impacts to the existing solid waste managementinfrastructure. Airspace consumption will decrease on an annual basis and extend thelife of the landfill from 1 to 7 years depending on the volume of organics recovered.Diversion of organics from the landfill will decrease the moisture content andbiodegradable fraction of the waste mass, resulting in less settlement and reducedlandfill gas generation and energy production at the LFGTE Facility. Reduction in peaklandfill gas generation is approximately 200 scfm from existing conditions during the first20 years of SSO processing operations.
8.1 Airspace Utilization
Removal of some organics from the waste stream will conserve landfillspace and increase the landfill’s site life. Since the Authority operates under flowcontrol and a consistent service area, it is assumed that the diverted SSO will notbe replaced by another waste stream to be landfilled as would be the case at aprivate site. However, changes in operations at the WPCP will result in additionalwaste material from the current quantity of sludge incinerator ash requiringdisposal. Based on the range of commercial SSO tonnages available fordiversion, 5,000 to 21,000 tons per year, and typical airspace consumption, thesite life of the landfill will increase by 1 to 7 years due to the estimated annualtonnage reduction. This is based on the assumption that no additional wastestream will replace the diverted organics with the exception of the sludge fromthe anaerobic digesters, which is proposed to be landfilled. The sludge producedin the anaerobic digester complex is an increase in tonnage from the currentincinerator operations. Additional sludge production from the anaerobic digesterscompared to current WPCP operations is not related to this project.
8.2 Landfill Stability
By removing a portion of the SSO from the waste mass, lessdecomposition will occur over time following waste placement, resulting inimproved landfill stability and less settlement. Some moisture and organics willbe replaced by the addition of digested sludge from the WPCP, but theseamounts are not significant compared to the loss of organics and moisture fromthe diverted SSO. The in-place density of the waste will not change assignificantly over time as when organics are present, due to lower moisturecontent and a lower degradable organic content. The high moisture content ofthe organics percolates through the waste mass and is removed as leachate.The organic fraction decomposes into landfill gas, with the majority extractedfrom the landfill for energy recovery or emitted fugitively. With the removal of a

Oneida-Herkimer Solid Waste Authority Source-Separated Organics Feasibility Study
260.055.001/3.17 - 29 - Barton & Loguidice, D.P.C.
portion of this waste as leachate and landfill gas, the waste will take up a smallervolume than when originally placed in the landfill. This is the primary cause ofwaste mass settlement, which will be reduced with the diversion of someorganics. A reduction in settlement will increase landfill stability and maintainlandfill cover system integrity once the final cover system is constructed.
8.3 Landfill Gas Production
The Oneida-Herkimer Regional Landfill currently operates an active gascollection and control system to manage landfill gas generated at the site. Gas iscollected from the landfill through a system of vertical and horizontal collectionwells under vacuum and is conveyed to the LFGTE facility, where it is destroyedin two internal combustion engine generator sets to generate electricity. TheLFGTE facility has been operational since 2012. The site also employs two flaresas back-up combustion devices during engine maintenance or other LFGTEdowntime.
Diversion of commercial SSO from the landfill will decrease the moisturecontent and biodegradable fraction of the waste mass, resulting in lower gasproduction. Although not all organics will be diverted from the landfill, the shapeof the facility’s gas curve could also change due to the change in moisturecontent, which impacts key landfill gas generation modeling parameters includingmethane generation rate (k) and methane generation potential (Lo). Gasgeneration from the landfill was analyzed for the first 20 years of operation of theSSO processing facility, from 2018 through 2037. The existing waste-in-placelandfill gas generation model uses a cumulative total of individual gas modelsdeveloped for each putrescible waste stream accepted at the landfill: MSW, 50%of the construction and demolition debris (C&D), and sewage sludge. Wastequantities are based on actual waste placed through 2015 and projected wastebased on the 5-year average for the remaining years. Modeled sewage sludgeincludes an additional 9,500 tons per year beginning in 2018 with the operation ofthe anaerobic digesters. Modeling parameters for each putrescible waste type forthe existing landfill gas curve use site-specific values based on historical landfillgas generation and collection data and are included below:
MSW:∂ Methane Generation Rate Constant (k) = 0.077/year∂ Methane Generation Potential (Lo) = 155 m3/Mg
C&D (50% putrescible):∂ Methane Generation Rate Constant (k) = 0.04/year∂ Methane Generation Potential (Lo) = 40 m3/Mg

Oneida-Herkimer Solid Waste Authority Source-Separated Organics Feasibility Study
260.055.001/3.17 - 30 - Barton & Loguidice, D.P.C.
Sewage Sludge:∂ Methane Generation Rate Constant (k) = 0.185/year∂ Methane Generation Potential (Lo) = 25 m3/Mg
Under current projections and waste acceptance rates, final wasteplacement and closure would occur in 2084. The peak landfill gas generationduring the 20-year analysis period is 3,083 scfm in 2037. This results in anestimated peak collection of 2,312 scfm, assuming a collection efficiency of 75%.
If commercial SSO diversion is implemented, changes in moisture contentand organic fraction will alter the modeling input parameters for landfill gasgeneration and change the shape of the gas curve. However, not all organics willbe diverted from the waste mass. The projected landfill gas generation modelfollowing organics diversion was developed by subtracting the estimated gasgenerated from the diverted organics from the existing waste-in-place landfill gasgeneration model. A model was developed for each increment in the range oftonnages analyzed from 5,000 to 21,000 tons per year of diverted SSO. Modelingparameters for the proposed diverted organics scenarios are included below:
∂ Methane Generation Rate Constant (k) = 0.185/year∂ Methane Generation Potential (Lo) = 75 m3/Mg
Landfill gas generation curves were developed for each increment in theestimated range of SSO available for diversion using the modeling parametersabove over the same 20-year period as existing conditions. Under the range oftonnages analyzed and projected waste acceptance rates, final waste placementand closure could occur from 2085 to 2091. The peak landfill gas generationduring the 20-year analysis period occurs in 2037 and ranges from 2,886 scfmwith 21,000 tons per year of SSO diverted to 3,038 scfm with 5,000 tons per yearof SSO diverted. This results in an estimated peak collection ranging from 2,164scfm to 2,279 scfm, assuming a collection efficiency of 75%, which is theaverage reported collection efficiency for MSW landfills per the EnvironmentalProtection Agency’s Air Pollutant Emission Factors standard (AP-42). SeeAppendix D for a comparison of the landfill gas generation curves under eachscenario.

Oneida-Herkimer Solid Waste Authority Source-Separated Organics Feasibility Study
260.055.001/3.17 - 31 - Barton & Loguidice, D.P.C.
9.0 Permitting and Environmental Review
Several environmental review and permitting tasks will need to be undertaken forapproval of this project, including environmental review under SEQRA, a modification tothe transfer station’s existing Part 360 operating permit, and an International BuildingCode review.
Review under SEQRA has already been completed for the WPCP upgrades andanaerobic digesters, but will still need to be completed for the separate collection andprocessing of commercial SSO. It is anticipated that the Authority would be the LeadAgency for SEQRA and that an environmental assessment form (EAF) would need tobe completed for the project. Since this project is environmentally beneficial and will belocated primarily on properties already developed and allocated for solid wastemanagement and/or wastewater treatment, it is anticipated that this would result in anegative declaration. No environmental impact statement would need to be prepared.
Separate collection and processing of commercial SSO would also require amodification to the ETS Part 360 operating permit. Since this material is alreadycollected at the transfer station but will now be source-separated and processed, themodification should be minor. The project will at a minimum require an updated oradditional Operations & Maintenance Manual and Contingency Plan for the SSOprocessing.
Modifications to the ETS and construction of the building addition will requireInternational Building Code review in order to obtain a building permit, as with the recentbuilding addition at the ETS for bale storage. The addition will also require Departmentof State approval of the building permit. Since the type of activities performed at thefacility will not change significantly, it is not anticipated that the class of building willchange or will require any additional safeguards or engineering design from the existingstructures.
Oneida-Herkimer Solid Waste Authority Source-Separated Organics Feasibility Study
260.055.001/3.17 - 32 - Barton & Loguidice, D.P.C.
10.0 Conclusions and Recommendations
A commercial organics collection program will be feasible for integration with theWPCP anaerobic digesters with the tonnages available in the Authority’s service area,the receipt of grant funding from the NYSDEC, and the participation of wastegenerators, haulers, and the WPCP. The Authority is likely to pursue implementation ofa commercial SSO collection program based on the results of this study and the fundingavailable for capital investments. It is recommended that additional information bepursued regarding expected participation by generators and haulers, specificallyregarding waste quantities and collection methods and frequencies. The Authority plansto conduct a market study in 2017 with haulers who have participated in separateorganics collection to determine what they have experienced regarding the logistics andeconomics of such a program. Although grant money has been received, it is notrecommended to pursue a pilot program given the substantial capital investment forbuilding modifications and processing equipment. Operation of processing equipmentcould be piloted through manufacturer demos at the site, if desired, but the function ofthe equipment has already been proved through widespread industry use in areas withsimilar programs. Given the potential difficulties in collection for commercial organicsand the unknowns involved in the project, it is not recommended that source-separatedresidential organics diversion be pursued at this time. Following implementation of thecommercial SSO collection program, if residential SSO diversion is found to beeconomically viable, the Authority could implement a residential SSO pilot program atthat time to determine its widespread feasibility. The Authority will conduct the marketstudy to aid in project economics, refine the estimations of commercial organicsavailable for the project, and continue to monitor potential New York State legislationand its effects on a commercial SSO collection program as it proceeds withimplementation of the program.

Figures
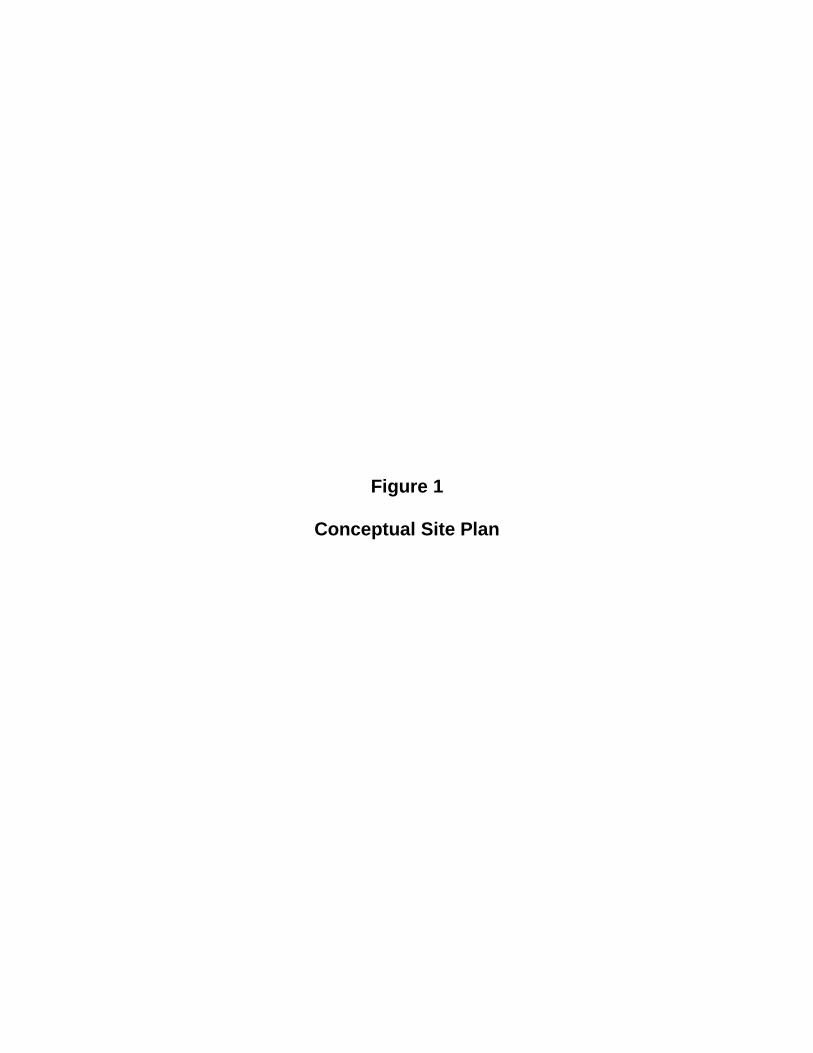
Figure 1
Conceptual Site Plan


Figure 2
Conceptual Process Flow Diagram


Figure 3
Building Floor Plan

PROPOSEDORGANICS
PROCESSINGBUILDING

Figure 4
Processing Equipment Schematic

30°
20'-0"240"
28'-10 12 "
346 12 "
8'-2"98"
30" 60"
8'-6"102"
25'-10 12 "
310 12 "
25°
16'-0"192"
12'-4 12 "
148 12 "
74"
33"
PRELIMINARY PLANT LAYOUT
D
C
B
AA
B
C
D
12345678
8 7 6 5 4 3 2 1
THIS DRAWING AND ALL DESIGNS, DETAILS, INVENTIONS ORDEVELOPMENTS COVERED THEREBY ARE CONFIDENTIAL ANDTHE EXCLUSIVE PROPERTY OF SCOTT EQUIPMENT COMPANY
WHICH RESERVES ALL PATENTS OR OTHER RIGHTS. COPYING, REPRODUCTION OR DUPLICATION, IN WHOLE OR IN PART, IS FORBIDDEN UNLESS EXPRESSLY AUTHORIZED BY SCOTT
EQUIPMENT COMPANY. THIS DRAWING AND ANY SUCH COPIESSHALL BE RETURNED WHEN REQUESTED AND USED SUBJECT TO
ABOVE CONDITIONS ONLY ON AUTHORIZED COMPANY WORK.
PROPRIETARY AND CONFIDENTIAL
DIMENSIONS ARE IN INCHESTOLERANCES:FRACTIONALANGULAR: MACH BEND TWO PLACE DECIMAL THREE PLACE DECIMAL
MATERIAL
FINISHSEE PARTS
DRAWN
CHECKED
ENG APPR.
MFG APPR.
Q.A.
SALES APPR.
DATENAME
TITLE:
SIZE
BDWG. NO. REV
WEIGHT: 16775.2SCALE: 1:70
UNLESS OTHERWISE SPECIFIED:
ALLEN T 7/23/2014
PRELIMINARY LAYOUT
SHEET 1 OF 1
3096 PLANT LAYOUT
DO NOT SCALE DRAWING
605 4th Avenue NWNew Prague, MN 56071
952-758-2591
CUST APPR.
JOB #

Appendices

Appendix A
Organics Processing Equipment Summary
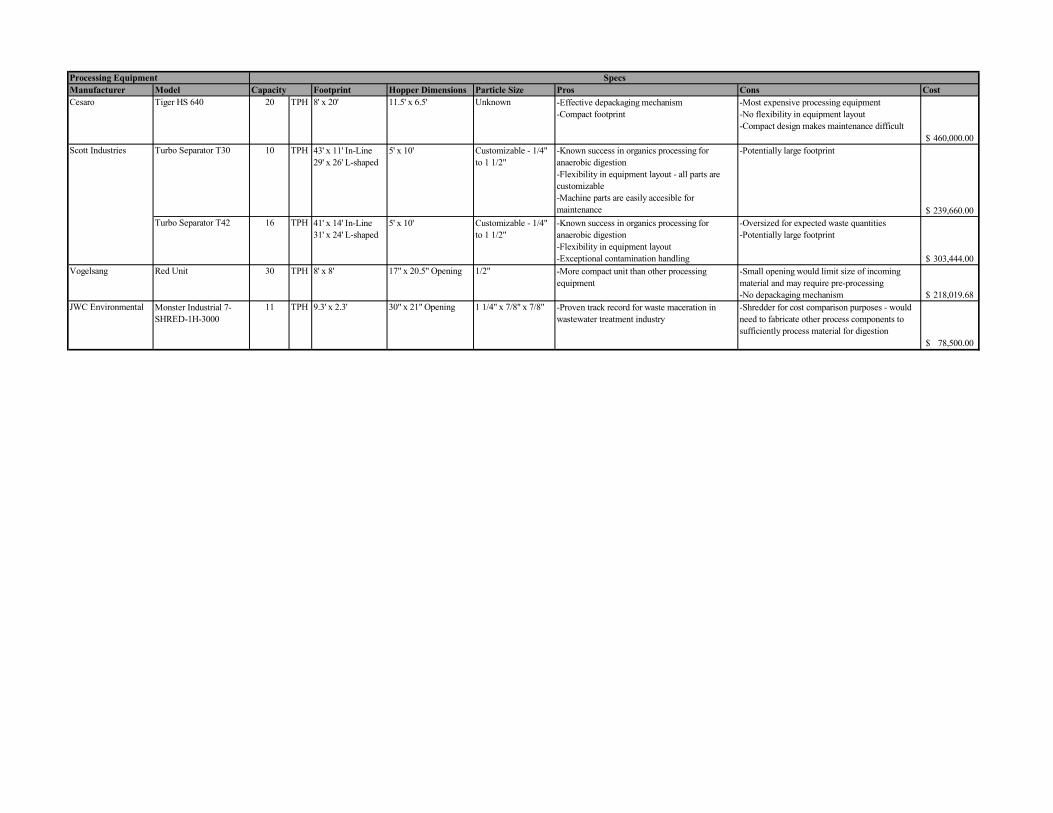
Manufacturer Model Footprint Hopper Dimensions Particle Size Pros Cons CostCesaro Tiger HS 640 20 TPH 8' x 20' 11.5' x 6.5' Unknown -Effective depackaging mechanism
-Compact footprint-Most expensive processing equipment-No flexibility in equipment layout-Compact design makes maintenance difficult
460,000.00$ Turbo Separator T30 10 TPH 43' x 11' In-Line
29' x 26' L-shaped5' x 10' Customizable - 1/4"
to 1 1/2"-Known success in organics processing for anaerobic digestion-Flexibility in equipment layout - all parts are customizable-Machine parts are easily accesible for maintenance
-Potentially large footprint
239,660.00$ Turbo Separator T42 16 TPH 41' x 14' In-Line
31' x 24' L-shaped5' x 10' Customizable - 1/4"
to 1 1/2"-Known success in organics processing for anaerobic digestion-Flexibility in equipment layout-Exceptional contamination handling
-Oversized for expected waste quantities-Potentially large footprint
303,444.00$ Vogelsang Red Unit 30 TPH 8' x 8' 17" x 20.5" Opening 1/2" -More compact unit than other processing
equipment-Small opening would limit size of incoming material and may require pre-processing-No depackaging mechanism 218,019.68$
JWC Environmental Monster Industrial 7-SHRED-1H-3000
11 TPH 9.3' x 2.3' 30" x 21" Opening 1 1/4" x 7/8" x 7/8" -Proven track record for waste maceration in wastewater treatment industry
-Shredder for cost comparison purposes - would need to fabricate other process components to sufficiently process material for digestion
78,500.00$
Processing Equipment SpecsCapacity
Scott Industries

Appendix B
Capital Cost Estimate

PROJECT TITLE: 260.055.001
July 28, 2016
BKP
ITEM ITEM UNIT NO. DESCRIPTION QUANTITY UNIT PRICE TOTAL
Transfer Station Construction1 Mobilization/Demobilization 1 LS $35,000.00 $35,000.002 Selective Bldg. Demolition 1 LS $30,000.00 $30,000.003 9" Concrete Floor Slab 4500 SF $30.00 $135,000.004 Foundation Walls 40 CY $400.00 $16,000.005 Building 4500 SF $125.00 $562,500.006 Steel Push Wall 1 LS $36,500.00 $36,500.00
TRANSFER STATION SUB-TOTAL $815,000.00
SSO Processing Equipment1 Scott Industries Model T42 Turbo Separator 1 LS $350,000.00 $350,000.002 Installation & Piping 1 LS $50,000.00 $50,000.003 Loading Equipment 1 LS $150,000.00 $150,000.00
SSO PROCESSING EQUIPMENT SUB-TOTAL $550,000.00
Sanitary Sewer Upgrades1 Furnish and Install 6" HDPE Forcemain - Open Cut 1400 LF $60.00 $84,000.002 Pump Upgrades 1 LS $30,000.00 $30,000.003 Paving and Restoration 1000 LF $20.00 $20,000.004 Equalization Tank 2 EA $25,000.00 $50,000.005 Manhole 3 EA $50,000.00 $150,000.00
SANITARY SEWER SUB-TOTAL $334,000.00
PROJECT SUB-TOTAL $1,699,000.00
Contingency (25%) $425,000.00Engineering, Finance, Legal, and Administrative Fees (25%) $531,000.00
ESTIMATE OF PROBABLE CONSTRUCTION COST $2,655,000.00$2,655,000.00
BARTON & LOGUIDICE, D.P.C.BUDGET ESTIMATE
B&L JOB NO.:
DATE PREPARED:LOCATION:
ESTIMATED BY:
OHSWMA - Climate Smart Communities Grant Budget Estimate
Utica, NY

Appendix C
Tip Fee to Cover Costs

Incoming SSO Tonnage 5,000 tons 10,000 tons 15,000 tons 22,000 tonsCapital Expense $53,100.00 $53,100.00 $53,100.00 $53,100.00Equipment O & M $3,000.00 $3,000.00 $3,000.00 $3,000.00Heat $1,613.00 $1,613.00 $1,613.00 $1,613.00Electricity $14,989.01 $18,018.67 $20,896.84 $23,018.00Water $4,000.00 $4,000.00 $4,000.00 $4,000.00OCSD Charges $56,292.60 $112,594.30 $175,657.30 $247,447.20Labor $30,000.00 $30,000.00 $60,900.00 $60,900.00Residue(10%) $32,000.00 $64,000.00 $96,000.00 $140,800.00Total Costs $194,994.61 $286,325.97 $415,167.14 $533,878.20Tip fee-Expense Only $39.00 $28.63 $27.68 $24.27
Organics Feasibility - Tip Fee Analysis

Appendix D
Landfill Gas Generation Modeling

0
500
1,000
1,500
2,000
2,500
Land
fill G
as C
olle
ctio
n (s
cfm
)
Year
Ava Landfill - LFG Collection Curve
Existing Conditions LFG Collection
5,000 TPY Organics Diverted (LFG Collection)
10,000 TPY Organics Diverted (LFG Collection)
15,000 TPY Organics Diverted (LFG Collection)
22,000 TPY Organics Diverted (LFG Collection)

Tonnage2 Peak LFG Generation Tonnage Peak LFG Generation Tonnage Peak LFG Generation Tonnage Peak LFG Generation Tonnage Peak LFG Generation2018 264,325 1,970 259,325 1,970 254,325 1,970 249,325 1,970 242,325 1,9702019 264,325 2,078 259,325 2,070 254,325 2,062 249,325 2,054 242,325 2,0432020 264,325 2,177 259,325 2,163 254,325 2,149 249,325 2,134 242,325 2,1142021 264,325 2,269 259,325 2,249 254,325 2,230 249,325 2,210 242,325 2,1832022 264,325 2,354 259,325 2,330 254,325 2,306 249,325 2,282 242,325 2,2482023 264,325 2,433 259,325 2,405 254,325 2,377 249,325 2,349 242,325 2,3102024 264,325 2,505 259,325 2,474 254,325 2,443 249,325 2,412 242,325 2,3692025 264,325 2,573 259,325 2,539 254,325 2,506 249,325 2,472 242,325 2,4252026 264,325 2,635 259,325 2,599 254,325 2,564 249,325 2,528 242,325 2,4782027 264,325 2,693 259,325 2,655 254,325 2,618 249,325 2,580 242,325 2,5282028 264,325 2,746 259,325 2,707 254,325 2,668 249,325 2,629 242,325 2,5752029 264,325 2,796 259,325 2,756 254,325 2,715 249,325 2,675 242,325 2,6192030 264,325 2,842 259,325 2,800 254,325 2,759 249,325 2,718 242,325 2,6602031 264,325 2,884 259,325 2,842 254,325 2,800 249,325 2,758 242,325 2,6992032 264,325 2,924 259,325 2,881 254,325 2,838 249,325 2,796 242,325 2,7362033 264,325 2,961 259,325 2,917 254,325 2,874 249,325 2,830 242,325 2,7702034 264,325 2,995 259,325 2,951 254,325 2,907 249,325 2,863 242,325 2,8022035 264,325 3,026 259,325 2,982 254,325 2,938 249,325 2,894 242,325 2,8322036 264,325 3,056 259,325 3,011 254,325 2,966 249,325 2,922 242,325 2,8592037 264,325 3,083 259,325 3,038 254,325 2,993 249,325 2,948 242,325 2,886Notes:
1. Degradable tonnages modeled include MSW, sewage sludge, and 50% of the C&D. Inerts comprising remaining tonnage not modeled.
2. Total tonnage represents the average waste received minus 3,300 TPY of sludge incinerator ash plus 9,500 TPY of sludge from the anaerobic digesters beginning in 2018.
Existing Conditions1 15,000 TPY Organics Diversion 22,000 TPY Organics DiversionYear
10,000 TPY Organics Diversion5,000 TPY Organics Diversion

Collection Eff. = 80%
Year MSW Waste Model C&D Waste ModelSewage Sludge Waste Model Total LFG Generated Total LFG Collected
(scfm) (scfm) (scfm) (scfm) (scfm)2006 0 0 0 0 02007 50 0 0 50 402008 303 11 5 319 2552009 530 21 10 561 4492010 736 30 14 780 6242011 923 39 17 979 7832012 1,094 47 20 1,160 9282013 1,243 54 23 1,320 1,0562014 1,385 63 24 1,473 1,1782015 1,516 70 25 1,611 1,2892016 1,635 77 27 1,739 1,3912017 1,747 84 28 1,859 1,4872018 1,851 90 29 1,970 1,5762019 1,947 97 34 2,078 1,6622020 2,036 103 39 2,177 1,7422021 2,118 109 42 2,269 1,8152022 2,194 114 46 2,354 1,8832023 2,265 120 48 2,433 1,9462024 2,330 125 50 2,505 2,0042025 2,390 130 52 2,573 2,0582026 2,446 135 54 2,635 2,1082027 2,498 139 55 2,693 2,1542028 2,546 144 56 2,746 2,1972029 2,591 148 57 2,796 2,2372030 2,632 152 58 2,842 2,2732031 2,670 156 58 2,884 2,3072032 2,705 160 59 2,924 2,3392033 2,738 164 59 2,961 2,3682034 2,768 167 60 2,995 2,3962035 2,796 170 60 3,026 2,4212036 2,822 174 60 3,056 2,4442037 2,846 177 60 3,083 2,4662038 2,868 180 60 3,108 2,4872039 2,656 173 50 2,878 2,3032040 2,459 166 42 2,666 2,133
OHSWMA Regional LandfillEPA GHG Modeling Results - LFG Generation by Waste Category

OHSWMA LandGEM - MSW (ID 1109596).xls 1/24/2017
Summary ReportLandfill Name or Identifier: OHSWMA Regionall Landfill
Date:
First-Order Decomposition Rate Equation:
Where,QCH4 = annual methane generation in the year of the calculation (m 3 /year )i = 1-year time increment Mi = mass of waste accepted in the ith year (Mg ) n = (year of the calculation) - (initial year of waste acceptance)j = 0.1-year time incrementk = methane generation rate (year -1 )Lo = potential methane generation capacity (m 3 /Mg )
About LandGEM:
Tuesday, January 24, 2017
LandGEM is based on a first-order decomposition rate equation for quantifying emissions from the decomposition of landfilled waste in municipal solid waste (MSW) landfills. The software provides a relatively simple approach to estimating landfill gas emissions. Model defaults are based on empirical data from U.S. landfills. Field test data can also be used in place of model defaults when available. Further guidance on EPA test methods, Clean Air Act (CAA) regulations, and other guidance regarding landfill gas emissions and control technology requirements can be found at http://www.epa.gov/ttnatw01/landfill/landflpg.html.
Description/Comments:
tij = age of the jth section of waste mass Mi accepted in the ith year (decimal years , e.g., 3.2 years)
LandGEM is considered a screening tool — the better the input data, the better the estimates. Often, there are limitations with the available data regarding waste quantity and composition, variation in design and operating practices over time, and changes occurring over time that impact the emissions potential. Changes to landfill operation, such as operating under wet conditions through leachate recirculation or other liquid additions, will result in generating more gas at a faster rate. Defaults for estimating emissions for this type of operation are being developed to include in LandGEM along with defaults for convential landfills (no leachate or liquid additions) for developing emission inventories and determining CAA applicability. Refer to the Web site identified above for future updates.
REPORT - 1

OHSWMA LandGEM - MSW (ID 1109596).xls 1/24/2017
Input Review
LANDFILL CHARACTERISTICSLandfill Open Year 2006Landfill Closure Year (with 80-year limit) 2037Actual Closure Year (without limit) 2037Have Model Calculate Closure Year? NoWaste Design Capacity short tons
MODEL PARAMETERSMethane Generation Rate, k 0.077 year -1
Potential Methane Generation Capacity, Lo 155 m 3 /MgNMOC Concentration 46 ppmv as hexaneMethane Content 50 % by volume
GASES / POLLUTANTS SELECTEDGas / Pollutant #1: Total landfill gasGas / Pollutant #2: MethaneGas / Pollutant #3: Carbon dioxideGas / Pollutant #4: NMOC
WASTE ACCEPTANCE RATES
(Mg/year) (short tons/year) (Mg) (short tons)2006 32,223 35,445 0 02007 166,110 182,721 32,223 35,4452008 161,881 178,069 198,332 218,1662009 158,761 174,637 360,214 396,2352010 156,210 171,831 518,975 570,8722011 154,891 170,380 675,185 742,7032012 149,239 164,163 830,075 913,0832013 151,649 166,814 979,315 1,077,2462014 150,779 165,857 1,130,964 1,244,0602015 150,361 165,397 1,281,743 1,409,9172016 150,930 166,023 1,432,103 1,575,3142017 150,930 166,023 1,583,033 1,741,3372018 150,930 166,023 1,733,963 1,907,3602019 150,930 166,023 1,884,893 2,073,3832020 150,930 166,023 2,035,823 2,239,4062021 150,930 166,023 2,186,753 2,405,4292022 150,930 166,023 2,337,683 2,571,4522023 150,930 166,023 2,488,613 2,737,4752024 150,930 166,023 2,639,543 2,903,4982025 150,930 166,023 2,790,473 3,069,5212026 150,930 166,023 2,941,403 3,235,5442027 150,930 166,023 3,092,333 3,401,5672028 150,930 166,023 3,243,263 3,567,5902029 150,930 166,023 3,394,193 3,733,6132030 150,930 166,023 3,545,123 3,899,6362031 150,930 166,023 3,696,053 4,065,6592032 150,930 166,023 3,846,983 4,231,6822033 150,930 166,023 3,997,913 4,397,7052034 150,930 166,023 4,148,843 4,563,7282035 150,930 166,023 4,299,773 4,729,7512036 150,930 166,023 4,450,703 4,895,7742037 150,930 166,023 4,601,633 5,061,7972038 0 0 4,752,563 5,227,8202039 0 0 4,752,563 5,227,8202040 0 0 4,752,563 5,227,8202041 0 0 4,752,563 5,227,8202042 0 0 4,752,563 5,227,8202043 0 0 4,752,563 5,227,8202044 0 0 4,752,563 5,227,8202045 0 0 4,752,563 5,227,820
Year Waste Accepted Waste-In-Place
REPORT - 2

OHSWMA LandGEM - MSW (ID 1109596).xls 1/24/2017
WASTE ACCEPTANCE RATES (Continued)
(Mg/year) (short tons/year) (Mg) (short tons)2046 0 0 4,752,563 5,227,8202047 0 0 4,752,563 5,227,8202048 0 0 4,752,563 5,227,8202049 0 0 4,752,563 5,227,8202050 0 0 4,752,563 5,227,8202051 0 0 4,752,563 5,227,8202052 0 0 4,752,563 5,227,8202053 0 0 4,752,563 5,227,8202054 0 0 4,752,563 5,227,8202055 0 0 4,752,563 5,227,8202056 0 0 4,752,563 5,227,8202057 0 0 4,752,563 5,227,8202058 0 0 4,752,563 5,227,8202059 0 0 4,752,563 5,227,8202060 0 0 4,752,563 5,227,8202061 0 0 4,752,563 5,227,8202062 0 0 4,752,563 5,227,8202063 0 0 4,752,563 5,227,8202064 0 0 4,752,563 5,227,8202065 0 0 4,752,563 5,227,8202066 0 0 4,752,563 5,227,8202067 0 0 4,752,563 5,227,8202068 0 0 4,752,563 5,227,8202069 0 0 4,752,563 5,227,8202070 0 0 4,752,563 5,227,8202071 0 0 4,752,563 5,227,8202072 0 0 4,752,563 5,227,8202073 0 0 4,752,563 5,227,8202074 0 0 4,752,563 5,227,8202075 0 0 4,752,563 5,227,8202076 0 0 4,752,563 5,227,8202077 0 0 4,752,563 5,227,8202078 0 0 4,752,563 5,227,8202079 0 0 4,752,563 5,227,8202080 0 0 4,752,563 5,227,8202081 0 0 4,752,563 5,227,8202082 0 0 4,752,563 5,227,8202083 0 0 4,752,563 5,227,8202084 0 0 4,752,563 5,227,8202085 0 0 4,752,563 5,227,820
Waste-In-PlaceYear Waste Accepted
REPORT - 3
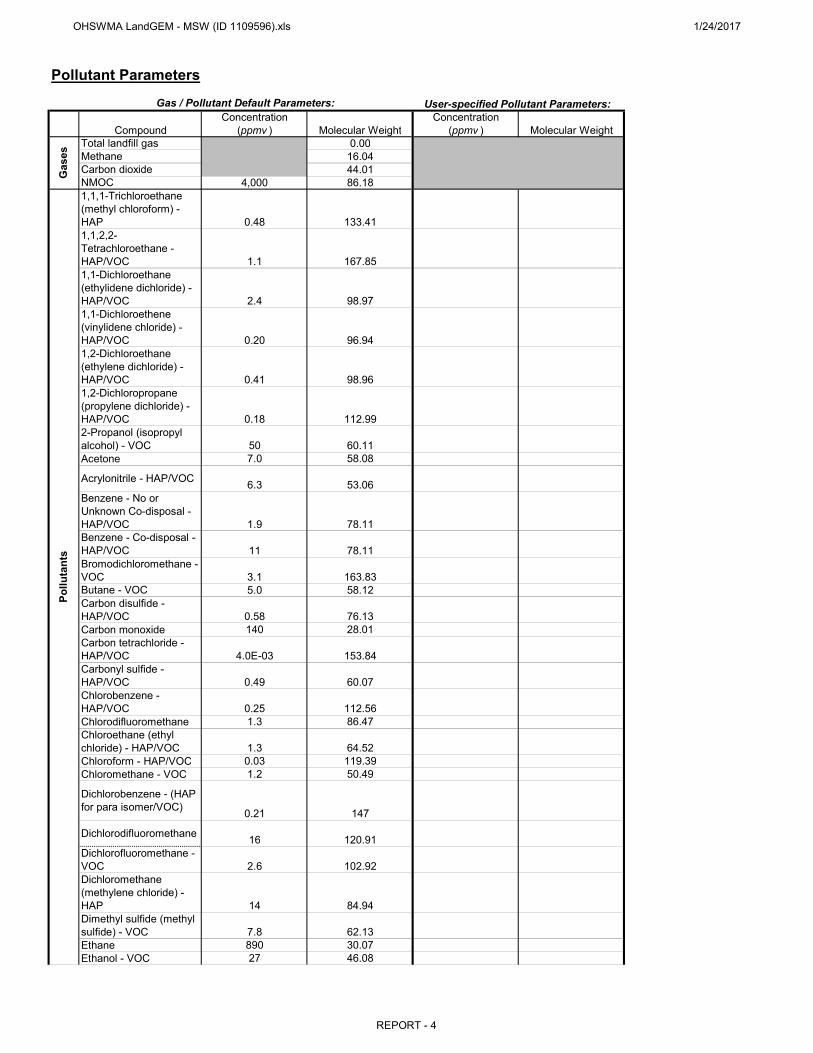
OHSWMA LandGEM - MSW (ID 1109596).xls 1/24/2017
Pollutant Parameters
Concentration ConcentrationCompound (ppmv ) Molecular Weight (ppmv ) Molecular Weight
Total landfill gas 0.00Methane 16.04Carbon dioxide 44.01NMOC 4,000 86.181,1,1-Trichloroethane (methyl chloroform) - HAP 0.48 133.411,1,2,2-Tetrachloroethane - HAP/VOC 1.1 167.851,1-Dichloroethane (ethylidene dichloride) - HAP/VOC 2.4 98.971,1-Dichloroethene (vinylidene chloride) - HAP/VOC 0.20 96.941,2-Dichloroethane (ethylene dichloride) - HAP/VOC 0.41 98.961,2-Dichloropropane (propylene dichloride) - HAP/VOC 0.18 112.992-Propanol (isopropyl alcohol) - VOC 50 60.11Acetone 7.0 58.08
Acrylonitrile - HAP/VOC 6.3 53.06Benzene - No or Unknown Co-disposal - HAP/VOC 1.9 78.11Benzene - Co-disposal - HAP/VOC 11 78.11Bromodichloromethane - VOC 3.1 163.83Butane - VOC 5.0 58.12Carbon disulfide - HAP/VOC 0.58 76.13Carbon monoxide 140 28.01Carbon tetrachloride - HAP/VOC 4.0E-03 153.84Carbonyl sulfide - HAP/VOC 0.49 60.07Chlorobenzene - HAP/VOC 0.25 112.56Chlorodifluoromethane 1.3 86.47Chloroethane (ethyl chloride) - HAP/VOC 1.3 64.52Chloroform - HAP/VOC 0.03 119.39Chloromethane - VOC 1.2 50.49
Dichlorobenzene - (HAP for para isomer/VOC) 0.21 147
Dichlorodifluoromethane 16 120.91Dichlorofluoromethane - VOC 2.6 102.92Dichloromethane (methylene chloride) - HAP 14 84.94Dimethyl sulfide (methyl sulfide) - VOC 7.8 62.13Ethane 890 30.07Ethanol - VOC 27 46.08
Pollu
tant
s
User-specified Pollutant Parameters:Gas / Pollutant Default Parameters:
Gas
es
REPORT - 4

OHSWMA LandGEM - MSW (ID 1109596).xls 1/24/2017
Pollutant Parameters (Continued)
Concentration ConcentrationCompound (ppmv ) Molecular Weight (ppmv ) Molecular Weight
Ethyl mercaptan (ethanethiol) - VOC 2.3 62.13Ethylbenzene - HAP/VOC 4.6 106.16Ethylene dibromide - HAP/VOC 1.0E-03 187.88Fluorotrichloromethane - VOC 0.76 137.38Hexane - HAP/VOC 6.6 86.18Hydrogen sulfide 36 34.08Mercury (total) - HAP 2.9E-04 200.61Methyl ethyl ketone - HAP/VOC 7.1 72.11Methyl isobutyl ketone - HAP/VOC 1.9 100.16
Methyl mercaptan - VOC 2.5 48.11Pentane - VOC 3.3 72.15Perchloroethylene (tetrachloroethylene) - HAP 3.7 165.83Propane - VOC 11 44.09t-1,2-Dichloroethene - VOC 2.8 96.94Toluene - No or Unknown Co-disposal - HAP/VOC 39 92.13Toluene - Co-disposal - HAP/VOC 170 92.13Trichloroethylene (trichloroethene) - HAP/VOC 2.8 131.40Vinyl chloride - HAP/VOC 7.3 62.50Xylenes - HAP/VOC 12 106.16Po
lluta
nts
User-specified Pollutant Parameters:Gas / Pollutant Default Parameters:
REPORT - 5

OHSWMA LandGEM - MSW (ID 1109596).xls 1/24/2017
Graphs
0.000E+00
1.000E+04
2.000E+04
3.000E+04
4.000E+04
5.000E+04
6.000E+04
Emis
sion
s
Year
Megagrams Per Year
Total landfill gas Methane Carbon dioxide NMOC
0.000E+005.000E+061.000E+071.500E+072.000E+072.500E+073.000E+073.500E+074.000E+074.500E+07
Emis
sion
s
Year
Cubic Meters Per Year
Total landfill gas Methane Carbon dioxide NMOC
0.000E+00
5.000E+02
1.000E+03
1.500E+03
2.000E+03
2.500E+03
3.000E+03
3.500E+03
Emis
sion
s
Year
User-specified Unit (units shown in legend below)
Total landfill gas (av ft^3/min) Methane (av ft^3/min) Carbon dioxide (av ft^3/min) NMOC (av ft^3/min)
REPORT - 6

OHSWMA LandGEM - MSW (ID 1109596).xls 1/24/2017
Results
(Mg/year) (m 3 /year) (av ft^3/min) (Mg/year) (m 3 /year) (av ft^3/min)2006 0 0 0 0 0 02007 9.251E+02 7.408E+05 4.977E+01 2.471E+02 3.704E+05 2.489E+012008 5.625E+03 4.504E+06 3.027E+02 1.503E+03 2.252E+06 1.513E+022009 9.856E+03 7.892E+06 5.303E+02 2.633E+03 3.946E+06 2.651E+022010 1.368E+04 1.096E+07 7.362E+02 3.655E+03 5.478E+06 3.681E+022011 1.715E+04 1.374E+07 9.229E+02 4.582E+03 6.868E+06 4.615E+022012 2.033E+04 1.628E+07 1.094E+03 5.430E+03 8.139E+06 5.469E+022013 2.311E+04 1.850E+07 1.243E+03 6.172E+03 9.251E+06 6.216E+022014 2.575E+04 2.062E+07 1.385E+03 6.878E+03 1.031E+07 6.927E+022015 2.817E+04 2.256E+07 1.516E+03 7.524E+03 1.128E+07 7.578E+022016 3.040E+04 2.434E+07 1.635E+03 8.119E+03 1.217E+07 8.177E+022017 3.248E+04 2.601E+07 1.747E+03 8.675E+03 1.300E+07 8.737E+022018 3.440E+04 2.755E+07 1.851E+03 9.190E+03 1.377E+07 9.255E+022019 3.619E+04 2.898E+07 1.947E+03 9.666E+03 1.449E+07 9.735E+022020 3.784E+04 3.030E+07 2.036E+03 1.011E+04 1.515E+07 1.018E+032021 3.937E+04 3.152E+07 2.118E+03 1.052E+04 1.576E+07 1.059E+032022 4.078E+04 3.266E+07 2.194E+03 1.089E+04 1.633E+07 1.097E+032023 4.209E+04 3.371E+07 2.265E+03 1.124E+04 1.685E+07 1.132E+032024 4.331E+04 3.468E+07 2.330E+03 1.157E+04 1.734E+07 1.165E+032025 4.443E+04 3.558E+07 2.390E+03 1.187E+04 1.779E+07 1.195E+032026 4.547E+04 3.641E+07 2.446E+03 1.215E+04 1.821E+07 1.223E+032027 4.643E+04 3.718E+07 2.498E+03 1.240E+04 1.859E+07 1.249E+032028 4.733E+04 3.790E+07 2.546E+03 1.264E+04 1.895E+07 1.273E+032029 4.815E+04 3.856E+07 2.591E+03 1.286E+04 1.928E+07 1.295E+032030 4.892E+04 3.917E+07 2.632E+03 1.307E+04 1.958E+07 1.316E+032031 4.962E+04 3.974E+07 2.670E+03 1.325E+04 1.987E+07 1.335E+032032 5.028E+04 4.026E+07 2.705E+03 1.343E+04 2.013E+07 1.353E+032033 5.089E+04 4.075E+07 2.738E+03 1.359E+04 2.037E+07 1.369E+032034 5.145E+04 4.120E+07 2.768E+03 1.374E+04 2.060E+07 1.384E+032035 5.197E+04 4.161E+07 2.796E+03 1.388E+04 2.081E+07 1.398E+032036 5.245E+04 4.200E+07 2.822E+03 1.401E+04 2.100E+07 1.411E+032037 5.289E+04 4.236E+07 2.846E+03 1.413E+04 2.118E+07 1.423E+032038 5.331E+04 4.269E+07 2.868E+03 1.424E+04 2.134E+07 1.434E+032039 4.936E+04 3.952E+07 2.656E+03 1.318E+04 1.976E+07 1.328E+032040 4.570E+04 3.659E+07 2.459E+03 1.221E+04 1.830E+07 1.229E+032041 4.231E+04 3.388E+07 2.277E+03 1.130E+04 1.694E+07 1.138E+032042 3.918E+04 3.137E+07 2.108E+03 1.046E+04 1.569E+07 1.054E+032043 3.627E+04 2.905E+07 1.952E+03 9.689E+03 1.452E+07 9.758E+022044 3.359E+04 2.689E+07 1.807E+03 8.971E+03 1.345E+07 9.035E+022045 3.110E+04 2.490E+07 1.673E+03 8.306E+03 1.245E+07 8.365E+022046 2.879E+04 2.305E+07 1.549E+03 7.691E+03 1.153E+07 7.745E+022047 2.666E+04 2.135E+07 1.434E+03 7.121E+03 1.067E+07 7.171E+022048 2.468E+04 1.976E+07 1.328E+03 6.593E+03 9.882E+06 6.640E+022049 2.285E+04 1.830E+07 1.230E+03 6.104E+03 9.150E+06 6.148E+022050 2.116E+04 1.694E+07 1.138E+03 5.652E+03 8.472E+06 5.692E+022051 1.959E+04 1.569E+07 1.054E+03 5.233E+03 7.844E+06 5.270E+022052 1.814E+04 1.453E+07 9.759E+02 4.845E+03 7.263E+06 4.880E+022053 1.680E+04 1.345E+07 9.036E+02 4.486E+03 6.724E+06 4.518E+022054 1.555E+04 1.245E+07 8.366E+02 4.154E+03 6.226E+06 4.183E+022055 1.440E+04 1.153E+07 7.746E+02 3.846E+03 5.765E+06 3.873E+02
MethaneTotal landfill gasYear
REPORT - 7

OHSWMA LandGEM - MSW (ID 1109596).xls 1/24/2017
Results (Continued)
(Mg/year) (m 3 /year) (av ft^3/min) (Mg/year) (m 3 /year) (av ft^3/min)2056 1.333E+04 1.067E+07 7.172E+02 3.561E+03 5.337E+06 3.586E+022057 1.234E+04 9.884E+06 6.641E+02 3.297E+03 4.942E+06 3.320E+022058 1.143E+04 9.151E+06 6.149E+02 3.053E+03 4.576E+06 3.074E+022059 1.058E+04 8.473E+06 5.693E+02 2.826E+03 4.236E+06 2.846E+022060 9.797E+03 7.845E+06 5.271E+02 2.617E+03 3.923E+06 2.636E+022061 9.071E+03 7.264E+06 4.880E+02 2.423E+03 3.632E+06 2.440E+022062 8.399E+03 6.725E+06 4.519E+02 2.243E+03 3.363E+06 2.259E+022063 7.776E+03 6.227E+06 4.184E+02 2.077E+03 3.113E+06 2.092E+022064 7.200E+03 5.765E+06 3.874E+02 1.923E+03 2.883E+06 1.937E+022065 6.666E+03 5.338E+06 3.587E+02 1.781E+03 2.669E+06 1.793E+022066 6.172E+03 4.943E+06 3.321E+02 1.649E+03 2.471E+06 1.660E+022067 5.715E+03 4.576E+06 3.075E+02 1.527E+03 2.288E+06 1.537E+022068 5.291E+03 4.237E+06 2.847E+02 1.413E+03 2.119E+06 1.423E+022069 4.899E+03 3.923E+06 2.636E+02 1.309E+03 1.962E+06 1.318E+022070 4.536E+03 3.632E+06 2.441E+02 1.212E+03 1.816E+06 1.220E+022071 4.200E+03 3.363E+06 2.260E+02 1.122E+03 1.682E+06 1.130E+022072 3.889E+03 3.114E+06 2.092E+02 1.039E+03 1.557E+06 1.046E+022073 3.601E+03 2.883E+06 1.937E+02 9.617E+02 1.442E+06 9.686E+012074 3.334E+03 2.669E+06 1.794E+02 8.905E+02 1.335E+06 8.968E+012075 3.087E+03 2.472E+06 1.661E+02 8.245E+02 1.236E+06 8.303E+012076 2.858E+03 2.288E+06 1.538E+02 7.634E+02 1.144E+06 7.688E+012077 2.646E+03 2.119E+06 1.424E+02 7.068E+02 1.059E+06 7.118E+012078 2.450E+03 1.962E+06 1.318E+02 6.544E+02 9.809E+05 6.591E+012079 2.268E+03 1.816E+06 1.220E+02 6.059E+02 9.082E+05 6.102E+012080 2.100E+03 1.682E+06 1.130E+02 5.610E+02 8.409E+05 5.650E+012081 1.945E+03 1.557E+06 1.046E+02 5.194E+02 7.786E+05 5.231E+012082 1.801E+03 1.442E+06 9.687E+01 4.809E+02 7.209E+05 4.844E+012083 1.667E+03 1.335E+06 8.969E+01 4.453E+02 6.675E+05 4.485E+012084 1.544E+03 1.236E+06 8.305E+01 4.123E+02 6.180E+05 4.152E+012085 1.429E+03 1.144E+06 7.689E+01 3.817E+02 5.722E+05 3.845E+012086 1.323E+03 1.060E+06 7.119E+01 3.535E+02 5.298E+05 3.560E+012087 1.225E+03 9.811E+05 6.592E+01 3.273E+02 4.905E+05 3.296E+012088 1.134E+03 9.084E+05 6.103E+01 3.030E+02 4.542E+05 3.052E+012089 1.050E+03 8.410E+05 5.651E+01 2.805E+02 4.205E+05 2.825E+012090 9.725E+02 7.787E+05 5.232E+01 2.598E+02 3.894E+05 2.616E+012091 9.004E+02 7.210E+05 4.844E+01 2.405E+02 3.605E+05 2.422E+012092 8.337E+02 6.676E+05 4.485E+01 2.227E+02 3.338E+05 2.243E+012093 7.719E+02 6.181E+05 4.153E+01 2.062E+02 3.090E+05 2.076E+012094 7.147E+02 5.723E+05 3.845E+01 1.909E+02 2.861E+05 1.923E+012095 6.617E+02 5.299E+05 3.560E+01 1.768E+02 2.649E+05 1.780E+012096 6.127E+02 4.906E+05 3.296E+01 1.637E+02 2.453E+05 1.648E+012097 5.673E+02 4.542E+05 3.052E+01 1.515E+02 2.271E+05 1.526E+012098 5.252E+02 4.206E+05 2.826E+01 1.403E+02 2.103E+05 1.413E+012099 4.863E+02 3.894E+05 2.616E+01 1.299E+02 1.947E+05 1.308E+012100 4.503E+02 3.606E+05 2.423E+01 1.203E+02 1.803E+05 1.211E+012101 4.169E+02 3.338E+05 2.243E+01 1.114E+02 1.669E+05 1.122E+012102 3.860E+02 3.091E+05 2.077E+01 1.031E+02 1.545E+05 1.038E+012103 3.574E+02 2.862E+05 1.923E+01 9.546E+01 1.431E+05 9.614E+002104 3.309E+02 2.650E+05 1.780E+01 8.839E+01 1.325E+05 8.902E+002105 3.064E+02 2.453E+05 1.648E+01 8.184E+01 1.227E+05 8.242E+002106 2.837E+02 2.272E+05 1.526E+01 7.577E+01 1.136E+05 7.631E+00
Year MethaneTotal landfill gas
REPORT - 8
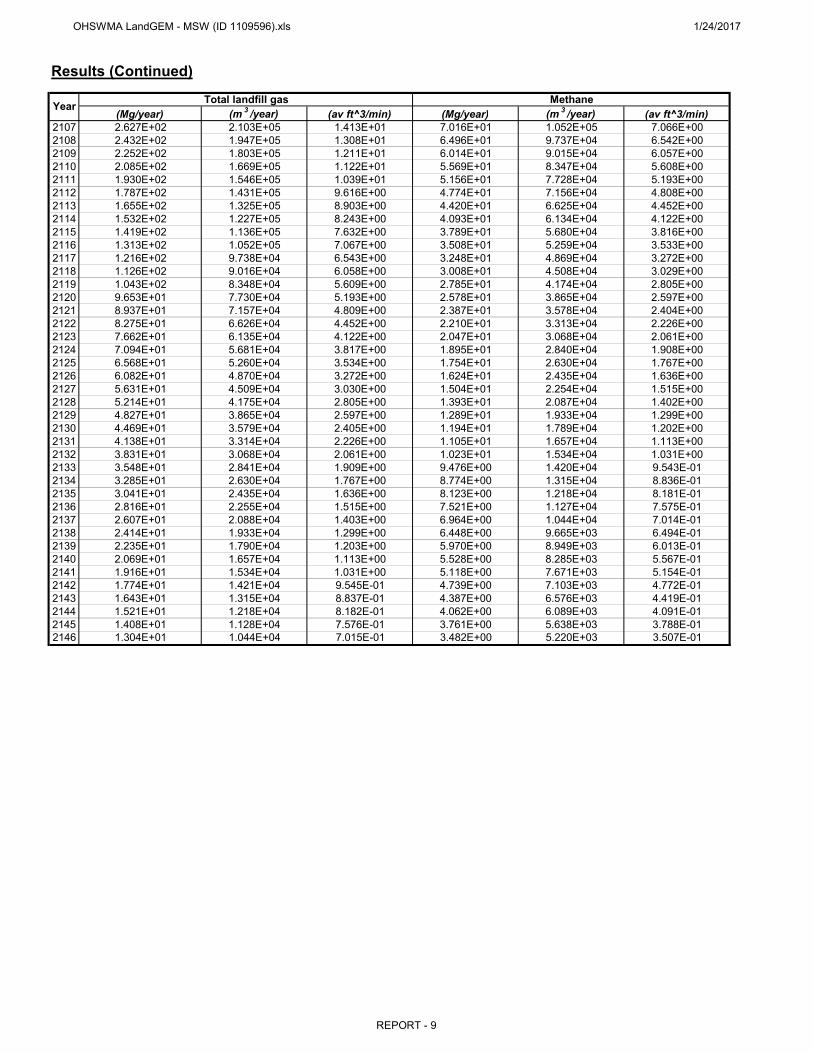
OHSWMA LandGEM - MSW (ID 1109596).xls 1/24/2017
Results (Continued)
(Mg/year) (m 3 /year) (av ft^3/min) (Mg/year) (m 3 /year) (av ft^3/min)2107 2.627E+02 2.103E+05 1.413E+01 7.016E+01 1.052E+05 7.066E+002108 2.432E+02 1.947E+05 1.308E+01 6.496E+01 9.737E+04 6.542E+002109 2.252E+02 1.803E+05 1.211E+01 6.014E+01 9.015E+04 6.057E+002110 2.085E+02 1.669E+05 1.122E+01 5.569E+01 8.347E+04 5.608E+002111 1.930E+02 1.546E+05 1.039E+01 5.156E+01 7.728E+04 5.193E+002112 1.787E+02 1.431E+05 9.616E+00 4.774E+01 7.156E+04 4.808E+002113 1.655E+02 1.325E+05 8.903E+00 4.420E+01 6.625E+04 4.452E+002114 1.532E+02 1.227E+05 8.243E+00 4.093E+01 6.134E+04 4.122E+002115 1.419E+02 1.136E+05 7.632E+00 3.789E+01 5.680E+04 3.816E+002116 1.313E+02 1.052E+05 7.067E+00 3.508E+01 5.259E+04 3.533E+002117 1.216E+02 9.738E+04 6.543E+00 3.248E+01 4.869E+04 3.272E+002118 1.126E+02 9.016E+04 6.058E+00 3.008E+01 4.508E+04 3.029E+002119 1.043E+02 8.348E+04 5.609E+00 2.785E+01 4.174E+04 2.805E+002120 9.653E+01 7.730E+04 5.193E+00 2.578E+01 3.865E+04 2.597E+002121 8.937E+01 7.157E+04 4.809E+00 2.387E+01 3.578E+04 2.404E+002122 8.275E+01 6.626E+04 4.452E+00 2.210E+01 3.313E+04 2.226E+002123 7.662E+01 6.135E+04 4.122E+00 2.047E+01 3.068E+04 2.061E+002124 7.094E+01 5.681E+04 3.817E+00 1.895E+01 2.840E+04 1.908E+002125 6.568E+01 5.260E+04 3.534E+00 1.754E+01 2.630E+04 1.767E+002126 6.082E+01 4.870E+04 3.272E+00 1.624E+01 2.435E+04 1.636E+002127 5.631E+01 4.509E+04 3.030E+00 1.504E+01 2.254E+04 1.515E+002128 5.214E+01 4.175E+04 2.805E+00 1.393E+01 2.087E+04 1.402E+002129 4.827E+01 3.865E+04 2.597E+00 1.289E+01 1.933E+04 1.299E+002130 4.469E+01 3.579E+04 2.405E+00 1.194E+01 1.789E+04 1.202E+002131 4.138E+01 3.314E+04 2.226E+00 1.105E+01 1.657E+04 1.113E+002132 3.831E+01 3.068E+04 2.061E+00 1.023E+01 1.534E+04 1.031E+002133 3.548E+01 2.841E+04 1.909E+00 9.476E+00 1.420E+04 9.543E-012134 3.285E+01 2.630E+04 1.767E+00 8.774E+00 1.315E+04 8.836E-012135 3.041E+01 2.435E+04 1.636E+00 8.123E+00 1.218E+04 8.181E-012136 2.816E+01 2.255E+04 1.515E+00 7.521E+00 1.127E+04 7.575E-012137 2.607E+01 2.088E+04 1.403E+00 6.964E+00 1.044E+04 7.014E-012138 2.414E+01 1.933E+04 1.299E+00 6.448E+00 9.665E+03 6.494E-012139 2.235E+01 1.790E+04 1.203E+00 5.970E+00 8.949E+03 6.013E-012140 2.069E+01 1.657E+04 1.113E+00 5.528E+00 8.285E+03 5.567E-012141 1.916E+01 1.534E+04 1.031E+00 5.118E+00 7.671E+03 5.154E-012142 1.774E+01 1.421E+04 9.545E-01 4.739E+00 7.103E+03 4.772E-012143 1.643E+01 1.315E+04 8.837E-01 4.387E+00 6.576E+03 4.419E-012144 1.521E+01 1.218E+04 8.182E-01 4.062E+00 6.089E+03 4.091E-012145 1.408E+01 1.128E+04 7.576E-01 3.761E+00 5.638E+03 3.788E-012146 1.304E+01 1.044E+04 7.015E-01 3.482E+00 5.220E+03 3.507E-01
Year Total landfill gas Methane
REPORT - 9

OHSWMA LandGEM - MSW (ID 1109596).xls 1/24/2017
Results (Continued)
Year(Mg/year) (m 3 /year) (av ft^3/min) (Mg/year) (m 3 /year) (av ft^3/min)
2006 0 0 0 0 0 02007 6.780E+02 3.704E+05 2.489E+01 1.221E-01 3.407E+01 2.289E-032008 4.123E+03 2.252E+06 1.513E+02 7.427E-01 2.072E+02 1.392E-022009 7.223E+03 3.946E+06 2.651E+02 1.301E+00 3.630E+02 2.439E-022010 1.003E+04 5.478E+06 3.681E+02 1.807E+00 5.040E+02 3.386E-022011 1.257E+04 6.868E+06 4.615E+02 2.265E+00 6.318E+02 4.245E-022012 1.490E+04 8.139E+06 5.469E+02 2.684E+00 7.488E+02 5.031E-022013 1.693E+04 9.251E+06 6.216E+02 3.051E+00 8.511E+02 5.719E-022014 1.887E+04 1.031E+07 6.927E+02 3.400E+00 9.484E+02 6.372E-022015 2.064E+04 1.128E+07 7.578E+02 3.719E+00 1.038E+03 6.971E-022016 2.228E+04 1.217E+07 8.177E+02 4.013E+00 1.120E+03 7.523E-022017 2.380E+04 1.300E+07 8.737E+02 4.288E+00 1.196E+03 8.038E-022018 2.521E+04 1.377E+07 9.255E+02 4.542E+00 1.267E+03 8.515E-022019 2.652E+04 1.449E+07 9.735E+02 4.778E+00 1.333E+03 8.956E-022020 2.773E+04 1.515E+07 1.018E+03 4.996E+00 1.394E+03 9.365E-022021 2.885E+04 1.576E+07 1.059E+03 5.198E+00 1.450E+03 9.743E-022022 2.989E+04 1.633E+07 1.097E+03 5.385E+00 1.502E+03 1.009E-012023 3.085E+04 1.685E+07 1.132E+03 5.558E+00 1.550E+03 1.042E-012024 3.174E+04 1.734E+07 1.165E+03 5.718E+00 1.595E+03 1.072E-012025 3.256E+04 1.779E+07 1.195E+03 5.866E+00 1.637E+03 1.100E-012026 3.332E+04 1.821E+07 1.223E+03 6.004E+00 1.675E+03 1.125E-012027 3.403E+04 1.859E+07 1.249E+03 6.131E+00 1.710E+03 1.149E-012028 3.468E+04 1.895E+07 1.273E+03 6.248E+00 1.743E+03 1.171E-012029 3.529E+04 1.928E+07 1.295E+03 6.357E+00 1.774E+03 1.192E-012030 3.585E+04 1.958E+07 1.316E+03 6.458E+00 1.802E+03 1.211E-012031 3.637E+04 1.987E+07 1.335E+03 6.552E+00 1.828E+03 1.228E-012032 3.685E+04 2.013E+07 1.353E+03 6.638E+00 1.852E+03 1.244E-012033 3.729E+04 2.037E+07 1.369E+03 6.719E+00 1.874E+03 1.259E-012034 3.770E+04 2.060E+07 1.384E+03 6.793E+00 1.895E+03 1.273E-012035 3.809E+04 2.081E+07 1.398E+03 6.861E+00 1.914E+03 1.286E-012036 3.844E+04 2.100E+07 1.411E+03 6.925E+00 1.932E+03 1.298E-012037 3.877E+04 2.118E+07 1.423E+03 6.984E+00 1.948E+03 1.309E-012038 3.907E+04 2.134E+07 1.434E+03 7.038E+00 1.964E+03 1.319E-012039 3.617E+04 1.976E+07 1.328E+03 6.517E+00 1.818E+03 1.222E-012040 3.349E+04 1.830E+07 1.229E+03 6.034E+00 1.683E+03 1.131E-012041 3.101E+04 1.694E+07 1.138E+03 5.587E+00 1.559E+03 1.047E-012042 2.871E+04 1.569E+07 1.054E+03 5.173E+00 1.443E+03 9.696E-022043 2.658E+04 1.452E+07 9.758E+02 4.789E+00 1.336E+03 8.977E-022044 2.461E+04 1.345E+07 9.035E+02 4.434E+00 1.237E+03 8.312E-022045 2.279E+04 1.245E+07 8.365E+02 4.106E+00 1.145E+03 7.696E-022046 2.110E+04 1.153E+07 7.745E+02 3.801E+00 1.061E+03 7.126E-022047 1.954E+04 1.067E+07 7.171E+02 3.520E+00 9.819E+02 6.598E-022048 1.809E+04 9.882E+06 6.640E+02 3.259E+00 9.092E+02 6.109E-022049 1.675E+04 9.150E+06 6.148E+02 3.017E+00 8.418E+02 5.656E-022050 1.551E+04 8.472E+06 5.692E+02 2.794E+00 7.794E+02 5.237E-022051 1.436E+04 7.844E+06 5.270E+02 2.587E+00 7.216E+02 4.849E-022052 1.329E+04 7.263E+06 4.880E+02 2.395E+00 6.682E+02 4.489E-022053 1.231E+04 6.724E+06 4.518E+02 2.217E+00 6.186E+02 4.157E-022054 1.140E+04 6.226E+06 4.183E+02 2.053E+00 5.728E+02 3.849E-022055 1.055E+04 5.765E+06 3.873E+02 1.901E+00 5.303E+02 3.563E-02
NMOCCarbon dioxide
REPORT - 10

OHSWMA LandGEM - MSW (ID 1109596).xls 1/24/2017
Results (Continued)
(Mg/year) (m 3 /year) (av ft^3/min) (Mg/year) (m 3 /year) (av ft^3/min)2056 9.770E+03 5.337E+06 3.586E+02 1.760E+00 4.910E+02 3.299E-022057 9.046E+03 4.942E+06 3.320E+02 1.630E+00 4.546E+02 3.055E-022058 8.376E+03 4.576E+06 3.074E+02 1.509E+00 4.210E+02 2.828E-022059 7.755E+03 4.236E+06 2.846E+02 1.397E+00 3.898E+02 2.619E-022060 7.180E+03 3.923E+06 2.636E+02 1.294E+00 3.609E+02 2.425E-022061 6.648E+03 3.632E+06 2.440E+02 1.198E+00 3.341E+02 2.245E-022062 6.155E+03 3.363E+06 2.259E+02 1.109E+00 3.094E+02 2.079E-022063 5.699E+03 3.113E+06 2.092E+02 1.027E+00 2.864E+02 1.925E-022064 5.277E+03 2.883E+06 1.937E+02 9.506E-01 2.652E+02 1.782E-022065 4.886E+03 2.669E+06 1.793E+02 8.802E-01 2.456E+02 1.650E-022066 4.524E+03 2.471E+06 1.660E+02 8.150E-01 2.274E+02 1.528E-022067 4.188E+03 2.288E+06 1.537E+02 7.546E-01 2.105E+02 1.414E-022068 3.878E+03 2.119E+06 1.423E+02 6.986E-01 1.949E+02 1.310E-022069 3.591E+03 1.962E+06 1.318E+02 6.469E-01 1.805E+02 1.213E-022070 3.325E+03 1.816E+06 1.220E+02 5.989E-01 1.671E+02 1.123E-022071 3.078E+03 1.682E+06 1.130E+02 5.545E-01 1.547E+02 1.039E-022072 2.850E+03 1.557E+06 1.046E+02 5.134E-01 1.432E+02 9.624E-032073 2.639E+03 1.442E+06 9.686E+01 4.754E-01 1.326E+02 8.911E-032074 2.443E+03 1.335E+06 8.968E+01 4.402E-01 1.228E+02 8.251E-032075 2.262E+03 1.236E+06 8.303E+01 4.075E-01 1.137E+02 7.639E-032076 2.095E+03 1.144E+06 7.688E+01 3.773E-01 1.053E+02 7.073E-032077 1.939E+03 1.059E+06 7.118E+01 3.494E-01 9.747E+01 6.549E-032078 1.796E+03 9.809E+05 6.591E+01 3.235E-01 9.024E+01 6.064E-032079 1.662E+03 9.082E+05 6.102E+01 2.995E-01 8.356E+01 5.614E-032080 1.539E+03 8.409E+05 5.650E+01 2.773E-01 7.736E+01 5.198E-032081 1.425E+03 7.786E+05 5.231E+01 2.568E-01 7.163E+01 4.813E-032082 1.320E+03 7.209E+05 4.844E+01 2.377E-01 6.632E+01 4.456E-032083 1.222E+03 6.675E+05 4.485E+01 2.201E-01 6.141E+01 4.126E-032084 1.131E+03 6.180E+05 4.152E+01 2.038E-01 5.686E+01 3.820E-032085 1.047E+03 5.722E+05 3.845E+01 1.887E-01 5.264E+01 3.537E-032086 9.698E+02 5.298E+05 3.560E+01 1.747E-01 4.874E+01 3.275E-032087 8.979E+02 4.905E+05 3.296E+01 1.618E-01 4.513E+01 3.032E-032088 8.314E+02 4.542E+05 3.052E+01 1.498E-01 4.178E+01 2.807E-032089 7.698E+02 4.205E+05 2.825E+01 1.387E-01 3.869E+01 2.599E-032090 7.127E+02 3.894E+05 2.616E+01 1.284E-01 3.582E+01 2.407E-032091 6.599E+02 3.605E+05 2.422E+01 1.189E-01 3.317E+01 2.228E-032092 6.110E+02 3.338E+05 2.243E+01 1.101E-01 3.071E+01 2.063E-032093 5.657E+02 3.090E+05 2.076E+01 1.019E-01 2.843E+01 1.910E-032094 5.238E+02 2.861E+05 1.923E+01 9.436E-02 2.633E+01 1.769E-032095 4.850E+02 2.649E+05 1.780E+01 8.737E-02 2.437E+01 1.638E-032096 4.490E+02 2.453E+05 1.648E+01 8.089E-02 2.257E+01 1.516E-032097 4.157E+02 2.271E+05 1.526E+01 7.490E-02 2.090E+01 1.404E-032098 3.849E+02 2.103E+05 1.413E+01 6.935E-02 1.935E+01 1.300E-032099 3.564E+02 1.947E+05 1.308E+01 6.421E-02 1.791E+01 1.204E-032100 3.300E+02 1.803E+05 1.211E+01 5.945E-02 1.659E+01 1.114E-032101 3.055E+02 1.669E+05 1.122E+01 5.504E-02 1.536E+01 1.032E-032102 2.829E+02 1.545E+05 1.038E+01 5.096E-02 1.422E+01 9.553E-042103 2.619E+02 1.431E+05 9.614E+00 4.719E-02 1.316E+01 8.845E-042104 2.425E+02 1.325E+05 8.902E+00 4.369E-02 1.219E+01 8.190E-042105 2.245E+02 1.227E+05 8.242E+00 4.045E-02 1.129E+01 7.583E-042106 2.079E+02 1.136E+05 7.631E+00 3.745E-02 1.045E+01 7.021E-04
Carbon dioxideYear NMOC
REPORT - 11

OHSWMA LandGEM - MSW (ID 1109596).xls 1/24/2017
Results (Continued)
(Mg/year) (m 3 /year) (av ft^3/min) (Mg/year) (m 3 /year) (av ft^3/min)2107 1.925E+02 1.052E+05 7.066E+00 3.468E-02 9.675E+00 6.500E-042108 1.782E+02 9.737E+04 6.542E+00 3.211E-02 8.958E+00 6.019E-042109 1.650E+02 9.015E+04 6.057E+00 2.973E-02 8.294E+00 5.573E-042110 1.528E+02 8.347E+04 5.608E+00 2.753E-02 7.679E+00 5.160E-042111 1.415E+02 7.728E+04 5.193E+00 2.549E-02 7.110E+00 4.777E-042112 1.310E+02 7.156E+04 4.808E+00 2.360E-02 6.583E+00 4.423E-042113 1.213E+02 6.625E+04 4.452E+00 2.185E-02 6.095E+00 4.095E-042114 1.123E+02 6.134E+04 4.122E+00 2.023E-02 5.644E+00 3.792E-042115 1.040E+02 5.680E+04 3.816E+00 1.873E-02 5.225E+00 3.511E-042116 9.626E+01 5.259E+04 3.533E+00 1.734E-02 4.838E+00 3.251E-042117 8.913E+01 4.869E+04 3.272E+00 1.606E-02 4.480E+00 3.010E-042118 8.252E+01 4.508E+04 3.029E+00 1.487E-02 4.148E+00 2.787E-042119 7.641E+01 4.174E+04 2.805E+00 1.377E-02 3.840E+00 2.580E-042120 7.074E+01 3.865E+04 2.597E+00 1.274E-02 3.556E+00 2.389E-042121 6.550E+01 3.578E+04 2.404E+00 1.180E-02 3.292E+00 2.212E-042122 6.065E+01 3.313E+04 2.226E+00 1.093E-02 3.048E+00 2.048E-042123 5.615E+01 3.068E+04 2.061E+00 1.012E-02 2.822E+00 1.896E-042124 5.199E+01 2.840E+04 1.908E+00 9.366E-03 2.613E+00 1.756E-042125 4.814E+01 2.630E+04 1.767E+00 8.672E-03 2.419E+00 1.626E-042126 4.457E+01 2.435E+04 1.636E+00 8.030E-03 2.240E+00 1.505E-042127 4.127E+01 2.254E+04 1.515E+00 7.434E-03 2.074E+00 1.394E-042128 3.821E+01 2.087E+04 1.402E+00 6.884E-03 1.920E+00 1.290E-042129 3.538E+01 1.933E+04 1.299E+00 6.373E-03 1.778E+00 1.195E-042130 3.276E+01 1.789E+04 1.202E+00 5.901E-03 1.646E+00 1.106E-042131 3.033E+01 1.657E+04 1.113E+00 5.464E-03 1.524E+00 1.024E-042132 2.808E+01 1.534E+04 1.031E+00 5.059E-03 1.411E+00 9.483E-052133 2.600E+01 1.420E+04 9.543E-01 4.684E-03 1.307E+00 8.780E-052134 2.407E+01 1.315E+04 8.836E-01 4.337E-03 1.210E+00 8.129E-052135 2.229E+01 1.218E+04 8.181E-01 4.015E-03 1.120E+00 7.527E-052136 2.064E+01 1.127E+04 7.575E-01 3.718E-03 1.037E+00 6.969E-052137 1.911E+01 1.044E+04 7.014E-01 3.442E-03 9.603E-01 6.452E-052138 1.769E+01 9.665E+03 6.494E-01 3.187E-03 8.892E-01 5.974E-052139 1.638E+01 8.949E+03 6.013E-01 2.951E-03 8.233E-01 5.532E-052140 1.517E+01 8.285E+03 5.567E-01 2.732E-03 7.623E-01 5.122E-052141 1.404E+01 7.671E+03 5.154E-01 2.530E-03 7.058E-01 4.742E-052142 1.300E+01 7.103E+03 4.772E-01 2.342E-03 6.535E-01 4.391E-052143 1.204E+01 6.576E+03 4.419E-01 2.169E-03 6.050E-01 4.065E-052144 1.115E+01 6.089E+03 4.091E-01 2.008E-03 5.602E-01 3.764E-052145 1.032E+01 5.638E+03 3.788E-01 1.859E-03 5.187E-01 3.485E-052146 9.555E+00 5.220E+03 3.507E-01 1.721E-03 4.802E-01 3.227E-05
NMOCYear Carbon dioxide
REPORT - 12

OHSWMA LandGEM - C&D (ID 1109598).xls 1/24/2017
Summary ReportLandfill Name or Identifier: OHSWMA Regional Landfill
Date:
First-Order Decomposition Rate Equation:
Where,QCH4 = annual methane generation in the year of the calculation (m 3 /year )i = 1-year time increment Mi = mass of waste accepted in the ith year (Mg ) n = (year of the calculation) - (initial year of waste acceptance)j = 0.1-year time incrementk = methane generation rate (year -1 )Lo = potential methane generation capacity (m 3 /Mg )
LandGEM is considered a screening tool — the better the input data, the better the estimates. Often, there are limitations with the available data regarding waste quantity and composition, variation in design and operating practices over time, and changes occurring over time that impact the emissions potential. Changes to landfill operation, such as operating under wet conditions through leachate recirculation or other liquid additions, will result in generating more gas at a faster rate. Defaults for estimating emissions for this type of operation are being developed to include in LandGEM along with defaults for convential landfills (no leachate or liquid additions) for developing emission inventories and determining CAA applicability. Refer to the Web site identified above for future updates.
Tuesday, January 24, 2017
LandGEM is based on a first-order decomposition rate equation for quantifying emissions from the decomposition of landfilled waste in municipal solid waste (MSW) landfills. The software provides a relatively simple approach to estimating landfill gas emissions. Model defaults are based on empirical data from U.S. landfills. Field test data can also be used in place of model defaults when available. Further guidance on EPA test methods, Clean Air Act (CAA) regulations, and other guidance regarding landfill gas emissions and control technology requirements can be found at http://www.epa.gov/ttnatw01/landfill/landflpg.html.
Description/Comments:
tij = age of the jth section of waste mass Mi accepted in the ith year (decimal years , e.g., 3.2 years)
About LandGEM:
REPORT - 1

OHSWMA LandGEM - C&D (ID 1109598).xls 1/24/2017
Input Review
LANDFILL CHARACTERISTICSLandfill Open Year 2006Landfill Closure Year (with 80-year limit) 2037Actual Closure Year (without limit) 2037Have Model Calculate Closure Year? NoWaste Design Capacity megagrams
MODEL PARAMETERSMethane Generation Rate, k 0.040 year -1
Potential Methane Generation Capacity, Lo 40 m 3 /MgNMOC Concentration 46 ppmv as hexaneMethane Content 50 % by volume
GASES / POLLUTANTS SELECTEDGas / Pollutant #1: Total landfill gasGas / Pollutant #2: MethaneGas / Pollutant #3: Carbon dioxideGas / Pollutant #4: NMOC
WASTE ACCEPTANCE RATES
(Mg/year) (short tons/year) (Mg) (short tons)2006 1,052 1,157 0 02007 53,351 58,686 1,052 1,1572008 47,855 52,640 54,403 59,8432009 46,872 51,559 102,257 112,4832010 46,979 51,677 149,129 164,0422011 43,866 48,253 196,108 215,7192012 45,820 50,402 239,974 263,9712013 52,223 57,445 285,794 314,3732014 44,365 48,802 338,017 371,8182015 44,558 49,014 382,382 420,6202016 47,049 51,754 426,940 469,6342017 47,049 51,754 473,989 521,3882018 47,049 51,754 521,038 573,1422019 47,049 51,754 568,087 624,8962020 47,049 51,754 615,136 676,6502021 47,049 51,754 662,186 728,4042022 47,049 51,754 709,235 780,1582023 47,049 51,754 756,284 831,9122024 47,049 51,754 803,333 883,6662025 47,049 51,754 850,382 935,4202026 47,049 51,754 897,431 987,1742027 47,049 51,754 944,480 1,038,9282028 47,049 51,754 991,529 1,090,6822029 47,049 51,754 1,038,578 1,142,4362030 47,049 51,754 1,085,627 1,194,1902031 47,049 51,754 1,132,676 1,245,9442032 47,049 51,754 1,179,726 1,297,6982033 47,049 51,754 1,226,775 1,349,4522034 47,049 51,754 1,273,824 1,401,2062035 47,049 51,754 1,320,873 1,452,9602036 47,049 51,754 1,367,922 1,504,7142037 47,049 51,754 1,414,971 1,556,4682038 0 0 1,462,020 1,608,2222039 0 0 1,462,020 1,608,2222040 0 0 1,462,020 1,608,2222041 0 0 1,462,020 1,608,2222042 0 0 1,462,020 1,608,2222043 0 0 1,462,020 1,608,2222044 0 0 1,462,020 1,608,2222045 0 0 1,462,020 1,608,222
Year Waste Accepted Waste-In-Place
REPORT - 2

OHSWMA LandGEM - C&D (ID 1109598).xls 1/24/2017
WASTE ACCEPTANCE RATES (Continued)
(Mg/year) (short tons/year) (Mg) (short tons)2046 0 0 1,462,020 1,608,2222047 0 0 1,462,020 1,608,2222048 0 0 1,462,020 1,608,2222049 0 0 1,462,020 1,608,2222050 0 0 1,462,020 1,608,2222051 0 0 1,462,020 1,608,2222052 0 0 1,462,020 1,608,2222053 0 0 1,462,020 1,608,2222054 0 0 1,462,020 1,608,2222055 0 0 1,462,020 1,608,2222056 0 0 1,462,020 1,608,2222057 0 0 1,462,020 1,608,2222058 0 0 1,462,020 1,608,2222059 0 0 1,462,020 1,608,2222060 0 0 1,462,020 1,608,2222061 0 0 1,462,020 1,608,2222062 0 0 1,462,020 1,608,2222063 0 0 1,462,020 1,608,2222064 0 0 1,462,020 1,608,2222065 0 0 1,462,020 1,608,2222066 0 0 1,462,020 1,608,2222067 0 0 1,462,020 1,608,2222068 0 0 1,462,020 1,608,2222069 0 0 1,462,020 1,608,2222070 0 0 1,462,020 1,608,2222071 0 0 1,462,020 1,608,2222072 0 0 1,462,020 1,608,2222073 0 0 1,462,020 1,608,2222074 0 0 1,462,020 1,608,2222075 0 0 1,462,020 1,608,2222076 0 0 1,462,020 1,608,2222077 0 0 1,462,020 1,608,2222078 0 0 1,462,020 1,608,2222079 0 0 1,462,020 1,608,2222080 0 0 1,462,020 1,608,2222081 0 0 1,462,020 1,608,2222082 0 0 1,462,020 1,608,2222083 0 0 1,462,020 1,608,2222084 0 0 1,462,020 1,608,2222085 0 0 1,462,020 1,608,222
Year Waste Accepted Waste-In-Place
REPORT - 3

OHSWMA LandGEM - C&D (ID 1109598).xls 1/24/2017
Pollutant Parameters
Concentration ConcentrationCompound (ppmv ) Molecular Weight (ppmv ) Molecular Weight
Total landfill gas 0.00Methane 16.04Carbon dioxide 44.01NMOC 4,000 86.181,1,1-Trichloroethane (methyl chloroform) - HAP 0.48 133.411,1,2,2-Tetrachloroethane - HAP/VOC 1.1 167.851,1-Dichloroethane (ethylidene dichloride) - HAP/VOC 2.4 98.971,1-Dichloroethene (vinylidene chloride) - HAP/VOC 0.20 96.941,2-Dichloroethane (ethylene dichloride) - HAP/VOC 0.41 98.961,2-Dichloropropane (propylene dichloride) - HAP/VOC 0.18 112.992-Propanol (isopropyl alcohol) - VOC 50 60.11Acetone 7.0 58.08
Acrylonitrile - HAP/VOC 6.3 53.06Benzene - No or Unknown Co-disposal - HAP/VOC 1.9 78.11Benzene - Co-disposal - HAP/VOC 11 78.11Bromodichloromethane - VOC 3.1 163.83Butane - VOC 5.0 58.12Carbon disulfide - HAP/VOC 0.58 76.13Carbon monoxide 140 28.01Carbon tetrachloride - HAP/VOC 4.0E-03 153.84Carbonyl sulfide - HAP/VOC 0.49 60.07Chlorobenzene - HAP/VOC 0.25 112.56Chlorodifluoromethane 1.3 86.47Chloroethane (ethyl chloride) - HAP/VOC 1.3 64.52Chloroform - HAP/VOC 0.03 119.39Chloromethane - VOC 1.2 50.49
Dichlorobenzene - (HAP for para isomer/VOC) 0.21 147
Dichlorodifluoromethane 16 120.91Dichlorofluoromethane - VOC 2.6 102.92Dichloromethane (methylene chloride) - HAP 14 84.94Dimethyl sulfide (methyl sulfide) - VOC 7.8 62.13Ethane 890 30.07Ethanol - VOC 27 46.08
Gas
esPo
lluta
nts
User-specified Pollutant Parameters:Gas / Pollutant Default Parameters:
REPORT - 4
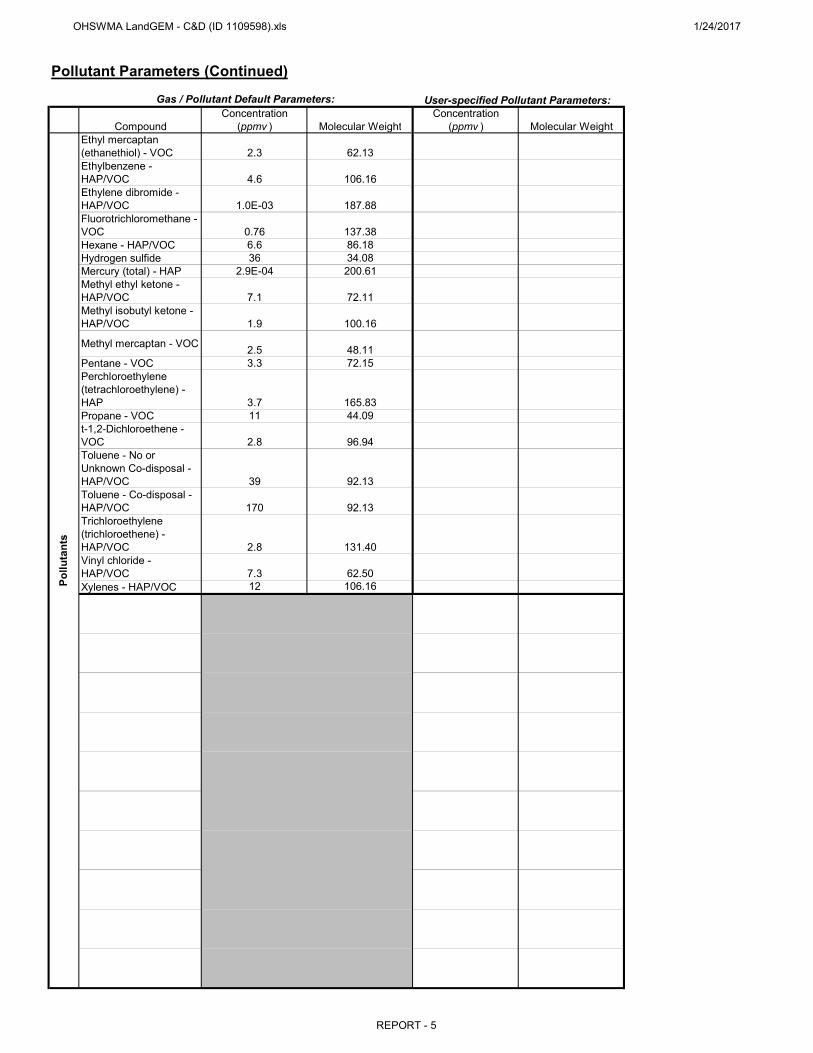
OHSWMA LandGEM - C&D (ID 1109598).xls 1/24/2017
Pollutant Parameters (Continued)
Concentration ConcentrationCompound (ppmv ) Molecular Weight (ppmv ) Molecular Weight
Ethyl mercaptan (ethanethiol) - VOC 2.3 62.13Ethylbenzene - HAP/VOC 4.6 106.16Ethylene dibromide - HAP/VOC 1.0E-03 187.88Fluorotrichloromethane - VOC 0.76 137.38Hexane - HAP/VOC 6.6 86.18Hydrogen sulfide 36 34.08Mercury (total) - HAP 2.9E-04 200.61Methyl ethyl ketone - HAP/VOC 7.1 72.11Methyl isobutyl ketone - HAP/VOC 1.9 100.16
Methyl mercaptan - VOC 2.5 48.11Pentane - VOC 3.3 72.15Perchloroethylene (tetrachloroethylene) - HAP 3.7 165.83Propane - VOC 11 44.09t-1,2-Dichloroethene - VOC 2.8 96.94Toluene - No or Unknown Co-disposal - HAP/VOC 39 92.13Toluene - Co-disposal - HAP/VOC 170 92.13Trichloroethylene (trichloroethene) - HAP/VOC 2.8 131.40Vinyl chloride - HAP/VOC 7.3 62.50Xylenes - HAP/VOC 12 106.16Po
lluta
nts
User-specified Pollutant Parameters:Gas / Pollutant Default Parameters:
REPORT - 5

OHSWMA LandGEM - C&D (ID 1109598).xls 1/24/2017
Graphs
0.000E+005.000E+021.000E+031.500E+032.000E+032.500E+033.000E+033.500E+034.000E+03
Emis
sion
s
Year
Megagrams Per Year
Total landfill gas Methane Carbon dioxide NMOC
0.000E+00
5.000E+05
1.000E+06
1.500E+06
2.000E+06
2.500E+06
3.000E+06
Emis
sion
s
Year
Cubic Meters Per Year
Total landfill gas Methane Carbon dioxide NMOC
0.000E+002.000E+014.000E+016.000E+018.000E+011.000E+021.200E+021.400E+021.600E+021.800E+022.000E+02
Emis
sion
s
Year
User-specified Unit (units shown in legend below)
Total landfill gas (av ft^3/min) Methane (av ft^3/min) Carbon dioxide (av ft^3/min) NMOC (av ft^3/min)
REPORT - 6

OHSWMA LandGEM - C&D (ID 1109598).xls 1/24/2017
Results
(Mg/year) (m 3 /year) (av ft^3/min) (Mg/year) (m 3 /year) (av ft^3/min)2006 0 0 0 0 0 02007 4.119E+00 3.298E+03 2.216E-01 1.100E+00 1.649E+03 1.108E-012008 2.128E+02 1.704E+05 1.145E+01 5.685E+01 8.522E+04 5.726E+002009 3.919E+02 3.138E+05 2.108E+01 1.047E+02 1.569E+05 1.054E+012010 5.600E+02 4.484E+05 3.013E+01 1.496E+02 2.242E+05 1.507E+012011 7.220E+02 5.782E+05 3.885E+01 1.929E+02 2.891E+05 1.942E+012012 8.655E+02 6.930E+05 4.656E+01 2.312E+02 3.465E+05 2.328E+012013 1.011E+03 8.095E+05 5.439E+01 2.700E+02 4.047E+05 2.719E+012014 1.176E+03 9.415E+05 6.326E+01 3.141E+02 4.707E+05 3.163E+012015 1.303E+03 1.044E+06 7.012E+01 3.481E+02 5.218E+05 3.506E+012016 1.427E+03 1.142E+06 7.676E+01 3.811E+02 5.712E+05 3.838E+012017 1.555E+03 1.245E+06 8.366E+01 4.154E+02 6.226E+05 4.183E+012018 1.678E+03 1.344E+06 9.029E+01 4.483E+02 6.719E+05 4.515E+012019 1.797E+03 1.439E+06 9.666E+01 4.799E+02 7.193E+05 4.833E+012020 1.910E+03 1.530E+06 1.028E+02 5.103E+02 7.649E+05 5.139E+012021 2.020E+03 1.617E+06 1.087E+02 5.395E+02 8.086E+05 5.433E+012022 2.125E+03 1.701E+06 1.143E+02 5.675E+02 8.507E+05 5.716E+012023 2.226E+03 1.782E+06 1.197E+02 5.945E+02 8.911E+05 5.987E+012024 2.323E+03 1.860E+06 1.250E+02 6.204E+02 9.299E+05 6.248E+012025 2.416E+03 1.934E+06 1.300E+02 6.453E+02 9.672E+05 6.499E+012026 2.505E+03 2.006E+06 1.348E+02 6.692E+02 1.003E+06 6.739E+012027 2.591E+03 2.075E+06 1.394E+02 6.921E+02 1.037E+06 6.971E+012028 2.674E+03 2.141E+06 1.439E+02 7.142E+02 1.071E+06 7.193E+012029 2.753E+03 2.205E+06 1.481E+02 7.354E+02 1.102E+06 7.406E+012030 2.829E+03 2.266E+06 1.522E+02 7.558E+02 1.133E+06 7.612E+012031 2.903E+03 2.324E+06 1.562E+02 7.754E+02 1.162E+06 7.809E+012032 2.973E+03 2.381E+06 1.600E+02 7.942E+02 1.190E+06 7.998E+012033 3.041E+03 2.435E+06 1.636E+02 8.122E+02 1.217E+06 8.180E+012034 3.106E+03 2.487E+06 1.671E+02 8.296E+02 1.243E+06 8.355E+012035 3.168E+03 2.537E+06 1.705E+02 8.463E+02 1.268E+06 8.523E+012036 3.228E+03 2.585E+06 1.737E+02 8.623E+02 1.292E+06 8.684E+012037 3.286E+03 2.631E+06 1.768E+02 8.777E+02 1.316E+06 8.839E+012038 3.341E+03 2.675E+06 1.798E+02 8.925E+02 1.338E+06 8.988E+012039 3.210E+03 2.571E+06 1.727E+02 8.575E+02 1.285E+06 8.636E+012040 3.084E+03 2.470E+06 1.659E+02 8.239E+02 1.235E+06 8.297E+012041 2.963E+03 2.373E+06 1.594E+02 7.915E+02 1.186E+06 7.972E+012042 2.847E+03 2.280E+06 1.532E+02 7.605E+02 1.140E+06 7.659E+012043 2.736E+03 2.190E+06 1.472E+02 7.307E+02 1.095E+06 7.359E+012044 2.628E+03 2.105E+06 1.414E+02 7.020E+02 1.052E+06 7.070E+012045 2.525E+03 2.022E+06 1.359E+02 6.745E+02 1.011E+06 6.793E+012046 2.426E+03 1.943E+06 1.305E+02 6.481E+02 9.714E+05 6.527E+012047 2.331E+03 1.867E+06 1.254E+02 6.227E+02 9.333E+05 6.271E+012048 2.240E+03 1.793E+06 1.205E+02 5.982E+02 8.967E+05 6.025E+012049 2.152E+03 1.723E+06 1.158E+02 5.748E+02 8.616E+05 5.789E+012050 2.067E+03 1.656E+06 1.112E+02 5.522E+02 8.278E+05 5.562E+012051 1.986E+03 1.591E+06 1.069E+02 5.306E+02 7.953E+05 5.344E+012052 1.909E+03 1.528E+06 1.027E+02 5.098E+02 7.641E+05 5.134E+012053 1.834E+03 1.468E+06 9.866E+01 4.898E+02 7.342E+05 4.933E+012054 1.762E+03 1.411E+06 9.479E+01 4.706E+02 7.054E+05 4.739E+012055 1.693E+03 1.355E+06 9.107E+01 4.521E+02 6.777E+05 4.554E+01
Year Total landfill gas Methane
REPORT - 7

OHSWMA LandGEM - C&D (ID 1109598).xls 1/24/2017
Results (Continued)
(Mg/year) (m 3 /year) (av ft^3/min) (Mg/year) (m 3 /year) (av ft^3/min)2056 1.626E+03 1.302E+06 8.750E+01 4.344E+02 6.511E+05 4.375E+012057 1.563E+03 1.251E+06 8.407E+01 4.174E+02 6.256E+05 4.203E+012058 1.501E+03 1.202E+06 8.077E+01 4.010E+02 6.011E+05 4.039E+012059 1.442E+03 1.155E+06 7.761E+01 3.853E+02 5.775E+05 3.880E+012060 1.386E+03 1.110E+06 7.456E+01 3.702E+02 5.549E+05 3.728E+012061 1.332E+03 1.066E+06 7.164E+01 3.557E+02 5.331E+05 3.582E+012062 1.279E+03 1.024E+06 6.883E+01 3.417E+02 5.122E+05 3.442E+012063 1.229E+03 9.843E+05 6.613E+01 3.283E+02 4.921E+05 3.307E+012064 1.181E+03 9.457E+05 6.354E+01 3.154E+02 4.728E+05 3.177E+012065 1.135E+03 9.086E+05 6.105E+01 3.031E+02 4.543E+05 3.052E+012066 1.090E+03 8.730E+05 5.865E+01 2.912E+02 4.365E+05 2.933E+012067 1.047E+03 8.387E+05 5.635E+01 2.798E+02 4.194E+05 2.818E+012068 1.006E+03 8.058E+05 5.414E+01 2.688E+02 4.029E+05 2.707E+012069 9.669E+02 7.742E+05 5.202E+01 2.583E+02 3.871E+05 2.601E+012070 9.290E+02 7.439E+05 4.998E+01 2.481E+02 3.719E+05 2.499E+012071 8.926E+02 7.147E+05 4.802E+01 2.384E+02 3.574E+05 2.401E+012072 8.576E+02 6.867E+05 4.614E+01 2.291E+02 3.433E+05 2.307E+012073 8.239E+02 6.598E+05 4.433E+01 2.201E+02 3.299E+05 2.216E+012074 7.916E+02 6.339E+05 4.259E+01 2.115E+02 3.169E+05 2.130E+012075 7.606E+02 6.090E+05 4.092E+01 2.032E+02 3.045E+05 2.046E+012076 7.308E+02 5.852E+05 3.932E+01 1.952E+02 2.926E+05 1.966E+012077 7.021E+02 5.622E+05 3.778E+01 1.875E+02 2.811E+05 1.889E+012078 6.746E+02 5.402E+05 3.629E+01 1.802E+02 2.701E+05 1.815E+012079 6.481E+02 5.190E+05 3.487E+01 1.731E+02 2.595E+05 1.744E+012080 6.227E+02 4.986E+05 3.350E+01 1.663E+02 2.493E+05 1.675E+012081 5.983E+02 4.791E+05 3.219E+01 1.598E+02 2.395E+05 1.609E+012082 5.748E+02 4.603E+05 3.093E+01 1.535E+02 2.302E+05 1.546E+012083 5.523E+02 4.423E+05 2.971E+01 1.475E+02 2.211E+05 1.486E+012084 5.306E+02 4.249E+05 2.855E+01 1.417E+02 2.125E+05 1.427E+012085 5.098E+02 4.083E+05 2.743E+01 1.362E+02 2.041E+05 1.372E+012086 4.898E+02 3.922E+05 2.635E+01 1.308E+02 1.961E+05 1.318E+012087 4.706E+02 3.769E+05 2.532E+01 1.257E+02 1.884E+05 1.266E+012088 4.522E+02 3.621E+05 2.433E+01 1.208E+02 1.810E+05 1.216E+012089 4.345E+02 3.479E+05 2.337E+01 1.160E+02 1.739E+05 1.169E+012090 4.174E+02 3.342E+05 2.246E+01 1.115E+02 1.671E+05 1.123E+012091 4.010E+02 3.211E+05 2.158E+01 1.071E+02 1.606E+05 1.079E+012092 3.853E+02 3.085E+05 2.073E+01 1.029E+02 1.543E+05 1.037E+012093 3.702E+02 2.965E+05 1.992E+01 9.889E+01 1.482E+05 9.959E+002094 3.557E+02 2.848E+05 1.914E+01 9.501E+01 1.424E+05 9.569E+002095 3.418E+02 2.737E+05 1.839E+01 9.129E+01 1.368E+05 9.194E+002096 3.284E+02 2.629E+05 1.767E+01 8.771E+01 1.315E+05 8.833E+002097 3.155E+02 2.526E+05 1.697E+01 8.427E+01 1.263E+05 8.487E+002098 3.031E+02 2.427E+05 1.631E+01 8.096E+01 1.214E+05 8.154E+002099 2.912E+02 2.332E+05 1.567E+01 7.779E+01 1.166E+05 7.834E+002100 2.798E+02 2.241E+05 1.505E+01 7.474E+01 1.120E+05 7.527E+002101 2.688E+02 2.153E+05 1.446E+01 7.181E+01 1.076E+05 7.232E+002102 2.583E+02 2.068E+05 1.390E+01 6.899E+01 1.034E+05 6.948E+002103 2.482E+02 1.987E+05 1.335E+01 6.629E+01 9.936E+04 6.676E+002104 2.384E+02 1.909E+05 1.283E+01 6.369E+01 9.546E+04 6.414E+002105 2.291E+02 1.834E+05 1.233E+01 6.119E+01 9.172E+04 6.163E+002106 2.201E+02 1.762E+05 1.184E+01 5.879E+01 8.812E+04 5.921E+00
Total landfill gasYear Methane
REPORT - 8
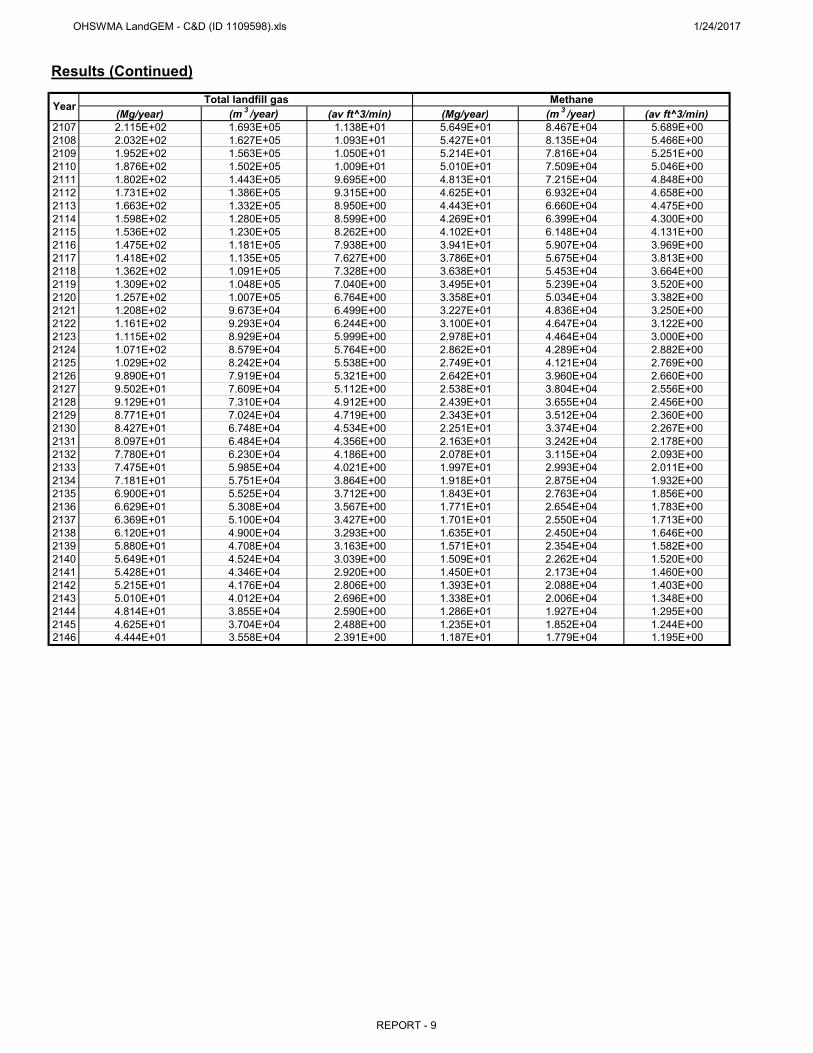
OHSWMA LandGEM - C&D (ID 1109598).xls 1/24/2017
Results (Continued)
(Mg/year) (m 3 /year) (av ft^3/min) (Mg/year) (m 3 /year) (av ft^3/min)2107 2.115E+02 1.693E+05 1.138E+01 5.649E+01 8.467E+04 5.689E+002108 2.032E+02 1.627E+05 1.093E+01 5.427E+01 8.135E+04 5.466E+002109 1.952E+02 1.563E+05 1.050E+01 5.214E+01 7.816E+04 5.251E+002110 1.876E+02 1.502E+05 1.009E+01 5.010E+01 7.509E+04 5.046E+002111 1.802E+02 1.443E+05 9.695E+00 4.813E+01 7.215E+04 4.848E+002112 1.731E+02 1.386E+05 9.315E+00 4.625E+01 6.932E+04 4.658E+002113 1.663E+02 1.332E+05 8.950E+00 4.443E+01 6.660E+04 4.475E+002114 1.598E+02 1.280E+05 8.599E+00 4.269E+01 6.399E+04 4.300E+002115 1.536E+02 1.230E+05 8.262E+00 4.102E+01 6.148E+04 4.131E+002116 1.475E+02 1.181E+05 7.938E+00 3.941E+01 5.907E+04 3.969E+002117 1.418E+02 1.135E+05 7.627E+00 3.786E+01 5.675E+04 3.813E+002118 1.362E+02 1.091E+05 7.328E+00 3.638E+01 5.453E+04 3.664E+002119 1.309E+02 1.048E+05 7.040E+00 3.495E+01 5.239E+04 3.520E+002120 1.257E+02 1.007E+05 6.764E+00 3.358E+01 5.034E+04 3.382E+002121 1.208E+02 9.673E+04 6.499E+00 3.227E+01 4.836E+04 3.250E+002122 1.161E+02 9.293E+04 6.244E+00 3.100E+01 4.647E+04 3.122E+002123 1.115E+02 8.929E+04 5.999E+00 2.978E+01 4.464E+04 3.000E+002124 1.071E+02 8.579E+04 5.764E+00 2.862E+01 4.289E+04 2.882E+002125 1.029E+02 8.242E+04 5.538E+00 2.749E+01 4.121E+04 2.769E+002126 9.890E+01 7.919E+04 5.321E+00 2.642E+01 3.960E+04 2.660E+002127 9.502E+01 7.609E+04 5.112E+00 2.538E+01 3.804E+04 2.556E+002128 9.129E+01 7.310E+04 4.912E+00 2.439E+01 3.655E+04 2.456E+002129 8.771E+01 7.024E+04 4.719E+00 2.343E+01 3.512E+04 2.360E+002130 8.427E+01 6.748E+04 4.534E+00 2.251E+01 3.374E+04 2.267E+002131 8.097E+01 6.484E+04 4.356E+00 2.163E+01 3.242E+04 2.178E+002132 7.780E+01 6.230E+04 4.186E+00 2.078E+01 3.115E+04 2.093E+002133 7.475E+01 5.985E+04 4.021E+00 1.997E+01 2.993E+04 2.011E+002134 7.181E+01 5.751E+04 3.864E+00 1.918E+01 2.875E+04 1.932E+002135 6.900E+01 5.525E+04 3.712E+00 1.843E+01 2.763E+04 1.856E+002136 6.629E+01 5.308E+04 3.567E+00 1.771E+01 2.654E+04 1.783E+002137 6.369E+01 5.100E+04 3.427E+00 1.701E+01 2.550E+04 1.713E+002138 6.120E+01 4.900E+04 3.293E+00 1.635E+01 2.450E+04 1.646E+002139 5.880E+01 4.708E+04 3.163E+00 1.571E+01 2.354E+04 1.582E+002140 5.649E+01 4.524E+04 3.039E+00 1.509E+01 2.262E+04 1.520E+002141 5.428E+01 4.346E+04 2.920E+00 1.450E+01 2.173E+04 1.460E+002142 5.215E+01 4.176E+04 2.806E+00 1.393E+01 2.088E+04 1.403E+002143 5.010E+01 4.012E+04 2.696E+00 1.338E+01 2.006E+04 1.348E+002144 4.814E+01 3.855E+04 2.590E+00 1.286E+01 1.927E+04 1.295E+002145 4.625E+01 3.704E+04 2.488E+00 1.235E+01 1.852E+04 1.244E+002146 4.444E+01 3.558E+04 2.391E+00 1.187E+01 1.779E+04 1.195E+00
Year Total landfill gas Methane
REPORT - 9

OHSWMA LandGEM - C&D (ID 1109598).xls 1/24/2017
Results (Continued)
Year(Mg/year) (m 3 /year) (av ft^3/min) (Mg/year) (m 3 /year) (av ft^3/min)
2006 0 0 0 0 0 02007 3.019E+00 1.649E+03 1.108E-01 5.439E-04 1.517E-01 1.019E-052008 1.560E+02 8.522E+04 5.726E+00 2.810E-02 7.840E+00 5.268E-042009 2.872E+02 1.569E+05 1.054E+01 5.174E-02 1.443E+01 9.698E-042010 4.104E+02 2.242E+05 1.507E+01 7.394E-02 2.063E+01 1.386E-032011 5.292E+02 2.891E+05 1.942E+01 9.533E-02 2.659E+01 1.787E-032012 6.343E+02 3.465E+05 2.328E+01 1.143E-01 3.188E+01 2.142E-032013 7.409E+02 4.047E+05 2.719E+01 1.335E-01 3.724E+01 2.502E-032014 8.617E+02 4.707E+05 3.163E+01 1.552E-01 4.331E+01 2.910E-032015 9.552E+02 5.218E+05 3.506E+01 1.721E-01 4.801E+01 3.226E-032016 1.046E+03 5.712E+05 3.838E+01 1.884E-01 5.255E+01 3.531E-032017 1.140E+03 6.226E+05 4.183E+01 2.053E-01 5.728E+01 3.848E-032018 1.230E+03 6.719E+05 4.515E+01 2.216E-01 6.182E+01 4.153E-032019 1.317E+03 7.193E+05 4.833E+01 2.372E-01 6.618E+01 4.447E-032020 1.400E+03 7.649E+05 5.139E+01 2.522E-01 7.037E+01 4.728E-032021 1.480E+03 8.086E+05 5.433E+01 2.667E-01 7.440E+01 4.999E-032022 1.557E+03 8.507E+05 5.716E+01 2.805E-01 7.826E+01 5.259E-032023 1.631E+03 8.911E+05 5.987E+01 2.939E-01 8.198E+01 5.508E-032024 1.702E+03 9.299E+05 6.248E+01 3.067E-01 8.555E+01 5.748E-032025 1.770E+03 9.672E+05 6.499E+01 3.190E-01 8.898E+01 5.979E-032026 1.836E+03 1.003E+06 6.739E+01 3.308E-01 9.228E+01 6.200E-032027 1.899E+03 1.037E+06 6.971E+01 3.421E-01 9.545E+01 6.413E-032028 1.960E+03 1.071E+06 7.193E+01 3.530E-01 9.849E+01 6.617E-032029 2.018E+03 1.102E+06 7.406E+01 3.635E-01 1.014E+02 6.814E-032030 2.074E+03 1.133E+06 7.612E+01 3.736E-01 1.042E+02 7.003E-032031 2.127E+03 1.162E+06 7.809E+01 3.833E-01 1.069E+02 7.184E-032032 2.179E+03 1.190E+06 7.998E+01 3.926E-01 1.095E+02 7.358E-032033 2.229E+03 1.217E+06 8.180E+01 4.015E-01 1.120E+02 7.526E-032034 2.276E+03 1.243E+06 8.355E+01 4.101E-01 1.144E+02 7.686E-032035 2.322E+03 1.268E+06 8.523E+01 4.183E-01 1.167E+02 7.841E-032036 2.366E+03 1.292E+06 8.684E+01 4.262E-01 1.189E+02 7.989E-032037 2.408E+03 1.316E+06 8.839E+01 4.338E-01 1.210E+02 8.132E-032038 2.449E+03 1.338E+06 8.988E+01 4.411E-01 1.231E+02 8.269E-032039 2.353E+03 1.285E+06 8.636E+01 4.238E-01 1.182E+02 7.945E-032040 2.260E+03 1.235E+06 8.297E+01 4.072E-01 1.136E+02 7.633E-032041 2.172E+03 1.186E+06 7.972E+01 3.913E-01 1.092E+02 7.334E-032042 2.087E+03 1.140E+06 7.659E+01 3.759E-01 1.049E+02 7.047E-032043 2.005E+03 1.095E+06 7.359E+01 3.612E-01 1.008E+02 6.770E-032044 1.926E+03 1.052E+06 7.070E+01 3.470E-01 9.681E+01 6.505E-032045 1.851E+03 1.011E+06 6.793E+01 3.334E-01 9.302E+01 6.250E-032046 1.778E+03 9.714E+05 6.527E+01 3.203E-01 8.937E+01 6.005E-032047 1.708E+03 9.333E+05 6.271E+01 3.078E-01 8.586E+01 5.769E-032048 1.641E+03 8.967E+05 6.025E+01 2.957E-01 8.250E+01 5.543E-032049 1.577E+03 8.616E+05 5.789E+01 2.841E-01 7.926E+01 5.326E-032050 1.515E+03 8.278E+05 5.562E+01 2.730E-01 7.615E+01 5.117E-032051 1.456E+03 7.953E+05 5.344E+01 2.623E-01 7.317E+01 4.916E-032052 1.399E+03 7.641E+05 5.134E+01 2.520E-01 7.030E+01 4.723E-032053 1.344E+03 7.342E+05 4.933E+01 2.421E-01 6.754E+01 4.538E-032054 1.291E+03 7.054E+05 4.739E+01 2.326E-01 6.489E+01 4.360E-032055 1.241E+03 6.777E+05 4.554E+01 2.235E-01 6.235E+01 4.189E-03
Carbon dioxide NMOC
REPORT - 10

OHSWMA LandGEM - C&D (ID 1109598).xls 1/24/2017
Results (Continued)
(Mg/year) (m 3 /year) (av ft^3/min) (Mg/year) (m 3 /year) (av ft^3/min)2056 1.192E+03 6.511E+05 4.375E+01 2.147E-01 5.991E+01 4.025E-032057 1.145E+03 6.256E+05 4.203E+01 2.063E-01 5.756E+01 3.867E-032058 1.100E+03 6.011E+05 4.039E+01 1.982E-01 5.530E+01 3.716E-032059 1.057E+03 5.775E+05 3.880E+01 1.904E-01 5.313E+01 3.570E-032060 1.016E+03 5.549E+05 3.728E+01 1.830E-01 5.105E+01 3.430E-032061 9.759E+02 5.331E+05 3.582E+01 1.758E-01 4.905E+01 3.295E-032062 9.376E+02 5.122E+05 3.442E+01 1.689E-01 4.712E+01 3.166E-032063 9.008E+02 4.921E+05 3.307E+01 1.623E-01 4.528E+01 3.042E-032064 8.655E+02 4.728E+05 3.177E+01 1.559E-01 4.350E+01 2.923E-032065 8.316E+02 4.543E+05 3.052E+01 1.498E-01 4.179E+01 2.808E-032066 7.990E+02 4.365E+05 2.933E+01 1.439E-01 4.016E+01 2.698E-032067 7.676E+02 4.194E+05 2.818E+01 1.383E-01 3.858E+01 2.592E-032068 7.375E+02 4.029E+05 2.707E+01 1.329E-01 3.707E+01 2.491E-032069 7.086E+02 3.871E+05 2.601E+01 1.277E-01 3.562E+01 2.393E-032070 6.808E+02 3.719E+05 2.499E+01 1.227E-01 3.422E+01 2.299E-032071 6.541E+02 3.574E+05 2.401E+01 1.178E-01 3.288E+01 2.209E-032072 6.285E+02 3.433E+05 2.307E+01 1.132E-01 3.159E+01 2.122E-032073 6.038E+02 3.299E+05 2.216E+01 1.088E-01 3.035E+01 2.039E-032074 5.802E+02 3.169E+05 2.130E+01 1.045E-01 2.916E+01 1.959E-032075 5.574E+02 3.045E+05 2.046E+01 1.004E-01 2.802E+01 1.882E-032076 5.356E+02 2.926E+05 1.966E+01 9.648E-02 2.692E+01 1.809E-032077 5.146E+02 2.811E+05 1.889E+01 9.270E-02 2.586E+01 1.738E-032078 4.944E+02 2.701E+05 1.815E+01 8.907E-02 2.485E+01 1.670E-032079 4.750E+02 2.595E+05 1.744E+01 8.557E-02 2.387E+01 1.604E-032080 4.564E+02 2.493E+05 1.675E+01 8.222E-02 2.294E+01 1.541E-032081 4.385E+02 2.395E+05 1.609E+01 7.899E-02 2.204E+01 1.481E-032082 4.213E+02 2.302E+05 1.546E+01 7.590E-02 2.117E+01 1.423E-032083 4.048E+02 2.211E+05 1.486E+01 7.292E-02 2.034E+01 1.367E-032084 3.889E+02 2.125E+05 1.427E+01 7.006E-02 1.955E+01 1.313E-032085 3.737E+02 2.041E+05 1.372E+01 6.731E-02 1.878E+01 1.262E-032086 3.590E+02 1.961E+05 1.318E+01 6.468E-02 1.804E+01 1.212E-032087 3.449E+02 1.884E+05 1.266E+01 6.214E-02 1.734E+01 1.165E-032088 3.314E+02 1.810E+05 1.216E+01 5.970E-02 1.666E+01 1.119E-032089 3.184E+02 1.739E+05 1.169E+01 5.736E-02 1.600E+01 1.075E-032090 3.059E+02 1.671E+05 1.123E+01 5.511E-02 1.538E+01 1.033E-032091 2.939E+02 1.606E+05 1.079E+01 5.295E-02 1.477E+01 9.926E-042092 2.824E+02 1.543E+05 1.037E+01 5.088E-02 1.419E+01 9.536E-042093 2.713E+02 1.482E+05 9.959E+00 4.888E-02 1.364E+01 9.163E-042094 2.607E+02 1.424E+05 9.569E+00 4.696E-02 1.310E+01 8.803E-042095 2.505E+02 1.368E+05 9.194E+00 4.512E-02 1.259E+01 8.458E-042096 2.406E+02 1.315E+05 8.833E+00 4.335E-02 1.209E+01 8.126E-042097 2.312E+02 1.263E+05 8.487E+00 4.165E-02 1.162E+01 7.808E-042098 2.221E+02 1.214E+05 8.154E+00 4.002E-02 1.116E+01 7.502E-042099 2.134E+02 1.166E+05 7.834E+00 3.845E-02 1.073E+01 7.207E-042100 2.051E+02 1.120E+05 7.527E+00 3.694E-02 1.031E+01 6.925E-042101 1.970E+02 1.076E+05 7.232E+00 3.549E-02 9.902E+00 6.653E-042102 1.893E+02 1.034E+05 6.948E+00 3.410E-02 9.514E+00 6.392E-042103 1.819E+02 9.936E+04 6.676E+00 3.277E-02 9.141E+00 6.142E-042104 1.747E+02 9.546E+04 6.414E+00 3.148E-02 8.783E+00 5.901E-042105 1.679E+02 9.172E+04 6.163E+00 3.025E-02 8.438E+00 5.670E-042106 1.613E+02 8.812E+04 5.921E+00 2.906E-02 8.107E+00 5.447E-04
NMOCCarbon dioxideYear
REPORT - 11

OHSWMA LandGEM - C&D (ID 1109598).xls 1/24/2017
Results (Continued)
(Mg/year) (m 3 /year) (av ft^3/min) (Mg/year) (m 3 /year) (av ft^3/min)2107 1.550E+02 8.467E+04 5.689E+00 2.792E-02 7.789E+00 5.234E-042108 1.489E+02 8.135E+04 5.466E+00 2.683E-02 7.484E+00 5.028E-042109 1.431E+02 7.816E+04 5.251E+00 2.577E-02 7.191E+00 4.831E-042110 1.375E+02 7.509E+04 5.046E+00 2.476E-02 6.909E+00 4.642E-042111 1.321E+02 7.215E+04 4.848E+00 2.379E-02 6.638E+00 4.460E-042112 1.269E+02 6.932E+04 4.658E+00 2.286E-02 6.377E+00 4.285E-042113 1.219E+02 6.660E+04 4.475E+00 2.196E-02 6.127E+00 4.117E-042114 1.171E+02 6.399E+04 4.300E+00 2.110E-02 5.887E+00 3.956E-042115 1.125E+02 6.148E+04 4.131E+00 2.027E-02 5.656E+00 3.800E-042116 1.081E+02 5.907E+04 3.969E+00 1.948E-02 5.435E+00 3.651E-042117 1.039E+02 5.675E+04 3.813E+00 1.872E-02 5.221E+00 3.508E-042118 9.982E+01 5.453E+04 3.664E+00 1.798E-02 5.017E+00 3.371E-042119 9.590E+01 5.239E+04 3.520E+00 1.728E-02 4.820E+00 3.239E-042120 9.214E+01 5.034E+04 3.382E+00 1.660E-02 4.631E+00 3.112E-042121 8.853E+01 4.836E+04 3.250E+00 1.595E-02 4.449E+00 2.990E-042122 8.506E+01 4.647E+04 3.122E+00 1.532E-02 4.275E+00 2.872E-042123 8.172E+01 4.464E+04 3.000E+00 1.472E-02 4.107E+00 2.760E-042124 7.852E+01 4.289E+04 2.882E+00 1.415E-02 3.946E+00 2.651E-042125 7.544E+01 4.121E+04 2.769E+00 1.359E-02 3.792E+00 2.548E-042126 7.248E+01 3.960E+04 2.660E+00 1.306E-02 3.643E+00 2.448E-042127 6.964E+01 3.804E+04 2.556E+00 1.255E-02 3.500E+00 2.352E-042128 6.691E+01 3.655E+04 2.456E+00 1.205E-02 3.363E+00 2.259E-042129 6.428E+01 3.512E+04 2.360E+00 1.158E-02 3.231E+00 2.171E-042130 6.176E+01 3.374E+04 2.267E+00 1.113E-02 3.104E+00 2.086E-042131 5.934E+01 3.242E+04 2.178E+00 1.069E-02 2.983E+00 2.004E-042132 5.702E+01 3.115E+04 2.093E+00 1.027E-02 2.866E+00 1.925E-042133 5.478E+01 2.993E+04 2.011E+00 9.869E-03 2.753E+00 1.850E-042134 5.263E+01 2.875E+04 1.932E+00 9.482E-03 2.645E+00 1.777E-042135 5.057E+01 2.763E+04 1.856E+00 9.110E-03 2.542E+00 1.708E-042136 4.859E+01 2.654E+04 1.783E+00 8.753E-03 2.442E+00 1.641E-042137 4.668E+01 2.550E+04 1.713E+00 8.410E-03 2.346E+00 1.576E-042138 4.485E+01 2.450E+04 1.646E+00 8.080E-03 2.254E+00 1.515E-042139 4.309E+01 2.354E+04 1.582E+00 7.763E-03 2.166E+00 1.455E-042140 4.140E+01 2.262E+04 1.520E+00 7.459E-03 2.081E+00 1.398E-042141 3.978E+01 2.173E+04 1.460E+00 7.166E-03 1.999E+00 1.343E-042142 3.822E+01 2.088E+04 1.403E+00 6.885E-03 1.921E+00 1.291E-042143 3.672E+01 2.006E+04 1.348E+00 6.615E-03 1.846E+00 1.240E-042144 3.528E+01 1.927E+04 1.295E+00 6.356E-03 1.773E+00 1.191E-042145 3.390E+01 1.852E+04 1.244E+00 6.107E-03 1.704E+00 1.145E-042146 3.257E+01 1.779E+04 1.195E+00 5.867E-03 1.637E+00 1.100E-04
NMOCYear Carbon dioxide
REPORT - 12

OHSWMA LandGEM - Sewage Sludge (ID 1109597).xls 1/24/2017
Summary ReportLandfill Name or Identifier: OHSWMA Regional Landfill
Date:
First-Order Decomposition Rate Equation:
Where,QCH4 = annual methane generation in the year of the calculation (m 3 /year )i = 1-year time increment Mi = mass of waste accepted in the ith year (Mg ) n = (year of the calculation) - (initial year of waste acceptance)j = 0.1-year time incrementk = methane generation rate (year -1 )Lo = potential methane generation capacity (m 3 /Mg )
About LandGEM:
Tuesday, January 24, 2017
LandGEM is based on a first-order decomposition rate equation for quantifying emissions from the decomposition of landfilled waste in municipal solid waste (MSW) landfills. The software provides a relatively simple approach to estimating landfill gas emissions. Model defaults are based on empirical data from U.S. landfills. Field test data can also be used in place of model defaults when available. Further guidance on EPA test methods, Clean Air Act (CAA) regulations, and other guidance regarding landfill gas emissions and control technology requirements can be found at http://www.epa.gov/ttnatw01/landfill/landflpg.html.
Description/Comments:
tij = age of the jth section of waste mass Mi accepted in the ith year (decimal years , e.g., 3.2 years)
LandGEM is considered a screening tool — the better the input data, the better the estimates. Often, there are limitations with the available data regarding waste quantity and composition, variation in design and operating practices over time, and changes occurring over time that impact the emissions potential. Changes to landfill operation, such as operating under wet conditions through leachate recirculation or other liquid additions, will result in generating more gas at a faster rate. Defaults for estimating emissions for this type of operation are being developed to include in LandGEM along with defaults for convential landfills (no leachate or liquid additions) for developing emission inventories and determining CAA applicability. Refer to the Web site identified above for future updates.
REPORT - 1
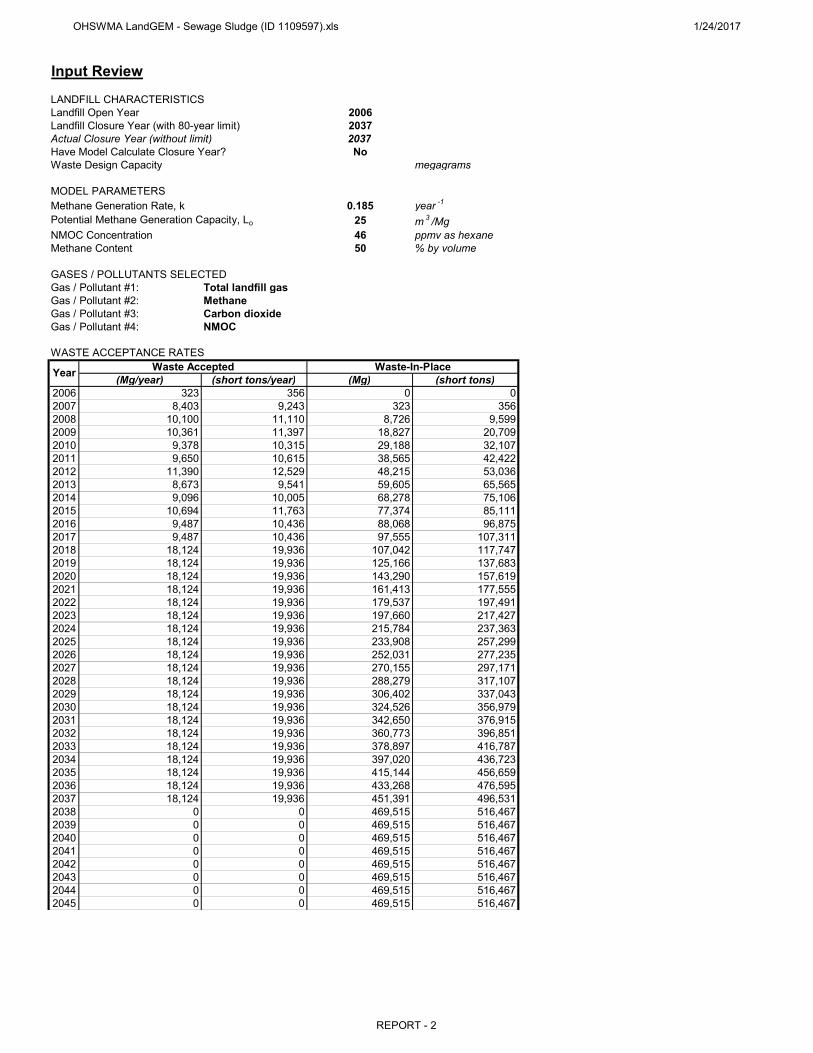
OHSWMA LandGEM - Sewage Sludge (ID 1109597).xls 1/24/2017
Input Review
LANDFILL CHARACTERISTICSLandfill Open Year 2006Landfill Closure Year (with 80-year limit) 2037Actual Closure Year (without limit) 2037Have Model Calculate Closure Year? NoWaste Design Capacity megagrams
MODEL PARAMETERSMethane Generation Rate, k 0.185 year -1
Potential Methane Generation Capacity, Lo 25 m 3 /MgNMOC Concentration 46 ppmv as hexaneMethane Content 50 % by volume
GASES / POLLUTANTS SELECTEDGas / Pollutant #1: Total landfill gasGas / Pollutant #2: MethaneGas / Pollutant #3: Carbon dioxideGas / Pollutant #4: NMOC
WASTE ACCEPTANCE RATES
(Mg/year) (short tons/year) (Mg) (short tons)2006 323 356 0 02007 8,403 9,243 323 3562008 10,100 11,110 8,726 9,5992009 10,361 11,397 18,827 20,7092010 9,378 10,315 29,188 32,1072011 9,650 10,615 38,565 42,4222012 11,390 12,529 48,215 53,0362013 8,673 9,541 59,605 65,5652014 9,096 10,005 68,278 75,1062015 10,694 11,763 77,374 85,1112016 9,487 10,436 88,068 96,8752017 9,487 10,436 97,555 107,3112018 18,124 19,936 107,042 117,7472019 18,124 19,936 125,166 137,6832020 18,124 19,936 143,290 157,6192021 18,124 19,936 161,413 177,5552022 18,124 19,936 179,537 197,4912023 18,124 19,936 197,660 217,4272024 18,124 19,936 215,784 237,3632025 18,124 19,936 233,908 257,2992026 18,124 19,936 252,031 277,2352027 18,124 19,936 270,155 297,1712028 18,124 19,936 288,279 317,1072029 18,124 19,936 306,402 337,0432030 18,124 19,936 324,526 356,9792031 18,124 19,936 342,650 376,9152032 18,124 19,936 360,773 396,8512033 18,124 19,936 378,897 416,7872034 18,124 19,936 397,020 436,7232035 18,124 19,936 415,144 456,6592036 18,124 19,936 433,268 476,5952037 18,124 19,936 451,391 496,5312038 0 0 469,515 516,4672039 0 0 469,515 516,4672040 0 0 469,515 516,4672041 0 0 469,515 516,4672042 0 0 469,515 516,4672043 0 0 469,515 516,4672044 0 0 469,515 516,4672045 0 0 469,515 516,467
Year Waste Accepted Waste-In-Place
REPORT - 2

OHSWMA LandGEM - Sewage Sludge (ID 1109597).xls 1/24/2017
WASTE ACCEPTANCE RATES (Continued)
(Mg/year) (short tons/year) (Mg) (short tons)2046 0 0 469,515 516,4672047 0 0 469,515 516,4672048 0 0 469,515 516,4672049 0 0 469,515 516,4672050 0 0 469,515 516,4672051 0 0 469,515 516,4672052 0 0 469,515 516,4672053 0 0 469,515 516,4672054 0 0 469,515 516,4672055 0 0 469,515 516,4672056 0 0 469,515 516,4672057 0 0 469,515 516,4672058 0 0 469,515 516,4672059 0 0 469,515 516,4672060 0 0 469,515 516,4672061 0 0 469,515 516,4672062 0 0 469,515 516,4672063 0 0 469,515 516,4672064 0 0 469,515 516,4672065 0 0 469,515 516,4672066 0 0 469,515 516,4672067 0 0 469,515 516,4672068 0 0 469,515 516,4672069 0 0 469,515 516,4672070 0 0 469,515 516,4672071 0 0 469,515 516,4672072 0 0 469,515 516,4672073 0 0 469,515 516,4672074 0 0 469,515 516,4672075 0 0 469,515 516,4672076 0 0 469,515 516,4672077 0 0 469,515 516,4672078 0 0 469,515 516,4672079 0 0 469,515 516,4672080 0 0 469,515 516,4672081 0 0 469,515 516,4672082 0 0 469,515 516,4672083 0 0 469,515 516,4672084 0 0 469,515 516,4672085 0 0 469,515 516,467
Waste-In-PlaceYear Waste Accepted
REPORT - 3

OHSWMA LandGEM - Sewage Sludge (ID 1109597).xls 1/24/2017
Pollutant Parameters
Concentration ConcentrationCompound (ppmv ) Molecular Weight (ppmv ) Molecular Weight
Total landfill gas 0.00Methane 16.04Carbon dioxide 44.01NMOC 4,000 86.181,1,1-Trichloroethane (methyl chloroform) - HAP 0.48 133.411,1,2,2-Tetrachloroethane - HAP/VOC 1.1 167.851,1-Dichloroethane (ethylidene dichloride) - HAP/VOC 2.4 98.971,1-Dichloroethene (vinylidene chloride) - HAP/VOC 0.20 96.941,2-Dichloroethane (ethylene dichloride) - HAP/VOC 0.41 98.961,2-Dichloropropane (propylene dichloride) - HAP/VOC 0.18 112.992-Propanol (isopropyl alcohol) - VOC 50 60.11Acetone 7.0 58.08
Acrylonitrile - HAP/VOC 6.3 53.06Benzene - No or Unknown Co-disposal - HAP/VOC 1.9 78.11Benzene - Co-disposal - HAP/VOC 11 78.11Bromodichloromethane - VOC 3.1 163.83Butane - VOC 5.0 58.12Carbon disulfide - HAP/VOC 0.58 76.13Carbon monoxide 140 28.01Carbon tetrachloride - HAP/VOC 4.0E-03 153.84Carbonyl sulfide - HAP/VOC 0.49 60.07Chlorobenzene - HAP/VOC 0.25 112.56Chlorodifluoromethane 1.3 86.47Chloroethane (ethyl chloride) - HAP/VOC 1.3 64.52Chloroform - HAP/VOC 0.03 119.39Chloromethane - VOC 1.2 50.49
Dichlorobenzene - (HAP for para isomer/VOC) 0.21 147
Dichlorodifluoromethane 16 120.91Dichlorofluoromethane - VOC 2.6 102.92Dichloromethane (methylene chloride) - HAP 14 84.94Dimethyl sulfide (methyl sulfide) - VOC 7.8 62.13Ethane 890 30.07Ethanol - VOC 27 46.08
Pollu
tant
s
User-specified Pollutant Parameters:Gas / Pollutant Default Parameters:
Gas
es
REPORT - 4

OHSWMA LandGEM - Sewage Sludge (ID 1109597).xls 1/24/2017
Pollutant Parameters (Continued)
Concentration ConcentrationCompound (ppmv ) Molecular Weight (ppmv ) Molecular Weight
Ethyl mercaptan (ethanethiol) - VOC 2.3 62.13Ethylbenzene - HAP/VOC 4.6 106.16Ethylene dibromide - HAP/VOC 1.0E-03 187.88Fluorotrichloromethane - VOC 0.76 137.38Hexane - HAP/VOC 6.6 86.18Hydrogen sulfide 36 34.08Mercury (total) - HAP 2.9E-04 200.61Methyl ethyl ketone - HAP/VOC 7.1 72.11Methyl isobutyl ketone - HAP/VOC 1.9 100.16
Methyl mercaptan - VOC 2.5 48.11Pentane - VOC 3.3 72.15Perchloroethylene (tetrachloroethylene) - HAP 3.7 165.83Propane - VOC 11 44.09t-1,2-Dichloroethene - VOC 2.8 96.94Toluene - No or Unknown Co-disposal - HAP/VOC 39 92.13Toluene - Co-disposal - HAP/VOC 170 92.13Trichloroethylene (trichloroethene) - HAP/VOC 2.8 131.40Vinyl chloride - HAP/VOC 7.3 62.50Xylenes - HAP/VOC 12 106.16Po
lluta
nts
User-specified Pollutant Parameters:Gas / Pollutant Default Parameters:
REPORT - 5

OHSWMA LandGEM - Sewage Sludge (ID 1109597).xls 1/24/2017
Graphs
0.000E+00
2.000E+02
4.000E+02
6.000E+02
8.000E+02
1.000E+03
1.200E+03
Emis
sion
s
Year
Megagrams Per Year
Total landfill gas Methane Carbon dioxide NMOC
0.000E+001.000E+052.000E+053.000E+054.000E+055.000E+056.000E+057.000E+058.000E+059.000E+051.000E+06
Emis
sion
s
Year
Cubic Meters Per Year
Total landfill gas Methane Carbon dioxide NMOC
0.000E+00
1.000E+01
2.000E+01
3.000E+01
4.000E+01
5.000E+01
6.000E+01
7.000E+01
Emis
sion
s
Year
User-specified Unit (units shown in legend below)
Total landfill gas (av ft^3/min) Methane (av ft^3/min) Carbon dioxide (av ft^3/min) NMOC (av ft^3/min)
REPORT - 6

OHSWMA LandGEM - Sewage Sludge (ID 1109597).xls 1/24/2017
Results
(Mg/year) (m 3 /year) (av ft^3/min) (Mg/year) (m 3 /year) (av ft^3/min)2006 0 0 0 0 0 02007 3.429E+00 2.746E+03 1.845E-01 9.159E-01 1.373E+03 9.224E-022008 9.193E+01 7.362E+04 4.946E+00 2.456E+01 3.681E+04 2.473E+002009 1.835E+02 1.469E+05 9.872E+00 4.901E+01 7.346E+04 4.936E+002010 2.623E+02 2.101E+05 1.411E+01 7.007E+01 1.050E+05 7.057E+002011 3.174E+02 2.542E+05 1.708E+01 8.479E+01 1.271E+05 8.540E+002012 3.661E+02 2.932E+05 1.970E+01 9.780E+01 1.466E+05 9.849E+002013 4.250E+02 3.403E+05 2.287E+01 1.135E+02 1.702E+05 1.143E+012014 4.452E+02 3.565E+05 2.395E+01 1.189E+02 1.782E+05 1.198E+012015 4.664E+02 3.735E+05 2.510E+01 1.246E+02 1.867E+05 1.255E+012016 5.010E+02 4.012E+05 2.696E+01 1.338E+02 2.006E+05 1.348E+012017 5.170E+02 4.140E+05 2.781E+01 1.381E+02 2.070E+05 1.391E+012018 5.302E+02 4.246E+05 2.853E+01 1.416E+02 2.123E+05 1.426E+012019 6.328E+02 5.067E+05 3.405E+01 1.690E+02 2.534E+05 1.702E+012020 7.181E+02 5.750E+05 3.863E+01 1.918E+02 2.875E+05 1.932E+012021 7.889E+02 6.317E+05 4.245E+01 2.107E+02 3.159E+05 2.122E+012022 8.478E+02 6.789E+05 4.561E+01 2.265E+02 3.394E+05 2.281E+012023 8.968E+02 7.181E+05 4.825E+01 2.395E+02 3.590E+05 2.412E+012024 9.374E+02 7.507E+05 5.044E+01 2.504E+02 3.753E+05 2.522E+012025 9.712E+02 7.777E+05 5.226E+01 2.594E+02 3.889E+05 2.613E+012026 9.993E+02 8.002E+05 5.377E+01 2.669E+02 4.001E+05 2.688E+012027 1.023E+03 8.189E+05 5.502E+01 2.732E+02 4.095E+05 2.751E+012028 1.042E+03 8.345E+05 5.607E+01 2.784E+02 4.172E+05 2.803E+012029 1.058E+03 8.474E+05 5.694E+01 2.827E+02 4.237E+05 2.847E+012030 1.072E+03 8.581E+05 5.766E+01 2.862E+02 4.291E+05 2.883E+012031 1.083E+03 8.670E+05 5.826E+01 2.892E+02 4.335E+05 2.913E+012032 1.092E+03 8.744E+05 5.875E+01 2.917E+02 4.372E+05 2.938E+012033 1.100E+03 8.806E+05 5.917E+01 2.937E+02 4.403E+05 2.958E+012034 1.106E+03 8.857E+05 5.951E+01 2.955E+02 4.429E+05 2.976E+012035 1.111E+03 8.900E+05 5.980E+01 2.969E+02 4.450E+05 2.990E+012036 1.116E+03 8.935E+05 6.004E+01 2.981E+02 4.468E+05 3.002E+012037 1.120E+03 8.965E+05 6.023E+01 2.990E+02 4.482E+05 3.012E+012038 1.123E+03 8.989E+05 6.040E+01 2.999E+02 4.495E+05 3.020E+012039 9.330E+02 7.471E+05 5.020E+01 2.492E+02 3.735E+05 2.510E+012040 7.754E+02 6.209E+05 4.172E+01 2.071E+02 3.105E+05 2.086E+012041 6.444E+02 5.160E+05 3.467E+01 1.721E+02 2.580E+05 1.734E+012042 5.356E+02 4.289E+05 2.882E+01 1.431E+02 2.144E+05 1.441E+012043 4.451E+02 3.564E+05 2.395E+01 1.189E+02 1.782E+05 1.197E+012044 3.700E+02 2.962E+05 1.990E+01 9.882E+01 1.481E+05 9.952E+002045 3.075E+02 2.462E+05 1.654E+01 8.213E+01 1.231E+05 8.271E+002046 2.555E+02 2.046E+05 1.375E+01 6.826E+01 1.023E+05 6.874E+002047 2.124E+02 1.701E+05 1.143E+01 5.673E+01 8.503E+04 5.713E+002048 1.765E+02 1.413E+05 9.497E+00 4.715E+01 7.067E+04 4.748E+002049 1.467E+02 1.175E+05 7.893E+00 3.918E+01 5.873E+04 3.946E+002050 1.219E+02 9.763E+04 6.560E+00 3.257E+01 4.881E+04 3.280E+002051 1.013E+02 8.114E+04 5.452E+00 2.707E+01 4.057E+04 2.726E+002052 8.422E+01 6.744E+04 4.531E+00 2.249E+01 3.372E+04 2.266E+002053 6.999E+01 5.605E+04 3.766E+00 1.870E+01 2.802E+04 1.883E+002054 5.817E+01 4.658E+04 3.130E+00 1.554E+01 2.329E+04 1.565E+002055 4.835E+01 3.871E+04 2.601E+00 1.291E+01 1.936E+04 1.301E+00
MethaneTotal landfill gasYear
REPORT - 7

OHSWMA LandGEM - Sewage Sludge (ID 1109597).xls 1/24/2017
Results (Continued)
(Mg/year) (m 3 /year) (av ft^3/min) (Mg/year) (m 3 /year) (av ft^3/min)2056 4.018E+01 3.217E+04 2.162E+00 1.073E+01 1.609E+04 1.081E+002057 3.339E+01 2.674E+04 1.797E+00 8.920E+00 1.337E+04 8.983E-012058 2.775E+01 2.222E+04 1.493E+00 7.413E+00 1.111E+04 7.466E-012059 2.307E+01 1.847E+04 1.241E+00 6.161E+00 9.235E+03 6.205E-012060 1.917E+01 1.535E+04 1.031E+00 5.121E+00 7.675E+03 5.157E-012061 1.593E+01 1.276E+04 8.572E-01 4.256E+00 6.379E+03 4.286E-012062 1.324E+01 1.060E+04 7.124E-01 3.537E+00 5.302E+03 3.562E-012063 1.101E+01 8.813E+03 5.921E-01 2.940E+00 4.406E+03 2.961E-012064 9.147E+00 7.324E+03 4.921E-01 2.443E+00 3.662E+03 2.461E-012065 7.602E+00 6.087E+03 4.090E-01 2.031E+00 3.044E+03 2.045E-012066 6.318E+00 5.059E+03 3.399E-01 1.688E+00 2.530E+03 1.700E-012067 5.251E+00 4.205E+03 2.825E-01 1.403E+00 2.102E+03 1.413E-012068 4.364E+00 3.494E+03 2.348E-01 1.166E+00 1.747E+03 1.174E-012069 3.627E+00 2.904E+03 1.951E-01 9.688E-01 1.452E+03 9.757E-022070 3.014E+00 2.414E+03 1.622E-01 8.052E-01 1.207E+03 8.109E-022071 2.505E+00 2.006E+03 1.348E-01 6.692E-01 1.003E+03 6.739E-022072 2.082E+00 1.667E+03 1.120E-01 5.562E-01 8.336E+02 5.601E-022073 1.730E+00 1.386E+03 9.310E-02 4.622E-01 6.928E+02 4.655E-022074 1.438E+00 1.152E+03 7.738E-02 3.842E-01 5.758E+02 3.869E-022075 1.195E+00 9.571E+02 6.431E-02 3.193E-01 4.786E+02 3.215E-022076 9.934E-01 7.955E+02 5.345E-02 2.653E-01 3.977E+02 2.672E-022077 8.256E-01 6.611E+02 4.442E-02 2.205E-01 3.306E+02 2.221E-022078 6.862E-01 5.495E+02 3.692E-02 1.833E-01 2.747E+02 1.846E-022079 5.703E-01 4.567E+02 3.068E-02 1.523E-01 2.283E+02 1.534E-022080 4.740E-01 3.795E+02 2.550E-02 1.266E-01 1.898E+02 1.275E-022081 3.939E-01 3.154E+02 2.119E-02 1.052E-01 1.577E+02 1.060E-022082 3.274E-01 2.622E+02 1.761E-02 8.745E-02 1.311E+02 8.807E-032083 2.721E-01 2.179E+02 1.464E-02 7.268E-02 1.089E+02 7.320E-032084 2.261E-01 1.811E+02 1.217E-02 6.040E-02 9.054E+01 6.083E-032085 1.879E-01 1.505E+02 1.011E-02 5.020E-02 7.525E+01 5.056E-032086 1.562E-01 1.251E+02 8.404E-03 4.172E-02 6.254E+01 4.202E-032087 1.298E-01 1.040E+02 6.985E-03 3.468E-02 5.198E+01 3.492E-032088 1.079E-01 8.640E+01 5.805E-03 2.882E-02 4.320E+01 2.902E-032089 8.967E-02 7.180E+01 4.824E-03 2.395E-02 3.590E+01 2.412E-032090 7.453E-02 5.968E+01 4.010E-03 1.991E-02 2.984E+01 2.005E-032091 6.194E-02 4.960E+01 3.332E-03 1.654E-02 2.480E+01 1.666E-032092 5.148E-02 4.122E+01 2.770E-03 1.375E-02 2.061E+01 1.385E-032093 4.278E-02 3.426E+01 2.302E-03 1.143E-02 1.713E+01 1.151E-032094 3.556E-02 2.847E+01 1.913E-03 9.498E-03 1.424E+01 9.565E-042095 2.955E-02 2.366E+01 1.590E-03 7.894E-03 1.183E+01 7.950E-042096 2.456E-02 1.967E+01 1.321E-03 6.560E-03 9.833E+00 6.607E-042097 2.041E-02 1.635E+01 1.098E-03 5.452E-03 8.173E+00 5.491E-042098 1.696E-02 1.358E+01 9.127E-04 4.531E-03 6.792E+00 4.564E-042099 1.410E-02 1.129E+01 7.586E-04 3.766E-03 5.645E+00 3.793E-042100 1.172E-02 9.383E+00 6.305E-04 3.130E-03 4.692E+00 3.152E-042101 9.739E-03 7.799E+00 5.240E-04 2.601E-03 3.899E+00 2.620E-042102 8.094E-03 6.481E+00 4.355E-04 2.162E-03 3.241E+00 2.177E-042103 6.727E-03 5.387E+00 3.619E-04 1.797E-03 2.693E+00 1.810E-042104 5.591E-03 4.477E+00 3.008E-04 1.493E-03 2.238E+00 1.504E-042105 4.647E-03 3.721E+00 2.500E-04 1.241E-03 1.860E+00 1.250E-042106 3.862E-03 3.092E+00 2.078E-04 1.032E-03 1.546E+00 1.039E-04
Year MethaneTotal landfill gas
REPORT - 8

OHSWMA LandGEM - Sewage Sludge (ID 1109597).xls 1/24/2017
Results (Continued)
(Mg/year) (m 3 /year) (av ft^3/min) (Mg/year) (m 3 /year) (av ft^3/min)2107 3.210E-03 2.570E+00 1.727E-04 8.573E-04 1.285E+00 8.634E-052108 2.667E-03 2.136E+00 1.435E-04 7.125E-04 1.068E+00 7.176E-052109 2.217E-03 1.775E+00 1.193E-04 5.922E-04 8.876E-01 5.964E-052110 1.843E-03 1.475E+00 9.913E-05 4.922E-04 7.377E-01 4.957E-052111 1.531E-03 1.226E+00 8.239E-05 4.090E-04 6.131E-01 4.119E-052112 1.273E-03 1.019E+00 6.847E-05 3.400E-04 5.096E-01 3.424E-052113 1.058E-03 8.470E-01 5.691E-05 2.825E-04 4.235E-01 2.845E-052114 8.791E-04 7.039E-01 4.730E-05 2.348E-04 3.520E-01 2.365E-052115 7.306E-04 5.850E-01 3.931E-05 1.952E-04 2.925E-01 1.965E-052116 6.072E-04 4.862E-01 3.267E-05 1.622E-04 2.431E-01 1.634E-052117 5.047E-04 4.041E-01 2.715E-05 1.348E-04 2.021E-01 1.358E-052118 4.194E-04 3.359E-01 2.257E-05 1.120E-04 1.679E-01 1.128E-052119 3.486E-04 2.791E-01 1.875E-05 9.311E-05 1.396E-01 9.377E-062120 2.897E-04 2.320E-01 1.559E-05 7.739E-05 1.160E-01 7.794E-062121 2.408E-04 1.928E-01 1.295E-05 6.432E-05 9.640E-02 6.477E-062122 2.001E-04 1.602E-01 1.077E-05 5.345E-05 8.012E-02 5.383E-062123 1.663E-04 1.332E-01 8.948E-06 4.442E-05 6.659E-02 4.474E-062124 1.382E-04 1.107E-01 7.437E-06 3.692E-05 5.534E-02 3.718E-062125 1.149E-04 9.199E-02 6.181E-06 3.069E-05 4.600E-02 3.090E-062126 9.548E-05 7.645E-02 5.137E-06 2.550E-05 3.823E-02 2.568E-062127 7.935E-05 6.354E-02 4.269E-06 2.120E-05 3.177E-02 2.135E-062128 6.595E-05 5.281E-02 3.548E-06 1.762E-05 2.640E-02 1.774E-062129 5.481E-05 4.389E-02 2.949E-06 1.464E-05 2.195E-02 1.474E-062130 4.555E-05 3.648E-02 2.451E-06 1.217E-05 1.824E-02 1.225E-062131 3.786E-05 3.032E-02 2.037E-06 1.011E-05 1.516E-02 1.018E-062132 3.147E-05 2.520E-02 1.693E-06 8.405E-06 1.260E-02 8.465E-072133 2.615E-05 2.094E-02 1.407E-06 6.985E-06 1.047E-02 7.035E-072134 2.173E-05 1.740E-02 1.169E-06 5.805E-06 8.702E-03 5.847E-072135 1.806E-05 1.446E-02 9.719E-07 4.825E-06 7.232E-03 4.859E-072136 1.501E-05 1.202E-02 8.077E-07 4.010E-06 6.011E-03 4.039E-072137 1.248E-05 9.991E-03 6.713E-07 3.333E-06 4.996E-03 3.356E-072138 1.037E-05 8.304E-03 5.579E-07 2.770E-06 4.152E-03 2.790E-072139 8.618E-06 6.901E-03 4.637E-07 2.302E-06 3.451E-03 2.318E-072140 7.163E-06 5.736E-03 3.854E-07 1.913E-06 2.868E-03 1.927E-072141 5.953E-06 4.767E-03 3.203E-07 1.590E-06 2.383E-03 1.601E-072142 4.948E-06 3.962E-03 2.662E-07 1.322E-06 1.981E-03 1.331E-072143 4.112E-06 3.293E-03 2.212E-07 1.098E-06 1.646E-03 1.106E-072144 3.417E-06 2.737E-03 1.839E-07 9.128E-07 1.368E-03 9.193E-082145 2.840E-06 2.274E-03 1.528E-07 7.587E-07 1.137E-03 7.641E-082146 2.361E-06 1.890E-03 1.270E-07 6.305E-07 9.451E-04 6.350E-08
Year Total landfill gas Methane
REPORT - 9

OHSWMA LandGEM - Sewage Sludge (ID 1109597).xls 1/24/2017
Results (Continued)
Year(Mg/year) (m 3 /year) (av ft^3/min) (Mg/year) (m 3 /year) (av ft^3/min)
2006 0 0 0 0 0 02007 2.513E+00 1.373E+03 9.224E-02 4.527E-04 1.263E-01 8.486E-062008 6.738E+01 3.681E+04 2.473E+00 1.214E-02 3.386E+00 2.275E-042009 1.345E+02 7.346E+04 4.936E+00 2.423E-02 6.758E+00 4.541E-042010 1.923E+02 1.050E+05 7.057E+00 3.464E-02 9.663E+00 6.493E-042011 2.326E+02 1.271E+05 8.540E+00 4.191E-02 1.169E+01 7.856E-042012 2.683E+02 1.466E+05 9.849E+00 4.834E-02 1.349E+01 9.061E-042013 3.115E+02 1.702E+05 1.143E+01 5.612E-02 1.566E+01 1.052E-032014 3.263E+02 1.782E+05 1.198E+01 5.878E-02 1.640E+01 1.102E-032015 3.418E+02 1.867E+05 1.255E+01 6.158E-02 1.718E+01 1.154E-032016 3.672E+02 2.006E+05 1.348E+01 6.615E-02 1.846E+01 1.240E-032017 3.789E+02 2.070E+05 1.391E+01 6.826E-02 1.904E+01 1.279E-032018 3.886E+02 2.123E+05 1.426E+01 7.001E-02 1.953E+01 1.312E-032019 4.638E+02 2.534E+05 1.702E+01 8.355E-02 2.331E+01 1.566E-032020 5.263E+02 2.875E+05 1.932E+01 9.481E-02 2.645E+01 1.777E-032021 5.782E+02 3.159E+05 2.122E+01 1.042E-01 2.906E+01 1.953E-032022 6.214E+02 3.394E+05 2.281E+01 1.119E-01 3.123E+01 2.098E-032023 6.572E+02 3.590E+05 2.412E+01 1.184E-01 3.303E+01 2.219E-032024 6.870E+02 3.753E+05 2.522E+01 1.238E-01 3.453E+01 2.320E-032025 7.118E+02 3.889E+05 2.613E+01 1.282E-01 3.578E+01 2.404E-032026 7.324E+02 4.001E+05 2.688E+01 1.319E-01 3.681E+01 2.473E-032027 7.495E+02 4.095E+05 2.751E+01 1.350E-01 3.767E+01 2.531E-032028 7.637E+02 4.172E+05 2.803E+01 1.376E-01 3.839E+01 2.579E-032029 7.756E+02 4.237E+05 2.847E+01 1.397E-01 3.898E+01 2.619E-032030 7.854E+02 4.291E+05 2.883E+01 1.415E-01 3.947E+01 2.652E-032031 7.936E+02 4.335E+05 2.913E+01 1.430E-01 3.988E+01 2.680E-032032 8.003E+02 4.372E+05 2.938E+01 1.442E-01 4.022E+01 2.703E-032033 8.060E+02 4.403E+05 2.958E+01 1.452E-01 4.051E+01 2.722E-032034 8.107E+02 4.429E+05 2.976E+01 1.460E-01 4.074E+01 2.738E-032035 8.146E+02 4.450E+05 2.990E+01 1.467E-01 4.094E+01 2.751E-032036 8.178E+02 4.468E+05 3.002E+01 1.473E-01 4.110E+01 2.762E-032037 8.205E+02 4.482E+05 3.012E+01 1.478E-01 4.124E+01 2.771E-032038 8.227E+02 4.495E+05 3.020E+01 1.482E-01 4.135E+01 2.778E-032039 6.838E+02 3.735E+05 2.510E+01 1.232E-01 3.437E+01 2.309E-032040 5.683E+02 3.105E+05 2.086E+01 1.024E-01 2.856E+01 1.919E-032041 4.723E+02 2.580E+05 1.734E+01 8.509E-02 2.374E+01 1.595E-032042 3.925E+02 2.144E+05 1.441E+01 7.072E-02 1.973E+01 1.326E-032043 3.262E+02 1.782E+05 1.197E+01 5.877E-02 1.640E+01 1.102E-032044 2.711E+02 1.481E+05 9.952E+00 4.885E-02 1.363E+01 9.156E-042045 2.253E+02 1.231E+05 8.271E+00 4.060E-02 1.133E+01 7.610E-042046 1.873E+02 1.023E+05 6.874E+00 3.374E-02 9.413E+00 6.324E-042047 1.557E+02 8.503E+04 5.713E+00 2.804E-02 7.823E+00 5.256E-042048 1.294E+02 7.067E+04 4.748E+00 2.331E-02 6.502E+00 4.368E-042049 1.075E+02 5.873E+04 3.946E+00 1.937E-02 5.404E+00 3.631E-042050 8.936E+01 4.881E+04 3.280E+00 1.610E-02 4.491E+00 3.017E-042051 7.426E+01 4.057E+04 2.726E+00 1.338E-02 3.732E+00 2.508E-042052 6.172E+01 3.372E+04 2.266E+00 1.112E-02 3.102E+00 2.084E-042053 5.130E+01 2.802E+04 1.883E+00 9.241E-03 2.578E+00 1.732E-042054 4.263E+01 2.329E+04 1.565E+00 7.680E-03 2.143E+00 1.440E-042055 3.543E+01 1.936E+04 1.301E+00 6.383E-03 1.781E+00 1.197E-04
NMOCCarbon dioxide
REPORT - 10

OHSWMA LandGEM - Sewage Sludge (ID 1109597).xls 1/24/2017
Results (Continued)
(Mg/year) (m 3 /year) (av ft^3/min) (Mg/year) (m 3 /year) (av ft^3/min)2056 2.945E+01 1.609E+04 1.081E+00 5.305E-03 1.480E+00 9.944E-052057 2.447E+01 1.337E+04 8.983E-01 4.409E-03 1.230E+00 8.265E-052058 2.034E+01 1.111E+04 7.466E-01 3.664E-03 1.022E+00 6.869E-052059 1.691E+01 9.235E+03 6.205E-01 3.046E-03 8.496E-01 5.709E-052060 1.405E+01 7.675E+03 5.157E-01 2.531E-03 7.061E-01 4.745E-052061 1.168E+01 6.379E+03 4.286E-01 2.104E-03 5.869E-01 3.943E-052062 9.705E+00 5.302E+03 3.562E-01 1.748E-03 4.878E-01 3.277E-052063 8.066E+00 4.406E+03 2.961E-01 1.453E-03 4.054E-01 2.724E-052064 6.703E+00 3.662E+03 2.461E-01 1.208E-03 3.369E-01 2.264E-052065 5.571E+00 3.044E+03 2.045E-01 1.004E-03 2.800E-01 1.881E-052066 4.630E+00 2.530E+03 1.700E-01 8.342E-04 2.327E-01 1.564E-052067 3.848E+00 2.102E+03 1.413E-01 6.933E-04 1.934E-01 1.300E-052068 3.198E+00 1.747E+03 1.174E-01 5.762E-04 1.607E-01 1.080E-052069 2.658E+00 1.452E+03 9.757E-02 4.789E-04 1.336E-01 8.976E-062070 2.209E+00 1.207E+03 8.109E-02 3.980E-04 1.110E-01 7.460E-062071 1.836E+00 1.003E+03 6.739E-02 3.308E-04 9.228E-02 6.200E-062072 1.526E+00 8.336E+02 5.601E-02 2.749E-04 7.669E-02 5.153E-062073 1.268E+00 6.928E+02 4.655E-02 2.285E-04 6.374E-02 4.283E-062074 1.054E+00 5.758E+02 3.869E-02 1.899E-04 5.298E-02 3.559E-062075 8.760E-01 4.786E+02 3.215E-02 1.578E-04 4.403E-02 2.958E-062076 7.281E-01 3.977E+02 2.672E-02 1.312E-04 3.659E-02 2.459E-062077 6.051E-01 3.306E+02 2.221E-02 1.090E-04 3.041E-02 2.043E-062078 5.029E-01 2.747E+02 1.846E-02 9.060E-05 2.528E-02 1.698E-062079 4.180E-01 2.283E+02 1.534E-02 7.530E-05 2.101E-02 1.411E-062080 3.474E-01 1.898E+02 1.275E-02 6.258E-05 1.746E-02 1.173E-062081 2.887E-01 1.577E+02 1.060E-02 5.201E-05 1.451E-02 9.749E-072082 2.399E-01 1.311E+02 8.807E-03 4.323E-05 1.206E-02 8.103E-072083 1.994E-01 1.089E+02 7.320E-03 3.592E-05 1.002E-02 6.734E-072084 1.657E-01 9.054E+01 6.083E-03 2.986E-05 8.330E-03 5.597E-072085 1.377E-01 7.525E+01 5.056E-03 2.481E-05 6.923E-03 4.651E-072086 1.145E-01 6.254E+01 4.202E-03 2.062E-05 5.754E-03 3.866E-072087 9.514E-02 5.198E+01 3.492E-03 1.714E-05 4.782E-03 3.213E-072088 7.907E-02 4.320E+01 2.902E-03 1.425E-05 3.974E-03 2.670E-072089 6.572E-02 3.590E+01 2.412E-03 1.184E-05 3.303E-03 2.219E-072090 5.462E-02 2.984E+01 2.005E-03 9.840E-06 2.745E-03 1.844E-072091 4.539E-02 2.480E+01 1.666E-03 8.178E-06 2.281E-03 1.533E-072092 3.773E-02 2.061E+01 1.385E-03 6.797E-06 1.896E-03 1.274E-072093 3.136E-02 1.713E+01 1.151E-03 5.649E-06 1.576E-03 1.059E-072094 2.606E-02 1.424E+01 9.565E-04 4.695E-06 1.310E-03 8.800E-082095 2.166E-02 1.183E+01 7.950E-04 3.902E-06 1.089E-03 7.314E-082096 1.800E-02 9.833E+00 6.607E-04 3.243E-06 9.047E-04 6.079E-082097 1.496E-02 8.173E+00 5.491E-04 2.695E-06 7.519E-04 5.052E-082098 1.243E-02 6.792E+00 4.564E-04 2.240E-06 6.249E-04 4.199E-082099 1.033E-02 5.645E+00 3.793E-04 1.862E-06 5.193E-04 3.490E-082100 8.588E-03 4.692E+00 3.152E-04 1.547E-06 4.316E-04 2.900E-082101 7.138E-03 3.899E+00 2.620E-04 1.286E-06 3.587E-04 2.410E-082102 5.932E-03 3.241E+00 2.177E-04 1.069E-06 2.981E-04 2.003E-082103 4.930E-03 2.693E+00 1.810E-04 8.882E-07 2.478E-04 1.665E-082104 4.097E-03 2.238E+00 1.504E-04 7.382E-07 2.059E-04 1.384E-082105 3.405E-03 1.860E+00 1.250E-04 6.135E-07 1.712E-04 1.150E-082106 2.830E-03 1.546E+00 1.039E-04 5.099E-07 1.422E-04 9.558E-09
Carbon dioxideYear NMOC
REPORT - 11

OHSWMA LandGEM - Sewage Sludge (ID 1109597).xls 1/24/2017
Results (Continued)
(Mg/year) (m 3 /year) (av ft^3/min) (Mg/year) (m 3 /year) (av ft^3/min)2107 2.352E-03 1.285E+00 8.634E-05 4.238E-07 1.182E-04 7.943E-092108 1.955E-03 1.068E+00 7.176E-05 3.522E-07 9.826E-05 6.602E-092109 1.625E-03 8.876E-01 5.964E-05 2.927E-07 8.166E-05 5.487E-092110 1.350E-03 7.377E-01 4.957E-05 2.433E-07 6.787E-05 4.560E-092111 1.122E-03 6.131E-01 4.119E-05 2.022E-07 5.641E-05 3.790E-092112 9.327E-04 5.096E-01 3.424E-05 1.680E-07 4.688E-05 3.150E-092113 7.752E-04 4.235E-01 2.845E-05 1.397E-07 3.896E-05 2.618E-092114 6.443E-04 3.520E-01 2.365E-05 1.161E-07 3.238E-05 2.176E-092115 5.355E-04 2.925E-01 1.965E-05 9.647E-08 2.691E-05 1.808E-092116 4.450E-04 2.431E-01 1.634E-05 8.017E-08 2.237E-05 1.503E-092117 3.699E-04 2.021E-01 1.358E-05 6.663E-08 1.859E-05 1.249E-092118 3.074E-04 1.679E-01 1.128E-05 5.538E-08 1.545E-05 1.038E-092119 2.555E-04 1.396E-01 9.377E-06 4.603E-08 1.284E-05 8.627E-102120 2.123E-04 1.160E-01 7.794E-06 3.825E-08 1.067E-05 7.170E-102121 1.765E-04 9.640E-02 6.477E-06 3.179E-08 8.869E-06 5.959E-102122 1.467E-04 8.012E-02 5.383E-06 2.642E-08 7.371E-06 4.953E-102123 1.219E-04 6.659E-02 4.474E-06 2.196E-08 6.126E-06 4.116E-102124 1.013E-04 5.534E-02 3.718E-06 1.825E-08 5.092E-06 3.421E-102125 8.419E-05 4.600E-02 3.090E-06 1.517E-08 4.232E-06 2.843E-102126 6.997E-05 3.823E-02 2.568E-06 1.261E-08 3.517E-06 2.363E-102127 5.816E-05 3.177E-02 2.135E-06 1.048E-08 2.923E-06 1.964E-102128 4.833E-05 2.640E-02 1.774E-06 8.708E-09 2.429E-06 1.632E-102129 4.017E-05 2.195E-02 1.474E-06 7.237E-09 2.019E-06 1.357E-102130 3.339E-05 1.824E-02 1.225E-06 6.015E-09 1.678E-06 1.127E-102131 2.775E-05 1.516E-02 1.018E-06 4.999E-09 1.395E-06 9.370E-112132 2.306E-05 1.260E-02 8.465E-07 4.154E-09 1.159E-06 7.787E-112133 1.917E-05 1.047E-02 7.035E-07 3.453E-09 9.633E-07 6.472E-112134 1.593E-05 8.702E-03 5.847E-07 2.870E-09 8.006E-07 5.379E-112135 1.324E-05 7.232E-03 4.859E-07 2.385E-09 6.654E-07 4.471E-112136 1.100E-05 6.011E-03 4.039E-07 1.982E-09 5.530E-07 3.716E-112137 9.144E-06 4.996E-03 3.356E-07 1.647E-09 4.596E-07 3.088E-112138 7.600E-06 4.152E-03 2.790E-07 1.369E-09 3.820E-07 2.566E-112139 6.316E-06 3.451E-03 2.318E-07 1.138E-09 3.175E-07 2.133E-112140 5.249E-06 2.868E-03 1.927E-07 9.457E-10 2.638E-07 1.773E-112141 4.363E-06 2.383E-03 1.601E-07 7.860E-10 2.193E-07 1.473E-112142 3.626E-06 1.981E-03 1.331E-07 6.532E-10 1.822E-07 1.224E-112143 3.014E-06 1.646E-03 1.106E-07 5.429E-10 1.515E-07 1.018E-112144 2.505E-06 1.368E-03 9.193E-08 4.512E-10 1.259E-07 8.458E-122145 2.082E-06 1.137E-03 7.641E-08 3.750E-10 1.046E-07 7.029E-122146 1.730E-06 9.451E-04 6.350E-08 3.117E-10 8.695E-08 5.842E-12
NMOCYear Carbon dioxide
REPORT - 12