Soto Canoga Park, California 91304 - ETEC - Department of ...
58
8900 De Soto Avenue Canoga Park, California 91304
Transcript of Soto Canoga Park, California 91304 - ETEC - Department of ...

8900 De Soto Avenue Canoga Park, California 91304


A-3. SSFL S i 57 Through 1978 . . . . . . . . . . * . * * . . * a . n - * *
n t A i r R a d i o a c t i v i t y Concen Through1978 . . . . . . . . . . . . . . . . . . . . . . . .
. NPDES No. CA60-0130 E f f e c t i v e September 2 7 , 1976 . . . . . . .

Pa
Energy Systems Group - De Soto S i t e . . . . . . . . . . . . . . . . 8
Energy Systems Group - Santa Susana F i e l d Labo ra to r i es S i t e . . . . Map o f Santa Susan F i e l d Labo ra to r i es S i t e F a c i l i t i e s . . . . . . I I Map o f General Los Angeles Area . . . . . . . . . . . . . . . . . . 15
ap o f Canoga Park, Simi V a l l e y , Agoura and Calabasas Sampling S t a t i o n s . . . . . . . . . . . . . . . . . . . . . . . . . 28
Map o f De Soto i t e and V i c i n i t y Sampling S t a t i o n s . . . . . . . . 3 0
p o f Santa Susana F i e l d L a b o r a t o r i e s S i t e Sampling S t a t i o n s . . . 3 1
Da i 1 y Average Long-Lived A i r b o r e R a d i o a c t i v i t y a t t h e De Soto and Santa Susana F i e l d L b o r a t o r i e s S i t e - 1978 . . . . . . 36

i n i s attributed

V)
rb I:
s 0 .F
C-' rb L 0 n L 0 0
7
rd s 0
a,--
C, rb s L a, C, s
b-4
r(-
P
a, TI)
TI) SZ 5
I: 0 L
0 n E 0 U
9- 0
17, s ' F
C, V) QJ w TI) s rd
m
s 0 '7
C, rd U -,-- L II rd 't
'+
I .,-- L II rb rc
TI) s 5
4-J s a,
5 0
r-- a, > a, TI)
a, I: C,
a, TI) I
r--
U s .C
9- 0
s 0 ' ,-- C-' 0 rcl Q- a, I 0- .r #--
TI) I; rb
s 0 ' C C, rd 0 ' F
9- .P
U)
id 17,
2 L QJ s a,
0 'F
E 0 C, rd
C -7
TI) a, 0, rd m s a,
s a, a, II
rb QJ L
h: U L rb QJ V)
a, L
TI) s 5
C, V) a, k,
L 0 Q-
r-- a, 3 rr-
I Or-
)-.
O f -
0 rd 't
U ' r '+- O r -
C, s a, - r 0 V)
a
t 0 *r- C, rb L
C-' fn
V) a, t-- . r- E
M CU
h - a, C, rd E "P
X 0 L Q Q rd
.? rb P
s L 0 9- -r- P
rd 0
x L rb a
rd m 0 I= 5 0
s -,-- TI) a, +' rb 0 0
r--
a, L rb
r?
d
a, L 5 m
O r -
LL - v, a r'-
w
C rd 0
a, II C,
'+- 0
,-- 5 U 'r- Q % w
m
C-
a, > at ,--- V)
O r -
aJ C-' *r- V)
a, I: k
V) aJ i-
a, m s Q
V) 0 1
s 3 0 C, s 3 0 T7
It 0
C, In a, 3 2 -C, L 0 L1
V) a, V) s a, 0 .r r--
L QJ TI) s 3
m
V)
E (d L en 0 L n
L 5 a, r-- U 3 s V) - a. I 0 L a a, I: C,
'4- 0
s ' r rb C, L a, 0
L 0 0 ,--- 9-
h a, II
P
rd > 0 u L1 rd L1 L aJ LL
TI) a,
?--
x s .r
L n V)
S rb a, C, 5
#--
a L rb
r-- I m a, L L - r s rb
01 a 93 a, 11 - r- L U V) a, T7
a, a
2 E
aJ -I-" .r V)
a, c t-
at 17, rb
P
rb 0 .r en 0 r--=
0 a, 0,
s C,
TI) C rd
0 czL: z 9 a TI) a, m I= a, 0 '7
P
V)
c 0 ' t- -bj
rd b a, a 0
L rd a, P-
O S C
2 O
-#--
I: 3
c -r
V) a, .7
w 'F - .,-- U rb
Q-
I= ' r- 5 C, C 0 U
0 07 II
rd
-_I LL V) #
L a, C, s M - ,--- a, 3 x 0 0 CL
a, I: Cs
C--
sl V
. * a, TI) 3 7
U s .r
V) a,
.r-" .C, . r- C .,-- 0 rd Q-
-73 a, V)
s cli u -r
r-
a, I: I--
TI) a, C, 0 I -0 s 0 U
a, L 5
m,
a, k, id C, #
Q 0
r-- a, > a, cl
ul P-
rb -i-
L a, Q rb E
L rb a, F--
U I z a, ..c k,
r?
CU V
* #.
0 CU 0
en s ' r- -0 #--
.r 5 M
m
r?
-I I. H
IY V
2 0 C-' 5 L 0 n rb 1
C, 0 II
r(-
rd s 0
O r -
C, rd s
r?
e- V
TI) s rd
. m
M m 0
m I= ' r- TI) 7
-7
3 m
m
L 0 C, u rd a, L
c U L rd a, in a, L
-0 s a s 0
O r
C, rb s E rd X a,
L rb a, i---
U I s
L n m
I 1
a,
C,
07 s -7


f
,AIN E
SCALE IN FEET
Figure 3. Map of Santa Susana Field Laboratories S i t e
Fac i l i t i e s (Sheet 1 of 2 )


BUILDING OWNE ZONE
ROCKWELLIGOVT. 4C ROCKVVELL ROCKWELL RGCKWELL ROCKWELL ROCKWELL
GOVT. ROCKWELL
GOVT. GOVT. GOVT.
ROCKWELL GOVT.
ROCMWELL GOVT. GOVT. GOVT. GQVT. GOV7. GOVT. GOVT. GOVT. GOVT. GOVT. GOVT. GOVT. GOVT. GOVT. GOVT.
ROCKWELL GOVT. GOVT. GOVT.
ROCKWELL ROCKWELL
GOVT. ROCKWELL
GOVT. GOVT. GOVT. GOVT. GOVT, GOVT.
R0CKWEL.L GOVT.
ROCKWELL ROCKWELL ROCKWELL ROCKWELL ROCKWELL ROCKWELL
GOVT. ROCKWELL ROCKWELL ROCKWELL ROCKWELL ROCKWELL ROCKWELL
GOVT. ROCKWELL ROCKWELL ROCKWELL
GOVT. GOVT. GOVT. GOVT. GOVT. GOVT. GOVT,
ROCKWELL ROCKWEL L
GOVT. ROCKWELL
NUMBER
EXCESS EQUIPMENT STOF ENVIRONMENTAL SYSTEI SODIUM LABORATORY SODIUM STORAGE FLAMMABLE MATERIAL ! ENGINEERING DEVELOPh D&D MANUFACTURING SUPPO! TOOL CRIB - ETEC OPERL THERMAL TRANS1 ENT FA SODIUM STORAGE BUILD1 SUPPLEMENTARY STORA( ETEC CONSTRUCTION ST/ ENERGY SYSTEMS GROUF RADIOACTIVE WASTE, DE RADIOACTIVE WASTE ST6 LIQUID METALS CHEMIST DEVELOPMENT TEST BUI 1 ETEC INSTRUMENTATION SMALL COMPONENT TEST ETEC QUALITY ASSURAN( LMFBR FUEL SAFETY SODIUM STORAGE SITE PURCHASING OFFICE ETEC GENERAL TEST RIA WASTE OFFICE BUILD ETEC OPERATIONS ETEC ADMINISTRATION OFFICE BUILDING FACI t.1 TI ES AND INDUSTR STORAGE BUILDING LMFBR TEST RMDF CLEAN SHOP MATERIAL OFFICE ANNE) PDU INSTRUMENTATION E PDV CONTROL ROOM PLUTONIUM FACILITY ETEC LABORATORY LARGE LEAK TEST RIG ETEC INSTRUMENTATION SOURCE AND SPECIAL NU1 ETEC CHEMISTRY LABORL INSTRUMENTATION AEPA STORAGE BUILDING CONTAMINATED EQUIPME CONTROL BUILDING - NEI NEUTRON RADIOGRAPHY ADVANCED FUELS LABOR DECON TRAILER SODIUM BURN FACILITY SODIUM REACTOR EXPERI CONTROL CENTER BOX SHOP X-RAY BUILDING X-RAY BUILDING GAMMAGRAPH BUILDING FIRE BUILDING - D8 LARGE LEAK INJECTOR DC FUEL OIL CONTROL BUlLC TIME CLOCK BUILDING TlME CLOCK BUILDING RESEARCH AND DEVELOPF CONTROL ELEMENT TEST: SCTI SUPPORT BUILDING SODIUM COMPONENT TEST ETEC PUMP BEARING TEST SCTI SUPPORT BUILDING COMPRESSOR BUILDING CHEMICAL STORAGE BUl LC RESEARCH AND DEVELOPL DEVELOPMENT TEST BUlLC TEST LOOP ENCLOSURE CONTROL SHELTER BUILD1
ZONE
9 F 7 E 1 1G 6E 5 0 7 H 7 H 8G 7 F 10F 11G 6D
H -13 H -12 G -12 G -13 H -12 H -12 H -12 G -12 H -12 G -13 G -13 F -11
BUILDING NUMBER DESCRIPTION
ELECTRICAL SUBSTATION TlME CLOCK BUILDING LARGE LEAK INJECTOR DEVICE RECOMBINER CANOPY TlME CLOCK BUILDING TEST STRUCTURE HYDRAULIC TEST LOOP HYDRAULIC TEST LABORATORY ELECTRICAL SUBSTATION PISTON RANGE SODIUM DISPOSAL FACILITY ELECTRICAL SUBSTATION
BOWL AREA
PUMP HOUSE NO. 1 PUMP HOUSE NO. 2 CONTROL CENTER POWER CONTROL V.T.S. - 3 OPERATIONS AND WORKSHOP V.T.S. - 3 WORKSHOP PLUME STUDY BLDG. INSTRUMENT AND WORKSHOP STEAM PLANT BLDG. ELECTRICAL BLDG. PRE-TEST - BOWL SEWAGE TREATMENT PLANT BLDG.
F i g u r e 3 . Plap o f Santa Susana F i e l d L a b o r a t o r i e s S i t e
F a c i l i t i e s (Shee t 2 o f 2 )


es generated as
nuclear reactor
9) commercial opera ti on
tor training and for
gs, and electronic
operation of the RIHL and the fabrication of
r fuel manufacturing
reactor fuel involving
dvanced fuel s . gical hazards at
nment of such mate-
ess of the Group
ed into facility
onmental samples , ioactivity levels
mistry techniques
En itoring, wor tmospherical l y
r g rnpled, as appropriate. This i r t i v ontrols and
ardous material

sampl ing stations ithin the bound2ries of
s "on-site" sta d within a 10-mile
radius of the site ons. The on-site environs
and SSFb sites are sampled termine the concentration
ivity in typical surfac nd water. Soil is also
site semiannually, for plutoniu Similar off-site environ-
mental sampl es, exc pt for plutonium analy ined quarterly. Continu-
ous on-site and off ambient air sampl information concerning
iculate radioactivity. A site ambient radiation monitor-
ing program, utiliz try (TbD), begun in 1971, was
xpanded during 1978.
Nonradioactive wastes re1 e reas are limited to liquids
leased to sanitary sewage systems and to surface water drainage systems. No
intentional re1 eases of ny 1 iquid poll o unrestricted areas.
stes generated at the D arged into the city sewage
This effluent is sampled for d rmination of radioactivity. Sanitary
sewage from a19 DOE and ESG facilities is treated at an on-site
plant. The pl tion pond, located on the
adjoining Rocketdyne Division si r drainage system of the
SSFL is composed of catch ponds ches leading to the Rocket-
dyne retention pond. This pond site sewage plant effluent.
Water from the pond may be r ss water, or it may be
released off site into Los Angel es River. The
pond was a1 so monitored for nonradioactive pollutants
by Rocketdyne Division as requi its issued to Rocketdyne by
the Cal ifornia Regional Water Qu
This report summarizes environmental monitoring r sul ts for 1978. A com- parison of 1978 radioactivity results with pr vious years appears in Appendix A,

TABLE 1-A
SOIL RADIOACTIVITY DATA - 1978
On S i t e
*Maximum v a l u e observed f o r s i n g l e
Gross R a d i o a c t i v i t y (vci / s )
Annual Average Va lue (95% Conf i denc Val ue*
sampl e
SOIL PLUTONIU V l T Y DATA - 1978
i n u s I - ) i n d i c a u9 t s i g n i f i c a n t l y 1e

MMA
A. RADIOACTIVE MATERIALS - 1978
The sampling and analytic methods used in the nvironmental monitoring pro-
gram for radioactive materials are described in Section 111.
which some apparent radioactivity concentrations are below the MDL
averaged value is actually somewhat 1 ess than the value reported.
The maximum level of radioactivity detected for a single samp
because of its significance in indicating the existence of a major
area-wide location of radioactive material deposition, Except for
radioactivity, none of the maximum observed values, which occurred
ing the year, show a great increase over the average values beyond
The average radioactivity concentrations in local soil, vegetation, surface
water, and in ambient air for 1978 are presented in Tables through 5. In cal-
culating the averaged concentration value for the tables, those individual sam-
ples having radioactivity levels 1 ess than their minimum detection levels ( are assumed to have a concentration equal to the MDL. This method of data aver-
aging, required by DOE Manual Chapter 0513, affords a significant level of con- servatism in the data, as evident in the tables, in that most radioactivity con-
centrations are reported as "less than" ( < ) values. Thus, for measurements in
the true
le is reported
epl'sode or
ambient air
randomly dur-
natural vari - ability. The air sample data reflect March and December atmospheric nuclear
device detonations which resulted in marked but transi nt inc-eases in local
airborne radioactivity levels.
The results reported in Tab1 es 1 -A and 2 show no significant df fference be-
tween on-site and off-site samples. Table I-B shows no significant variations in soil plutonium concentrations for the 1978 sample sets. The detected activity is
due to a variety of naturally occurring radionuclides, and to radioactive fallout
resulting from dispersal of nuclear weapons materials and fission products by
atmospheric testing. Natural ly occurring radionucl ides inci ude ~ e ~ , K ~ O , ~b~~~
~rn~~', and the uranium and thorium series (including the inert gas radoo and its
radioactive daughters), Radioactivity from fa1 lout consists primarily of the 239 fission products srgO - ygO, ~s~~~~ and pml lso u~~~ and Pu

Annual Average Val ue
the domestic water supply was
rated during 1978 t o
t e r consumption
i s provided by elevated
r from the system i t two widely separ ted SSFL s i t e
i v i t y concentration i s pr
rged from SSFL f a c i l i t i e s

T A B L E 3
SSFL SITE - DO A T E R RADIOACTIVITY DATA - I
"Maximum value observed f o r s ing le sampl
the i o s Angeles River in the San Fernando Valley, ios Angeles County. Pursuant
t o the requirements of Los Angeles Water Qua1 i t y Control Board Resol u -
of September 2 1 , 1966, mpling s t a t i o n f o r evaluat ing environ-
mental r ad ioac t iv i ty in Bell Canyon was e s t a l i shed in 1966, I t i s located
approximately 2 . 5 miles downstream from the southern Rockw 11 Internat ional
Corporation boundary, Samples, obtain monthly, include stream
d m u d , vegetat ion, and water, Av t y concentrat ions in
Rocketdyne and Be1 1 Creek samples a r e
Comparison of the r a d i o a c t i v i t y concentrat ions in water from the ponds and
.from Be1 l Creek with t h a t of the doniestic wat r supply show no s i g n i f i c a n t
var ia t ion in e i t h e r alpha o r beta
The SSFL s i t e r and the ambient a i r ra i s a c t i v i t y concentra-
t ion Guide values se lec ted fo r a r e the most r e s t r i c t i v e l i m i t s fo r
those radionuclides curr n t l y in use a t ESG f a c i l i t i e s . The i d e n t i t y of a l l
such radionuclides i s known, i r r spect ive of concentrat ion. Accordingly, f o r -?
SSFL s i t e surface water , the Guide value o f 5 x ' uCi/mKu and 3 x 10-/
pCi/meg, f o r ~u~~~ and fo r ~ r " , r spec t ive ly , i The correspond-
Sngly most r e s t r i c t i v e Guide value f o r D Soto s i t e wastewat r rad i oact i vi ty
discharged t o the san i t a ry s wage system, a cont ro l led a r e a , i s 8 x ~Ci lmPa and 1 x l o w 3 pCi/mQf? f o r U n d co6O9 respe
a re es tabl i shed in 10 C F R 20, Calif
D O E Manual Chapt

TABLE 4
BELL CREEK AND ROCKETDYNE SITE RETENTION POND RADIOACTIVITY DATA - 1978
Gross Radioactivity Concentration No,
Sampl e Activity % o f Guide')
ell Creek ud No. 54 (vCi/g)
Pond R-2A
bCi/g)
Vegetation No. 54 ( v W g ash)
el7 Creek Vegetation No, 54 (PWS) dry weight)
SSFL Pond R-2A Water No. 1 (i_lCi/mQ)
"Maximum value observed for single-sample. x i_lCi/mRa, 3 x 10⁻⁷ i_lCi/mQB;
1 Chapter 0524, NA - not appl l'cable, no Guide val ue h a v i

I o r -
I 0 ' r w 5 L
L -r- (d
C, s a,
S F
Q E rb
a, C, -r- m
__I LL v, v,
L 0
Y-
8 ol E \ .,-- U s
Ti- ri
I 0 4
X
CO
It- 0
aJ 3 7
rb > a, w ' r 3
C3
a, LI k-
re- 0
aJ 3 P
(d > aJ -a P
3 CIS
a, c t-
E 3 -P
s 0 C, 3 ,--- Q
u a, w (d P-
3 V) n rd w I= a, c J
c
r a, 0 s .r-
V)
5 C, rb w s 0 'r
w rb C, a, tn a, > L 0
r-- o r
0 v,
L 0 It-
-a a,
C, s a,
0-
Q E (d
% 0
V)
s 0 - r- C, rb L C, s a, 0 s 0 0
aJ IS, rb L a, > (d
a, 1: k-
L
m
CO R cn t-4
L 0 It-
m a, ,--- n E (d V)
7
rb C, s a, s 0 L .r-
> s aJ
s - r w
C, s a, U a, L
L 0 It-
w a, C, L 0 Q a, L
V) F--
a, > a, - L: C, o r
3:
h ,--=
a, V) 0
C, cn (d n
C7-l s .r L 3 w C, J 0 Ts
i-
m re It- 0
C, 0 a, It- % a,
a, 2 C,
s 3 0
IS,
s a, aJ n aJ > 5 I:
73 t (d
e.
-u a, V) r b a, L 0 aJ U
a, > rb LI
* V) a, 0 ' ,-- >
LI I-
a, 7
n -7
s L a, 0 V) -r w C, 0 s a, L rb
0 L--
a, > a, ,-- h w o r -
> ' ,.- C,
0 V) aJ s - r- 5 r^
0 E L a, LI C,
1: C, . r- 3
w aJ E 0
re- L a, Q
V) .,-- IS, s .r L 0
0 - r C, (d V) s a, n E 0 U
3 L a, t a,
It- 0 0 L n
I Cs I: 0, 'r- ,--- 5
s 'r-
U a,
F-
a, rb 0 > s a, a, V) w a, -r L 3 Q CIS
c, It- rd
m
h C, - F-
> . r C, w 5 0
O r -
-5 5 L
u a, >
o r -
C
I IS, s 0 r--
L 0 ce-
a, w L rd a, 7
w 3 s It- 0
0) I;:
C, V) a,
-4.J
U ',.- L a, L: Q V) 0 E +-' (d
- r(l L a, > a, V)
C, V)
(d Q
a, I: C,
IS, r: .P
L I3 w +-' s rb $3 v, s 0 U
U m 0 .r u cb L
a, 7
fl E r b V)
w U r b
%- L 3 V)
IZ 0
V) C, U a, It- It- a,
- - -- - 0 ( U a , r b w w C Q - . i - - u a,
-? a , ~ + - ' Q W a J E s E 0 ) s IS, 3 \ % r b s aJ L rb

A M 5 1 ENT A I R R A D I O A C T I V I T Y D A T A -
S i t e 0 .
Sampl e s
A v e r a g e V a l ue


-;51 E : YOtlQAOIOACTIVE COtISTITUEh'S AND IQ:T!JP ; 5 '<A5-ibL'EF D:SC'l>QGEE *C JhRESTRICTEC A P E I S - l o 7 8
( S n a l y s i s R e s u l t s fop Wastewater D iscba rueo f ror . gond R - 2 C t o Be': C v e L c n Sa te : n d i c a t e d - Sa-$!e S t a t i c n ',:-12:
January i* January !6*
o f Guide - 11.3
2.7
A .7
133.3
200.0
!0 .0
*6 .7
240.0
40.0
,22.:
* 0 0 . 3
69.5'
. 7 .0
'0.37
-
"arch
R e s u l t
' o ta l D i s s o l v e d Sol i d s ( m g / i )
C h l o r i d e (mgl;)
S u l f a t e ( ~ g l ; )
Suspendea So l i d s ' (mslij
Sett1eab:e S o l i d s 5 (mil;:
SOD ( i n g l ~ :
O j l and Grease (lig::;
T u r b i a i t y :TU:
Chromium { q g l , )
F l u o r ~ d e (mg ' , ,
Boron (ng l ; ,
R e s i d ~ a l C h l o r i n e ( r ~ l . )
Fecai Co I iCo rv (MPNIICO r,)
S u r f a c t a n t s Img, , )
2H
T r i t i u K (..Ci.'cc;
Ra 'n fa l l (.n.
Es t ima ted R a i n f a l l Runo f f ( g a l )
Release Volume ( g a l ) 1 March !0* v
! R e s u l t
473
59
93
? 5
3. !
5
1
14
3.039
C.9
9 . 2
6. I
4 A
0.02
.i.i x :oe5
2.87
2 . 1 x 10'
5.5 x 10'
T o t a l Dissolves Sol i d s h l z .
C n l o r l d e !wg/s:
S u l f a t e (mg /L j
Suspenced S o l l d s ' ( n g l l ;
S e t t l e a b l e So:>dsi ( l i ; / , j
Ed3 ( m g l ~ )
O i l and Grease (mg l ; )
T u r b i d i t y ('Uj
Cnromum (mgl; j
F l u o r i d e ( m g l i )
@oron ( m g l i )
Res idua l C h l o r i n e ( m g l i )
Fecal Col i f o m ,MP1/:00 m:;
S u r f a c t a n t s (ma:. j
PP T r i t i u m - ( . C i l c c '
R a i n f a l l ('Q.;
E s t i m a t e d E a ~ n t a l l Runo f f ( g a l j
9e lease ' i o l u l i e i5a; :
C o n s t i t u e r t s
September i*
a? R e s u l t Guide
I 138 ~ 6 . l
34 56 .5
l i 5 1 3 8 3
16 10. 7
1 3
> I 8 . 3
1 ! <6.'
1.003 1 0 0
i . 0 100 .0
!.2 120 0
2 .2 ' 9 . 5
1.12 24.C
x 8'[9.37
I l o7
.i x :g6
R e s u l t 1 GJ::p
T o t a l D;ssolved Sol i d s (mgl . I C h l o ~ i a e (mg/;)
S u l f a t e ( m ~ l i )
Suspended Sol i ds ; (mq, , )
S e t t l e a b l e S o l i d s r ( m i l ' )
BOD (rrg/;)
O i l and Grease jmg/;j
Turb1d: t ) ( T L j
Chroin iun ( m g l i )
F l u o r i d e (mg;;)
Boron ( m g / i )
Residual C h l o r i n e (mgl;)
Fecal C o l i f a r n ( .Phl:OO m;j
S u r f a c t a n t s irrg;;)
pn T * . i r i u r ~ - ( . C i l c c )
R a i n f a l l O n . ,
E s t i m a t e d R a i n f a l l Runo'f (Ca ; ;
Re:ease ' d o l m e ( c a l : NA = No t A v a i l a b l e : a n a i r s i s n o t reques ted o r n o t oes * = R a i n f a l l .e lated d i s c h a r a e . - = i r l : i u ~ ~ n i n i m u n d e : e c t i o n l i m i t ~ ( 1 . 1 . 1 .1 , 1 ~ - 5 ..C.p,. i = ' lot a p p l i c a b l e t o d i scha raes c o n t a i n i r a r a < n f a l l I-hnocf aurlnq o r ;i?..ed;atel:i a":er ae,-.oc3 3' r d l n S a t ;

and geologic conditions at the various dosimeter locations. Since the dat
the on-site and off-site locations are nearly identical, no measurable radiation
dose to the general population or to individuals in uncontrolled areas resulted
from ESG operations.
. NONRADIOACTIVE MATERIALS - 1978
Processed wastewater and most collected surface runoff discharged from th
SSFL site drains to Retention Pond R-2A, operated by Rocketdyne. Water samples
are taken from the pond and analyzed for various constituents, as required by
the Regional Water Qua1 ity Control Board, and for tritium as required by NRC
License - SNM-21, for each discharge to Bell Canyon. The discharges are nor-
mally required only as a result of excessive rainfall run-off. During such
releases, the NPDES concentration limits for turbidity, and suspended and
settleable solids do not apply. The results of analyses for each discharge for
1978, a11 of which were rainfall-related discharges, are presented in Table 7,

Figure 5 . Map o f Canoga Park, Simi Va l ley , Agoura and Calabasas Sampling S t a t i o n s

RAM
A . G E N E R A L DESCRIPTION
Soil and vegetat ion sample co l l ec t ion nd ana lys i s f o r r d i o a c t i v i t y were
Downey, Cal i fornia a r e a , where the Energy Systems
roup was i n i t i a l l y located . Environmental sampling was subsequently extended t o
the proposed SRE s i t e in the Simi H i l l s in May of 1 54. In add i t ion , sampl ing
was begun in the urro F la t s a r e a , southwest of SRE, where o ther nuclear i n s t a l -
l a t i o n s were planned and a r e cu r ren t ly in opera t ion . The Downey area survey was
terminated when the Group r located t o Canoga Park in 1955. The primary purpose
of the environmental monitoring program i s t o survey environmental r ad ioac t iv i ty
adequately t o ensure t h a t ESG operat ions do not con t r ibu te s i g n i f i c a n t l y t o en-
vironmental r a d i o a c t i v i t y . The loca t ions of sampling s t a t i o n s a r e shown in Fig-
ures 5 through 7 and l i s t e d in Table 8.
B, SAMPLING A N D SAMPLE PREPARATION
Sojl 13 - Soil i s analyzed f o r r a d i o a c t i v i t y t o monitor f o r any s i g n j f i c a n t increase
i n radioact ive deposi t ion by f a l l o u t from airborne r a d i o a c t i v i t y . Since so i l i s
na tu ra l ly radioact ive and has been contaminated by atmospheric t e s t i n g of nuclear
weapons, a general background level of r a d i o a c t i v i t y e x i s t s . The data a r e moni-
tored f o r increases beyond the natural v a r i a b i l i t y of t h i s background.
Surface s o i l types va i l ab le f o r sampling range from decomposed g ran i t e t o
c lay and loam. Samples a r e taken from the top l/ - i n . l aye r of undisturbed
ground surface f o r gross r ad ioac t iv i ty an l y s i s and t o a depth of 5 cm f o r plu-
tonium ana lys i s . The s o i l samples a r e packaged in p l a s t i c con ta ine r s , and re-
turned t o the labora tory f o r ana lys i s .
Sample preparat ion f o r gross ra ioac t i vi t y determination cons i s t s of t r ans -
f e r r i n g the s o i l s t o Pyrex beakers, and drying in a muffle furnace a t i~5000C f o r
8 h . After cooling, the so i l i s sieved t o obtain uniform p a r t i c l e s i z e . Two-
gram a l iquo t s of the sieved so i l a r e weighed, and t ransfer red t o copper planchets .
The so i l i s wetted in the p'ianchet with a l coho l , ev nly d i s t r ibu ted t o obtain
uniform sample th ickness , d r i e d , and counted f o r alpha and beta r ad ia t ion .
Plutonium in s o i l analys is i s performed according to the guidelines speci f ied in


SAMPLE STATION LOCATIONS ( S h e e t 1 of 3 )
V - i
V - SV-3
SV-4
V-5
V - SV-10
S V - 12
Sli- 13
Ski- 1
SV- l
V-24
SV-28
SV-31
SV-47
SV-54
S-55
S-5
um C l e a n i n g F a c i l i t y a t SRE Pond
SSFL S i t e , BSdg. 028
SSFL S i t e E n t r a n c , Wool s e y Canyon
S o t o Avenue and P a r t h e n i a S t r e e t
Canoga Avenue and Nordhof f S t r e e t
Simi V a l l e y , Alamo Avenue and Sycamore Road
- Kanan Road a n d V e n t u r a Freeway
s a s - Parkway C a l a b a s a s an V e n t u r a Freeway
C h a t s w o r t h R e s e r v o i r Nor th
r a i n a g e C o n t r o l Pond, G S t r e e t and
p i 11 way, Head of Re1 9 Canyon
n t i o n Pond R-2A (Pond Bottom Mud)
nd 2 4 t h S t r e e t
SV - S o i l and V e g e t a t i o n Sample S t a t i o n - S o i l Sample S t

TABLE 8
SAMPLE STATION LOCATIONS
S t a t i o n
- 5 7
S-58
9
S-60
W - W - 7
W-11
W-42
W-16
A- 1
A- 2
A-3
A-4
A- 5
A-6
A- 7
A-8
A-9
TLD- 1
TLD-2
TLD-3
TbD-4
TLD-5
TLD-6
TLD-7
TLD- 1
L o c a t i o n
SSFL Sf t e , J S t r e e t a t B ldg . 055
SSFL S i t e , B ldg . 353
Rocketdyne S i t e T e s t Area CTL 4
Rocketdyne S i t e R e t e n t i o n Pond R-2A
Rocketdyne S i t e I n t e r i m R e t e n t i o n Pond ( d r a i n s t o Pond R-2A)
SSFL S i t e Domestic Water, B l d g . 003
SSFL S i t e Domestic Water, B l d g . 363
Rocketdyne S i t e Area I 1 F i n a l R e t e n t i o n Pond R-2A
Bel 1 Creek
De Soto S i t e , B ldg. 001 Roof
De Soto S i t e , BSdg. 004 Roof
SSFL S i t e , B l d g . 00
SSFL S i t e , B ldg . 011, West S ide
Rocketdyne S i t e , B l d g . 00, N o r t h S i d e
Rocketdyne S i t e , Sdg. 207, N o r t h S ide
l d g . 074, South S ide
SSFL S i t e , B l d g . 143, West S ide
SSFL SSte, BSdg. 363, West S i d
De Soto S i t e , South o f B l d g ,
De Soto S i t e , West Boundary
o S i t e , Guard Pos t No. 1,
De Soto S i t e , Eas t Fence
De Soto S i t e , N o r t h
De Soto S i t e , Eas
De Soto S i t e , Sou
S - S o i l Sample S t a t i o n W - Water Sample S t a t i o n A - A i r Sampler S t a t i o n TLD - Tkermofuml' t Dosimeter i o c a t i on

T A B L E 8
SAMPLE STATION LOCATIONS (Sheet 3 of 3 )
TLD-3 SSFL S i t e , Electric Substation No. 719
TLD-4 SSFL S i t e , West Boundary on H Street
TLD-5
TLD-6
TLD-3 I Off S i t e , Northridge
SSFL S i t e , Water Tank No. 701
SSFL S i t e , B l d g . 854
TLD-1
TLD-2
TLD - Thermoluminescent Dosimeter Location
Off S i t e , Northridge
Off S i te , Simi Valley

U . S. N R C Regulatory Guide 4 . 5 t i t l e d "Measurements of Radionuclides in the
Environment-Sampling and Analysis of Plutonium in So i l . "
2 . Vegetation
The analysis of vegetation i s performed as an adjunct t o the soil
and i s done to determine the uptake of radioactivity by plants. These
n o t contribute to the human food chain, nor i s there significant agriculture or grazing in the immediate neighborhood of e i ther s i t e .
Vegetation samples obtained in the f ie ld are of the same perennial plant
types, wherever possible; these are usually sunflower or wild tobacco leaves.
Vegetation leaves are stripped from plants, and placed in ice cream cartons for
transfer to the laboratory for analysis. Ordinarily, plant root systems are not
analyzed . Vegetation samples are f i r s t washed with tap water t o remove foreign matter,
and then thoroughly rinsed with d i s t i l l ed water. Washed vegetation i s dried in
tared beakers a t l O O O C for 24 h for dry weight determination, then ashed in a
muffle furnace a t %5000C for 8 h, producing a completely burned ash. One-gram
aliquots of pulverized ash from each beaker are weighed, and transferred t o copper
planchets. The vegetation ash i s wetted in the planchet with alcohol, evenly
tributed t o obtain uniform sample thickness, dried, and counted for alpha and bet
radiation. The dry/ash weight r a t io i s used for the determination of the equi
lent dry weight gross radioactivity concentration value.
3. Water
Surface and domestic supply water samples are obtained monthly a t the SSFL
s i t e and from Bell Creek. The water i s drawn into 1 - l i t e r polyethylene
and transferred t o the laboratory.
Five-hundred-mi 11 i l i t e r vo1 umes of water are evaporated t o dryness in crys-
ta l l iz ing dishes a t ~900C. The residual s a l t s are redissolved into d i s t i l l ed
water, transferred t o copper planchets, dried under heat lamps, and counted for
alpha and beta radiation.


Ambient Air
Air sampling 5s performed continuously the De Soto and SSFL s i t e s with
automatic a i r samplers, operat ing on 24-h sampling cycles . Airborne p a r t i c u l a t e
r a d i o a c t i v i t y i s col lec ted on Type HV-70 f i l t e r media, which a r e automatical ly
changed d a i l y a t the end of each sampling period. The samples a r e counted f o r
alpha and beta radia t ion following a minimum 120-h decay period t o e l iminate
radon p a r t i c u l a t e daughters. The volume of a typica l d a i l y ambient a i r sample 3 i s approximately 25 m .
Figure 8 i s a graph of the da i ly averaged long-lived alpha and beta ambient
a f r r a d i o a c t i v i t y concentrat ions f o r the De Soto and SSFL s i t e s during 1978. The
rage beta concentrat ion f o r each month i s a l s o indicated by horizontal bars.
The graph shows two prominent peaks occurring during the yea r , a moderate spring
increase in concentrat ion and subsequent decreasing l eve l s through the y e a r ' s end.
C. COUNTING A N D CALIBRATION
Environmental s o i l , vegeta t ion , water , and ambient a i r samples a r e counted
f o r alpha and beta r ad ia t ion with a low-background gas flow proportional counting
system, capable of the simul tan ous counting of both alpha and net beta r ad ia t ion .
The sample-detector configurat ion provides a nearly IT g ometry. The thin-window
detec tor i s cont inual ly purged with methane counting gas. A prese t time mode of
operatfon i s used f o r a71 samples. The minimum detec t ion l i m i t s shown i n Table 9
were determined by using typica l values f o r counting t ime, system e f f i c i e n c i e s
f o r de tec t ing alpha and beta r a d i a t i o n , background count r a t e s (approximately
O + 05 cpm a and 1.0 cpm P) and sample s i z For the t a b l e , the minimum s t a t i s -
t i c a l l y s i g n i f i c a n t amount of r a d i o a c t i v i t y , i r r e s p e c t i v e of sample cenf igura t ion ,
i s taken as t h a t amount equal in count r a t e t o three times the standard deviat ion
of the system background count r a t e .
Counting system e f f i c i e n c i e s a r e determined rout ine ly with Ra-D+E+F (with 40 alpha absorbe r ) , ~ l ~ ~ , Th230, U 2 3 5 9 and ~u~~~ standard sources, and with K , in
the form of standard reagent grade KC1, which i s used t o s imulate so i l and vegeta-
t ion samples. Self-absorption s t anda rds a r e made by dividing sieved KC9 i
samples, increasing in mass by 200-mg inc r n t s , from 100 t o 3000 mg,
ples a r e placed in copper planchets , of t h ype used f o r environmental

TABLE 9
MINIMUM RADIOACTIVITY DETECTION LIMITS (MDL)
/ Activity / Minimum Det
"95% Confidence Level
and counted. The ratio of sample activity to the obs rved net count rate for
each sample is plotted as a function of sample weight. The corr
(ratio) corresponding to sample weight may be obtained from the graph. The
product of the correction factor and the net sample count rate yields the sample
activity (dpm). This method has been proved usabl by applying i t to various-
sized aliquots of uniformly mixed ntal samples and obs r v i n g t h a t the
pecific activities fall within the xpected statistical counting
error.
Since the observed radioactivity in nvironmental samples results primarily
from natural and weapons-testing sources, and is at such low concentrations, an
effort is not made to identify individual radionuclides, The detection of sig-
nificant levels of radioactivity would lead to an investigation of the radio-
active material involved, th s and possibl
D, NONRADIOACTIVE MATERIAL
Rockwell International Corpor Division, has fiied
Discharge with the Cal ifor r Qua1 ity Control Board, and

has been granted a National Pollutant Discharge Elimination System permit to
discharge wastewater, pursuant to Section 402 of the Federal Water Pollution
Control Act. The permit, NPDES No. CAOO01309, became effective on September 27,
1976, and supersedes all previously held permits for wastewater discharge from
the Rocketdyne Division SSFL. Discharge of overflow and storm runoff only i
permitted into Be11 Creek from water reclamation retention ponds. Discharge
generally occurs only during and immediately after periods of heavy rainfall or
during extended periods of rocket engine testing.
Only one of the retention ponds receives influent directly from the ESG
SSFL site. It is identified as retention pond R-ZA, Water Sample Station W-12
in Table 8. The influent includes sewage treatment plant effluent and surfac
runoff water. Grab-type water samples, taken at the retention pond prior to a
discharge, are analyzed for non-radioactive chemical constituents by a Cali- forniastatecertified analytical testing laboratory and for tritium. The spe-
cific constituents analyzed for, and their r spective 1 imitations in discharge
wastewater, are presented in Appendix B. Wastewater originating from faciliti
located throughout the SSFL site is composited in the retention pond. Therefo
the point of origin of nonradioactive constituents found in wastewater is im-
possible to determine.


f f l uen t s which may contain radioactive materi
f a c i l i t i e s as the r e s u l t of operations under contr
ec ia l Nuclear Materials License S t a t e of California
c t i ve Material License 0015-59. The spec
as Buildings 001 an 004 a t the De Soto s i t e , a
na s i t e , SSFL.
ATMENT AND HANDLING
e streams released t o unres t r ic ted areas a r e l imited in a l l cases, to
f f l uen t s , No contaminated l iqu i s a re discharg d t o unres t r ic ted
a reas ,
The level of rad ioac t iv i ty contained in a l l atmospherically
e f f luen t s i s reduced t o the lowest pract icable values by passing
t i f i e d , high eff ic iency pa i r ( H E P A ) f i 1 t e r s
f luents a re sample fo r pa r t i cu la te r by means of continuous
stack exhaust samplers a t the point of d i t i on , s tack monitors
ins ta l l ed a t Buil ?arm capabi 7 i t y in the
event of the re lease of gaseous ac t i v i 020 o r pa r t i cu la te ac t iv -
i t y from Building 055, The HEPA f i l t e r s used fo r f i l t e r i n g gaseous e f f luen t s
a re 99.97% e f f i c i e n t f o r pa r t i c l e s of 0.3-pm r t i c l e f i l t r a t i o n
eff ic iency increases above and below
The average concentration i oac t i v i t y i n gaseous e f f l u
leased t o unres t r i c te hown i n Table 10, The ct iveness of the a i r
cleaning systems i s e hat i n most c the gaseous e f f l u -
ent released i s l e s s e than the ambient i r , which i s indicat fv
a r e not rad ioac t iv i ty re1 eases normal f a c i l i t y operations.
Liquid wastes re lease rol led area as
provided f o r by CAC 17 a t the De Soto s i t
Liquid wastes a r e discharg analys is on a
basis only. There i s no c iny 004 I i y u i chemical wastes
a re released t o a proportional samp re ta ins an a l iquo t


each time a fixed volume i s released to the sanitary sewage system. No radio-
active liquid effluents are released from the Santa Susana Buildings 0
022, or 055, except as controlled liquid radioactive waste sol idif ied for Ian
burial. The average concentration and total radioactivity in liquid effluents
discharged i s shown in Table 11,
B . E N E R G Y SYSTEMS GROUP FACILITY DESCRIPTIONS
1. De S o t o S i te
a , Building 001 - NRC and California State Licensed Activit ies
Operations a t Building 001 which may generate radioactive effluents consist
of production operations associated with the manufacture of enriched uranium fu
elements. Only atmospherical ly discharged effluents are re1 eased from the bui 1
ing t o uncontrolled areas. Foll owing analysis for radioactivity concentration,
liquid wastes are released t o the sanitary sewage system, which i s considered a
controlled area, as provided by CAC 11 and 10 C F R 20. Nuclear fuel material
hand1 ed i n unencapsul ated form in thi s faci 1 i ty contains the urani um i sotopes
u~~~~ u ~ ~ ~ , u ~ ~ ~ , and u ~ ~ ~ . No s ignif icant quantit ies of these radionucl ides
were re1 eased.
b . Building 004 - NRC and California State Licensed Activit ies
Operations a t Building 004 which may generate radioactive effluents consis
of research studies in physics and chemistry, and the chemical analysis of s
quantit ies of fuel materials, usually limited to a few grams. Only atmosphe
a l ly discharged effluents are released from the building t o uncontrolled are
Liquid 1 aboratory wastes are re1 eased t o a proportional sampler instal 1 ation
which retains an aliquot of wastewater each time a fixed volume i s released t the f a c i l i t y sanitary sewage system. The aliquots are composited and analyz
for radioactivity. Nuclear fuel material hand1 ed in unencapsulated form in th i s
234 u ~ ~ ~ , u~~ and u ~ ~ ~ * Major quan- f a c i l i t y contains the uranium isotopes U , 147 t i t i e s of other radionuclides in encapsulated form include co60 and Pm -
signif icant quantit ies of these radionucl ides were re1 eased. The monitoring of
De Soto s i t e sewage effluent for tr i t ium commenced during December 1977 an
tinues on the basis of a monthly analysis of a daily composited sample of
f a c i l i t y effluent collected a t the discharge point into the municipal sewe

-is f a c i 1 i t . y i n c l u es t h e f o l l o w i n q r -
as c o n s t i t u e n t s i n
es were re7 ease
r a d i o a c t i v e waste
uranium i s o t o p e s U
f f l u e n t s c o n s i s t
d i o n u c l i d e s were

C. ATEON OF GENE
elease of airborne material a t t h De S o t o s i t e for summer season weather
conditions would generally be under a subsidence inversion into an atmosphere
a1 of s l igh t neutral to lapse con ions. Although nocturnal cool-
allow in extent, During the
the subsidence inversion i s present almost every day, The base
i s inversion for t h most part l i e below the elevation of the SSFL
s i t e , Thus, any atmospheric release u n e r t h i s condition from the SSFL s i t e
s u l t in Pasquill Type B lofting diffusion conditions above the inversion
iderabl e atmospheric ispersion prior t o iffusion ( i f any) through the
n into the Simi or San F rnando Valleys. I n the winter season the
Pacific high pressure cell sh i f t s t o the south and the subsidence inversion for
part i s missing. The surface a i r flow i s dominated by frontal ac t iv i ty
moving through the area or t o the eas t . Frontal passages through the area during
th is season are generally accompani ip i ta t ion . Diffusion characteris-
t i c s are highly variabl rontal location. Generally, a l igh t
t o moderate southwesterly s these frontal passages introducing strong
onshore flow of marine a i r tes a re s l igh t neutral t o lapse. Wind
speeds increase with he approach of the frontal system~~enhancing diffusion.
The diffusion character is t ics of the frontal passage are lapse conditions with
l ight to moderate northerly win s , A summary of surface wind conditions for the
local area i s presented in Tabl
Prevai 1
Preva i 1
Average
Average
rnoon direction
ing early morning direction
aytime spee
nighttime speed
S ummer
W M W
S E
8 mph
3 mph
Winter
N W
ESE
6 mph
3 mph

The population distributions round the De Soto and SSFL s i t e s used
n doses in th is section are based on the 1 0 census data projected
projections were based on an average growth ra te of 5,17%/yr for
th i s area. For population distribution a t distances > miles o u t t o 50 miles, a
single distribution centere 5" north and 118039'00" west i s used.
This location i s between the two ESG s i t e s which are %6 miles apart . This popu-
lation distribution i s also based on t h 70 census data, with the 1980 projec-
tion based on the average growth ra te of 5.17 %lyre
The calculated downwind concentration of radioactive material discharged
during 1978 from each of the four major SG nuclear f a c i l i t i e s i s presented in
Table 13. The Type 5 s t ab i l i t y p rameter coefficients and a mean wind speed of
m/s were use for the cal cul a t i ons.
TABLE 13
DOWNWIND CONCENTRATION OF GASEOUS
- A s s u r e 1 = 2 . 2 n/s average w i n d speed, c o n s t a n t d i r e c t i o n , f u l l year * r , Type C s t a b i l i t y ca tego ry
The general population man-rem dose estima
data and the concentrations calculated for atmospherically dis
data are presented in Table 14 , I t should be noted that these
level surrounding terrain and ignore the e f fec t of the mountai
encircle the s i t e s a t distances of about 10 km. The a i r turbulence and changes
in elevation associated with actual te r ra in would resul t in much lower concen-
t ra t ions than those calculated.
The o f f - s i t e doses are extremely low compared t o the maximum permissible
xposures recommended for the general population. ese values a r
for bone, and 1 .5 rem/year for the l u n g for an indiv ual, and are one-third of

TABLE 14
POPULATION DOSE ESTIMATES FOR ATMOSPHERIC DISCHARGED EFFLU
Sector
N - N N E
N N E - N E
N E - E N E
ENE-E
E-ESE
ESE-SE
SE-SSE
SSE-S
S-SSW
SSW-SW
SW-WSW
WSW-W
W - W N W
W N W - N W
NW-NNW
N N W - N
Dose t o Receptor Population Segment (man-rem)
Total
1. Average rem/man dose = 0.00001 rem f o r t h e 80 km segment average population.
2. Total 80 km man-rem dose es t imate from n a t u r a l l y occurr ing airborn r a d i o a c t i v i t y dose t o the lung of %0.1 remlyear = 1,300,000 man- rem f o r the 80 km segment average population
these values f o r t h e general populat ion. From Table 14, i t may be seen t h a t t h
highest segment dose in t eg ra l i s f o r the 0-8 km segment equivalent t o an averag
doselman-year of 0.48 mrem equivalent t o 0.096% of the maximum permissible expo-
su re f o r an individual and 0.28% of t h e genera1 population recommended av
exposure. Thus, atmospheric discharges from ESG nuclear f a c i 1 i t i e s have r e s u l t
in estimated r ad ia t ion doses which a r e a small f r a c t i o n of t h e recommended
l i m i t s . Doses due t o in t e rna l deposi t ion of natural r a d i o a c t i v i t y in a i r a r e
~ 5 0 t o 100 mrem per year .


This section compares env
year 1978 with previous annual
The data presented in Tab
ironmental moni torin resul ts for the calen
data,
les A-1 through A-5 summarize a l l past annual
average radioactivity concentrations. These data show the effects of b o t h t h
short-lived and long-lived radioactive fa l lout from nuclear weapons t e s t s super-
imposed on the natural radioactivity inherent in the various sample types.
Over the considerable period of time tha t the environmental program has
been in operation, evolutionary changes have been made in order t o provide more
effective data. I n some cases th i s i s readily apparent in the data. For example,
in Table A-1, a small b u t abrupt increase in the alpha ac t iv i ty reported for soil
i s seen t o occur in 1971. This increase i s observed in b o t h the on-site and the
of f -s i te samples and resulted from use of an improved counting system with a
thinner sample configuration. The thinner sample increases the sens i t iv i ty of
the detector t o alpha-emitting radionuclides in the sample, thus producing a
higher measured specific ac t iv i ty .
Similarly, prior t o 1971, gross ac t iv i ty in ambient a i r was measured, in-
cluding b o t h alpha and beta ac t iv i ty . I n 1971, measurements were begun which
allowed separate identification of these two types of ac t iv i ty .
The types of random variations observed in the data indicate that there i s
no local source of unnatural radioactivity in the environment. Also, the sim-
i l a r i t y between on-site and o f f - s i t e resul ts further indicate that the contribu-
tion t o general environmental radioactivity due t o operations a t ESG i s essen-
t i a l l y nonexistent.

Year Number Number
Sarnpl es
TABLE A-3
SSFL SITE DOMESTIC WATER RADIOACTIVITY DATA - 1957 THROUGH 1978
Year
1978
1977
1976
1975
1974
1973
1972
1971
1970
1969
1968
1967
1966
1965
1964
1963
1962
1961
1960
1959
1958
1957
Number Sampl es
Average a (10-9 vCi/rnR)
Average B (los9 vCi/m~)
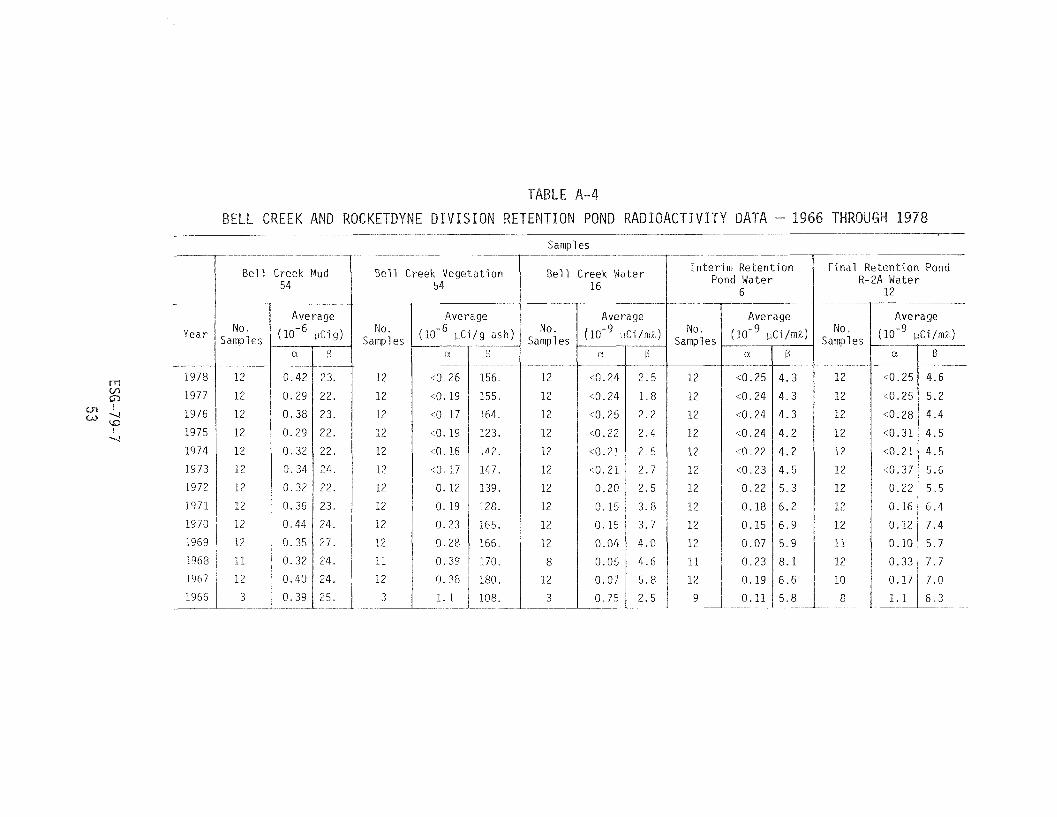
E D I V I S I O N R E T E N T I O N POND R A D I
Samples
Bell Creek Mud 5 4
Bell Creek Vegetation 54
Bell Creek Water Inter im Retention Pond Water
Final Retention Pond R-2A Water
No. Sampl e s
16 ---
Average
p C ~ / r n ~ )
Average
pcig
N -- -
< 0 . 2 4
<0 .24
<0.25
10 .22
1 0 . 2 1
~ 0 . 2 1
0 .20
0 .15
0 .15
0 .04
0 .05
0 .07
0 .75 -- -
Average
ilCi/g ash)
B
2 . 5
1 . 8
2 .2
2 . 4
2 . 5
2 . 7
2 . 5
3 . 8
3 .7
4 . 0
4 . 6
5 . 8
2 .5
No. jamples
No. Samples
No. Samples
--
12
12
12
12
12
12
12
12
12
12
11
12
9
No. Sarnpl e s Year
1978
1977
1976
1975
1974
1973
1972
1971
1970
1969
1968
1967
1966 --

B I E N T AIR RADIOACTIVIT ATION DATA -
DeSoto S i t e Average (10- 12 vCi /mk)
SSFL S i t e Average5 ( u C i / m ~ )
"Ambient a i r alpha r ad ioac t i v i not reported sepa ra t e ly p r i o r
-kInsuff ic ien t d a t a 5 lncl udes Rocketdyne SS t e Ai r

charge of an effl uen following limits given in
TABLE 5-1
0. CA00-01309, EFF CTIVE SEPTEMBE
Constituent
o t a l D i ssol ved Sol ids
Fl uorid
Boron ual Chlorine
Fecal Col iform (MPN/100 mR)
Surfactants (as MBAS)
Average
oncentration Limit (mglR)
Average aximum
applicable to discharges containing rainf uring or immediately after periods of rainfall.


DOE Manual Chapter 0513
DOE Manual Chapter 0524, Appendix
Code of Federal Regulations, T i t l e 10, Pa r t 20
Cal i forn ia Radiation Control Regulations, Cal i forn ia Administrat ive Co T i t l e 17, Pub1 i c Health
Cal i f o r n i a Regional Water Qua1 i t y Control Board, Los Angel es Region, Order No. 74-379, NPDES No, CA0001309, Ef fec t ive September 27, 197
Meteorology and Atomic Energy - 1968, TID 24190
Report of Committee I1 on Permissible Dose f o r In terna l Radiation (19 ICRP Publicat ion 2
Deposition and Retention Models f o r In terna l Dosimetry of t h e Human Respiratory Trac t , ICRP Committee 11 Task Group on Lung Dynamics
Document TI #N001TI000-046 t i t l ed " s t ima t i ng General Population Radiation Dose At t r ibu tab le t o Atmospheric Discharge of Radioact iv i ty from ESG Nuclear F a c i l i t i e s ," J . D . Moore
Radiologic Health Sect ion , S t a t e Department of Public Health, Cal i forn i
Radiological Health Division, Los Angel es County Health Department Cal i f o r n i a
Environmental Health Department, Ventura County, Cal i forn ia
U.S, Department of Energy, San Francisco Operations Off ice
U.S. Nuclear Regulatory Commission, Division of Reactor Licensing
Gordon Facer, Division of Mi l i t a r y Appl i c a t i o n s , DOE
Andrew J . Pressesky, Reactor Research and Development, DOE
i l l e r , Division of Biomedical and Environmental Research, DO
DOE-Headquarters Library, At tent ion: Charles Sherman