Sorption of nalidixic acid onto micrometric and nanometric magnetites
29
HAL Id: hal-00953734 https://hal.archives-ouvertes.fr/hal-00953734 Submitted on 28 Feb 2014 HAL is a multi-disciplinary open access archive for the deposit and dissemination of sci- entific research documents, whether they are pub- lished or not. The documents may come from teaching and research institutions in France or abroad, or from public or private research centers. L’archive ouverte pluridisciplinaire HAL, est destinée au dépôt et à la diffusion de documents scientifiques de niveau recherche, publiés ou non, émanant des établissements d’enseignement et de recherche français ou étrangers, des laboratoires publics ou privés. Sorption of nalidixic acid onto micrometric and nanometric magnetites: experimental study and modeling Muhammad Usman, Sébastien Martin, Nicolas Cimetiere, Sylvain Giraudet, Vincent Chatain, Khalil Hanna To cite this version: Muhammad Usman, Sébastien Martin, Nicolas Cimetiere, Sylvain Giraudet, Vincent Chatain, et al.. Sorption of nalidixic acid onto micrometric and nanometric magnetites: experimental study and modeling. Applied Surface Science, Elsevier, 2014, 299, pp.136-145. <10.1016/j.apsusc.2014.01.197>. <hal-00953734>
Transcript of Sorption of nalidixic acid onto micrometric and nanometric magnetites
HAL Id: hal-00953734https://hal.archives-ouvertes.fr/hal-00953734
Submitted on 28 Feb 2014
HAL is a multi-disciplinary open accessarchive for the deposit and dissemination of sci-entific research documents, whether they are pub-lished or not. The documents may come fromteaching and research institutions in France orabroad, or from public or private research centers.
L’archive ouverte pluridisciplinaire HAL, estdestinée au dépôt et à la diffusion de documentsscientifiques de niveau recherche, publiés ou non,émanant des établissements d’enseignement et derecherche français ou étrangers, des laboratoirespublics ou privés.
Sorption of nalidixic acid onto micrometric andnanometric magnetites: experimental study and
modelingMuhammad Usman, Sébastien Martin, Nicolas Cimetiere, Sylvain Giraudet,
Vincent Chatain, Khalil Hanna
To cite this version:Muhammad Usman, Sébastien Martin, Nicolas Cimetiere, Sylvain Giraudet, Vincent Chatain, etal.. Sorption of nalidixic acid onto micrometric and nanometric magnetites: experimental study andmodeling. Applied Surface Science, Elsevier, 2014, 299, pp.136-145. <10.1016/j.apsusc.2014.01.197>.<hal-00953734>
1
Sorption of nalidixic acid onto micrometric and nanometric magnetites: experimental
study and modeling
M. Usman a,b,c*, S. Martin b,c, N. Cimetière b,c, S. Giraudet b,c, V. Chataind , K. Hanna b,c
a Institute of Soil and Environmental Sciences, University of Agriculture, Faisalabad, 38040,
Pakistan.
b Ecole Nationale Supérieure de Chimie de Rennes, CNRS, UMR 6226, 11 Allée de Beaulieu, CS 50837, 35708 Rennes Cedex 7, France.
c Université Européenne de Bretagne, France.
d Université de Lyon, INSA-Lyon, Laboratoire de Génie Civil et d'Ingénierie Environnementale LGCIE, 20 avenue Albert Einstein, 69621 Villeurbanne, France.
* Corresponding author:
Institute of Soil and Environmental Sciences, University of Agriculture, Faisalabad-38040,
Pakistan
Tel: +92419201220
Fax: +92419200764
Email: [email protected]
Alternative Email: [email protected]
2
Abstract
The sorption of nalidixic acid (NA) was studied onto three kinds of magnetite characterized
by different particle sizes (from micrometric to nanometric) and surface properties.
Experiments were performed under static batch and dynamic flow conditions. Obtained
results indicate that kinetics and extent of sorption was strongly affected by the particle size of
tested magnetites. Ionic strength effect was less significant suggesting that aggregation state
of the magnetite particles did not affect the sorption. During kinetic sorption experiments,
apparent rate constant normalized to solid mass was faster for nanosized magnetite while an
opposite trend was observed for the surface area-normalized rate constants. Infrared data
suggested the possibility of similar surface interactions on both microsized and nanosized
magnetites. Transport of NA in magnetite-packed column was found associated to the
instantaneous sorption without any significant effect of kinetic limitation. Breakthrough
curves (BC) and sorption extent in columns were calculated by using Thomas, Yan and Yoon-
Nelson models. Sorption capacities predicted by Thomas or Yan model were in good
agreement with that determined by integrating total area above BC. However, Thomas model
failed particularly to predict an accurate concentration at lower and higher time points of the
BC. These findings have strong implications in relation to the transport and removal of
environmental pollutants in natural and engineered systems.
Keywords: magnetite; nalidixic acid; sorption; transport; column; modeling.

3
1. Introduction
In environment, iron minerals are commonly found as ferric oxides including goethite,
ferrihydrite, hematite and lepidocrocite [1] . Another form of iron minerals is the mixed FeII-
FeIII oxides including magnetite (Fe3O4) and green rust. Magnetite (FeII FeIII2 O4) is very
efficient in environmental remediation owing to its stability and presence of structural FeII [2-
5]. Magnetite is a ubiquitous iron oxide in soils and sediments. Existence of magnetite was
reported in weathered clays, soils and in recent deposits of marine and freshwater sediments
[6, 7]. Recently, magnetite was identified as the main constituent of iron corrosion scale in
drinking water distribution systems [8]. Top layers of corrosion scale were dominated by
magnetite [8, 9].
Magnetite can also be formed in laboratory by various abiotic and biotic procedures.
Formation of biogenic magnetite was reported as a result of microbial reduction of ferric
oxyhydroxides [10]. Abiotic procedures to form magnetite include co-precipitation of FeII and
FeIII salts in aqueous solutions or partial oxidation of hydroxylated FeII solution [11].
Magnetite can also be formed by reacting aqueous FeII with ferric oxides inducing their
structural modifications and bulk phase transformations [12, 13]. The morphology,
crystallography and specific surface area of natural or synthetic magnetite can vary widely.
Magnetite exists as micrometric and nanometric particles in many natural and engineered
environments. Because of the larger specific surface area of nanosized particles, their surface
reactivity is exalted and they play preeminent role in sorption of environmental pollutants.
Many studies have been carried out to evaluate the magnetite adsorption capacity for different
pollutants including heavy metals, oxyanions and radionuclides [14-18]. However, less
information is available about the mechanism and extent of sorption of emerging organic
contaminants especially pharmaceutical compounds. Therefore, it is important to consider the
potential mobilization risks of water pollution associated with these contaminants, and to
investigate their interaction with magnetite.
Although large variability of magnetite is found in natural as well as engineered systems,
sorption onto different magnetites has never been reported.. The impact of particle size and
morphology on magnetite sorption capability merits, therefore, to be investigated form both
environmental and engineering aspects. Moreover, the interactions of environmental
pollutants with magnetite were mainly investigated under batch conditions [16-18]; however
transport of such contaminants in magnetite-packed column has scarcely been investigated
under flow-through conditions. Contrary to batch tests, column experiments allow monitoring

4
the effect of non-equilibrium sorption onto the transport of pollutants. Effect of hydrodynamic
parameters (e.g. dispersion) on the solute breakthrough can also be evaluated in continuous
flow through conditions. Estimation of field parameters could be more accurate in column
tests which provide a suitable soil-aqueous phase ratio. Moreover, sorbate species can be
flushed out of system in continuous flow conditions, ultimately affecting the kinetics and
extent of reaction.
Present study was conducted to investigate sorption of NA (used as a model pharmaceutical
pollutant), onto three kinds of magnetite. Sorption was evaluated vs. time, pH and ionic
strength in batch experiments. Sorption isotherms were also recorded over a wide range of
NA concentration. Fourier transform infrared in transmission mode (FTIR) was also used to
recognize the main surface complexes structures. Flow through experiments were also
conducted at two influent concentrations (50 and 200 µM of NA) and at a relatively lower
flow rate (i.e. 0.2 mL/min). Three different models (Thomas, Yan and Yoon-Nelson) were
used to estimate the amount of NA sorbed in the column. Application of these semi-empirical
models to determine the sorbed quantity of emerging organic pollutants in iron-mineral coated
sand columns remains sparse.
2. Experimental Procedures
2.1. Chemical Reagents
Nalidixic acid (NA), sodium phosphate (Na3PO4. 12H2O), ferrous chloride tetrahydrate
(FeCl2. 4H2O), ferrous sulfate heptahydrate (FeSO4·7H2O) and ferric chloride hexahydrate
(FeCl3. 6H2O) were provided by Sigma Aldrich. Fontainebleau sand (France) was purchased
from Prolabo (grain size range = 100-250 µm).
2.2. Formation and characterization of magnetite (M) and magnetite coated sand (MCS)
Experiments were conducted with three different kinds of magnetite (FeII FeIII2 O4). Among
them, two (M1 and M2) were prepared in lab, while third one (M3) was purchased from
Prolabo. M1 and M2 were formed by mineralogical transformations of 2-line ferrihydrite and
lepidocrocite (γ-FeOOH), respectively as previously reported [12]. Prior to reactivity tests, all
magnetites were analyzed by X-ray powder diffraction (XRD), Transmission electron
microscopy (TEM) and Fourier transform infrared spectrometer (FTIR) as described
previously [2].

5
Magnetite coated sand (MCS) was prepared as described by Scheiddeger et al. [19] and as
explained previously [20, 21] by using 1 g of each magnetite per 100 g of sand (1% w/w).
Mineral characterization of sand was found to be exclusively quartz by XRD.
2.3. Sorption experiments
2.3.1. Batch tests
Kinetic sorption was evaluated at 200 µM of NA concentration, at a fixed pH (6.5) and ionic
strength (NaCl 10-2 M) and at 20 °C in the absence of light. The sorption isotherms were
recorded at pH of 6.5 and wide range of NA concentration (2-200 µM). The sorption edge
experiments were performed at a fixed NA concentration (50 µM) and ionic strength (NaCl
10-2 M). Suspensions were centrifuged, filtered and the filtrate samples were subjected to
analyses by UV–visible spectroscopy and depletion method was used to calculate the sorbed
concentrations. Negligible quantity of dissolved Fe was detected by colorimetric method. The
sorption tests are detailed previously [22, 23].
To investigate the effects of ionic strength and that of phosphate, batch sorption experiments
were carried out at various molar concentrations (10-4 – 10-1 M) of NaCl, and of phosphate
(10-5–10-2 M). In order to determine the mass balance, solid phase extraction was conducted
using acetonitrile as an organic solvent.
The sorption tests were performed in triplicate and their standard deviation was found to be
less than 5%.
2.3.2. Column experiments
Dry MCS (50 g) was packed into glass columns having internal diameter of 2.6 cm providing
bed length of 6.3 cm and bulk density of 1.49 g/cm3. Each column contained 0.5 g of the
reactive material, i.e. magnetite.
The column was then saturated with a 10-2 mol L-1 NaCl solution at a fixed flow rate (0.2
mL/min; q =0.037 cm/min). The hydrodynamic parameters were determined by a bromide
tracer experiment (using a 10-2 mol L-1 KBr solution) and using classical Convection
Dispersion Equation (CDE) as explained previously [22, 24, 25]:
x
Cv
x
CD
t
C
2
2
(1)
where c is the water solute concentration (M/L3), t denotes time (T), x is the spatial coordinate
(L), D represents the dispersion coefficient (L2/T), q is the flow velocity (L.T-1), θ is the

6
volumetric water content (L3/L3), and v is the darcian velocity = q/θ (L.T-1). The breakthrough
curve of bromide exhibited a slight asymmetrical shape with little tailing (data is not
presented). The bromide concentration was analyzed using CDE to estimate the values of
and D which represents flow homogeneity, as explained previously [23, 25, 26]. NA solution
(200 µM, pH = 6) was then injected in a continuous mode into the column at the same
constant flow rate (0.2 mL min-1), under O2-free controlled atmosphere.

7
3. Results and discussion
3.1. Characterization of tested magnetites
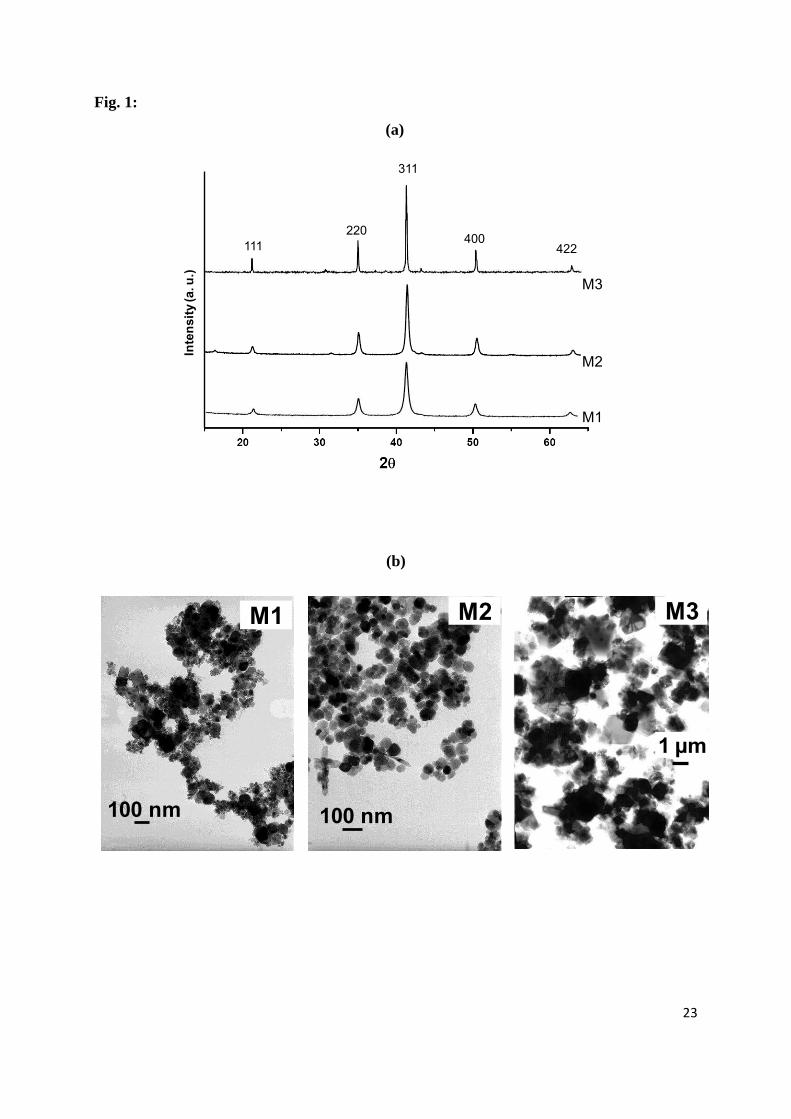
Three kinds of magnetite were analyzed by XRD and their diffractograms are shown in Figure
1a. Five different peaks are represented in XRD diffractograms at 2 = 21.2 , 35 , 41.2°,
50.4° and 62.8° which could be assigned to magnetite in all diffractograms. These main peaks
have d-space values of 2.53, 2.96, 2.09, 4.85 and 1.71 Å which may correspond to the more
intense lines 311, 220, 400, 111 and 422, respectively of magnetite.
Morphology of three kinds of magnetite is shown by TEM images (Fig. 1b). M1 is
characterized by smaller particles with non-uniform size or shape. But, shape of M2 particles
is between hexagonal to octahedral while M3 exhibits non-uniform size and shape. Particle
size of tested magnetites was in following order; M1 < M2 < M3 while a reverse order was
found for BET surface area (M1 > M2 > M3) (Table 1). If particles are considered to be
spherical, the radius of these particles (ρ = 5.15 x10⁶ g m-3) could be correlated to the surface
area as SSAGeo = 6/(ρd). A good agreement between SSA determined by BET and SSAGeo
was observed except for M1. The disagreement observed for M1 might be caused by the
existence of particles with wide range of particle size, and/or some impurities like ferrihydrite
remaining during synthesis. Point of zero charge (PZC) determined by potentiometric titration
was similar to that described in literature (Table 1) [5].
Sun and co-workers [27] proposed an approximation to determine the theoretical maximum
surface proton binding site concentration (Ps) (mol L-1) using the following expression:
3/2.
...
vN
NZASP
A
Ss (2)
Where S represents the concentration of solid (0.5 g/L), A is the specific surface area, Z
represents the number of formula units/unit cell (8 for magnetite), Ns denotes average number
of protons per unit surface (it is assumed that proton is bounded at three hydrated surface iron
sites), NA is Avogadro’s number, and ν is cell volume of magnetite (5.91x10⁻²⁸ cm3). These
estimated values (Table 1) were, however, considerably higher than those of the concentration
of surface proton binding sites obtained by potentiometric titrations. These observations are
similar to those of Sun and co-workers [27], which suggest that only a small part of iron-
surface site seems to be involved in proton binding.

8
3.2. Batch sorption results
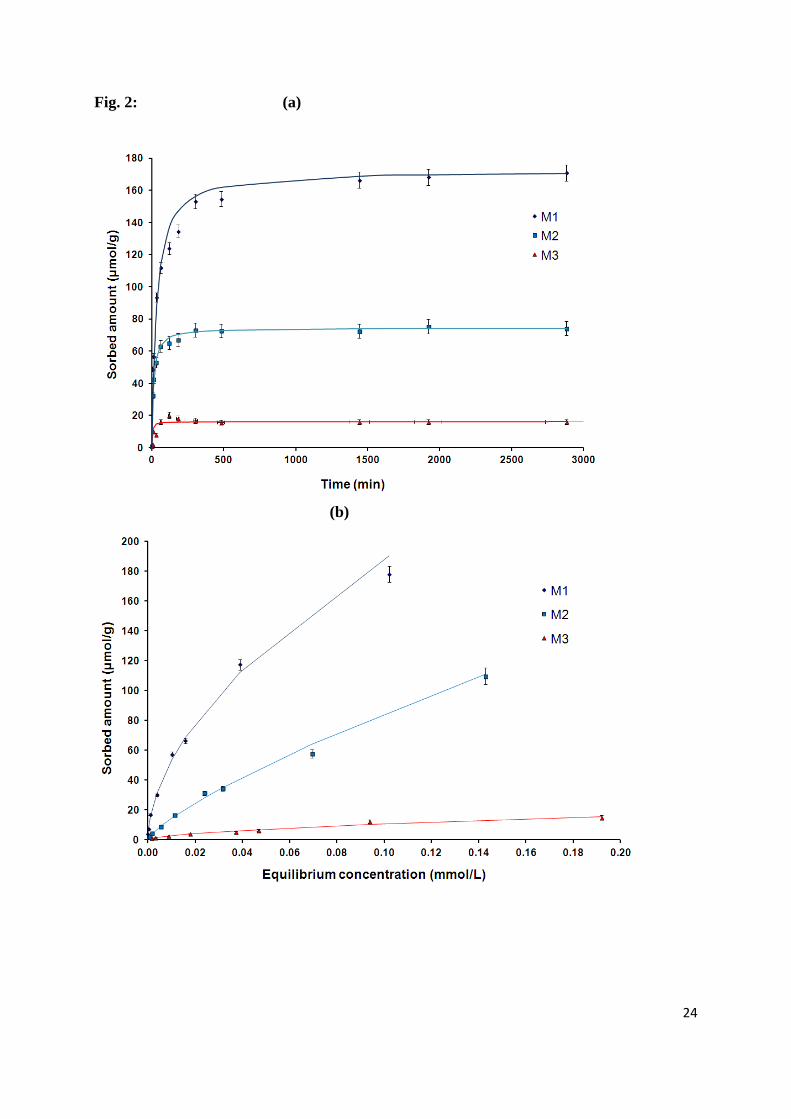
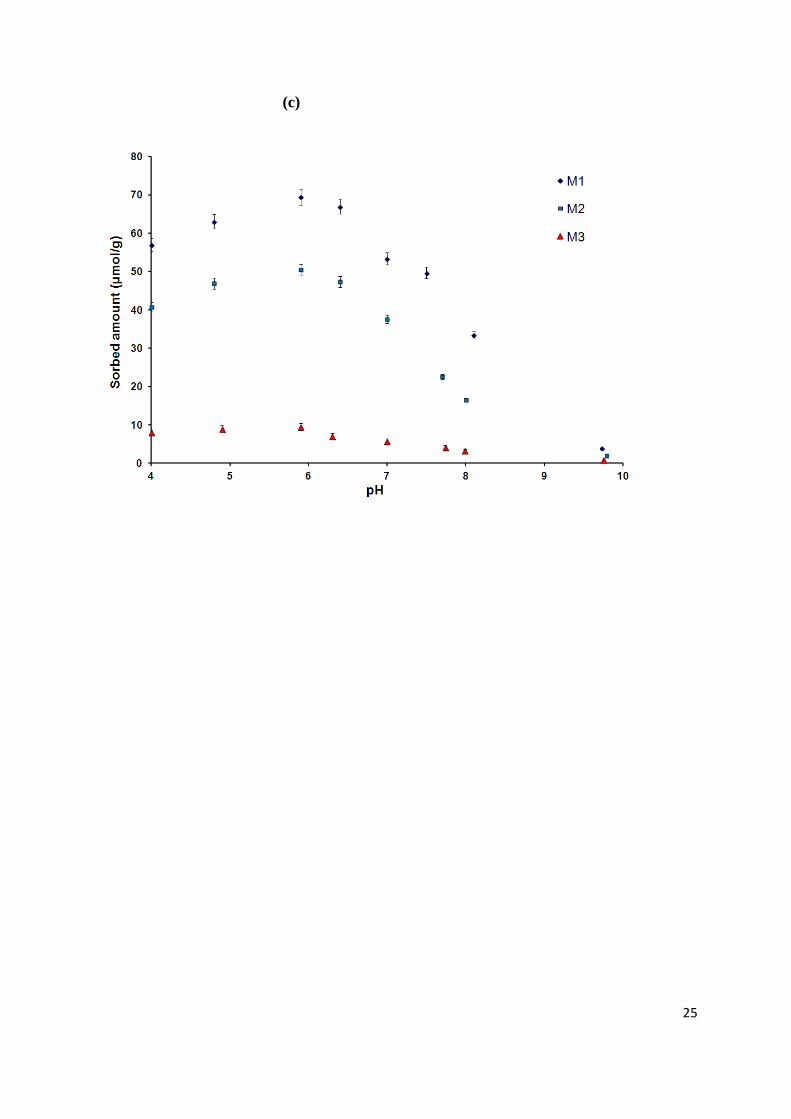
Kinetic results: The sorption kinetics of NA showed that solute uptake reached equilibrium
values at about 500 min for all solids (Fig. 2a). Various models namely pseudo-first-order,
pseudo-second-order and intraparticle diffusion models were employed in order to evaluate
the kinetic sorption mechanism. First-order and intraparticle diffusion models result in poor
regression (r2) of coefficient (data not shown). However, the pseudo-second-order rate
expression appears to provide the best fitting kinetic model for the experimental data. The
equation of pseudo-second-order can be expressed as:
dt
dq = 2
2 )( te qqk (3)
where k2 (g µmol-1 min-1) is the pseudo-second-order rate constant, qe is the amount of NA
adsorbed at equilibrium (µmol g-1) and qt is the amount of the adsorption (µmol g-1) at any
time t. Integration and rearrangement of Equation (4) gives:
tq
t= t
qqk ee
112
2
(4)
Pseudo-second-order rate constants (k2 and qe) were calculated from the slope and intercept of
the plots of t/qt vs. t. The value of the constant k2 determined by regression analysis are
reported in Table 2. Kinetics of NA sorption followed the pseudo-second-order model, which
suggests that chemisorption could be the adsorption rate-limiting step and NA adsorption
occurs probably via surface complexation reactions at specific sorption sites.
It is generally known, the longer the compound is adsorbed on the surface, the stronger is its
binding [28]. Thus, in present batch tests, M1 showed highest sorption extent and lowest
sorption rate constant normalized per mass unit. However, this trend is modified and the
constant rates values are closer to each other, when normalized to surface area.
Mass transfer rates were estimated to evaluate the potential role of diffusion, either stationary
layer diffusion from the solution to the surface, or inter-particle pore diffusion to reach the
sorption sites within the magnetite aggregates. The rate of diffusion α can be written as:
2L
D (5)
where D is the diffusion coefficient (cm2/s), and L is the thickness of the stagnant liquid film
(cm).
Diffusion coefficient of solutes is usually ~10-9 m2/s in liquids and thickness of stagnant layer
of the liquid film can be estimated by film theory as ~10-6 m [29]. Therefore, mass transfer

9
rate of solute through the liquid film by diffusion (external mass transfer resistance) and the
rate of diffusion are estimated to 10-3 m/s and to 103 s-1 respectively. Length of diffusion in
nano-particle aggregates must be considered to assess the pore diffusion rate (resistance of
internal mass transfer). Average size of aggregate could be roughly estimated by considering
it as the average pore length for the particles of tested magnetite, and it lies at ~10-6 m. The
effective diffusivity of solutes in the pores is generally ~10-10 m2/s [30]. Therefore, the
internal mass transfer and the internal diffusion rate are estimated at 10-4 m/s and 102 s-1,
respectively.
Rate of NA sorption onto magnetite was assessed from the kinetic data and maximum sorbed
amount (k2.qe (s-1)) varied between 5.1 10-4 (M1), 1.5 10-3 s-1 (M2) and 6.0 10-3 s-1 (M3). Thus,
the diffusion rate to the surface via external film or through the internal pores is much rapid
than the NA sorption rate onto the magnetite surface. Thus, the intrinsic chemical reactions on
the surface of iron oxide are likely to be the rate-limiting step.
Interparticle diffusion in NA sorption was determined experimentally by ultrasonic mixing
which was employed to disperse loosely formed aggregates in the aqueous phase. In this case,
the sorption rate should be faster if the interparticle diffusion is the rate-controlling step [22,
25, 31]. Sorption data with ultrasonication is in agreement with that of magnetic stirring
which suggests that interparticle diffusion is not the rate-limiting step. Mass balance on solid-
and aqueous-phase NA was determined in every case which suggests that NA was removed
only by sorption and not by molecular transformation or other phenomena.
Effect of initial concentration and solution chemistry on NA sorption: Sorption isotherms
were determined and fitted to the Langmuir, Freundlich and Tempkin equations by applying
linear regression analysis. As observed by the statistic analysis, best fitting of curves was
found with Freundlich isotherm at the tested range of concentration of the solute (Fig. 2b).
Following form of the Freundlich equation was employed:
(6)
Where qe (µmol g-1) is the sorbed concentration, Ce (µmol L-1) is the equilibrium
concentration at the end of the experiment, while KF and n are the Freundlich constants.
Heterogeneity factor (n) can characterize this expression and thus, the heterogeneous systems
can be described by Freundlich isotherm. Determination of Freundlich constants is enabled by
plotting logCs versus logCe (Table 2). The Freundlich exponents are much smaller than unity
for all solids. On the basis of sorption coefficients, the order of NA affinity was M1 > M2 >
neFe CKq /1
10
M3 (Table 2). Solid phase extraction showed a good mass balance, indicating the sole process
was NA sorption without any molecular transformation on the surface of magnetite.
The observed sorption behaviour vs. pH can be linked to a blend of pH-dependent NA
speciation and the surface charge properties of the iron oxides (Fig. 2c). The adsorption
envelope of monoprotic organic acids attached to iron oxide by inner sphere surface
complexation usually represented highest adsorption at a pH near the pKa (pKa of NA = 5.95)
[21, 26, 32]. An increase in NA sorption onto hydrous oxides was found firstly with an
increase in pH, where NA is protonated and particles of Fe-oxide contained positive charge.
Charge repulsion was expected at pH above 7 where both sorbent and sorbate were negatively
charged.
The effect of sodium chloride (NaCl) addition at various ionic strengths (ranging from 0.001
to 1 M) was tested at 20 °C and pH 6.5 (data not shown). Increasing the concentration of
monovalent cation caused a slight decrease in sorption (less than 5% for M1 and about 8% for
M2 and M3) which suggested a stronger sorption mechanism of NA onto the surface of iron
oxides than non-specific electrostatic interactions. Moreover, according to coagulation theory,
cations should enhance particle aggregation which increases with an increase in ionic strength
or NaCl concentration. As the ionic strength effect is less significant, the particle aggregation
state must be of less importance. However, sorption of NA was highly decreased with an
increase in phosphate concentration and completely inhibited at 1 mM (data not shown).
Indeed, the presence of a strong binding ligand such as phosphate hinders the surface sites of
the sorbent and thus no NA sorption will occur.
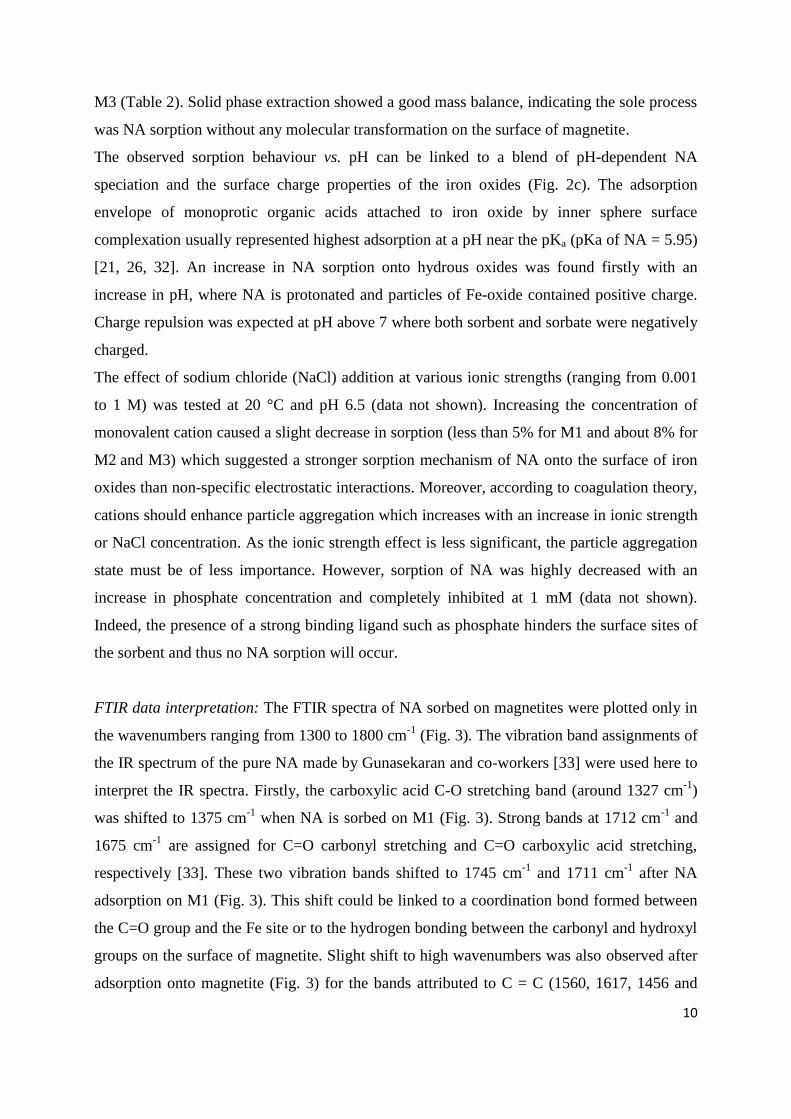
FTIR data interpretation: The FTIR spectra of NA sorbed on magnetites were plotted only in
the wavenumbers ranging from 1300 to 1800 cm-1 (Fig. 3). The vibration band assignments of
the IR spectrum of the pure NA made by Gunasekaran and co-workers [33] were used here to
interpret the IR spectra. Firstly, the carboxylic acid C-O stretching band (around 1327 cm-1)
was shifted to 1375 cm-1 when NA is sorbed on M1 (Fig. 3). Strong bands at 1712 cm-1 and
1675 cm-1 are assigned for C=O carbonyl stretching and C=O carboxylic acid stretching,
respectively [33]. These two vibration bands shifted to 1745 cm-1 and 1711 cm-1 after NA
adsorption on M1 (Fig. 3). This shift could be linked to a coordination bond formed between
the C=O group and the Fe site or to the hydrogen bonding between the carbonyl and hydroxyl
groups on the surface of magnetite. Slight shift to high wavenumbers was also observed after
adsorption onto magnetite (Fig. 3) for the bands attributed to C = C (1560, 1617, 1456 and

11
1544 cm-1) and C = N (1385, 1473, 1409 and 1519 cm-1) stretching vibrations [33]. All these
observations confirm the presence of strong chemical interactions involved in the adsorption
of NA on magnetite. Wu and co-workers [34] have analyzed the NA sorption onto clays by
FTIR and reported that NA adsorption took place via a coordination bond formed between the
keto oxygen and/or the C-N group in the pyridine ring and the montmorillonite surface, while
electrostatic and hydrophobic interactions are rather dominant during sorption of NA onto
kaolinite.
The spectrum of NA sorbed on M2 in the 1300-1800 cm-1 was close to that of the M1 except
that the absorption bands are less intense, suggesting the occurrence of similar interactions on
both nanosized magnetites. However, the spectrum of NA sorbed on the microsized magnetite
(M3) exhibits broader and lesser intense bands with a slight shift for the main bands. Lower
sorption on M3 makes it difficult to describe accurately the NA surface speciation.
3.3. Column study
Breakthrough curves and sorption capacity in column. Firstly, column breakthrough curves
(BTC) of bromide were established for all column tests and found nearly identical. High
recovery rate of injected bromide (97%) indicates mass conservation and an inert nature of the
interactions between iron oxides and bromide. Flow is considered homogeneous as the mobile
fraction is around 90%. Macroscopic dispersivity of the medium was calculated by using the
ratio between the dispersion coefficient (Dm) and the pore velocity. Molecular diffusion was
considered negligible with respect to the dynamic dispersion. Indeed, effective molecular
diffusion coefficient is around 10−6 cm2∕s which generally decreased with an increase in
aqueous solubility. The calculated Dm lies at 0.002 cm2/min, while the dispersivity was
around 200 µm, close to the grain size particle. The Péclet number (Pe = vL/D) was higher
than 300 in the column, indicating the predominance of a convective regime in all column
tests.
The BTC of NA from the three packed columns at a flow rate of 0.2 ml.min-1 are presented in
Figure 4. The breakthrough point, curve steepness and the complete breakthrough strongly
depend on the type of magnetite employed. For instance, the breakthrough point for NA in
M1 column starts at ~35 PV and is completed at ~60 PV, while for M2 the complete
breakthrough occurred at around 30 PV (Fig. 4a; C0= 50 µM). The pH of inflow solution of
NA was around 6.0. But an increase in pH of outflow solution H was observed from about 5.0
to about 5.5 and slowly followed NA breakthrough throughout experiment (not shown).
12
Maximum coincidence of the pH was observed with the breakthrough slope of NA. Influent
value of 6 ± 0.1 was only regained when steady state was attained by solute sorption and
complete breakthrough (data not shown).
The adsorption front in the BTC of M1 is diffuse, thereby underscoring the effect of kinetic,
nonlinear sorption and/or physical dispersion. Shape of the isotherm might be reflected by this
diffuse adsorption front when chemical equilibrium was achieved on the time scale of the
column tests. For instance, a concave isotherm involves diffuse adsorption front in the sand
packed column [35]. Present study provides a proper description of the sorption isotherms
with the Freundlich model (Table 2, where the Freundlich exponents are much smaller than
unity).
Sorbed amount in column was determined by calculating the total area above the
breakthrough curve, which represents the amount of solute sorbed by the solid mass from the
break point to complete breakthrough. The sorbed amounts determined at complete
breakthrough for all the columns are reported in Table 3. The BTC were determined at a
lower flow rate to ensure a high residence time and to reach local equilibrium in the column.
Comparison between the sorbed amounts for both methods represents a discrepancy between
batch and column data. This may come in part from the leaching of Fe reactive species from
the column or the loss of sorbent particles. To determine if the reactive phases were flushed
out of the column, Fe content was analyzed in the effluent of columns blank test injected with
background electrolyte (without NA). In case of M3 (microsized magnetite), total Fe was
found very low corresponding to less than 2 mg of magnetite in the effluent (< 1%). For M1
or M2, the total amounts of mobilized Fe would correspond to about 10 % of magnetite
present in the column. Nanoparticles can be flushed out of the column, thus reduce slightly
the sorption capacity of the column system. However, further measurements showed that
injection of NA can enhance particle mobilization, as more Fe was observed in the effluent of
columns fed with NA solution. Therefore, mobilization of magnetite particles upon both water
saturation and NA solution injection involved a slight fall in sorption observed in the flow
system.
To confirm this behavior, BTCs for three M columns were evaluated according to the
previous tests but by using fluoride as a reactive tracer. Fluoride was chosen as a model
compound because of large amount of literature describing the interactions of fluoride with
iron oxides [36]. The breakthrough finds represented a slight disparity between batch and

13
column data. This observation pointed out the direct relation of such behavior with the loss of
nanoparticles from the column, and not to the specific interactions of NA with oxide.
The retardation factor is important to characterize the transport of a solute in the convection-
dispersion model. The retardation factor is concentration-independent in case of linear
sorption. For nonlinear sorption, the retardation factor is concentration-dependent. Batch
experiments can be used to determine retardation factors. The distribution coefficient Kd and
the retardation factor R can be linked as:
dKR 1 (8)
Where ρ is the bulk density (g/cm3), θ the volumetric water content, and Kd the sorption
distribution coefficient (cm3/g).
For the Freundlich isotherm, the partition coefficient can be given by:
dn
Fe KC
nK
C
q 1/11
(9)
and the retardation factor is given as [37, 38]:
1/111 n
F Cn
KR
(10)
The retardation factors estimated from eq.10 are reported in Table 4. The retardation factors
for NA were also determined from moment analysis of the experimental BTC by assuming
that sorption equilibrium was attained in the column system, and are presented in Table 4. As
for the sorbed amounts, there is a disparity between the R values estimated from batch and
column data.
Modeling of breakthrough capacities in column. Semi-empirical models such as the
Thomas, Yan and Yoon-Nelson models are used to estimate the sorption extent under flow
through conditions and to assess the breakthrough capacity from the break through curves.
The Thomas model is usually employed to estimate the extent and rate constant of sorption
[39, 40]. This model assumes that the external as well as the internal diffusions do not act as
limiting step, as it is demonstrated above in our tested systems. However, Thomas model
assumes the Langmuir isotherm for equilibrium and a second order reaction for kinetics [39],
while Freundlich isotherm provides a good description of our sorption isotherms.
Expression of model in linear form gives:
14
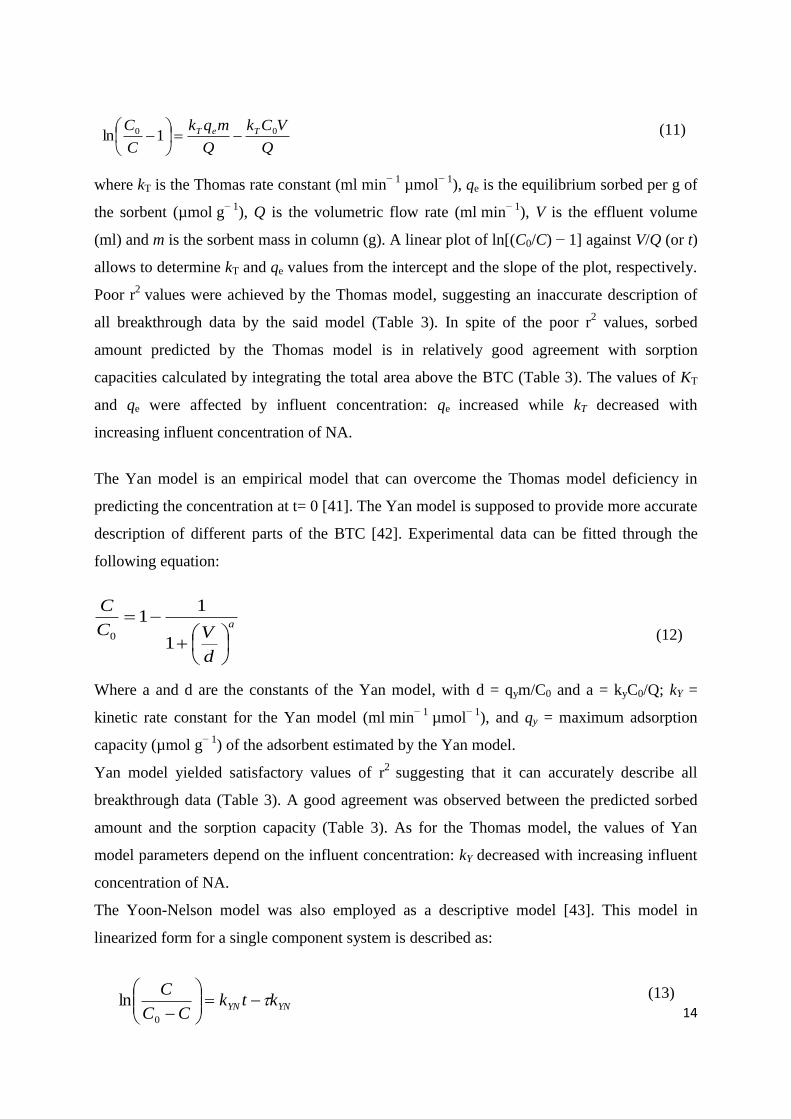
(11)
where kT is the Thomas rate constant (ml min− 1 µmol− 1), qe is the equilibrium sorbed per g of
the sorbent (µmol g− 1), Q is the volumetric flow rate (ml min− 1), V is the effluent volume
(ml) and m is the sorbent mass in column (g). A linear plot of ln[(C0/C) − 1] against V/Q (or t)
allows to determine kT and qe values from the intercept and the slope of the plot, respectively.
Poor r2 values were achieved by the Thomas model, suggesting an inaccurate description of
all breakthrough data by the said model (Table 3). In spite of the poor r2 values, sorbed
amount predicted by the Thomas model is in relatively good agreement with sorption
capacities calculated by integrating the total area above the BTC (Table 3). The values of KT
and qe were affected by influent concentration: qe increased while kT decreased with
increasing influent concentration of NA.
The Yan model is an empirical model that can overcome the Thomas model deficiency in
predicting the concentration at t= 0 [41]. The Yan model is supposed to provide more accurate
description of different parts of the BTC [42]. Experimental data can be fitted through the
following equation:
(12)
Where a and d are the constants of the Yan model, with d = qym/C0 and a = kyC0/Q; kY =
kinetic rate constant for the Yan model (ml min− 1 µmol− 1), and qy = maximum adsorption
capacity (µmol g− 1) of the adsorbent estimated by the Yan model.
Yan model yielded satisfactory values of r2 suggesting that it can accurately describe all
breakthrough data (Table 3). A good agreement was observed between the predicted sorbed
amount and the sorption capacity (Table 3). As for the Thomas model, the values of Yan
model parameters depend on the influent concentration: kY decreased with increasing influent
concentration of NA.
The Yoon-Nelson model was also employed as a descriptive model [43]. This model in
linearized form for a single component system is described as:
(13)
Q
VCk
Q
mqk
C
C TeT 00 1ln
YNYN ktkCC
C
0
ln
a
d
VC
C
1
11
0
15
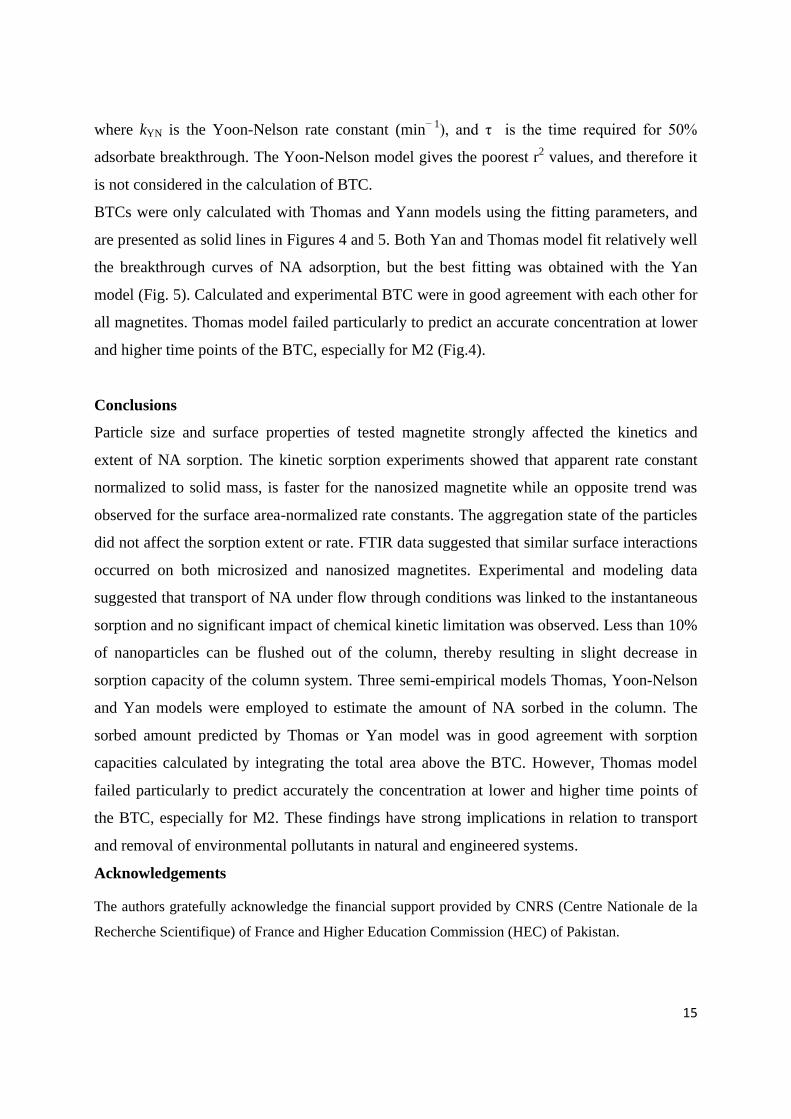
where kYN is the Yoon-Nelson rate constant (min− 1), and τ is the time required for 50%
adsorbate breakthrough. The Yoon-Nelson model gives the poorest r2 values, and therefore it
is not considered in the calculation of BTC.
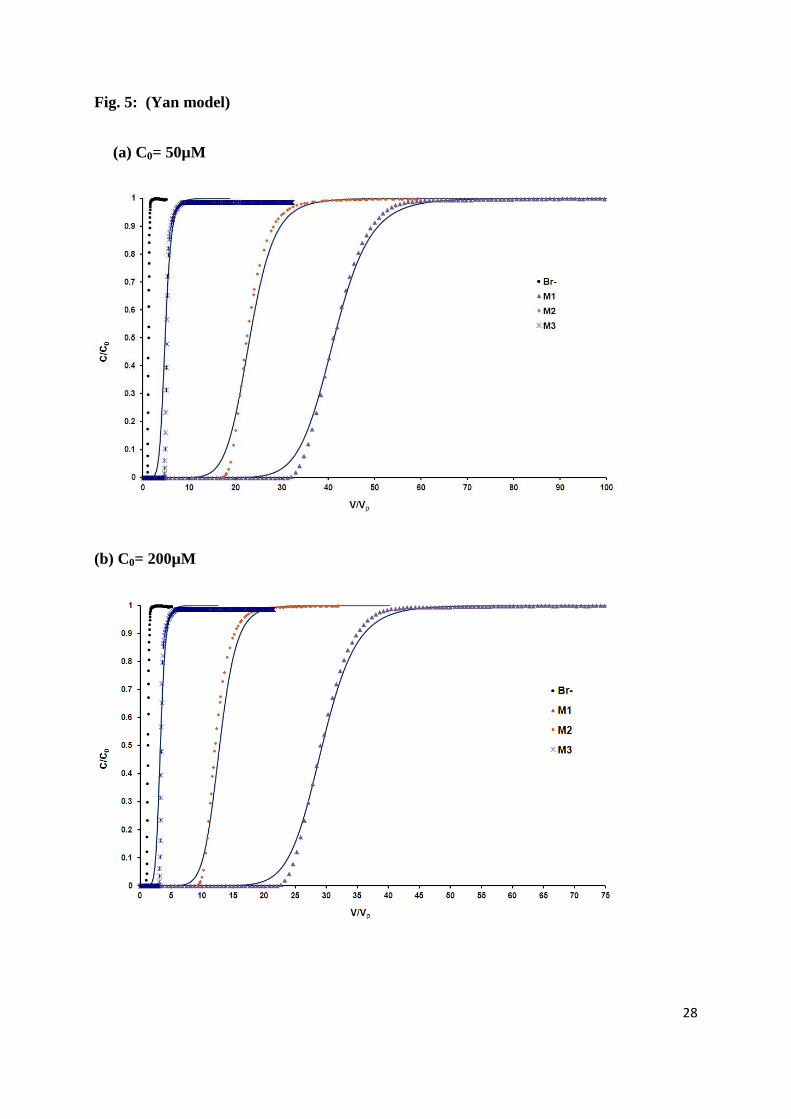
BTCs were only calculated with Thomas and Yann models using the fitting parameters, and
are presented as solid lines in Figures 4 and 5. Both Yan and Thomas model fit relatively well
the breakthrough curves of NA adsorption, but the best fitting was obtained with the Yan
model (Fig. 5). Calculated and experimental BTC were in good agreement with each other for
all magnetites. Thomas model failed particularly to predict an accurate concentration at lower
and higher time points of the BTC, especially for M2 (Fig.4).
Conclusions
Particle size and surface properties of tested magnetite strongly affected the kinetics and
extent of NA sorption. The kinetic sorption experiments showed that apparent rate constant
normalized to solid mass, is faster for the nanosized magnetite while an opposite trend was
observed for the surface area-normalized rate constants. The aggregation state of the particles
did not affect the sorption extent or rate. FTIR data suggested that similar surface interactions
occurred on both microsized and nanosized magnetites. Experimental and modeling data
suggested that transport of NA under flow through conditions was linked to the instantaneous
sorption and no significant impact of chemical kinetic limitation was observed. Less than 10%
of nanoparticles can be flushed out of the column, thereby resulting in slight decrease in
sorption capacity of the column system. Three semi-empirical models Thomas, Yoon-Nelson
and Yan models were employed to estimate the amount of NA sorbed in the column. The
sorbed amount predicted by Thomas or Yan model was in good agreement with sorption
capacities calculated by integrating the total area above the BTC. However, Thomas model
failed particularly to predict accurately the concentration at lower and higher time points of
the BTC, especially for M2. These findings have strong implications in relation to transport
and removal of environmental pollutants in natural and engineered systems.
Acknowledgements
The authors gratefully acknowledge the financial support provided by CNRS (Centre Nationale de la
Recherche Scientifique) of France and Higher Education Commission (HEC) of Pakistan.
16
References
[1] U. Schwertmann, R.M. Cornell, Iron Oxides in the Laboratory: Preparation and Characterization, Wiley-VCH, New York, 2000. [2] M. Usman, P. Faure, C. Ruby, K. Hanna, Remediation of PAH-contaminated soils by magnetite catalyzed Fenton-like oxidation, Appl. Catal. B: Environ. 117-118 (2012) 10-17. [3] M. Usman, P. Faure, C. Lorgeoux, C. Ruby, K. Hanna, Treatment of hydrocarbon contamination under flow through conditions by using magnetite catalyzed chemical oxidation, Environ. Sci. Pollut. Res. 20 (2013) 22-30. [4] G. Sposito, The chemistry of soils, Oxford university press, 2008. [5] X. Xue, K. Hanna, M. Abdelmoula, N. Deng, Adsorption and oxidation of PCP on the surface of magnetite: Kinetic experiments and spectroscopic investigations, Appl. Catal. B: Environ. 89 (2009) 432-440. [6] R. Karlin, M. Lyle, G.R. Heath, Authigenic magnetite formation in suboxic marine sediments, Nature, 326 (1987) 490-493. [7] B.A. Maher, R.M. Taylor, Formation of ultrafine-grained magnetite in soils, Nature, 336 (1988) 368-370. [8] C.-Y. Peng, G.V. Korshin, R.L. Valentine, A.S. Hill, M.J. Friedman, S.H. Reiber, Characterization of elemental and structural composition of corrosion scales and deposits formed in drinking water distribution systems, Water Res. 44 (2010) 4570-4580. [9] P. Sarin, V.L. Snoeyink, J. Bebee, W.M. Kriven, J.A. Clement, Physico-chemical characteristics of corrosion scales in old iron pipes, Water Res. 35 (2001) 2961-2969. [10] A. Zegeye, M. Abdelmoula, M. Usman, K. Hanna, C. Ruby, In situ monitoring of lepidocrocite bioreduction and magnetite formation by reflection Mossbauer spectroscopy, Am. Mineral. 96 (2011) 1410-1413. [11] C. Ruby, M. Usman, S. Naille, K. Hanna, C. Carteret, M. Mullet, M. François, M. Abdelmoula, Synthesis and transformation of iron-based layered double hydroxides, Appl. Clay Sci. 48 (2010) 195-202. [12] M. Usman, M. Abdelmoula, K. Hanna, B. Grégoire, P. Faure, C. Ruby, FeII induced mineralogical transformations of ferric oxyhydroxides into magnetite of variable stoichiometry and morphology, J. Solid State Chem. 194 (2012) 328-335. [13] M. Usman, M. Abdelmoula, P. Faure, C. Ruby, K. Hanna, Transformation of various kinds of goethite into magnetite: Effect of chemical and surface properties, Geoderma, 197-198 (2013) 9-16. [14] S.R. Chowdhury, E.K. Yanful, Arsenic and chromium removal by mixed magnetite-maghemite nanoparticles and the effect of phosphate on removal, J. Environ. Manag. 91 (2010) 2238-2247. [15] M. Martínez, J. Giménez, J. de Pablo, M. Rovira, L. Duro, Sorption of selenium(IV) and selenium(VI) onto magnetite, Appl. Surf. Sci. 252 (2006) 3767-3773. [16] S. Dixit, J.G. Hering, Comparison of Arsenic(V) and Arsenic(III) Sorption onto Iron Oxide Minerals: Implications for Arsenic Mobility, Environ. Sci. Technol., 37 (2003) 4182–4189. [17] T. Missana, M. García-Gutiérrez, V. Fernńdez, Uranium (VI) sorption on colloidal magnetite under anoxic environment: experimental study and surface complexation modelling, Geochim. Cosmochim. Acta. 67 (2003) 2543-2550.
17
[18] T. Missana, U. Alonso, A.C. Scheinost, N. Granizo, M. García-Gutiérrez, Selenite retention by nanocrystalline magnetite: Role of adsorption, reduction and dissolution/co-precipitation processes, Geochim. Cosmochim. Acta. 73 (2009) 6205-6217. [19] A. Scheidegger, M. Borkovec, H. Sticher, Coating of silica sand with goethite: preparation and analytical identification, Geoderma, 58 (1993) 43-65. [20] K. Hanna, Adsorption of aromatic carboxylate compounds on the surface of synthesized iron oxide-coated sands, Appl. Geochem. 22 (2007) 2045-2053. [21] E. Tanis, K. Hanna, E. Emmanuel, Experimental and modeling studies of sorption of tetracycline onto iron oxides-coated quartz, Coll. Surf. A. 327 (2008) 57-63. [22] K. Hanna, B. Rusch, L. Lassabatere, A. Hofmann, B. Humbert, Reactive transport of gentisic acid in a hematite-coated sand column: Experimental study and modeling, Geochim. Cosmochim. Acta. 74 (2010) 3351-3366. [23] E. Clervil, M. Usman, E. Emmanuel, V. Chatain, K. Hanna, Sorption of nalidixic acid onto sediments under batch and dynamic flow conditions, Chem. Geol. 335 (2013) 63-74. [24] B. Rusch, K. Hanna, B. Humbert, Sorption and Transport of Salicylate in a Porous Heterogeneous Medium of Silica Quartz and Goethite, Environ. Sci. Technol. 44 (2010) 2447-2453. [25] K. Hanna, L. Lassabatere, B. Bechet, Transport of two naphthoic acids and salicylic acid in soil: Experimental study and empirical modeling, Water Res. 46 (2012) 4457-4467. [26] K. Hanna, J.F. Boily, Sorption of two naphthoic acids to goethite surface under flow through conditions, Environ. Sci. Technol. 44 (2010) 8863-8869. [27] Z.-X. Sun, F.-W. Su, W. Forsling, P.-O. Samskog, Surface Characteristics of Magnetite in Aqueous Suspension, J. Colloid Interf. Sci. 197 (1998) 151-159. [28] C.T. Chiou, L.J. Peters, V.H. Freed, A Physical Concept of Soil-Water Equilibria for Nonionic Organic Compounds, Science, 206 (1979) 831-832. [29] T.K. Sherwood, R.L. Pigford, C. Wilke, Mass Transfer, McGraw-Hill, New York, 1975. [30] O. Levenspiel, Chemical Reaction Engineering, Second ed., Wiley-Eastern Limited, New York, 1972. [31] K. Hanna, F. Quil̀s, Surface Complexation of 2,5-Dihydroxybenzoic Acid (Gentisic Acid) at the Nanosized Hematite-Water Interface: An ATR-FTIR Study and Modeling Approach, Langmuir, 27 (2011) 2492-2500. [32] K. Hanna, Sorption of two aromatic acids onto iron oxides: Experimental study and modeling, J. Colloid Interf. Sci. 309 (2007) 419-428. [33] S. Gunasekaran, R.K. Natarajan, R. Rathikha, D. Syamala, Vibrational spectra and normal coordinate analysis of nalidixic acid, Indian J. Pure Ap. Phy. 43 (2005) 503-508. [34] Q. Wu, Z. Li, H. Hong, Adsorption of the quinolone antibiotic nalidixic acid onto montmorillonite and kaolinite, Appl. Clay Sci. 74 (2013) 66-73. [35] C.S. Bürglsser, M. Černík, M. Borkovec, H. Sticher, Determination of nonlinear adsorption isotherms from column experiments: An alternative to batch studies, Environ. Sci. Technol. 27 (1993) 943-948. [36] L. Sigg, W. Stumm, The interaction of anions and weak acids with the hydrous goethite (α-FeOOH) surface, Colloid. Surface. 2 (1981) 101-117. [37] C. Zheng, G.D. Bennett, Applied Contaminant Transport Modeling, 2nd ed., Wiley and Sons, Inc., New York, 2002. [38] H.D. Sharma, K.R. Reddy, Geoenvironmental engineering: site remediation, waste containment, and emerging waste management technologies, John Wiley & Sons, Inc., New Jersey, 2004. [39] S. Srivastava, S. Harsh, A.K. Srivastava, Use of NADH fluorescence measurement for on-line biomass estimation and characterization of metabolic status in bioreactor cultivation

18
of plant cells for azadirachtin (a biopesticide) production, Process Biochem. 43 (2008) 1121-1123. [40] X. Martínez-Lladó, C. Valderrama, M. Rovira, V. Martí, J. Giménez, J. de Pablo, Sorption and mobility of Sb(V) in calcareous soils of Catalonia (NE Spain): Batch and column experiments, Geoderma, 160 (2011) 468-476. [41] G. Yan, T. Viraraghavan, M. Chen, A new model for heavy metal removal in a biosorption column, Adsorpt. Sci. Technol. 19 (2001) 25-43. [42] G. Yan, T. Viraraghavan, Heavy metal removal in a biosorption column by immobilized M. rouxii biomass, Bioresource Technol, 78 (2001) 243-249. [43] Y.H. Yoon, J.H. Nelson, Application of gas adsorption kinetics I. A theoretical model for respirator cartridge service life, Am. Ind. Hyg. Assoc. J. 45 (1984) 509-516.
19
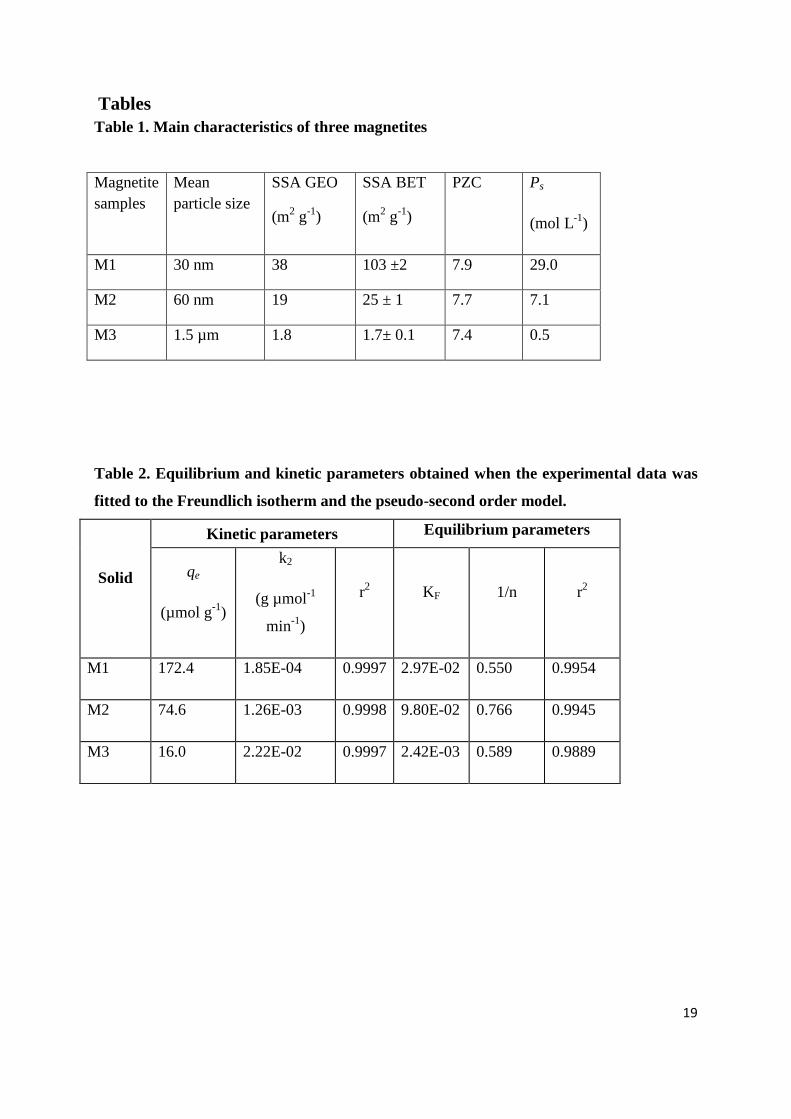
Tables Table 1. Main characteristics of three magnetites
Magnetite samples
Mean particle size
SSA GEO
(m2 g-1)
SSA BET
(m2 g-1)
PZC Ps
(mol L-1)
M1 30 nm 38 103 ±2 7.9 29.0
M2 60 nm 19 25 ± 1 7.7 7.1
M3 1.5 µm 1.8 1.7± 0.1 7.4 0.5
Table 2. Equilibrium and kinetic parameters obtained when the experimental data was
fitted to the Freundlich isotherm and the pseudo-second order model.
Solid
Kinetic parameters Equilibrium parameters
qe
(µmol g-1)
k2
(g µmol-1
min-1)
r2 KF 1/n r2
M1 172.4 1.85E-04 0.9997 2.97E-02 0.550 0.9954
M2 74.6 1.26E-03 0.9998 9.80E-02 0.766 0.9945
M3 16.0 2.22E-02 0.9997 2.42E-03 0.589 0.9889

20
Table 3: Experimental sorbed amount in column and Thomas model parameters for NA sorption at tow feed concentrations: 50 µM and 200 µM.
solid Sorption amount in column (µmol g-1)
Thomas model
qe (µmol g-1)
kth (ml µmol-1 min-1)
r2
50 µM 200 µM 50 µM 200 µM 50 µM 200 µM 50 µM 200 µM
M1 51.2 132.8 50.01 140.4 0.101 0.036 0.96 0.96
M2 26.7 55.6 27.7 58.5 0.138 0.041 0.92 0.91
M3 5.5 14.1 5.9 13.9 0.63 0.140 0.84 0.86
Yan model parameters solid Yan model
kY
(ml µmol-1 min-1) qy
(µmol g-1) r2
50 µM 200 µM 50 µM 200 µM 50 µM 200 µM
M1 42.4E-03 10.6E-03 48.3 137.2 0.95 0.95
M2 34.8E-03 9.4E-03 27.0 60.0 0.97 0.95
M3 30.0E-03 8.1E-03 5.7 15.2 0.86 0.88
Yoon-Nelson model parameters
solid Yoon-Nelson model
τ (min)
kYN (min-1)
r2
50 µM 200 µM 50 µM 200 µM 50 µM 200 µM
M1 2390 1684 0.0031 0.0044 0.88 0.88
M2 1273 756 0.0041 0.0084 0.92 0.90
M3 286 186 0.017 0.030 0.80 0.84

21
Table 4: Retardation factors derived from batch and column tests
Sorbent Batch Column
50 µM 200 µM 50 µM 200 µM
M1 60.9
33.1
41.0 29.0
M2 33.4
24.4 22.5 12.0
M3 4.6 3.1 4.9 3.3
22
Figures captions
Figure 1: XRD (a) and TEM (b) of the three used magnetites (M1, M2 and M3).
Figure 2: (a) Sorption onto three M vs. time. Solid= 0.5 g/L; [NA] = 200 µM; pH = 6.5 ± 0.1.
Lines represent kinetic model fits. (b) Sorption isotherms onto M1, M2 and M3. Solid= 0.5
g/L; pH = 6.5 ± 0.1. (c) Sorption onto three M vs. pH. Solid= 0.5 g/L; [NA]= 50 µM.
Conditions: T = 20 ±1 °C, pH = 6.5 ± 0.1, NaCl (10 mM) was used as a supporting
electrolyte.
Figure 3: FTIR of of NA sorbed on M1, M2 and M3. Solid= 0.5 g/L; [NA]= 200 µM, T =
20±1 °C, pH = 6 ± 0.1, NaCl (10 mM) was used as a supporting electrolyte.
Figure 4: Experimental breakthrough curves of Br- and NA; Flow rate = 0.2mL/min.
Experimental data (symbols) and calculated breakthrough curves (solid lines) by Thomas
model. 0.5 g was the amount of reactive phase in each column test. Inflow solution with (a)
C0 = 50 µM; (b) C0 = 200 µM; pH= 6 ± 0.1; T= 20 °C, NaCl (10 mM), [Br-] = 10-2 M.
Figure 5: Experimental breakthrough curves of Br- and NA; Flow rate = 0.2mL/min.
Experimental data (symbols) and calculated breakthrough curves (solid lines) by Yan model.
0.5 g was the amount of reactive phase in each column test. Inflow solution with (a) C0 = 50
µM; (b) C0 = 200 µM; T=20 °C, pH= 6 ± 0.1; NaCl (10 mM), [Br-] = 10-2 M.
23
Fig. 1:
(a)
Inte
nsit
y (a. u
.)
111
220
311
400422
M3
M2
M1
(b)
1 µm
M3
100 nm
M2
100 nm
M1
24
Fig. 2: (a)
(b)
25
(c)

26
Fig. 3:

27
Fig. 4: (Thomas model)
(a) C0= 50µM
(b) C0= 200µM
28
Fig. 5: (Yan model)
(a) C0= 50µM
(b) C0= 200µM