
Soot Formation in an Ethylene Diffusion Flameguilford.eng.yale.edu/pdfs/soot.pdf · SOOT FORMATION...
9
1497 Twenty-Seventh Symposium (International) on Combustion/The Combustion Institute, 1998/pp. 1497–1505 COMPUTATIONAL AND EXPERIMENTAL STUDY OF SOOT FORMATION IN A COFLOW, LAMINAR ETHYLENE DIFFUSION FLAME C. S. McENALLY, 1 A. M. SCHAFFER, 1 M. B. LONG, 1 L. D. PFEFFERLE, 1 M. D. SMOOKE, 1 M. B. COLKET 2 and R. J. HALL 2 1 Yale Center for Combustion Studies Yale University New Haven, CT 06520-8284, USA 2 United Technologies Research Center East Hartford, CT 06108, USA A sooting, ethylene coflow diffusion flame has been studied both experimentally and computationally. The fuel is diluted with nitrogen and the flame is slightly lifted to minimize the effects of the burner. Both probe (thermocouple and gas-sampling techniques) and optical diagnostic methods (Rayleigh scattering and laser-induced incandescence) are used to measure the temperature, gas species, and soot volume fractions. A detailed soot growth model in which the equations for particle production are coupled to the flow and gaseous species conservation equations has been used to investigate soot formation in the flame. The two-dimensional system couples detailed transport and finite-rate chemistry in the gas phase with the aerosol equations in the sectional representation. The formulation includes detailed treatment of the trans- port, inception, surface growth, oxidation, and coalescence of soot particulates. Effects of thermal radiation and particle scrubbing of gas-phase growth and oxidation species are also included. Predictions and mea- surements of temperature, soot volume fractions, and selected species are compared over a range of heights and as a function of radius. The formation of benzene is primarily controlled by the recombination of propargyl radicals, and benzene production rates are found to limit the rate of inception as well as the net rate of soot growth. The model predicted soot volume fractions well along the wings of the flame but underpredicted soot volume fractions by a factor of four along the centerline. Oxidation of particulates is dominated by reactions with hydroxyl radicals that attain levels approximately ten times higher than cal- culated equilibrium levels. Gas cooling effects due to radiative loss are shown to have a very significant effect on predicted temperatures. Introduction Combustion-generated soot particulates from land-based sources pose a significant health risk and are the subject of stringent new EPA regulations. Now, soot emissions from aircraft face the likelihood of tightened regulation. Besides regulatory issues, soot contributes to thermal radiation loads on com- bustor liners and turbine blades. Soot emissions en- hance contrail formation and tactical visibility of military aircraft. Further, impaction of soot on low observable surfaces can compromise the radar sig- nature of aircraft. Quantitative understanding of the soot growth and oxidation mechanisms and the abil- ity to model accurately these processes may be criti- cal to the development of strategies to control emis- sions. Despite the complexities of modeling soot for- mation in flames using detailed chemistry, the link- age of soot production to radiation and bulk flame properties is so strong that the coupled treatment of this problem is becoming a necessity for quantitative modeling of flame structure. Such modeling for a generic multidimensional configuration is still be- yond our current computational ability. The laminar diffusion flame, however, provides an environment to investigate the interaction of soot formation with detailed gas-phase chemistry in a multidimensional system. Recent investigators [1,2] have modeled jet dif- fusion flames, using simplified, monodisperse soot formation models with skeletal kinetic mechanisms. We recently modified the sectional soot formation model developed in Refs. [3,4] for incorporation into a code for a laminar axisymmetric diffusion flame (cylindrical fuel jet surrounded by a coflowing oxi- dizer) [5]. This model employs a velocity-vorticity formulation [6] in which the governing conservation equations are solved with detailed transport and fi- nite-rate chemistry submodels to predict the tem- perature, species mass fractions, and velocity fields as functions of the two independent coordinates. When this model was applied to a sooting methane– air flame, comparisons between the model and ex- periments were reasonable, yet the matching of bulk
Transcript of Soot Formation in an Ethylene Diffusion Flameguilford.eng.yale.edu/pdfs/soot.pdf · SOOT FORMATION...

1497
Twenty-Seventh Symposium (International) on Combustion/The Combustion Institute, 1998/pp. 1497–1505
COMPUTATIONAL AND EXPERIMENTAL STUDY OF SOOT FORMATION INA COFLOW, LAMINAR ETHYLENE DIFFUSION FLAME
C. S. McENALLY,1 A. M. SCHAFFER,1 M. B. LONG,1 L. D. PFEFFERLE,1 M. D. SMOOKE,1 M. B. COLKET2
and R. J. HALL2
1Yale Center for Combustion Studies
Yale University
New Haven, CT 06520-8284, USA2United Technologies Research Center
East Hartford, CT 06108, USA
A sooting, ethylene coflow diffusion flame has been studied both experimentally and computationally.The fuel is diluted with nitrogen and the flame is slightly lifted to minimize the effects of the burner. Bothprobe (thermocouple and gas-sampling techniques) and optical diagnostic methods (Rayleigh scatteringand laser-induced incandescence) are used to measure the temperature, gas species, and soot volumefractions. A detailed soot growth model in which the equations for particle production are coupled to theflow and gaseous species conservation equations has been used to investigate soot formation in the flame.The two-dimensional system couples detailed transport and finite-rate chemistry in the gas phase with theaerosol equations in the sectional representation. The formulation includes detailed treatment of the trans-port, inception, surface growth, oxidation, and coalescence of soot particulates. Effects of thermal radiationand particle scrubbing of gas-phase growth and oxidation species are also included. Predictions and mea-surements of temperature, soot volume fractions, and selected species are compared over a range of heightsand as a function of radius. The formation of benzene is primarily controlled by the recombination ofpropargyl radicals, and benzene production rates are found to limit the rate of inception as well as the netrate of soot growth. The model predicted soot volume fractions well along the wings of the flame butunderpredicted soot volume fractions by a factor of four along the centerline. Oxidation of particulates isdominated by reactions with hydroxyl radicals that attain levels approximately ten times higher than cal-culated equilibrium levels. Gas cooling effects due to radiative loss are shown to have a very significanteffect on predicted temperatures.
Introduction
Combustion-generated soot particulates fromland-based sources pose a significant health risk andare the subject of stringent new EPA regulations.Now, soot emissions from aircraft face the likelihoodof tightened regulation. Besides regulatory issues,soot contributes to thermal radiation loads on com-bustor liners and turbine blades. Soot emissions en-hance contrail formation and tactical visibility ofmilitary aircraft. Further, impaction of soot on lowobservable surfaces can compromise the radar sig-nature of aircraft. Quantitative understanding of thesoot growth and oxidation mechanisms and the abil-ity to model accurately these processes may be criti-cal to the development of strategies to control emis-sions.
Despite the complexities of modeling soot for-mation in flames using detailed chemistry, the link-age of soot production to radiation and bulk flameproperties is so strong that the coupled treatment ofthis problem is becoming a necessity for quantitativemodeling of flame structure. Such modeling for a
generic multidimensional configuration is still be-yond our current computational ability. The laminardiffusion flame, however, provides an environmentto investigate the interaction of soot formation withdetailed gas-phase chemistry in a multidimensionalsystem.
Recent investigators [1,2] have modeled jet dif-fusion flames, using simplified, monodisperse sootformation models with skeletal kinetic mechanisms.We recently modified the sectional soot formationmodel developed in Refs. [3,4] for incorporation intoa code for a laminar axisymmetric diffusion flame(cylindrical fuel jet surrounded by a coflowing oxi-dizer) [5]. This model employs a velocity-vorticityformulation [6] in which the governing conservationequations are solved with detailed transport and fi-nite-rate chemistry submodels to predict the tem-perature, species mass fractions, and velocity fieldsas functions of the two independent coordinates.When this model was applied to a sooting methane–air flame, comparisons between the model and ex-periments were reasonable, yet the matching of bulk
1498 SOOT FORMATION AND DESTRUCTION
flame properties was insufficient to enable quanti-tative comparison of the calculated and measuredsoot profiles. In contrast to these results was thenearly perfect agreement obtained between themodel and optical diagnostics of temperature, fuel,and NO for a nonsooting, methane coflow diffusionflame [7]. This latter blue flame was diluted andlifted far from the burner inlet. A speculated prob-lem in the sooting flame that was attached to theburner was uncertain inlet boundary conditions dueto preheating of the fuel and air.
This investigation studies a coflow diffusion flame,but partially lifted, to minimize effects of uncertaininlet conditions and to compare results from calcu-lations, intrusive diagnostics, and nonintrusive diag-nostics to determine the strengths and weaknessesof each approach. Through this study, it is expectedthat flame types amenable to modeling, and corre-spondingly appropriate diagnostic methods, can berecommended for future studies. Furthermore, thisstudy should provide additional information on thenature of soot formation and growth in coflow dif-fusion flames.
Problem Formulation
Soot Modeling
Soot kinetics are modeled as coalescing, solid car-bon spheroids undergoing surface growth in the freemolecule limit. The particle mass range of interestis divided into sections [8], and an equation is writtenfor each section including coalescence, surfacegrowth, and oxidation. Sectional analysis makes itpossible to obtain the particle size distribution with-out a priori assumptions about the form of the dis-tribution. For the smallest section, an inceptionsource term is included. The transport conservationequation for each section includes thermophoresis,an effective bin diffusion rate, and source terms forgas-phase scrubbing. The gas and soot equations areadditionally coupled through nonadiabatic radiativeloss in the optically thin approximation. The incep-tion model employed here is based on an estimateof the formation rate of two- and three-ringed aro-matic species (naphthalene and phenanthrene) andis a function of local acetylene, benzene, phenyl, andmolecular hydrogen concentrations [5]. The contri-butions from the inception processes are incorpo-rated in the first sectional bin, whose lower massboundary is set equal to the mass of the smallestinception species. In the sectional representation[8], the sectional mass boundaries vary linearly on alogarithmic scale. The number of sections requiredfor convergence must be examined for each problemand depends on the relative magnitudes of surfacegrowth and inception. Oxidation of soot by O2 andOH is treated as described in [4]. The surface growth
rate is based on that of Harris and Weiner [9] witha nominal activation energy of 31.8 kcal/mol as sug-gested by Hura and Glassman [10]. We empiricallyadjusted the Harris and Weiner rate by a factor oftwo as in Ref. [5].
Governing Equations and Numerical Method
The axisymmetric computational model employsthe gas-phase diffusion flame equations in the veloc-ity-vorticity formulation [6] with the sectional ap-proach presented in Ref. [4]. Buoyancy is includedin the model. The result is a strongly coupled set ofelliptic partial differential equations. We solve forthe radial and axial velocities, the vorticity, the tem-perature, the gas-phase species, and the particle sec-tional mass fractions. The system is closed with theideal gas law, and appropriate boundary conditionsare applied on each side of the computational do-main. Local properties are evaluated using vectori-zed and highly optimized transport and chemistrylibraries [11]. The sectional thermophoretic veloci-ties in the free molecule regime are given in Ref. [3]as are the sectional diffusion velocities, which arewritten with a mass-weighted mean diffusion coef-ficient for each size class. In the optically thin radi-ation model used in our calculations, the significantradiating species, in addition to particulates, areH2O, CO, and CO2. Given the length scales of theflame investigated, it is highly unlikely that self-ab-sorption is important. Although the soot volumefraction reaches near ppm levels, the narrowness ofthe soot shell (1–2 mm) will mitigate any self-ab-sorption effects.
The governing conservation equations are solvedon a two-dimensional mesh by combining a steady-state and a time-dependent solution method [7]. Atime-dependent approach is used to help obtain aconverged numerical solution on an initial coarsegrid. Grid points are then inserted adaptively, andNewton’s method is used to complete the problem.
Experimental Methods
Atmospheric pressure, overventilated, axisymme-tric, coflowing, non-premixed laminar flames weregenerated with a burner in which the fuel flows froman uncooled 4.0-mm-i.d. vertical brass tube (wallthickness 0.038 mm) and the oxidizer flows from theannular region between this tube and a 50-mm di-ameter concentric tube (see Fig. 1). The oxidizer wasair while the fuel was a mixture containing ethyleneand nitrogen. Fuel flowrates were governed by elec-tronic mass flow controllers accurate to within 5%.The same burner apparatus was used for all the ex-periments. The temperature of the brass tube forthis slightly lifted flame was less than 330 K.

SOOT FORMATION IN AN ETHYLENE DIFFUSION FLAME 1499
Fig. 1. Schematic of the burner configuration.
Probe Measurements
The probe measurement procedures have beendescribed previously [12,13]. Gas temperatureswere measured with 75 lm wire-diameter Type Rthermocouples and corrected for radiation heattransfer effects using standard techniques [12]. Arapid insertion procedure was used to minimize er-rors due to soot deposition onto the thermocouple.In soot-free regions, the absolute uncertainty ofthese measurements is estimated to be 550 K andthe relative uncertainty to be 510 K.
Soot concentrations were measured with the samethermocouples using thermocouple particle densi-tometry (TPD), a technique in which soot volumefraction is inferred from measured rates of soot par-ticle mass transfer to the thermocouple junction[12]. The results have a relative uncertainty of 30%,and an absolute uncertainty of 50%.
Species concentrations were measured by extract-ing gas samples from the flames with a narrow-tipped quartz microprobe and analyzing these sam-ples with on-line mass spectrometry [13]. Acetyleneand ethylene were quantified with an Extrel C50variable-ionization-energy electron-impact/quadru-pole mass spectrometer, and C3 to C12 hydrocar-bons with a custom-built photoionization/time-of-flight mass spectrometer. Measurements weredirectly calibrated and have an absolute uncertaintyof 30%.
Profiles were generated by moving the burnerwith translation stages. The axial and radial coordi-nates, designated z and r, have a relative uncertaintyof 50.2 mm and an absolute uncertainty of 50.5mm.
Laser Diagnostic Measurements
Using planar laser imaging, we obtain two-dimen-sional fields of temperature, fuel concentration, andsoot volume fraction in the C2H4/N2 flame. The tem-perature field is determined using the two scalar ap-proach of Starner et al. [14] and included the mea-surement of Rayleigh scattering and the use of thecomputed fuel concentration.
The soot volume fraction field is determined bylaser-induced incandescence (LII). At sufficient la-ser intensities, the LII signal has been shown to bedirectly proportional to soot volume fraction [15].The probe measurements of the soot volume frac-tion are used for calibration.
The second harmonic of an Nd:YAG laser (532nm) is focused into a 18.0-mm-tall vertical sheet overthe center of the burner. The incandescence andscattered light is collected perpendicular to the laseraxis. The light passes through an appropriate inter-ference filter and then is focused onto an intensifiedcharge-coupled device (CCD) camera.
For Rayleigh scattering, images at two down-stream locations are acquired. For the first set ofimages, the laser sheet is 3 mm off the surface of theburner. A 532-nm interference filter (10-nmFWHM) is used to collect the Rayleigh scattering.In the region from 11.0–22.0 mm downstream, in-terference from LII and particle scattering dominatethe Rayleigh signal, which is not plotted in this re-gion (see Fig. 2). Rayleigh images are also acquiredwith the bottom edge of the laser sheet just abovethe flame tip (22 mm off the burner surface), wheretemperatures are just below adiabatic flame tem-peratures, and where there is no interferences fromLII. Laser energy is set to 100 mJ/pulse.
With the laser sheet 8 mm off the burner surface,LII images are acquired. A 450-nm (10-nm FWHM)interference filter is used to collect the incandes-cence signal. In the region of greatest incandescencesignal, a survey is conducted of incandescence signalversus laser intensity to maximize signal intensitywithout saturation (e.g., soot destruction) at anypoint in the flowfield. All images are corrected foroptical throughput, background scattering signals,and nonuniformities in beam profile. Images are alsocorrected for flame luminosity and nonuniform de-tector response.
Results
The chemical kinetic mechanism for ethylenecombustion has 45 species and 233 reactions. It wasderived from GRIMech 1.2 [16], based on compar-isons to experimental data on ethylene from per-fectly stirred and flow reactors and ignition delaydata. It includes reactions describing the formationand oxidation of benzene, and related species.
1500 SOOT FORMATION AND DESTRUCTION
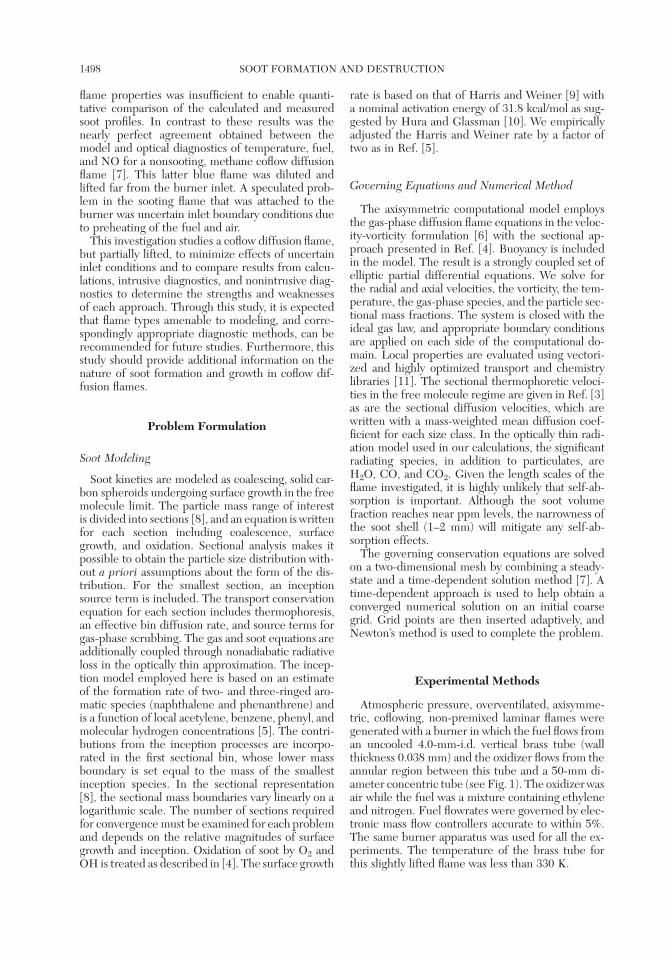
Fig. 2. Temperature isotherms (K) for the model (left), thermocouple (center), and Rayleigh scattering (right) mea-surements.
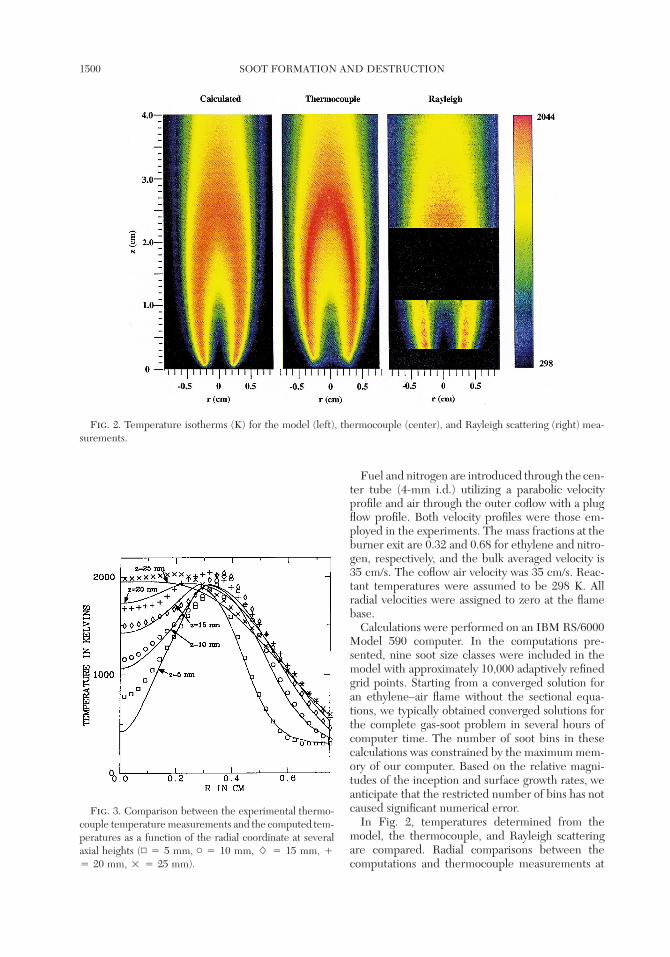
Fig. 3. Comparison between the experimental thermo-couple temperature measurements and the computed tem-peratures as a function of the radial coordinate at severalaxial heights (▫ 4 5 mm, C 4 10 mm, L 4 15 mm, `
4 20 mm, 2 4 25 mm).
Fuel and nitrogen are introduced through the cen-ter tube (4-mm i.d.) utilizing a parabolic velocityprofile and air through the outer coflow with a plugflow profile. Both velocity profiles were those em-ployed in the experiments. The mass fractions at theburner exit are 0.32 and 0.68 for ethylene and nitro-gen, respectively, and the bulk averaged velocity is35 cm/s. The coflow air velocity was 35 cm/s. Reac-tant temperatures were assumed to be 298 K. Allradial velocities were assigned to zero at the flamebase.
Calculations were performed on an IBM RS/6000Model 590 computer. In the computations pre-sented, nine soot size classes were included in themodel with approximately 10,000 adaptively refinedgrid points. Starting from a converged solution foran ethylene–air flame without the sectional equa-tions, we typically obtained converged solutions forthe complete gas-soot problem in several hours ofcomputer time. The number of soot bins in thesecalculations was constrained by the maximum mem-ory of our computer. Based on the relative magni-tudes of the inception and surface growth rates, weanticipate that the restricted number of bins has notcaused significant numerical error.
In Fig. 2, temperatures determined from themodel, the thermocouple, and Rayleigh scatteringare compared. Radial comparisons between thecomputations and thermocouple measurements at
SOOT FORMATION IN AN ETHYLENE DIFFUSION FLAME 1501
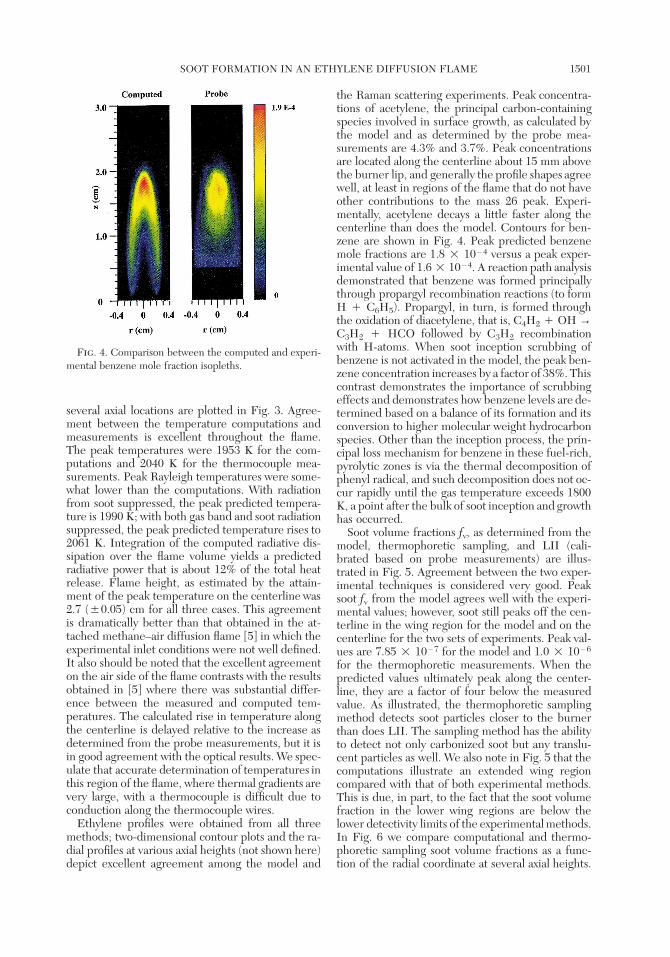
Fig. 4. Comparison between the computed and experi-mental benzene mole fraction isopleths.
several axial locations are plotted in Fig. 3. Agree-ment between the temperature computations andmeasurements is excellent throughout the flame.The peak temperatures were 1953 K for the com-putations and 2040 K for the thermocouple mea-surements. Peak Rayleigh temperatures were some-what lower than the computations. With radiationfrom soot suppressed, the peak predicted tempera-ture is 1990 K; with both gas band and soot radiationsuppressed, the peak predicted temperature rises to2061 K. Integration of the computed radiative dis-sipation over the flame volume yields a predictedradiative power that is about 12% of the total heatrelease. Flame height, as estimated by the attain-ment of the peak temperature on the centerline was2.7 (50.05) cm for all three cases. This agreementis dramatically better than that obtained in the at-tached methane–air diffusion flame [5] in which theexperimental inlet conditions were not well defined.It also should be noted that the excellent agreementon the air side of the flame contrasts with the resultsobtained in [5] where there was substantial differ-ence between the measured and computed tem-peratures. The calculated rise in temperature alongthe centerline is delayed relative to the increase asdetermined from the probe measurements, but it isin good agreement with the optical results. We spec-ulate that accurate determination of temperatures inthis region of the flame, where thermal gradients arevery large, with a thermocouple is difficult due toconduction along the thermocouple wires.
Ethylene profiles were obtained from all threemethods; two-dimensional contour plots and the ra-dial profiles at various axial heights (not shown here)depict excellent agreement among the model and
the Raman scattering experiments. Peak concentra-tions of acetylene, the principal carbon-containingspecies involved in surface growth, as calculated bythe model and as determined by the probe mea-surements are 4.3% and 3.7%. Peak concentrationsare located along the centerline about 15 mm abovethe burner lip, and generally the profile shapes agreewell, at least in regions of the flame that do not haveother contributions to the mass 26 peak. Experi-mentally, acetylene decays a little faster along thecenterline than does the model. Contours for ben-zene are shown in Fig. 4. Peak predicted benzenemole fractions are 1.8 2 1014 versus a peak exper-imental value of 1.6 2 1014. A reaction path analysisdemonstrated that benzene was formed principallythrough propargyl recombination reactions (to formH ` C6H5). Propargyl, in turn, is formed throughthe oxidation of diacetylene, that is, C4H2 ` OH →C3H2 ` HCO followed by C3H2 recombinationwith H-atoms. When soot inception scrubbing ofbenzene is not activated in the model, the peak ben-zene concentration increases by a factor of 38%. Thiscontrast demonstrates the importance of scrubbingeffects and demonstrates how benzene levels are de-termined based on a balance of its formation and itsconversion to higher molecular weight hydrocarbonspecies. Other than the inception process, the prin-cipal loss mechanism for benzene in these fuel-rich,pyrolytic zones is via the thermal decomposition ofphenyl radical, and such decomposition does not oc-cur rapidly until the gas temperature exceeds 1800K, a point after the bulk of soot inception and growthhas occurred.
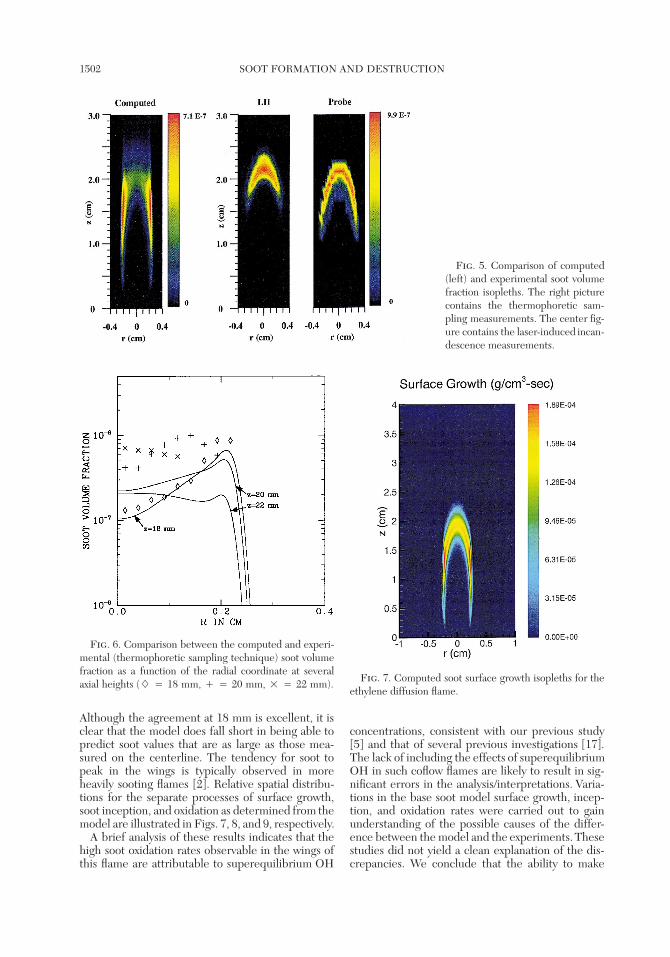
Soot volume fractions fv, as determined from themodel, thermophoretic sampling, and LII (cali-brated based on probe measurements) are illus-trated in Fig. 5. Agreement between the two exper-imental techniques is considered very good. Peaksoot fv from the model agrees well with the experi-mental values; however, soot still peaks off the cen-terline in the wing region for the model and on thecenterline for the two sets of experiments. Peak val-ues are 7.85 2 1017 for the model and 1.0 2 1016
for the thermophoretic measurements. When thepredicted values ultimately peak along the center-line, they are a factor of four below the measuredvalue. As illustrated, the thermophoretic samplingmethod detects soot particles closer to the burnerthan does LII. The sampling method has the abilityto detect not only carbonized soot but any translu-cent particles as well. We also note in Fig. 5 that thecomputations illustrate an extended wing regioncompared with that of both experimental methods.This is due, in part, to the fact that the soot volumefraction in the lower wing regions are below thelower detectivity limits of the experimental methods.In Fig. 6 we compare computational and thermo-phoretic sampling soot volume fractions as a func-tion of the radial coordinate at several axial heights.
1502 SOOT FORMATION AND DESTRUCTION
Fig. 5. Comparison of computed(left) and experimental soot volumefraction isopleths. The right picturecontains the thermophoretic sam-pling measurements. The center fig-ure contains the laser-induced incan-descence measurements.
Fig. 6. Comparison between the computed and experi-mental (thermophoretic sampling technique) soot volumefraction as a function of the radial coordinate at severalaxial heights (L 4 18 mm, ` 4 20 mm, 2 4 22 mm). Fig. 7. Computed soot surface growth isopleths for the
ethylene diffusion flame.
Although the agreement at 18 mm is excellent, it isclear that the model does fall short in being able topredict soot values that are as large as those mea-sured on the centerline. The tendency for soot topeak in the wings is typically observed in moreheavily sooting flames [2]. Relative spatial distribu-tions for the separate processes of surface growth,soot inception, and oxidation as determined from themodel are illustrated in Figs. 7, 8, and 9, respectively.
A brief analysis of these results indicates that thehigh soot oxidation rates observable in the wings ofthis flame are attributable to superequilibrium OH
concentrations, consistent with our previous study[5] and that of several previous investigations [17].The lack of including the effects of superequilibriumOH in such coflow flames are likely to result in sig-nificant errors in the analysis/interpretations. Varia-tions in the base soot model surface growth, incep-tion, and oxidation rates were carried out to gainunderstanding of the possible causes of the differ-ence between the model and the experiments. Thesestudies did not yield a clean explanation of the dis-crepancies. We conclude that the ability to make

SOOT FORMATION IN AN ETHYLENE DIFFUSION FLAME 1503
Fig. 8. Computed soot inception isopleths for the eth-ylene diffusion flame.
Fig. 9. Computed soot oxidation (OH ` O2) isoplethsfor the ethylene diffusion flame.
quantitative soot predictions remains limited bysome fundamental uncertainties in the soot model(including the lack of aging and aggregate formationeffects), by the ability of the chemical kinetic mech-anism to predict accurately the concentrations of im-portant species (benzene, propargyl, acetylene, anddiacetylene) and possibly by the lack of quantitativeinformation concerning the production of translu-cent particles [18].
Conclusions
A slightly lifted ethylene jet diffusion flame wasinvestigated by comparing results from two sets ofexperimental diagnostics, one of which was intrusiveand the other nonintrusive, and results from a de-tailed model with fully coupled equations treatingradiation and soot formation. The current work isthe first to apply a detailed chemistry model with amultiple section soot growth model to a flame thathas well represented burner/inlet conditions. Agree-ment among the experiments and computations isgenerally good and in some cases excellent. In ad-dition, by comparing the results, we were able toconclude that previously identified discrepancies [5]were likely the result of uncertainties in the burnerinlet conditions when the flame is attached to theburner lip. Specifically, uncertain inlet conditionspreviously led to overprediction of the flame heightand high temperatures in the wings of the flame. Forthe lifted flame, the model was able to reproducebulk flame parameters extremely well, includingflame height, species concentrations, and local tem-peratures, given some uncertainties in the experi-ments. The coupled soot model utilized in this andin previous studies reproduced peak soot volumefractions to within 20% but had some difficulty inreproducing accurately the distribution of sootformed along the centerline of the flame versus thatformed along the wings. The formation of benzeneas a limit to the inception process was confirmed inthis study. Benzene formation was found to be gov-erned by propargyl recombination, and propargylformation, in turn, was controlled by reactions in-volving diacetylene.
Acknowledgments
This work has been supported in part by the Air ForceOffice of Scientific Research under contract F49620-94-C-0059 and the United States Department of Energy, Officeof Basic Energy Sciences. The encouragement of JulianTishkoff and discussions with R. J. Santoro (Penn StateUniversity), R. A. Dobbins (Brown University), and M. A.Tanoff (Yale University) are gratefully acknowledged. Theassistance of B. A. Bennett and B. Dobbins (Yale Univer-sity) was essential in the preparation of the figures.

1504 SOOT FORMATION AND DESTRUCTION
REFERENCES
1. Kaplan, C. R., Shaddix, C. R., and Smyth, K. C., Com-
bust. Flame 106:392–405 (1996).2. Kennedy, I. M., Rapp, D. R., Santoro, R. J., and Yam,
C., Combust. Flame 107:368–382 (1996).3. Colket, M. B. and Hall, R. J., in Soot Formation in
Combustion, Mechanisms and Models (H. Bockhorn,ed.), Springer Series in Chemical Physics 59, Springer-Verlag, New York, 1994, pp. 442–470.
4. Hall, R. J., Smooke, M. D., and Colket, M. B., inPhysical and Chemical Aspects of Combustion: A Trib-
ute to Irvin Glassman (R. F. Sawyer and F. L. Dryer,eds.), Combustion Science and Technology Book Se-ries, Gordon & Breach, Langhorne, PA, 1997, pp. 189–230.
5. Smooke, M. D., McEnally, C. S., Pfefferle, L. D., Hall,R. J., and Colket, M. B., “Computational and Experi-mental Study of Soot Formation in a Coflow, LaminarDiffusion Flame,” Combust. Flame, in press (1997).
6. Ern, A., Douglas, C. C., and Smooke, M. D., Int. J. of
Supercomputer Appl. 9:167–186 (1995).7. Smooke, M. D., Ern, A., Tanoff, M. A., Valdati, B. A.,
Mohammed, R. K., Marran, D. F., and Long, M. B., inTwenty-Sixth Symposium (International) on Combus-
tion, The Combustion Institute, Pittsburgh, 1996, pp.2161–2170.
8. Gelbard, F. and Seinfeld, J. H., J. Coll. Int. Sci.
78:485–501 (1980).9. Harris, S. J. and Weiner, A. M., Combust. Sci. Technol.
31:155–167 (1983).10. Hura, H. S. and Glassman, I., in Twenty-Second Sym-
posium (International) on Combustion, The Combus-tion Institute, Pittsburgh, 1988, pp. 371–378.
11. Giovangigli, V. and Darabiha, N., in Proceedings of the
Conference on Mathematical Modeling in Combustion,
Lyon, France, NATO ASI Series, 1987, pp. 491–503.12. McEnally, C. S., Koylu, U. O., Pfefferle, L. D., and
Rosner, D. E., Combust. Flame 109:701–720 (1997).13. McEnally, C. S. and Pfefferle, L. D., Combust. Sci.
Technol. 116–117:183–209 (1996).14. Starner, S., Bilger, R. W., Dibble, R. W., and Barlow,
R. S., Combust. Sci. Technol. 86:223–236 (1992).15. Quay, B., Lee, T.-W., Ni, T., and Santoro, R. J., Com-
bust. Flame 97:384–392 (1994).16. Bowman, C. T., Hanson, R. K., Davidson, D. F., Gar-
diner, W. C. Jr., Lissianski, V., Smith, G. P., Golden,D. M., Frenklach, M., Wang, H., and Goldenberg, M.,GRI-Mech version 2.11, http://www.gri.org (1995).
17. Puri, R., Santoro, R. J., and Smyth, K. C., Combust.
Flame 97:125–144 (1994).18. Dobbins, R. A., Fletcher, R. A., and Lu, W., Combust.
Flame 100:301–309 (1995).
COMMENTS
Houston Miller, George Washington University, USA. AsI understand your presentation, “soot” was considered as aseries of increasing size bits, the smallest of which was atwo-ring aromatic. Clearly, experimental diagnostics suchas the thermophoretic thermocouple technique are notmeasuring species as small as these. I wonder what thecomparisons between model and experiments would looklike had the definition of the minimum paper size beenincreased to a more realistic value.
Author’s Reply. The TPD technique will detect any par-ticle massive enough to condense onto the thermocouple(roughly above 1000 amu). Based on an analysis of pre-dicted particle size distributions for this ethylene flame andfor a methane flame (Fig. 11 in Ref. [5] in the paper), thecontributions of the low mass classes (1–3) to the total sootfield are insignificant on locations where soot concentra-tions are at measurable levels. Because particles withmasses below 1000 amu all fall within the first size classfor the present study, our figures and conclusions will notbe effected. Separating these classes will be useful, how-ever, for investigation whether our model simulates exper-imental results on PAH species. Such comparisons have notyet been performed.
●
Carolyn Kaplan, Naval Research Laboratory, USA. Your
results indicate that soot nucleation peaks at the centerlineand that surface growth is high at the centerline. Can yousuggest a reason as to why the computed soot volume frac-tion is so low at the centerline? Could it be that the com-puted oxidation is too high? Also, can you tell (from thecomputations) what the gas-phase temperature is at parti-cle inception?
Author’s Reply. We have tried to determine the cause ofthe low soot predictions along the centerline using a pre-liminary sensitivity analysis on the effects of variable oxi-dation rates, growth rates, and inception rates, presumablydue to the relative spatial location of peak values for theserates (Figs. 7–9 in the paper). Our best estimate is that thedeficit in the model is caused by inaccuracies in our PAHgrowth/inception model. Based on a comparison of particleinception rates and gas-phase temperatures, predicted in-ception rates begin to increase dramatically in the 1550–1650 K regime, consistent with arguments presented byGlassman [1].
REFERENCE
1. Glassman, I., in Twenty-Seventh Symposium (Interna-
tional) on Combustion, The Combustion Institute, Pitts-burgh, 1998, pp. 1589–1596.

SOOT FORMATION IN AN ETHYLENE DIFFUSION FLAME 1505
●
Richard Wainner, Georgia Tech, USA. A number ofmodeling efforts and some experimental results haveshown the LII signal to be sensitive to particle size, espe-cially at longer delays from the laser pulse. As your particlesizes are known (and extend over a broad range), you mightwant to correct your LII signal for this spatially varyingsensitivity and then see how well this profile compares withthe thermocouple deposition data.
Author’s Reply. The experimental volume fraction pro-files obtained by LII and thermocouple deposition are ingood overall agreement. However, the qualitative shape ofthe computed soot volume fraction shows some significantdifferences—most notably the computed soot volume frac-tion profiles do not peak on the centerline. Therefore, eventhough the computations do include information on thesize distribution, we do not feel confident in using com-puted particle sizes to correct the measured LII profiles.


![Flame Radiation Distribution from Firesformation which has been established from data in laminar diffusion flames[7]; the soot concentration can be determined by the following rate](https://static.fdocuments.us/doc/165x107/6116845800457277080ef2f0/flame-radiation-distribution-from-formation-which-has-been-established-from-data.jpg)


