Sonority Contour Preferences in Philippine Languages · Sonority Contour Preferences in Philippine...
18
Sonority Contour Preferences in Philippine Languages * K. David Harrison, Katharine Merow, and Rachel Shorey Swarthmore College [email protected], [email protected], [email protected] Having heard of an anthropologist’s speculation that Baynīnan Ifugao, spoken in the northern Luzon region of the Philippines, shows a preference for vowel sequences with rising sonority, we sought to establish the existence – and gauge the generality – of this phenomenon. We assembled electronic corpora and, using a computerized counter, tabulated vowel cooccurrence frequencies. Our research suggests that some languages of the Philippines exhibit the pattern described, and we also found evidence in some languages of a more nuanced hierarchy of sonority contours. This paper is devoted largely to a discussion of the challenges of applying statistical methods to data analyzed herein. Statistical tests depend on setting a threshold at which a pattern is considered to be statistically significant. While it is easy to apply tests to data to determine whether attested patterns are statistically significant, no claim can be made about the link between statistical tests and speaker perception and acquisition without further linguistic and psychological research. 1. Introduction The purpose of this paper is to present methods of assessing the extent to which minor languages of the northern Philippines—most notably Kagayanen and the Ifugao dialects—exhibit what we term a SONORITY CONTOUR PREFERENCE. We provide background information on VOWEL HARMONY and related systems as attested in diverse language families (§2), an account of how the phenomenon investigated was first hypothesized, and a justification of our chosen terminology (both in §3). The process of corpus assembly and cleanup is briefly described (§5), as are the assumptions that underlie our research (§4). The main focus of the paper is the development and utilization of graphical and statistical tools to identify patterns present in the data (§6). We outline diagnostic procedures and acknowledge the limitations of the methods devised. We conclude by grouping the languages studied into categories based on their apparent sonorityrelated preferences (§8), and by indicating directions for future research (§10). Appendices are provided for readers interested in the details of the mathematics underpinning our graphical tools and hypothesis tests. 2. Overview of Harmony and Similar Systems In the vowel harmony systems attested in language families as diverse as Bantu and Uralic, such vowel characteristics as roundness, backness, ATR, and height are found to be dependent upon characteristics of other vowels within the same word or phrase. In Turkish, for example, where there are front (e, é, i, í) and back (y, a, o, u) vowels, words with front vowels get front vowel suffixes, while those with back vowels get variants containing back vowels (this admittedly oversimplified account of Turkish vowel harmony is included here for purposes of illustration only), as the following data illustrate: (1) kéz de kar da hand in arm in ‘in the hand’ ‘in the arm’ * Thanks to Steve Wong and Phil Everson for information on statistics and to Will Quale and Robbie Hart for technical assistance.
Transcript of Sonority Contour Preferences in Philippine Languages · Sonority Contour Preferences in Philippine...

Sonority Contour Preferences in Philippine Languages * K. David Harrison, Katharine Merow, and Rachel Shorey
Swarthmore College [email protected], [email protected], [email protected]
Having heard of an anthropologist’s speculation that Baynīnan Ifugao, spoken in the northern Luzon region of the Philippines, shows a preference for vowel sequences with rising sonority, we sought to establish the existence – and gauge the generality – of this phenomenon. We assembled electronic corpora and, using a computerized counter, tabulated vowel cooccurrence frequencies. Our research suggests that some languages of the Philippines exhibit the pattern described, and we also found evidence in some languages of a more nuanced hierarchy of sonority contours. This paper is devoted largely to a discussion of the challenges of applying statistical methods to data analyzed herein. Statistical tests depend on setting a threshold at which a pattern is considered to be statistically significant. While it is easy to apply tests to data to determine whether attested patterns are statistically significant, no claim can be made about the link between statistical tests and speaker perception and acquisition without further linguistic and psychological research.
1. Introduction
The purpose of this paper is to present methods of assessing the extent to which minor languages of the northern Philippines—most notably Kagayanen and the Ifugao dialects—exhibit what we term a SONORITY CONTOUR PREFERENCE. We provide background information on VOWEL HARMONY and related systems as attested in diverse language families (§2), an account of how the phenomenon investigated was first hypothesized, and a justification of our chosen terminology (both in §3). The process of corpus assembly and cleanup is briefly described (§5), as are the assumptions that underlie our research (§4). The main focus of the paper is the development and utilization of graphical and statistical tools to identify patterns present in the data (§6). We outline diagnostic procedures and acknowledge the limitations of the methods devised. We conclude by grouping the languages studied into categories based on their apparent sonorityrelated preferences (§8), and by indicating directions for future research (§10). Appendices are provided for readers interested in the details of the mathematics underpinning our graphical tools and hypothesis tests.
2. Overview of Harmony and Similar Systems
In the vowel harmony systems attested in language families as diverse as Bantu and Uralic, such vowel characteristics as roundness, backness, ATR, and height are found to be dependent upon characteristics of other vowels within the same word or phrase. In Turkish, for example, where there are front (e, é, i, í) and back (y, a, o, u) vowels, words with front vowels get front vowel suffixes, while those with back vowels get variants containing back vowels (this admittedly oversimplified account of Turkish vowel harmony is included here for purposes of illustration only), as the following data illustrate: (1) kéz de kar da
hand in arm in ‘in the hand’ ‘in the arm’
* Thanks to Steve Wong and Phil Everson for information on statistics and to Will Quale and Robbie Hart for technical assistance.

2
Several minor Philippine languages exhibit a pattern that is similar to vowel harmony in that it determines the phonotactic relationship between the characteristics of vowels in adjacent syllables. We shall call this SONORITY CONTOUR PREFERENCE since, as will be discussed in §3, it is sonority, or the resonance of a speech sound in relation to other sounds, 1 that appears to be relevant.
3. The Phenomenon in Question
First brought to our attention by field anthropologist Harold Conklin, the phenomenon— present in languages like Kagayanen and the dialects of Ifugao—involves an apparent preference for rising vowel sonority within a word. Low vowels (such as o) are higher on the sonority hierarchy than high vowels (such as u), and these languages tend to prefer a hightolow height contour within a word. Following a remark by anthropologist Conklin to the effect that “a general tendency is observed in central Philippine languages, whereby sequences such as [uCo] are less marked than sequences such as [oCu],” the phenomenon was investigated in the following way. Mr. Būwaya Tindūgan, a native speaker of Baynīnan Ifugao (a dialect for which we were unfortunately unable to acquire a corpus to analyze) was asked to generate lists of words containing various vowel sequences. While for most combinations he easily thought of numerous words, stopping only after writing down 15 or 20, for others the informant found few examples, and these with difficulty. For some requested sequences, for example, the only words Mr. Tindūgan could provide were morphologically complex forms or proper names. The former were ultimately excluded from the count, yielding the matrix (Table 1 below) of vowel cooccurrence for a corpus of 291 lexemes. The values displayed are the percentage of the total words elicited that fell into the cooccurrence category in question. Note that in each of the four cases in which the native speaker was unable to provide suitable example words (see the highlighted boxes), the second vowel in the pair has lower sonority than the first. (That a appears nowhere in the matrix is due to the facts that (1) the vowel was presumed neutral, and (2) very high numbers of combinations involving [a] can easily be found; for more on this assumption, see footnote 4.)
Table 1. Percent of vowel pair combinations in Baynīnan Ifugao (Conklin et al, 2001)
1 st syllable vowel i u e o i 9.7% 5.7% 5.4% 6.1% u 8.6% 17.2% 5.7% 8.2% e 1.0% 0% 10.0% 5.7% o 0% 0% 5.7% 10.8%
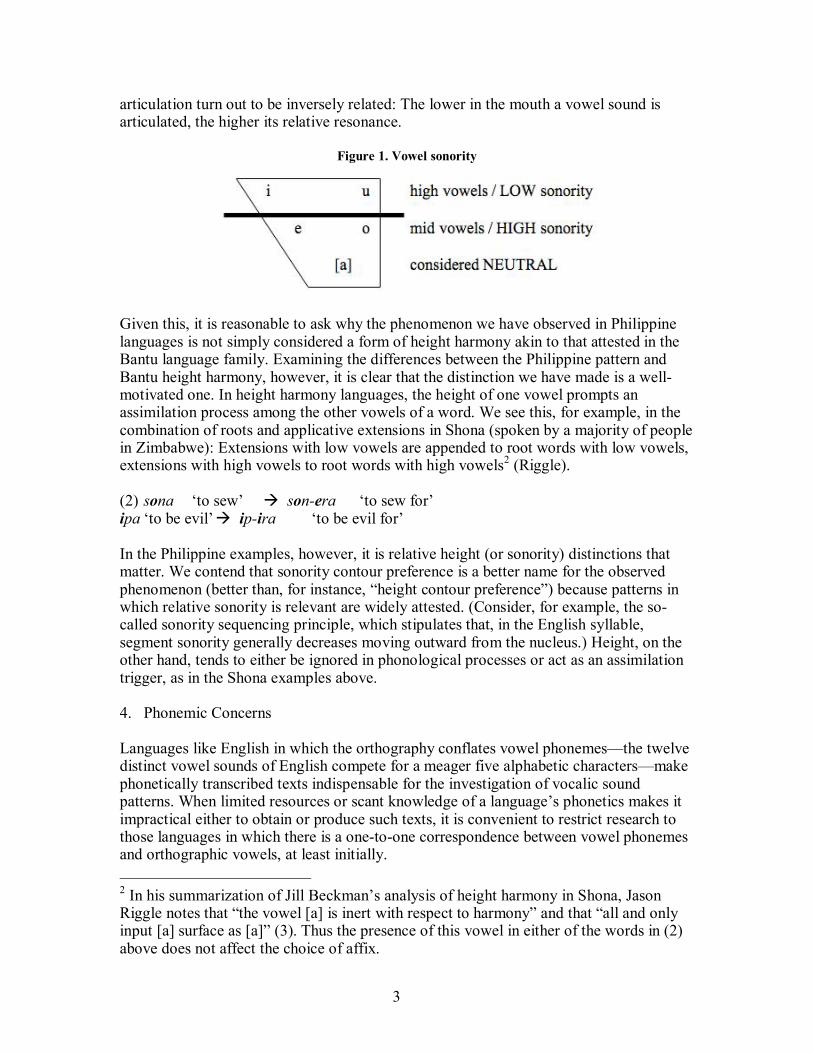
It is interesting to note that in a typical fivevowel system, sonority distinctions divide the vowel space along the same lines as height does. As hinted above, sonority and place of
1 The nature of sonority is in somewhat controversial. While many linguists characterize it as relative resonance, others contend that it is an undefined primitive, or even that it does not exist at all. We here subscribe to the resonance definition.
2 nd syllable vowel
3
articulation turn out to be inversely related: The lower in the mouth a vowel sound is articulated, the higher its relative resonance.
Figure 1. Vowel sonority
Given this, it is reasonable to ask why the phenomenon we have observed in Philippine languages is not simply considered a form of height harmony akin to that attested in the Bantu language family. Examining the differences between the Philippine pattern and Bantu height harmony, however, it is clear that the distinction we have made is a well motivated one. In height harmony languages, the height of one vowel prompts an assimilation process among the other vowels of a word. We see this, for example, in the combination of roots and applicative extensions in Shona (spoken by a majority of people in Zimbabwe): Extensions with low vowels are appended to root words with low vowels, extensions with high vowels to root words with high vowels 2 (Riggle).
(2) sona ‘to sew’ à sonera ‘to sew for’ ipa ‘to be evil’à ipira ‘to be evil for’
In the Philippine examples, however, it is relative height (or sonority) distinctions that matter. We contend that sonority contour preference is a better name for the observed phenomenon (better than, for instance, “height contour preference”) because patterns in which relative sonority is relevant are widely attested. (Consider, for example, the so called sonority sequencing principle, which stipulates that, in the English syllable, segment sonority generally decreases moving outward from the nucleus.) Height, on the other hand, tends to either be ignored in phonological processes or act as an assimilation trigger, as in the Shona examples above.
4. Phonemic Concerns
Languages like English in which the orthography conflates vowel phonemes—the twelve distinct vowel sounds of English compete for a meager five alphabetic characters—make phonetically transcribed texts indispensable for the investigation of vocalic sound patterns. When limited resources or scant knowledge of a language’s phonetics makes it impractical either to obtain or produce such texts, it is convenient to restrict research to those languages in which there is a onetoone correspondence between vowel phonemes and orthographic vowels, at least initially.
2 In his summarization of Jill Beckman’s analysis of height harmony in Shona, Jason Riggle notes that “the vowel [a] is inert with respect to harmony” and that “all and only input [a] surface as [a]” (3). Thus the presence of this vowel in either of the words in (2) above does not affect the choice of affix.

4
Thus, in seeking confirmation of a suspected but yet unattested vowel pattern in Philippine languages, we chose languages of this type. The principal dialects of Ifugao, which form the focus of our study, have, for example, fivevowel systems orthographically represented in readily available online texts by the familiar a, e, i, o, and u. While some accounts of Batad Ifugao cite a mid closed central vowel, lexicographer Leonard Newell (1970) describes the contrast between it and a as “difficult to hear if, in fact, it exists.” This, combined with the fact that the closely related Amganad, Bayninan, and Gohang dialects have straightforward fivevowel systems (Reid, 1971), led us to proceed assuming that there are only five vowels in Batad as well. Although in all cases we attempted to ascertain the phoneticsorthography correspondence of the language being considered as a candidate for study, assumptions similar to the one hazarded for Batad underlie much of our research.
5. Data Collection
To gauge whether sonority contour preference exists at a perceptible level in Philippine languages besides the Baynīnan Ifugao studied by Conklin, we assembled electronic corpora, averaging around 5000 words and taken mainly from Bible translations, newsletters and poetry forums obtained via the internet, as well as lexical corpora from dictionary headwords. Corpus cleanup involved deletion of punctuation, replacement of capitalized vowels by their lowercase counterparts, and additional reformatting necessary for compatibility with the computer script used for data extraction (accessible from http://penguin.pearson.swarthmore.edu/~vharmony/index.html). In extreme cases frequently occurring words obviously of foreign origin (Jesus, for example, which has a falling sonority contour of the type hypothesized to be dispreferred) were removed from the corpus before proceeding. With the aid of a frequency and co occurrence calculator, we tabulated vowel frequency and generated a cooccurrence matrix. We then set about looking for a means of representing the data graphically in such a way that any pattern would be readily apparent.
6. Graphical Representations
In order to get a handle on a language’s general sonority contour preference, we first examined only the vowel pairs with variable sonority, dividing them into two categories. Since we classed e and o as high sonority vowels, i and u as low sonority, and a as NEUTRAL 3 , the pairs ie, io, ue, and uo are rising sonority while ei, eu, oi, and ou are falling. Dividing the number of pairs exhibiting one sonority pattern by the total number of pairs under consideration, we made a twobar bar graph showing the relative frequencies of rising and falling sonority sequences. Note that for every pair in the rising class (for example, ie), there is a MIRRORIMAGE PAIR (in this case, ei) in the falling class. Although the relative frequencies of the vowels in a
3 In vowel harmony systems, it is common to find “neutral” vowels that play no part in the harmony system. There is strong evidence that a is neutral in the languages under consideration here. When a is included as a low vowel in the corpus calculations, some languages exhibit sonority contour patterns. When a is considered neutral, all patterns become markedly more striking. A sound with such a strong dilution effect is likely freely combining with all other sounds, which is the very definition of a neutral vowel.

5
given language will of course have an effect on the number of each type of pair we expect to find in a corpus, we obviate the need for a calibration for vowel frequency by exploiting the existence of these mirrorimage pairs. Assuming no sonority pattern, two vowels are equally likely to occur in either order. Since the mirrorimage of every rising pair is a member of the falling set, we would expect the total number of pairs in the rising class to be about the same as the number of pairs in the falling class if no preference existed in the language. Given this expectation, a mere glance at a graph such as those we generated suffices to determine whether or not the language in question warrants further investigation. Two bars hovering around the fiftypercent mark (as in Figure 2 below) discourage further examination, while a sizable differential in bar height (see Figure 3) identifies the language as a promising exemplar of the pattern of interest. Although eyeballing the difference in bar height should not generally be exclusively relied upon to assess the strength of a pattern, the results of the statistical tests performed (see §9 below) not only take corpus size into consideration, but indicate that with such large sample sizes, qualitative judgments are not imprudent. The reader interested in a more concrete and transparent treatment of our path from raw data to graphical representation is referred to Appendix A.
Figure 2. Comparison of rising and falling sonority contours in Isneg
Isneg
0
0.1
0.2
0.3
0.4
0.5
0.6
0.7
0.8
0.9
1
rising falling
percent of vowel pairs
Figure 3. Comparison of rising and falling sonority contours in Kagayanen

6
Kagayanen
0
0.1
0.2
0.3
0.4
0.5
0.6
0.7
0.8
0.9
1
rising falling
percent of vowel pairs
While the twobar graph described and depicted above can give us a rough idea of the extent to which a language is likely to be relevant to our study, the need to consider the position of level sonority in any emerging sonorityrelated preference pattern—might not a language not only favor rising sonority, but also prefer level to falling?—motivated the formulation of a more finegrained graphical tool. This time considering all vowel pairs, we defined three sonority contours: rising (LH), falling (HL), level (HH) or (LL). Since all pairs are considered this time, we can no longer count on the abovementioned mirror image pairs to account for frequency. Instead, we calculated the number of pairs one would expect to find in each of our four classes if the language showed no sonority sensitive preferences. These calculations were based on the frequencies of high and low sonority vowels in the corpus. We then generated a paired bar graph displaying the actual and expected percentages adjacent to each other, thus allowing for quick comparison. A large difference between actual and expected bars for any sonority category signals the existence of a noteworthy pattern. Figures 46 are representative of the paired bar graphs obtained via the process spelled out in Appendix A.
Figure 4. Comparison of actual to expected sonority contour frequency in Amganad Ifugao

7
Amganad Ifugao exhibits a strong preference for rising sonority, but seems to prefer level sonority to falling.
0
0.1
0.2
0.3
0.4
0.5
0.6
0.7
0.8
0.9
1
rising falling level Sonority Contour Type
Percen
t
expected actual
Figure 5. Comparison of actual to expected sonority contour frequency in Mayoyao Ifugao
Mayoyao Ifugao, on the other hand, exhibits a strong preference for level sonority, also prefering rising sonority to falling.
0
0.1
0.2
0.3
0.4
0.5
0.6
0.7
0.8
0.9
1
rising falling level Sonority Contour Type
Percen
t
expected actual

8
Figure 6. Comparison of actual to expected sonority contour frequency in Kalanguya
Kalanguya has no predominant sonority contour pattern.
0
0.1
0.2
0.3
0.4
0.5
0.6
0.7
0.8
0.9
1
rising falling level Sonority Contour Type
Percen
t
expected actual
7. Number of Syllables
The difficulty in deciding which and how many syllables of each word to consider when investigating sonority contours hinges upon a problem of VARIABLE INDEPENDENCE. In order to perform statistical tests legitimately on a dataset, it must be the case that the data points are independent, that is, that information about one data point imparts no knowledge of any other. Clearly this is not true if we are considering a threesyllable word like ituwen (Amganad Ifugao). This word yields two vowel pairs, iu and ue, which, since the second vowel in the word occurs in both, fail to be independent of each other. For an idea of how the original method of vowel pair extraction might obscure notable features of a language, consider a word with three vowels, a low sonority one followed by two high sonority ones. If this pattern were the predominant one among three syllable words in a language, we would probably consider the language to have a rising sonority pattern. Since we posit only two sonority levels, it makes sense for a threesyllable word in a rising contour language to exhibit the pattern LHH. A corpus containing a large number of such words, however, would skew our count, suggesting that level and rising sonority are equally common. A more discriminating tool intended to search for a specific contour pattern would eliminate this problem, but as the authors do not count computer programming among their collective experience, that task is left open for further research.
Using the available tools, however, we can examine the general form of the sonority contour pattern in a given language by comparing the (potentially overlapping) pairs taken from whole words to the pairs taken from only the first two syllables of each word. While there are many factors in a language that might affect the distribution of vowels within the first two syllables, a language that exhibits a strong sonority contour pattern

9
when all pairs and when only the first vowel pair of each word are considered can be safely deemed to have a robust sonority contour system throughout. Most languages with noticeably large contour patterns in all pairs continue to have significant patterns among only the first vowel pairs. Interestingly, however, Philippine languages that have a minimal or nonexistent pattern among all pairs seem to demonstrate a falling pattern when only the first pair of vowels is considered. This phenomenon is likely the result of the morphology of these languages. Of the seven Philippine languages listed in The World Atlas of Linguistic Structures, all but one show either little affixation or a preference for prefixing (Haspelmath et al. 2005). If a language had one or several common prefixes containing high sonority vowels, the first vowel pair of any word combined with that prefix would exhibit either a falling or level contour. Since most of the corpora we examined are text corpora likely containing widespread affixing, limiting our study to the first two syllables runs the risk of altering or obfuscating any pattern that exists in the language at large. Further knowledge of languagespecific morphology is necessary to assess the acuteness of this problem.
In some cases, the statistical significance of the predominant sonority contour pattern in a language changes when only the first two vowels are examined. In most cases, the deviation from an expected 5050 breakdown is weaker for the first two syllables than for the whole word. This dilution is likely a result of the smaller corpus size produced by removing all syllables after the second, as well as morphological idiosyncrasies such as those discussed above.
8. Language Categorization
The languages we observed appear to fall into three categories: languages with a weak or nonexistent sonority contour pattern, languages preferring a rising sonority contour, and languages preferring a level sonority contour. Isneg, Itawit, and Kalanguya do not demonstrate any strong sonority pattern. Kagayanen, Pampango, Ilocano and the Amganad and Tuwali dialects of Ifugao prefer rising sonority to level sonority, which is in turn preferred to falling sonority. The Batad and Mayoyao dialects of Ifugao exhibit the third pattern, preferring level sonority to either variety of variable sonority. Our results are summarized in the tables below. Corpus size is included for reference.
Table 2. Sonority contour preference summary (extracted from the first graphical representation)
Language Pattern (syllables 1&2) Corpus Size (number of words)
Amganad Ifugao Strong Rising 2,255 Batad Ifugao (lexical corpus) Strong Rising 2,170 Batad Ifugao (text corpus) Strong Rising 979 Mayoyao Ifugao Strong Rising 3,473 Tuwali Ifugao Strong Rising 1,582 Ilocano Strong Rising 19,223 Isneg Weak Rising 1,012 Itawit Weak Rising 2.048

10
Kagayanen Strong Rising 4,403 Kalanguya Weak Falling 1,613 Pampango Strong Rising 22,198
Table 3. Preference type for strong patterns (extracted from second graphical representation)
Language Rising Level
Ifugao, Amganad X Ifugao, Batad (text corpus) X Ifugao, Batad (lexical corpus) X Ifugao, Mayoyao X Ifugao, Tuwali X Ilocano X Kagayanen X Pampango X
9. Statistics
To see how to determine whether the observed differences between the number of vowel pairs with rising sonority and the number with falling sonority are statistically significant, it is helpful to draw an analogy to the assessment of the fairness of a coin. An unweighted coin should come up heads fifty percent of the time and tails fifty percent of the time. Similarly, a language oblivious to sonority patterns should have equal numbers of rising and falling sonority contours, because of the mirrorimage pair phenomenon discussed above. Related questions can be asked about the two: If one flips a coin ten times and gets eight tails, is there reason to believe it weighted? If 553 of 977 vowel pairs show falling sonority, while 424 show rising, may one conclude that the language at hand prefers the former? To answer such a question, we perform a oneproportion Ztest, arbitrarily designating a rising sonority contour as a “success” (analogous to heads) and determining how dramatically the proportion of sample successes deviates—in either direction—from the fifty percent benchmark. Our results varied widely: Differences of the magnitude observed in our Isneg corpus could be expected to occur in approximately 11% of comparably sized samples by chance alone even if the language had a fiftyfifty split among mirrorimage pairs. The pvalue (‘p’ for probability) of 2.490x10 31 for Kagayanen, however, is miniscule enough to allow us to reject the null hypothesis (that no sonority preference of the type under examination exists) and conclude that a pattern exists.
Although cases like Kagayanen and Isneg are clearcut—the former language prefers rising sonority to falling, while the latter does not necessarily distinguish between the two—the demarcation of a significance threshold is at this point arbitrary at best. In order to draw a principled dividing line between languages that do and do not exhibit the sonority contour preference, it would be necessary to assemble corpora in a wide variety

11
of languages, run the corpora through our diagnostic tool, and compare the results with those for the Philippine languages under consideration. For now, the pvalues in the table below allow us to draw conclusions about the relative strength of the preference in the languages studied so far. We can say with confidence, for example, that Amganad exhibits the pattern to a greater extent than the related dialect Batad. (For a stepbystep explanation of how the pvalues below were obtained, see Appendix B.)
Table 4. Pvalue calculations
Language # of “successes” total number of pairs pvalue Amganad Ifugao 119 126 1.945x10 23 Batad Ifugao (lexical) 95 103 1.026x10 17 Batad Ifugao (text) 35 35 3.308x10 9 Ilocano 627 886 4.271x10 35 Isneg 40 67 .112 Itawit 48 72 .005 Kagayanen 230 269 2.490x10 31 Kalanguya 70 169 .026 Mayoyao Ifugao 140 182 3.779x10 13 Pampango 3094 7221 5.400x10 34 Tuwali Ifugao 86 99 2.205x10 13
It is impossible to discuss statistics without considering what sort of a threshold we ought to set in order to claim that a language has an observable pattern. Statistics are important to language acquisition as well as processing. How prevalent does a pattern need to be in order for a child to acquire it? How much does the number of vowel pairs exhibiting a rising sonority contour have to exceed the number exhibiting a falling contour for speakers’ brains to register and take advantage of the preference? Since the value of higher processing speed and efficiency exists only if the pattern is perceptible to the learner, determining this critical value is of definite interest. While quantifying the differences between the various observed and expected counts represented on our paired bar graph would most likely involve a variation of the classical chisquare test, the authors are illequipped to perform the statistical analysis necessary.
The null hypothesis in a classical chisquare test is that the row and column classifications are independent, or in this case that the sonority of the initial vowel of a pair is not predictive of the sonority of the second. To see the potential implications of a dependence between the vowels in a pair in the domain of language processing, consider the following syntactosemantic example from English. As soon as, in everyday interaction, the words “the red…” escape a conversant’s mouth, the listener can begin narrowing down the possibilities for the word to follow. Chances are that it will not only be a noun (syntax), but also something like “apple” or “car” rather than “water” or “sheep” (semantics). This reasonable (if nebulous) expectation of what will come next allows the listener to not only process the linguistic input more efficiently, but also better cope with signal degradation caused by background noise or hearing difficulties. Similarly, in a language where falling sonority is dispreferred, the utterance of a high sonority vowel effectively narrows the possibilities for the subsequent one: It will likely also be high.
12
10. Conclusions
Relationships between vowels are well attested, as evidenced by the prevalence of vowel harmony in Altaic and Bantu languages. It is not, therefore, particularly surprising to discover patterns of vowel sonority in families of languages. Given the apparent ubiquity of sonority contour preferences in languages of the Austronesian family, it is reasonable to expect the examination of other language families to produce unexpected patterns of sonority as well. That such a pattern has not yet been reported in other languages is perhaps due in part to the tendency of descriptive phonology to focus on dynamic alternations rather than static cooccurrence patterns among vowels.
Although more discriminating and rigorous statistical methods are necessary to continue to probe the phenomenon we have here termed sonority contour preference, the tools described in the foregoing are diagnostically useful. Given a language— Austronesian or otherwise—the raw numbers contained in a vowel frequency and co occurrence matrix can, in combination with our graphical tools, give a reasonable indication of whether or not further research is warranted. If the proportion of variable sonority pairs exhibiting a rising pattern differs significantly from fifty percent—a fact that can be determined by examination of the twobar bar graph and subsequent application of the oneproportion Ztest—we conclude that the language prefers one sonority contour to the other. Plugging the numbers into the second graphical tool gives the researcher, even without the rigor imparted by appropriate statistical tests, some conception of contour preference rankings within the language in question. Examination of the paired bar graph, for example, might lead to the conclusion that while a language shows a slight preference for rising sonority over falling sonority, the predominant contour is the level one, perhaps indicating that the language has a traditional height harmony system after all. We note that the redundancy in our tools makes the first dispensable given suitable statistical underpinnings for the second.
Further investigation of this phenomenon would, as frequently noted in the text of this paper, benefit greatly from indepth knowledge of the particular language’s phonological and morphological processes. We hope that a linguist, armed with such information—and perhaps some statistical savvy and programming ability—will use the above as a springboard to bigger and better things.
13
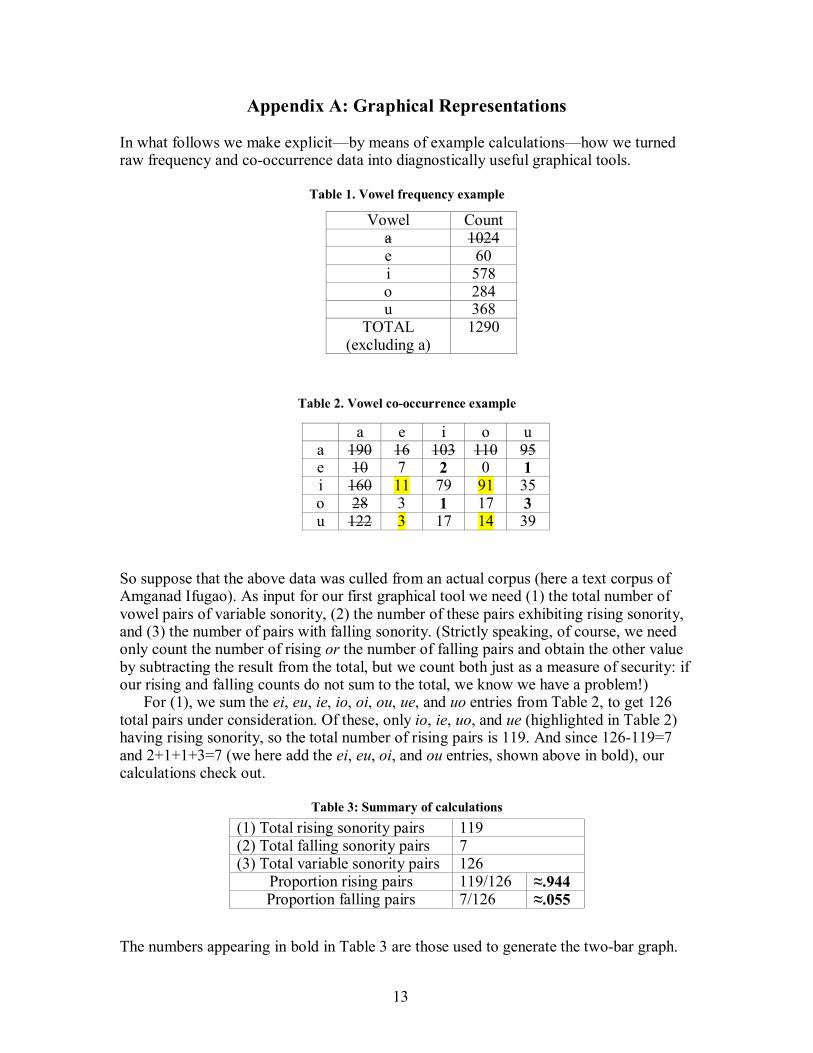
Appendix A: Graphical Representations
In what follows we make explicit—by means of example calculations—how we turned raw frequency and cooccurrence data into diagnostically useful graphical tools.
Table 1. Vowel frequency example
Table 2. Vowel cooccurrence example
So suppose that the above data was culled from an actual corpus (here a text corpus of Amganad Ifugao). As input for our first graphical tool we need (1) the total number of vowel pairs of variable sonority, (2) the number of these pairs exhibiting rising sonority, and (3) the number of pairs with falling sonority. (Strictly speaking, of course, we need only count the number of rising or the number of falling pairs and obtain the other value by subtracting the result from the total, but we count both just as a measure of security: if our rising and falling counts do not sum to the total, we know we have a problem!)
For (1), we sum the ei, eu, ie, io, oi, ou, ue, and uo entries from Table 2, to get 126 total pairs under consideration. Of these, only io, ie, uo, and ue (highlighted in Table 2) having rising sonority, so the total number of rising pairs is 119. And since 126119=7 and 2+1+1+3=7 (we here add the ei, eu, oi, and ou entries, shown above in bold), our calculations check out.
Table 3: Summary of calculations
The numbers appearing in bold in Table 3 are those used to generate the twobar graph.
Vowel Count a 1024 e 60 i 578 o 284 u 368
TOTAL (excluding a)
1290
a e i o u a 190 16 103 110 95 e 10 7 2 0 1 i 160 11 79 91 35 o 28 3 1 17 3 u 122 3 17 14 39
(1) Total rising sonority pairs 119 (2) Total falling sonority pairs 7 (3) Total variable sonority pairs 126
Proportion rising pairs 119/126 ≈.944 Proportion falling pairs 7/126 ≈.055

14
For our second graphical tool, it is first necessary to determine the proportion of high and low sonority vowels in the corpus in question.
Table 4. Calculation of frequency of each sonority level
Number of high sonority vowels (e+o) 60+284 344 Number of low sonority vowels (i+u) 578+368 946 Proportion high sonority vowels (high/total) 344/1290 ≈.266 Proportion low sonority vowels (low/total) 946/1290 ≈.733
We next use the abovecalculated proportions to determine the percentages of rising and falling vowel pairs we would expect if the language in question had no sonority contour preferences.
Table 5. Calculation of expected contour frequency
Sonority Contour Form of pair Probability ≈ Rising VlowVhigh (.733)(.266) .196 Falling VhighVlow (.266)(.733) .196 Level VhighVhigh + VlowVlow (.266)(.266)+(.733)(.733) .071
To calculate the actual values to which these expected values will be compared on the paired bar graph, we must first recount the number of vowel pairs under consideration, recalling that while we earlier dealt only with pairs displaying variable sonority, we are here concerned with level as well. Reexamination of Table 2 gives a total of 323 pairs (since we count a as neutral, we exclude all pairs including it either as first or second constituent).
Table 6. Calculation of actual contour frequency
Sonority Contour Count Proportion ≈ Rising 119 119/323 .368 Falling 7 7/323 .022 Level 197 197/323 .610
The paired bar graph represents visually the contrast between the values appearing in the rightmost columns of Tables 5 and 6.

15
Appendix B: Statistical Tests
If the language in question observes no sonority contour preferences of the type here under consideration, we would expect the number of rising sonority vowel pairs to roughly equal the number of falling pairs: we would expect, in other words, a 50/50 split. We thus want to test the null hypothesis H0: p=0.5, where p is the proportion of total vowel pairs that exhibit a rising sonority contour. (The decision to look at rising pairs is arbitrary; we could just as easily have focused on falling ones.)
Now which hypothesis test is used depends on the magnitude of our sample size n, the rule of thumb being that if
0 < n( 1 2 )− 3 n( 1
2 )(1− 1
2 ) < n( 1
2 ) + 3 n( 1
2 )(1− 1
2 ) < n ,
we perform a “largesample” test based on an appropriate Z ratio. (Note that, in general,
the 1 2 ’s in the above expression can be replaced by whatever proportion is of particular
interest.) Evaluating the above for n=126 (the number of vowel pairs under consideration in the first set of calculation laid out Appendix A) yields
0 < 126( 1 2 )− 3 126( 1
2 )(1− 1
2 ) <126( 1
2 ) + 3 126( 1
2 )(1− 1
2 ) < 126 , or
0 < 46.1625... < 79.8374... < 126 , which is a true inequality. Hence it is indeed the “largesample” test that is appropriate here.
The next decision to be made concerns our socalled alternate hypothesis, H1. That is, do we want to test the null hypothesis H0: p=0.5 against H1: p>0.5, H1: p<0.5, or H1: p≠0.5? Do we care only whether the proportion of variable sonority vowel pairs with a rising contour exceeds 0.5, only whether it is less than half, or are we interested in any sizable departure from the 50/50 split, regardless of direction? Since the last of these is the case, we choose H1: p≠0.5 as our alternate hypothesis and, in so doing, commit ourselves to a twotailed test. We seek to determine the probability of obtaining a result at least as extreme as we did in either direction if the reality is that vowel pairs with rising
sonority comprise half of the total. Our teststatistic is Z = x − n(
1 2 )
n( 1 2 )(1− 1
2 ) , where n is the
sample size and x the number of “successes” (here vowel pairs exhibiting rising sonority).
Evaluation yields Z = 119 −126(
1 2 )
126( 1 2 )(1− 1
2 )
≈ 9.978 , so the Pvalue or probability we’re after
is P(Z≤9.978) + P(Z≥9.978) = 2(P(Z≤9.978)). Consultation of a table of standard normal probabilities (or, more likely, given the size of the Z involved, use of a preprogrammed computer or calculator function) indicates that P≈1.945x10 23 . It is thus extremely
unlikely to get a sample proportion like 119 126 by chance when the true proportion is 50%.

16
Corpus Material
Corpora were assembled from texts available at the following sites, Spring 2005: http://www.seghea.com/pat/bible/pampango.html [Pampango Bible translation] http://cogweb.ucla.edu/Discourse/Proverbs/Ilocano.html [Ilocano proverbs and sayings] http://www.discoveronline.org/ilocano/ilocan01.htm [Ilocano Bible guide] http://iloko.tripod.com/songs.html [Ilocano songs] http://www.jesuswho.org/ilocano/whois.htm http://www.medjugorje.org/olmmsgil.htm http://iloko.tripod.com/Ilocano.html http://www.iluko.com/article.asp?Id=364 http://www.seghea.com/pat/bible/isnag.html [Isneg Bible translation] http://www.seghea.com/pat/bible/aifugao.html [Amganad Bible translation] http://www.christusrex.org/www1/pater/JPNifugaoamganad.html http://acountryofourown.com/Romans.html http://www.christusrex.org/www1/pater/JPNifugaobatad.html http://www.seghea.com/pat/bible/bifugao.html http://maxpages.com/poecia4/poecia12
We also thank Scott MacGregor and Anne West of SIL for furnishing us with additional texts, and Barbara Hodder (also of SIL) for donating her Mayoyao Ifugao corpus.

17
References
Conklin, Harold, Būwaya Tindūgan and K. David Harrison. 2001. Unpublished field notes. Haspelmath, Martin, Dryer, Matthew, Gil, David and Comrie, Bernard, eds. 2005. The World Atlas of Language Structures. Oxford: Oxford University Press. Newell, Leonard E. 1970. Phonology of Batad Ifugao. Philippine Journal of Linguistics 1.1. 101117. Linguistic Society of the Philippines. Reid, Lawrence A. 1971. Philippine minor Languages: Word lists and phonologies. University of Hawai'i Press. Riggle, Jason. Relational Markedness in Bantu Vowel Height Harmony. Available at http://humfs1.uchicago.edu/~jriggle/pasc99.pdf.

The preceding document was presented at the Tenth International Conference on Austronesian Linguistics (10ICAL). To properly reference this work, please use the following format:
<LastName>, <FirstName>. 2006. <PaperTitle>. Paper presented at Tenth International Conference on Austronesian Linguistics. 1720 January 2006. Puerto Princesa City, Palawan, Philippines. http://www.sil.org/asia/philippines/ical/papers.html
For other papers that were presented at 10ICAL, please visit http://www.sil.org/asia/philippines/ical/papers.html.