SonicWALL ViewPoint 5.0 Admin Guide
289
SonicWALL ViewPoint 5.0 Administrator’s Guide REPORTING SonicWALL ViewPoint SonicWALL Reporting Solutions
Transcript of SonicWALL ViewPoint 5.0 Admin Guide

SonicWALL ViewPoint 5.0Administrator’s Guide
REPORTING SonicWALL ViewPoint
SonicWALLReporting Solutions

SonicWALL ViewPoint GuideVersion 5.0
SonicWALL, Inc.1143 Borregas AvenueSunnyvale, CA 94089-1306Phone: +1.408.745.9600Fax: +1.408.745.9300E-mail: [email protected]

Copyright Notice© 2008 SonicWALL, Inc.All rights reserved.Under the copyright laws, this manual or the software described within, can not be copied, in whole or part, without the written consent of the manufacturer, except in the normal use of the software to make a backup copy. The same proprietary and copyright notices must be affixed to any permitted copies as were affixed to the original. This exception does not allow copies to be made for others, whether or not sold, but all of the material purchased (with all backup copies) can be sold, given, or loaned to another person. Under the law, copying includes translating into another language or format.Specifications and descriptions subject to change without notice.
TrademarksSonicWALL is a registered trademark of SonicWALL, Inc. Microsoft Windows 98, Windows NT, Windows 2000, Windows XP, Windows Vista, Windows Server 2003, Internet Explorer, and Active Directory are trademarks or registered trademarks of Microsoft Corporation.Firefox is a trademark of the Mozilla Foundation.Netscape is a registered trademark of Netscape Communications Corporation in the U.S. and other countries. Netscape Navigator and Netscape Communicator are also trademarks of Netscape Communications Corporation and may be registered outside the U.S.Adobe, Acrobat, and Acrobat Reader are either registered trademarks or trademarks of Adobe Systems Incorporated in the U.S. and/or other countries.Other product and company names mentioned herein may be trademarks and/or registered trademarks of their respective companies and are the sole property of their respective manufacturers.
SonicWALL GPL Source Code
GNU General Public License (GPL)SonicWALL will provide a machine-readable copy of the GPL open source on a CD. To obtain a complete machine-readable copy, please send your written request, along with a certified check or money order in the amount of US $25.00 payable to “SonicWALL, Inc.” to: General Public License Source Code Request SonicWALL, Inc. Attn: Jennifer Anderson 1143 Borregas Ave Sunnyvale, CA 94089

Limited WarrantySonicWALL, Inc. warrants that commencing from the delivery date to Customer (but in any case commencing not more than ninety (90) days after the original shipment by SonicWALL), and continuing for a period of twelve (12) months, that the product will be free from defects in materials and workmanship under normal use. This Limited Warranty is not transferable and applies only to the original end user of the product. SonicWALL and its suppliers' entire liability and Customer's sole and exclusive remedy under this limited warranty will be shipment of a replacement product. At SonicWALL's discretion the replacement product may be of equal or greater functionality and may be of either new or like-new quality. SonicWALL's obligations under this warranty are contingent upon the return of the defective product according to the terms of SonicWALL's then-current Support Services policies. This warranty does not apply if the product has been subjected to abnormal electrical stress, damaged by accident, abuse, misuse or misapplication, or has been modified without the written permission of SonicWALL. DISCLAIMER OF WARRANTY. EXCEPT AS SPECIFIED IN THIS WARRANTY, ALL EXPRESS OR IMPLIED CONDITIONS, REPRESENTATIONS, AND WARRANTIES INCLUDING, WITHOUT LIMITATION, ANY IMPLIED WARRANTY OR CONDITION OF MERCHANTABILITY, FITNESS FOR A PARTICULAR PURPOSE, NONINFRINGEMENT, SATISFACTORY QUALITY OR ARISING FROM A COURSE OF DEALING, LAW, USAGE, OR TRADE PRACTICE, ARE HEREBY EXCLUDED TO THE MAXIMUM EXTENT ALLOWED BY APPLICABLE LAW. TO THE EXTENT AN IMPLIED WARRANTY CANNOT BE EXCLUDED, SUCH WARRANTY IS LIMITED IN DURATION TO THE WARRANTY PERIOD. BECAUSE SOME STATES OR JURISDICTIONS DO NOT ALLOW LIMITATIONS ON HOW LONG AN IMPLIED WARRANTY LASTS, THE ABOVE LIMITATION MAY NOT APPLY TO YOU. THIS WARRANTY GIVES YOU SPECIFIC LEGAL RIGHTS, AND YOU MAY ALSO HAVE OTHER RIGHTS WHICH VARY FROM JURISDICTION TO JURISDICTION. This disclaimer and exclusion shall apply even if the express warranty set forth above fails of its essential purpose.DISCLAIMER OF LIABILITY. SONICWALL'S SOLE LIABILITY IS THE SHIPMENT OF A REPLACEMENT PRODUCT AS DESCRIBED IN THE ABOVE LIMITED WARRANTY. IN NO EVENT SHALL SONICWALL OR ITS SUPPLIERS BE LIABLE FOR ANY DAMAGES WHATSOEVER, INCLUDING, WITHOUT LIMITATION, DAMAGES FOR LOSS OF PROFITS, BUSINESS INTERRUPTION, LOSS OF INFORMATION, OR OTHER PECUNIARY LOSS ARISING OUT OF THE USE OR INABILITY TO USE THE PRODUCT, OR FOR SPECIAL, INDIRECT, CONSEQUENTIAL, INCIDENTAL, OR PUNITIVE DAMAGES HOWEVER CAUSED AND REGARDLESS OF THE THEORY OF LIABILITY ARISING OUT OF THE USE OF OR INABILITY TO USE HARDWARE OR SOFTWARE EVEN IF SONICWALL OR ITS SUPPLIERS HAVE BEEN ADVISED OF THE POSSIBILITY OF SUCH DAMAGES. In no event shall SonicWALL or its suppliers' liability to Customer, whether in contract, tort (including negligence), or otherwise, exceed the price paid by Customer. The foregoing limitations shall apply even if the above-stated warranty fails of its essential purpose. BECAUSE SOME STATES OR JURISDICTIONS DO NOT ALLOW LIMITATION OR EXCLUSION OF CONSEQUENTIAL OR INCIDENTAL DAMAGES, THE ABOVE LIMITATION MAY NOT APPLY TO YOU.

Contributing SonicWALL ViewPoint ExpertsPrasad Bevra works as Director of Software Engineering for SonicWALL. He is responsible for directing development of products in the areas of centralized remote management, reporting, and monitoring, including the award-winning SonicWALL GMS and ViewPoint products. Prior to SonicWALL, Bevra worked with Xerox and ScanSoft Corporations, where he has a patent in the area of User Interfaces. He has a B.S. degree in Computer Science from the Indian Institute of Technology, Bombay, and a Master’s degree in Computer Science from the University of Iowa.
Jean-Marc Catalaa, SonicWALL Curriculum Developer, holds a B.S. in Electrical Engineering from San Jose State University. Catalaa worked for 5 years as an ASIC designer before moving to Proxim, where he was a Systems Engineer and a developer of the company’s Wireless Technical Certification Program. Catalaa has written numerous technical documents and developed curriculum on topics including multi-processor architecture, networking, and wireless communications. He has taught over 40 classes about wireless communication in English, Spanish, Portuguese and Italian, adjusting his training style for worldwide audiences.
Jon Kuhn, who works in SonicWALL Product Management, has over 12 years of technology consulting and product management experience. Kuhn oversees product management and marketing for a number of product lines at SonicWALL. Prior to SonicWALL, he was a consultant to various companies, including GTE Internetworking, Johnson/Johnson and CIBER Inc. Kuhn has expertise and certifications in multi-level security design, highly redundant networking technology, application architecture, and security policy definition. He attended University of California, Los Angeles and graduated from Santa Clara University in the San Francisco bay area with a degree in Business Administration with emphasis in Computer Science.
Joe Levy has worked in the networking and network security industry for over a decade. Joe has been with SonicWALL for six years in a number of critical and company-defining roles. In November 2006, he was appointed Chief Technology Officer. In this role, he is responsible for creating and communicating SonicWALL’s technical vision. Joe was previously Senior Director of Software Engineering for the Product Architecture and Publications groups where he and his architectural teams developed functional, implementation, and design specifications, infusing SonicWALL's products with unobtrusive and practicable security. Aligned with his effort to make technology accessible, he also directed the technical publications team which authors all technical documentation, including training source materials, FAQs, Technotes, Admin Guides, and Integrated Solutions Guides. Remaining engaged in various industry certification and design consortiums, and working closely with SonicWALL's vast and insighted reseller community provide an ongoing framework for relevant innovation, and have guided Joe and his development teams in proffering a number of patents in the areas of content security, wireless networking, and firewall design.
An-chung Man, SonicWALL Senior Software Engineer, has over 7 years of industrial experience. Man is proficient in networking and expert in user interface design and development. He worked in FNC (Fujitsu Networks and Communications) as a key developer for over 6 years prior to joining SonicWALL. Man earned his Master’s degree in Information Science from University of Pittsburgh.

Greg Naderi, SonicWALL's Product Line Manager, has over 12 years of experience in product management, business strategy and development, and consulting in the network security and wireless industry. Naderi has worked with notable security and mobile communication vendors such as Nokia, CoSine Communications, Blue-Silicon, and BITS, Inc. As an Industry Analyst for Frost & Sullivan, Naderi became an authority in the network security and wireless markets. While at Frost & Sullivan, Naderi led research projects and made contributions to key business and industry publications, including the Wall Street Journal, the San Francisco Chronicle, PC Week, Network Computing, InternetWeek, and InformationWeek. Naderi earned B.S. degrees in M.I.S. and Marketing from San Jose State University, and holds a certificate in network management from U.C. Santa Cruz.
Ajit Nair, Software Engineering Manager, has over 12 years of software engineering experience, including 8 years in the Silicon Valley. He joined SonicWALL in 2001 as a member of the ViewPoint development team, and now manages the development of the Management and Monitoring modules in the application. Nair has a Bachelor’s degree in Mathematics and a Master’s degree in Information Systems.
Dave Parry has over 14 years experience in MIS/IT/IT field, and has performed network architecture design and deployment for more than 100 companies worldwide. Prior to SonicWALL, Parry served as the senior systems engineer at Ignyte, a leading ASP/MSSP security integrator, focusing on network security audits and distributed Firewall/VPN deployments. Parry has been at SonicWALL since 2001 and works in the firmware architecture group.
Naveen Rajavasireddy, Senior Software Engineering Manager, has over 14 years of experience in building Enterprise Applications in the network security, financial, and transportation industries. Rajavasireddy worked in development of Operating Systems IBM OS2 and Workplace OS for the Power PC. Rajavasireddy, who manages the development of ViewPoint and Reporting in GMS at SonicWALL, has an M.S. degree in Computer Science.

Contributing SonicWALL WritersKrystle Katen is an apprentice technical writer perfecting her craft in graphical design and end user documentation. Katen has an excellent eye and experience in project management. She manages internal engineering training video production and facilitates cross-functional meetings.
Patrick Lydon has over 7 years of graphical design and networking documentation writing experience. Previously, Lydon worked as a Webmaster and graphic designer at San Valley Systems and Penton Media, respectively. He has authored over 20 technical guides on UTM, secure remote access solutions, Virtual Access Points, wireless site surveying, and RF monitoring. Patrick holds a B.A. degree in Design Studies with concentration in Graphic Design from San Jose State University.
Angela Mendoza is a Technical Writer with SonicWALL. She is currently completing a B.A. in English Literature, with an emphasis in Creative Writing, and a minor in Music from San Jose State University. Angela has earned distinction with several 2008 Phelan Awards in the genres of Best Short Story and Best Metrical Poetry from San Jose State University.
Jeremy Pollock is a senior technical writer for SonicWALL with more than nine years of experience in networking documentation. He was the lead author of Access VPDN Solutions Guide and a contributing writer to Deploying Cisco Voice over IP Solutions, both published by Cisco Press. He has a B.A. in Physics from U.C. Berkeley and a certificate in Technical Communications from San Jose State University.

Khai Tran, SonicWALL Documentation Manager, has over 10 years of networking technical documentation experience. Author of the SonicWALL Secure Wireless Integrated Solutions Guide, The Cisco IOS Release Model, and The Cisco IOS NetFlow Services Solutions Guide, Tran has authored enterprise and service provider best-practice network integrated solution guides for SonicWALL, Cisco Systems, Boeing Aerospace, AOL Time Warner, and Electronic Arts. Tran has also worked as a Vietnamese bilingual public elementary school teacher in Northern California school districts. Tran holds a B.A. degree in English Pre-and-Early Modern Literature from the U.C. Santa Cruz and a California Bi-lingual Cross-Cultural Language Arts Degree (BCLAD) Teaching Credential from San Jose State University.
Susan Weigand is a senior technical writer for SonicWALL with over seventeen years of experience in computer programming, quality assurance, and network security documentation. She has written technical manuals for Symantec, and has worked for Cisco Systems, Stratus Computer, and Zilog. Weigand holds both a B.A. in Computer Science and a B.A. in History, both with honors, from the University of California, Santa Cruz.
for-wardthinkingvision
for-wardthinkingvision

Table of Contents
Table of Contents ...................................................................................................viii
Chapter 1: Introduction to SonicWALL ViewPoint ............................................1SonicWALL ViewPoint Overview ................................................................................................................1
License and Registration Requirements .................................................................................................2Navigating the ViewPoint User Interface ....................................................................................................3
Firewall Panel .............................................................................................................................................3SSL-VPN Panel .........................................................................................................................................5Console Panel ............................................................................................................................................6
ViewPoint Views and Status ..........................................................................................................................6Using the ViewPoint TreeControl Menu .....................................................................................................9
Chapter 2: Installing SonicWALL ViewPoint ...................................................11Installation Platform Requirements ........................................................................................................... 11Installation ..................................................................................................................................................... 13Activating SonicWALL ViewPoint ............................................................................................................ 15
Creating a mysonicwall.com Account ................................................................................................. 15Registering the SonicWALL Appliance .............................................................................................. 16Activating the ViewPoint Software ..................................................................................................... 16Enabling the ViewPoint License on the SonicWALL Appliance ................................................... 17
Logging In and Out of SonicWALL ViewPoint ...................................................................................... 17
Chapter 3: Adding SonicWALL Appliances ....................................................19Adding SonicWALL Appliances to SonicWALL ViewPoint ................................................................ 19
Adding SonicWALL Appliances ........................................................................................................ 20Modifying SonicWALL Appliance Settings ....................................................................................... 21
Deleting SonicWALL Appliances from ViewPoint ................................................................................ 21About Signed Applets in SonicWALL ViewPoint .................................................................................. 22
viiiSonicWALL ViewPoint 5.0 Administrator’s Guide

Chapter 4: Using the SonicToday Panel ..........................................................23Overview of the SonicToday Panel ............................................................................................................24Editing a Component Window ...................................................................................................................24Adding a Component Window ...................................................................................................................26
Application Widget .................................................................................................................................26RSS Feed ..................................................................................................................................................28To Add More Pages ...............................................................................................................................29Other Features ........................................................................................................................................30
Chapter 5: Configuring User Settings ..............................................................33General ............................................................................................................................................................33
Chapter 6: Configuring Log Settings ...............................................................35Configuration .................................................................................................................................................35View Log .........................................................................................................................................................36
Chapter 7: Configuring the Management Page ...............................................39ViewPoint Settings ........................................................................................................................................39
Configuring Email Settings ...................................................................................................................40Configuring Debug and Synchronizing Model Codes ......................................................................40
Alert Settings ..................................................................................................................................................41Sessions ...........................................................................................................................................................42
Managing Sessions ..................................................................................................................................42ViewPoint Updates .......................................................................................................................................43
Chapter 8: Managing Reports in the Console Panel ......................................45Settings ............................................................................................................................................................45
Configuring Syslog Data Storage Configuration and Sort Settings .................................................46Controlling the Number of Appliances with Log Viewer Enabled ................................................47
Summarizer ....................................................................................................................................................48About Summary Data in Reports .........................................................................................................48Summarizer Settings ...............................................................................................................................48
Email/Archive ...............................................................................................................................................51Configuring Email/Archive Settings ...................................................................................................51
Scheduled Reports .........................................................................................................................................52Management ...................................................................................................................................................57
Configuring Report Data Management ...............................................................................................58
Chapter 9: Using Diagnostics ...........................................................................59Capacity Planning .........................................................................................................................................59Summarizer Status .........................................................................................................................................62
ix SonicWALL ViewPoint 5.0 Administrator’s Guide

Chapter 10: Granular Event Management ........................................................65Granular Event Management Overview ................................................................................................... 65
What is Granular Event Management? ............................................................................................... 66How Does Granular Event Management Work? ............................................................................. 66
Using Granular Event Management .......................................................................................................... 67About Alerts ............................................................................................................................................ 68
Configuring Granular Event Management ............................................................................................... 69Configuring Events on the Console Panel ......................................................................................... 69Enabling or Disabling Alerts on the Firewall Panel ......................................................................... 75
Viewing Current Alerts ................................................................................................................................ 76
Chapter 11: ViewPoint Reporting Features .....................................................77ViewPoint Reporting Overview ................................................................................................................. 77
Viewing ViewPoint Reports ................................................................................................................. 79Navigating ViewPoint Reporting ............................................................................................................... 81
Global Views ........................................................................................................................................... 82Unit View ................................................................................................................................................ 83Using Interactive Reports ..................................................................................................................... 84Searching for a Report ........................................................................................................................... 85Collapsible TreeControl Pane .............................................................................................................. 90Enable/Disable Scheduled Reports .................................................................................................... 91Combined Reports ................................................................................................................................. 91Improved Navigation ............................................................................................................................ 91
Managing ViewPoint Reports on the Console Panel .............................................................................. 93
Chapter 12: Scheduling and Configuring Reports ..........................................95Configuring Scheduled Reports .................................................................................................................. 95
Viewing or Managing Scheduled Reports .......................................................................................... 96Adding or Editing a Scheduled Report ............................................................................................... 97
Selecting Reports for Summarization ........................................................................................................ 99Using Summarize Now .............................................................................................................................. 101Configuring Dashboard Summary Reports ............................................................................................ 104Exporting Reports to PDF ....................................................................................................................... 106
Compliance Report Overview ............................................................................................................ 106Adding a New Scheduled Compliance Report ................................................................................ 107Customizing Your Detailed Reports Page ....................................................................................... 110
Chapter 13: Viewing Reports ..........................................................................115Managing Report Settings ......................................................................................................................... 116
Editing Report Settings ....................................................................................................................... 116Selecting a Graphical Display ............................................................................................................. 116
xSonicWALL ViewPoint 5.0 Administrator’s Guide

Setting a Date or Date Range .............................................................................................................117Additional Settings ................................................................................................................................118Troubleshooting Reports ...................................................................................................................118
Viewing General Status Reports ...............................................................................................................119Viewing Dashboard Reports .....................................................................................................................120
Viewing the Dashboard Summary Report ........................................................................................120Configuring and Using Custom Reports .................................................................................................123
Toggling Between Split Mode and Full Mode .................................................................................124Configuring the Date and Time .........................................................................................................126Configuring the Report Layout and Generating the Report ..........................................................128Generating the Custom Report ..........................................................................................................135Viewing a Custom Report ...................................................................................................................136Printing a Page or Exporting a PDF of the Report ........................................................................138Saving the Report Template ................................................................................................................139
Viewing Bandwidth Reports .....................................................................................................................139Viewing the Bandwidth Summary Report ........................................................................................140Viewing the Top Users of Bandwidth ...............................................................................................141Viewing Bandwidth Usage Over Time ..............................................................................................143Viewing the Top Users of Bandwidth Over Time ..........................................................................145
Viewing Services Reports ...........................................................................................................................147Viewing the Services Summary Report .............................................................................................147
Viewing Web Usage Reports .....................................................................................................................149Viewing the Web Usage Summary Report .......................................................................................150Viewing the Top Web Sites .................................................................................................................151Viewing the Top Users of Web Bandwidth .....................................................................................153Viewing Web Usage by User ...............................................................................................................155Viewing Web Usage By Site ................................................................................................................156Viewing Web Usage By Category .......................................................................................................158Viewing Web Usage Over Time .........................................................................................................159Viewing Top Sites Over Time ............................................................................................................161Viewing Top Users Over Time ..........................................................................................................163Viewing Web Usage By User Over Time .........................................................................................165Viewing Web Usage By Category Over Time ..................................................................................166
Viewing Web Filter Reports ......................................................................................................................168Viewing the Web Filter Summary Report .........................................................................................169Viewing the Web Filter Top Sites Report .........................................................................................170Viewing the Top Users that Try to Access Blocked Sites ..............................................................172Viewing the Blocked Sites for Each User .........................................................................................173Viewing Blocked Sites Sorted By Site ................................................................................................174Viewing Blocked Sites Sorted By Category ......................................................................................176Viewing Blocked Site Attempts Over Time .....................................................................................177
xi SonicWALL ViewPoint 5.0 Administrator’s Guide

Viewing the Top Blocked Site Attempts Over Time ..................................................................... 178Viewing the Top Blocked Site Users Over Time ............................................................................ 180Viewing Blocked Sites for Each User Over Time .......................................................................... 181Viewing Blocked Sites By Category Over Time .............................................................................. 182
Viewing File Transfer Protocol Reports ................................................................................................. 183Viewing the FTP Summary Report ................................................................................................... 184Viewing the Top FTP Sites By User ................................................................................................. 185Viewing FTP Bandwidth Usage Over Time .................................................................................... 187Viewing the Top Users of FTP Bandwidth Over Time ................................................................ 189
Viewing Mail Usage Reports ..................................................................................................................... 190Viewing the Mail Usage Summary Report ....................................................................................... 191Viewing the Top Users of Mail Bandwidth ..................................................................................... 193Viewing Mail Usage Over Time ......................................................................................................... 194Viewing the Top Users of Mail Bandwidth Over Time ................................................................. 196
Viewing VPN Usage Reports ................................................................................................................... 197Viewing the VPN Usage Summary Report ...................................................................................... 198Viewing the Top VPN Users ............................................................................................................. 199Viewing VPN Usage Over Time ....................................................................................................... 201Viewing the Top VPN Users Over Time ......................................................................................... 202Viewing VPN Usage By Policy .......................................................................................................... 204Viewing the Top VPN Policies Over Time ..................................................................................... 205Viewing Hourly VPN Usage By Policy ............................................................................................ 207Viewing the VPN Services Summary Report .................................................................................. 208
Viewing Attacks Reports ........................................................................................................................... 209Viewing the Attack Summary Report ............................................................................................... 210Viewing the Attacks By Category ...................................................................................................... 212Viewing the Errors Report ................................................................................................................. 213Viewing Attack Reports Over Time .................................................................................................. 215Viewing the Attacks By Category Over Time ................................................................................. 216Viewing Errors Over Time ................................................................................................................. 217
Viewing Virus Attacks Reports ................................................................................................................ 219Viewing the Top Viruses By Attack Attempts Report ................................................................... 221Viewing the Virus Attack Attempts Report ..................................................................................... 222Viewing the Virus Attacks By User Report ..................................................................................... 224
Viewing Anti-Spyware Reports ................................................................................................................ 226Viewing a Spyware Summary ............................................................................................................. 228Viewing Spyware Attempts By Category .......................................................................................... 229Viewing Spyware Attempts Over Time ............................................................................................ 230Viewing Spyware Attempts By Category Over Time ..................................................................... 232
Viewing Intrusion Prevention Reports ................................................................................................... 233Viewing the Intrusion Prevention Summary Report ...................................................................... 235
xiiSonicWALL ViewPoint 5.0 Administrator’s Guide

Viewing Intrusion Attempts By Category .........................................................................................236Viewing Intrusions Over Time ...........................................................................................................238Viewing Intrusion Reports By Category Over Time .......................................................................240
Viewing Authentication Reports ...............................................................................................................242Viewing the User Login Report ..........................................................................................................242Viewing the Administrator Login Report .........................................................................................243Viewing the Failed Login Report .......................................................................................................244
Viewing the Log ..........................................................................................................................................245Viewing the Log for a SonicWALL Appliance ................................................................................245
Chapter 14: SSL VPN Reporting .....................................................................249SSL VPN Reporting Overview .................................................................................................................249
What is SSL VPN Reporting? .............................................................................................................250Benefits of SSL VPN Reporting ........................................................................................................250How Does SSL VPN Reporting Work? ............................................................................................250
Using and Configuring SSL VPN Reporting ..........................................................................................250About Viewing Available SSL VPN Report Types .........................................................................251Configuring SSL VPN Scheduled Reports ......................................................................................251Configuring SSL VPN Summarization ..............................................................................................252
Chapter 15: Viewing SSL VPN Reports ..........................................................255Viewing SSL VPN Bandwidth Reports ...................................................................................................256
Viewing SSL VPN Bandwidth Summary Reports ...........................................................................256Viewing SSL VPN Top Users of Bandwidth Reports ....................................................................258Viewing SSL VPN Bandwidth Usage Over Time Reports ............................................................259Viewing SSL VPN Top Users of Bandwidth Over Time Reports ...............................................261
Viewing SSL VPN Resource Reports ......................................................................................................262Viewing SSL VPN Resource Summary Reports ..............................................................................263
Viewing SSL VPN Authentication Reports ............................................................................................264Viewing SSL VPN User Login Reports ............................................................................................264Viewing SSL VPN Failed Login Reports ..........................................................................................265
Viewing the SSL VPN Log .......................................................................................................................266Viewing the Log for a SSL VPN Appliance .....................................................................................267
Appendix A: Technical Tips .................................................................................269Log Viewer ...................................................................................................................................................269Real-time Syslog Viewer .............................................................................................................................271Forwarding Syslog Data to Another Syslog Server ................................................................................272Posting ViewPoint Reporting to Another Web Server for End-User Access ...................................273
xiii SonicWALL ViewPoint 5.0 Administrator’s Guide

CHAPTER 1Introduction to SonicWALL ViewPoint
This chapter provides an overview of SonicWALL ViewPoint and information about the user interface.
See the following sections:
• “SonicWALL ViewPoint Overview” on page 1
• “Navigating the ViewPoint User Interface” on page 3
• “ViewPoint Views and Status” on page 6
• “Using the ViewPoint TreeControl Menu” on page 9
SonicWALL ViewPoint OverviewMonitoring critical network events and activity, such as security threats, inappropriate Web use, and bandwidth levels, is an essential component of network security. SonicWALL ViewPoint Reporting complements SonicWALL's network security offerings by providing detailed and comprehensive reports of network activity.
TheViewPoint Reporting Module is a software application that creates dynamic, Web-based network reports. The ViewPoint Reporting Module generates both real-time and historical reports to offer a complete view of all activity through SonicWALL network security appliances. With ViewPoint Reporting, you can monitor network access, enhance security, and anticipate future bandwidth needs.
The ViewPoint Reporting Module:
• Displays bandwidth use by IP address and service
• Identifies inappropriate Web use
• Provides detailed reports of attacks
1SonicWALL ViewPoint 5.0 Administrator’s Guide

SonicWALL ViewPoint Overview
• Collects and aggregates system and network errors
• Shows VPN events and problems
• Presents visitor traffic to your Web site
• Provides detailed daily firewall logs to analyze specific events.
License and Registration RequirementsSonicWALL ViewPoint is licensed separately from SonicOS. Licensing your ViewPoint service requires:
• A mysonicwall.com account. A mysonicwall.com account allows you to manage your SonicWALL products and purchase licenses for various services. Creating a mysonicwall.com is fast, simple, and FREE. Simply complete an online registration form directly from your SonicWALL security appliance management interface. Your mysonicwall.com account is also accessible at <https://www.mysonicwall.com> from any Internet connection with a Web browser. Once you have an account, you can purchase ViewPoint and other licenses for your registered SonicWALL security appliances.
• A registered SonicWALL security appliance with active Internet connection. You need to register your SonicWALL security appliance to activate SonicWALL ViewPoint. Registering your SonicWALL security appliance is a simple procedure done directly from the management interface. Once your SonicWALL security appliance is registered, you can activate SonicWALL ViewPoint by using an activation key or by synchronizing with mysonicwall.com.
2 SonicWALL ViewPoint 5.0 Administrator’s Guide

Navigating the ViewPoint User Interface
Navigating the ViewPoint User InterfaceThis section describes the Firewall, SSL-VPN, and Console panels in the SonicWALL ViewPoint user interface. For information about the SonicToday panel, see the Using the SonicToday Panel chapter.
Firewall PanelThe Firewall Panel is an essential component of network security that is used to view and schedule reports about critical network events and activity, such as security threats, inappropriate Web use, and bandwidth levels.
To open the Firewall Panel, click the Firewall tab at the top of the ViewPoint user interface.
Figure 1 Firewall Panel and Default Page
From the Firewall Panel, you can view the following for connected SonicWALL appliances:
• View general unit status, license status, and syslog settings. A link to the SonicWALL ViewPoint Getting Started Guide is provided.
3SonicWALL ViewPoint 5.0 Administrator’s Guide

Navigating the ViewPoint User Interface
• View the SonicWALL security dashboard. Dashboard reports display an overview of bandwidth, uptime, intrusions and attacks, and alerts for connected SonicWALL firewalls. The Security Dashboard report provides data about worldwide security threats that can affect your network. The Dashboard also displays data about threats blocked by the SonicWALL security appliance.
• View custom reports of Internet activity at the unit level. Custom reports filter raw syslog data and you can specify start and end dates or a date range such as “Week to date”. You can filter by user, domain, protocol, traffic, and Web site category. The search template can be saved for use again later with the same appliance.
• View general bandwidth usage. These reports include a daily bandwidth summary report, a top users of bandwidth report, and over-time summary and top users reports.
• View a services report. This report includes information about events and usage of protocols and megabytes.
• View Web bandwidth usage. These reports include a daily bandwidth summary report, a top visited sites report, a top users of Web bandwidth report, a report that contains the top sites of each user, and a weekly summary report.
• View the number of attempts that users made to access blocked websites. These reports include a daily summary report, a top blocked sites report, a top users report, a report that contains the top blocked sites of each user, and a weekly summary report.
• View file transfer protocol (FTP) bandwidth usage. These reports include a daily FTP bandwidth summary report, a top users of FTP bandwidth report, and a weekly summary report.
• View mail bandwidth usage. These reports include a daily mail summary report, a top users of mail report, and a weekly summary report.
• View VPN usage. These reports include a daily VPN summary report, a top users of VPN bandwidth report, and a weekly summary report.
• View reports on attempted attacks and errors. The attack reports include a daily attack summary report, an attack by category report, a top sources of attacks report, and a weekly attack summary report. The error reports include a daily error summary report and a weekly error summary report.
• View successful and unsuccessful user and administrator authentication attempts. These reports include a user authentication report, an administrator authentication report, and a failed authentication report.
• View detailed logging information. The detailed logging information contains each transaction that occurred on the SonicWALL appliance.
• View current alerts and access alert settings.
4 SonicWALL ViewPoint 5.0 Administrator’s Guide

Navigating the ViewPoint User Interface
SSL-VPN PanelThe SSL-VPN panel provides access to SSL VPN appliances and is similar to the Firewalls panel. It is used to view and schedule reports about critical network events and activity, such as security threats, inappropriate Web use, and bandwidth levels.
To open the SSL-VPN Panel, click the SSL-VPN tab at the top of the ViewPoint user interface.
Figure 2 SSL-VPN Panel and Bandwidth Page
From the SSL-VPN Panel, you can view the following for connected SonicWALL SSL VPN appliances:
• View general unit status, license status, and syslog settings. A link to the SonicWALL ViewPoint Getting Started Guide is provided.
• View general bandwidth usage. These reports include a daily bandwidth summary report, a top users of bandwidth report, and over-time summary and top users reports.
• View a resources report. This report includes information about connections and the resource used to connect, such as HTTPS or NetExtender.
• View successful and unsuccessful user authentication attempts. These reports include a user authentication report and a failed authentication report.
• View detailed logging information. The detailed logging information contains each transaction that occurred on the SonicWALL appliance.
5SonicWALL ViewPoint 5.0 Administrator’s Guide

ViewPoint Views and Status
Console PanelThe Console Panel is used to configure SonicWALL ViewPoint settings, view pending tasks, view the log, manage licenses, and configure alerts.
To open the Console Panel, click the Console tab at the top of the SonicWALL ViewPoint user interface.
Figure 3 Console Panel
From the Console Panel, you can do the following:
• Change the SonicWALL ViewPoint password.
• View the SonicWALL ViewPoint log. The SonicWALL ViewPoint log contains information on alert notifications, failed SonicWALL ViewPoint login attempts, and other events that apply to SonicWALL ViewPoint.
• Manage tasks. You can view the status of SonicWALL tasks and, if necessary, delete them.
• Manage email or archive report settings. You can set the schedule and server settings, and the email alert recipient schedule.
ViewPoint Views and Status SonicWALL ViewPoint allows you to view status and reports for all appliances at once using MyReportsView, or for a single unit at a time with the Unit view.
6 SonicWALL ViewPoint 5.0 Administrator’s Guide

ViewPoint Views and Status
ViewPoint provides status information on the General > Status page of the Firewall or SSL-VPN panel.
MyReportsView is a grouping of all the appliances you are monitoring with ViewPoint. From the My Reports view of the Firewall or SSL-VPN Panel, Summary and Over Time reports are available for all SonicWALL appliances monitored by SonicWALL ViewPoint.
To open the My Reports view, click the MyReportsView icon at the top of the left pane. To display the global status page, navigate to General > Status. See Figure 4.
Figure 4 Global Status Page for MyReportsView
From the Unit view, reports contain detailed data for the selected SonicWALL appliance. To specify the unit view, click any unit in the left pane. To display the unit status page, navigate to General > Status on the Firewall or SSL-VPN panel.
7SonicWALL ViewPoint 5.0 Administrator’s Guide

ViewPoint Views and Status
Figure 5 Unit Status Page
8 SonicWALL ViewPoint 5.0 Administrator’s Guide

Using the ViewPoint TreeControl Menu
Using the ViewPoint TreeControl MenuThis section describes the content of the TreeControl menu within the SonicWALL ViewPoint user interface.
You can control the display of the TreeControl pane by selecting one of the appliance tabs at the top of the main window. For example, when you click the Firewall tab, the TreeControl pane displays all the connected firewall units. The two appliance tabs can display the following appliance types when ViewPoint is monitoring these device types:
• Firewalls
• SSL VPNs
You can hide the entire TreeControl pane by clicking the sideways arrow icon, and redisplay the pane by clicking it again. This is helpful when viewing some reports or other extra-wide screens.
Figure 6 Hiding the TreeControl Pane
To open a TreeControl appliance menu, right-click MyReportsView or a Unit icon.
Figure 7 TreeControl > Right-Click
9SonicWALL ViewPoint 5.0 Administrator’s Guide

Using the ViewPoint TreeControl Menu
The following options are available in the right-click menu:
• Find—Opens a Find dialog box that allows you to search for units.
• Refresh—Refreshes the ViewPoint UI display.
• Rename Unit—(unit view only) Renames the selected SonicWALL appliance.
• Add Unit—Add a new unit to the ViewPoint view. Requires unit IP and login information.
• Modify Unit—(unit view only) Change basic settings for the selected unit, including unit name, IP and login information, and serial number.
• Delete—Delete the selected unit
• Login to Unit—(unit view only) Login to the selected unit using HTTP or HTTPS protocols.
10 SonicWALL ViewPoint 5.0 Administrator’s Guide

CHAPTER 2Installing SonicWALL ViewPoint
This chapter describes how to install and activate SonicWALL ViewPoint.
See the following sections:
• “Installation Platform Requirements” on page 11
• “Installation” on page 13
• “Logging In and Out of SonicWALL ViewPoint” on page 17
• “Activating SonicWALL ViewPoint” on page 15
Installation Platform RequirementsThis section provides deployment requirements and information about supported versions.
Note SonicWALL does not support installations of ViewPoint running on any virtualization software, such as VMware.
Operating SystemsIn order to install and run SonicWALL ViewPoint, you must be logged in as the administrator. ViewPoint is supported on the following operating systems:
• Windows 2003 Server (SP1, 32-bit)
• Windows 2000 Server (SP4)
• Windows 2000 Professional (SP4)
• Windows XP Professional (SP2)
11SonicWALL ViewPoint 5.0 Administrator’s Guide

Installation Platform Requirements
DatabasesOn Windows only, ViewPoint supports the following database, provided as part of a fresh installation of ViewPoint 5.0 and higher:
• MySQL version 5.0 for Windows, bundled with SonicWALL ViewPoint 5.0
The requirements for the MySQL server are as follows:
• Windows 2000 (SP4) and above
• NTFS file system
• Minimum 6 GB hard disk space
• Minimum 2 GB RAM
• Not a Virtual Machine (VM)
On all supported operating systems, ViewPoint supports the following databases:
• Microsoft SQL Server 2000 (SP4)
On Windows 2003 Server, ViewPoint also supports the Microsoft SQL Server 2005 (SP2) database.
On Windows 2000 Server, ViewPoint also supports the Microsoft SQL Server 2000 (SP4) database.
Hardware RequirementsThe hardware platform where ViewPoint is installed must meet the following requirements:
• 3 GHz or faster processor
• Minimum 2 GB RAM
• At least 300 GB of free disk space
Note Ensure that the drive where ViewPoint is installed has ample space to store the ViewPoint log files.
ViewPoint requires large amounts of disk space for database storage. In early versions, the maximum raw syslog database size was 2 GB. ViewPoint now provides enhanced database capacity by creating a new 2 GB database everyday. Each file name includes the date it was created for easy reference.
12 SonicWALL ViewPoint 5.0 Administrator’s Guide

Installation
JavaSonicWALL ViewPoint services automatically download and use the following versions of Java, Java applications, and Java driver software:
• Java Plug-in 1.6
• Tomcat 5.5.26
SonicWALL AppliancesYou can use ViewPoint reporting for the following SonicWALL security appliances:
• SonicWALL firewalls running SonicOS 1.0 or higher, or SonicWALL firmware 6.1.2.0 or higher
• SonicWALL SSL VPN 200 / 2000 / 4000 running SonicOS SSL VPN 2.1 or higher
• SonicWALL CSM Series running SonicOS CF 1.0 or higher
Static IP / DHCP If accessed from the WAN interface, the SonicWALL appliance must have a static IP address. Otherwise, it may have either a static or dynamic IP address.
HTTP / HTTPSHTTP and HTTPS access for adding a SonicWALL appliance to ViewPoint is supported as follows:
• HTTP for access to a LAN IP address only
• HTTPS for access to a LAN IP or WAN IP address
Web BrowsersFor local and remote browser access, the following browsers are supported:
• Microsoft Internet Explorer 6.0 and higher
• Mozilla Firefox 2.0 and higher
Installation You can either perform a fresh installation of SonicWALL ViewPoint 5.0 using the installer or upgrade a previous installation of SonicWALL ViewPoint 4.1.x. To upgrade from a version of ViewPoint prior to 4.1, you must first upgrade to SonicWALL ViewPoint 4.1 and then run the SonicWALL ViewPoint 5.0 installation.
If the SonicWALL ViewPoint Console (Web server) is set up for HTTPS management, the upgrade to ViewPoint 5.0 will preserve the HTTPS settings for the ViewPoint Web server.
13SonicWALL ViewPoint 5.0 Administrator’s Guide

Installation
The installation folder path name should not contain spaces.
There are two phases to a ViewPoint installation. The file system is created during phase one, and the services and databases are created during phase two. The error message ‘Unknown error’ may appear during phase two if MSDE cannot be installed. Before installing ViewPoint, verify that none of the following are already installed:
• SQL Server
• SQL Server Express
• MSDE
Keep in mind that programs like “Backup Exec” use MSDE.
If any of the above programs are installed, they must first be uninstalled. Also, disable any Anti-Virus programs during the installation.
When you are ready to install SonicWALL ViewPoint 5.0, perform the following steps:
1. Log on to the computer as administrator.
2. Using a Web browser, log into your mysonicwall.com account at:
https://www.mysonicwall.com/
3. In the left pane, click Download Center.
4. In the Download Center page, select the language you prefer in the Language drop-down list.
5. Select ViewPoint in the Type drop-down list.
6. After the screen refreshes, click the link for ViewPoint 5.0. The ViewPoint50.zip file will be downloaded to your system.
7. Extract the VPS.exe file and double-click it. The Introduction screen displays.
8. Click Next. The License Agreement screen displays.
9. Select from the following:
– To accept the terms of the license agreement, select I accept the terms of the License Agreement and click Next. The Choose Install Folder screen displays.
– To not accept the terms, select I do NOT accept the terms of the License Agreement and click Next. The SonicWALL ViewPoint installation program closes and the product will not install.
10. To accept the default location, click Next. To select a different location, click Choose and select a folder. Click Next.
The Settings screen displays. Do the following:
– Enter the IP address or host name of the Simple Mail Transfer Protocol (SMTP) server in the SMTP Server Address field.
14 SonicWALL ViewPoint 5.0 Administrator’s Guide

Activating SonicWALL ViewPoint
– Enter the number of the web server port in the Web Server Port field (default: 80).
– Enter the email addresses of administrators who will receive email notifications from SonicWALL ViewPoint.
– Enter and confirm the database password in the Database Password and Confirm Password fields. Use a password with no special characters (for example, %, !, &).
– To configure SonicWALL ViewPoint to validate these settings, select the Validate fields on this screen check box.
11. Click Install. The installation program begins copying SonicWALL ViewPoint files.
12. After the files are copied, restart the server. Installation is complete.
Activating SonicWALL ViewPointTo use SonicWALL ViewPoint, you must license it on each SonicWALL security appliance that you want reports about. The SonicWALL appliance must be registered on mysonicwall.com before you can purchase and activate the ViewPoint license for it. You must also enable the ViewPoint license on the appliance itself.
See the following sections:
• “Creating a mysonicwall.com Account” on page 15
• “Registering the SonicWALL Appliance” on page 16
• “Activating the ViewPoint Software” on page 16
• “Enabling the ViewPoint License on the SonicWALL Appliance” on page 17
Creating a mysonicwall.com AccountIf you do not already have a mysonicwall.com account, open a Web browser and navigate to the following website:
http://www.mysonicwall.com
Follow the on-screen prompts to create a user account.
15SonicWALL ViewPoint 5.0 Administrator’s Guide

Activating SonicWALL ViewPoint
Registering the SonicWALL ApplianceTo register the SonicWALL appliance that ViewPoint will monitor, perform the following steps:
1. Log on to mysonicwall.com.
2. Click My Products. The SonicWALL My Products page displays.
Figure 8 mysonicwall.com My Products Page
3. Enter your SonicWALL serial number in the Serial Number field.
4. Enter a descriptive name for the SonicWALL appliance in the Friendly Name field.
5. Select the Product Group from the drop-down list.
6. Click Register. The mysonicwall.com website registers the SonicWALL appliance.
Activating the ViewPoint SoftwareTo activate the SonicWALL ViewPoint software, perform the following steps:
1. Log on to mysonicwall.com.
2. Click the label of the newly registered SonicWALL appliance. The Service Management page displays.
3. Scroll down to locate the ViewPoint service and click Enter Key. The Activate Service page displays.
4. Enter the ViewPoint Activation Key in the Activation Key field. The ViewPoint Activation Key is printed on the ViewPoint Software License Certificate shipped with the ViewPoint package. If you purchased ViewPoint on mysonicwall.com, the key is emailed to you.
5. Click Submit. After the Activation Key is registered, a ViewPoint License Key will appear. Carefully write down the ViewPoint License Key in a safe place.
16 SonicWALL ViewPoint 5.0 Administrator’s Guide

Logging In and Out of SonicWALL ViewPoint
Enabling the ViewPoint License on the SonicWALL Appliance
To enable the SonicWALL ViewPoint license, perform the following steps:
1. Log into the SonicWALL appliance.
2. Navigate to Log > ViewPoint. The ViewPoint page displays.
3. Enter the ViewPoint License Key provided by mysonicwall.com in the Enter Upgrade Key field.
4. Click Apply.
5. Restart the SonicWALL for the change to take effect.
Logging In and Out of SonicWALL ViewPoint
To start and log into SonicWALL ViewPoint, perform the following steps:
1. Do one of the following:
– If you are logging in locally, double-click the SonicWALL ViewPoint icon on your desktop.
– If you are logging in from a remote location, open a Web browser and enter http://viewpoint_ipaddress/sgms/login or http://viewpoint_ipaddress or http://localhost .
The SonicWALL ViewPoint login page displays.
17SonicWALL ViewPoint 5.0 Administrator’s Guide

Logging In and Out of SonicWALL ViewPoint
Figure 9 SonicWALL ViewPoint Login Page
1. Enter the SonicWALL ViewPoint user ID (default: admin) and password (default: password).
Note After the password is entered, an authenticated management session is established that times out after 5 minutes of inactivity. The default time-out can be changed from the General/ViewPoint Password page on the Console Panel.
For security purposes, it is highly recommended to change the default password for the user admin. The maximum size of the SonicWALL ViewPoint User ID is 24 alphanumeric characters. If the password is more than 32 characters long, it will automatically be truncated.
2. Click Submit. The SonicWALL ViewPoint UI opens.
3. To logout, click the Logout button in the SonicWALL ViewPoint UI.
18 SonicWALL ViewPoint 5.0 Administrator’s Guide

CHAPTER 3Adding SonicWALL Appliances
This chapter describes how to add SonicWALL appliances to the SonicWALL ViewPoint. . This chapter contains the following sections:
• “Adding SonicWALL Appliances to SonicWALL ViewPoint” on page 19
• “Deleting SonicWALL Appliances from ViewPoint” on page 21
• “About Signed Applets in SonicWALL ViewPoint” on page 22
Adding SonicWALL Appliances to SonicWALL ViewPoint
SonicWALL ViewPoint checks with the SonicWALL licensing server when you add an appliance, so it is important that ViewPoint has Internet access to the server.
SonicWALL ViewPoint can communicate with SonicWALL appliances through HTTP or HTTPS. See the following sections:
• “Adding SonicWALL Appliances” on page 20
• “Modifying SonicWALL Appliance Settings” on page 21
19SonicWALL ViewPoint 5.0 Administrator’s Guide

Adding SonicWALL Appliances to SonicWALL ViewPoint
Adding SonicWALL Appliances To add a SonicWALL appliance using the SonicWALL ViewPoint UI, follow these steps:
1. At the top of the user interface, click the appliance tab that corresponds to the type of appliance that you want to add: Firewall or SSL-VPN.
2. Right-click an open area in the left pane (TreeControl pane) of the SonicWALL ViewPoint UI and select Add Unit. The Add Unit dialog box appears.
Figure 10 Add Unit Dialog Box
3. Enter a descriptive name for the SonicWALL appliance in the Unit Name field.
Note Do not enter the single quote character (‘) in the Unit Name field.
4. Enter the administrator login name for the SonicWALL appliance in the Login Name field.
5. Enter the password used to access the SonicWALL appliance in the Password field.
6. Enter the serial number of the SonicWALL appliance in the Serial Number field.
7. For Access Mode, select from the following:
– If the SonicWALL appliance will be managed over HTTP, select Use Insecure login (HTTP).
– If the SonicWALL appliance will be managed over HTTPS, select Use Secure login (HTTPS).
8. Enter the IP address of the managed appliance in the IP Address field.
20 SonicWALL ViewPoint 5.0 Administrator’s Guide

Deleting SonicWALL Appliances from ViewPoint
9. Enter the port used to administer the SonicWALL appliance in the HTTP(S) Port field (default ports are HTTP: 80; HTTPS: 443).
10. The new SonicWALL appliance appears in the SonicWALL ViewPoint UI. It will have a yellow icon that indicates it has not yet been successfully acquired.
SonicWALL ViewPoint will then attempt to set up an HTTP or HTTPS connection to access the appliance. ViewPoint then reads the appliance configuration and acquires the SonicWALL appliance for management. This will take a few minutes.
After the SonicWALL appliance is successfully acquired, its icon turns blue, its configuration settings are displayed at the unit level, and its settings are saved to the database.
Modifying SonicWALL Appliance SettingsIf you make a mistake or need to change the settings of an added SonicWALL appliance, you can manually modify its settings or how it is managed.
To modify a SonicWALL appliance, perform the following steps:
1. Right-click the appliance name in the left pane of the SonicWALL ViewPoint UI and select Modify Unit from the pop-up menu. The Modify Unit dialog box appears.
2. The Modify Unit dialog box contains the same options as the Add Unit dialog box. For descriptions of the fields, see Adding SonicWALL Appliances to SonicWALL ViewPoint, page 19.
3. When you have finished modifying options, click OK. The SonicWALL appliance settings are modified.
Deleting SonicWALL Appliances from ViewPoint
To delete a SonicWALL appliance from ViewPoint, perform the following steps:
1. Right-click on a SonicWALL appliance in the left pane of the SonicWALL ViewPoint UI and select Delete from the pop-up menu.
2. In the warning message that displays, click Yes. The SonicWALL appliance is deleted from ViewPoint.
21SonicWALL ViewPoint 5.0 Administrator’s Guide

About Signed Applets in SonicWALL ViewPoint
About Signed Applets in SonicWALL ViewPoint
There are a number of applets in the ViewPoint UI, such as the TreeControl Applet in the leftmost pane.
Signed Applets refers to a technique for adding a digital signature to a Java applet to prove that it was not tampered with upon receipt from the signer. Signed applets can be given more privileges than ordinary applets. By default, applets have no access to system resources outside the directory from which they were launched, but a signed applet can access local system resources as allowed by the local system’s security policy.
In previous releases of ViewPoint, you were required to edit the java.policy file yourself on the client browser system in order to enable a number of applet related operations, such as Copy/Paste, Import file, Browse local folders, and HTTP/HTTPS login to the managed units from the ViewPoint UI.
There is no need to edit the java.policy file for signed applets. When a signed applet starts up, a warning pop-up is displayed. If you want to trust the applet, click Yes. Copy/paste, Import and HTTP/HTTPS logins will work without any edits to the java.policy file.
Figure 11 Applet Warning
Otherwise, click No. In this case you must manually edit the java.policy file. You can view the following technote for more information about editing the java.policy file:
Manually Configuring the java.policy File for SonicWALL GMS JRE
22 SonicWALL ViewPoint 5.0 Administrator’s Guide

CHAPTER 4Using the SonicToday Panel
This chapter introduces the SonicToday panel in the SonicWALL ViewPointUser Interface (UI). .
This section includes the following subsections:
• “Overview of the SonicToday Panel” section on page 24
• “Editing a Component Window” section on page 24
• “Adding a Component Window” section on page 26
23SonicWALL ViewPoint 5.0 Administrator’s Guide

Overview of the SonicToday Panel
Overview of the SonicToday PanelUsing RSS and AJAX technology, SonicToday is a tab intended to work as a customizable dashboard where you are able to monitor the latest happenings with your SonicWALL ViewPoint 5.0 deployment, your network, the IT and Security World, as well as the rest of the world.
Upon initial login, you see a default SonicToday tab. You are able to further customize this page by configuring and adding preferred components.
Editing a Component WindowOne customizable feature of SonicToday is the ability to edit the title of any given component window. To do this:
1. Click the Edit link, located on the right side of the component window you wish to modify. In this example, we will modify the title of the component window “CNN Top Stories.”
24 SonicWALL ViewPoint 5.0 Administrator’s Guide

Editing a Component Window
2. The component window will expand, revealing the following entries you can modify:
Title – The title of the component window.RSS URL – The URL of the RSS Feed the current component window updates from.Items – The number of items to be displayed on the component window.Refresh Interval – The frequency of time the component window will refresh the RSS Feed.
In this example, we will change the title to “CNN Top 5 Stories.” For Items, we specify that we want five items shown in the component window, and we want the Refresh Interval to occur every 30 minutes. Click Save to save your changes and exit the component window.
The changes will update the component window immediately.
25SonicWALL ViewPoint 5.0 Administrator’s Guide

Adding a Component Window
Adding a Component WindowAnother way to fully customize your SonicToday dashboard is by adding a component window specifically to your preferences.
Note that no component containing the same content can be added more than once in the SonicToday dashboard.
In this section, there are different component windows you can add:
• “Application Widget” section on page 26
• “RSS Feed” section on page 28
Application WidgetThe application widget specifically details Logs and Current Sessions in SonicWALL ViewPoint 5.0. The convenience of this new widget is that it enables you to keep track of all these different details from the SonicToday dashboard page, rather than navigating through other tabs. To add the application widget:
1. Click Add Component to bring up the Add Component Manager dialogue box. Select Application Widget from the ‘Type’ drop-down list.
26 SonicWALL ViewPoint 5.0 Administrator’s Guide

Adding a Component Window
2. Specify what type of Widget you want in the component. The Title will default to the Widget you choose, but you may customize this if you prefer. You also will indicate how many Items you want to be shown on the component window, as well as the Refresh Interval.
In this example, we will add a widget that monitors Logs, displaying the latest five everyten minutes.
3. Click Add when finished specifying entries. The component window is added to the SonicToday dashboard.
thanks
27SonicWALL ViewPoint 5.0 Administrator’s Guide

Adding a Component Window
RSS FeedRSS Feed is a component window designed to keep you updated with what is going on in the IT and Security World, as well as all around the globe. This section contains procedures for customizing an RSS Feed component window on your SonicToday dashboard.
To choose a Predefined RSS Feed:
1. Click Add Component to bring up the Add Component Manager dialogue box.
2. Select RSS Feed from the ‘Type’ drop-down list. This will automatically bring up a list of predefined RSS Feeds you may choose from.
The Title will default to the Alert Type you choose, but you may customize this if you prefer. You also will indicate how many Items you want to be shown on the component window, as well as the Refresh Interval.
In this example, we will select ‘AP Sports News,’ displaying the first five items every 30 minutes on the component window.
3. Click Add when you are finished. This will add the new RSS Feed component window to your SonicToday dashboard.
To Choose a Custom RSS Feed:
1. Click Add Component to bring up the Add Component Manager dialogue box.
2. Select RSS Feed from the ‘Type’ drop-down list. This will automatically bring up a list of predefined RSS Feeds you may choose from.
3. Scroll to the bottom of the predefined list and select Custom RSS Feed... Enter the URL of the RSS Feed you would like on your component window.
28 SonicWALL ViewPoint 5.0 Administrator’s Guide

Adding a Component Window
Note To search a large directory of available RSS Feeds, navigate to: http://www.rsfeeds.com/
4. Enter the Title for this custom RSS Feed page. Also indicate how many Items you want to be shown on the component window, as well as the Refresh Interval.
In this example, we will choose ‘Rediff Top Stories,’ displaying the first five items every 30 minutes on the component window.
5. Click Add when you are finished. This will add the new RSS Feed component window to your SonicToday dashboard.
To Add More PagesSonicToday allows you to create more pages in addition to your default dashboard page. Note that only one page may be designated as your SonicToday default page. As soon as a new page is marked as the default, any previous default page settings are overwritten. To create a new page:
1. Click Manage Page from the toolbar to bring up the Page Manager.
2. In the ‘Page’ section, select Add New Page from the drop-down list.
3. Name your new page under ‘Page Title.’
4. Select the layout of your page under ‘Page Layout.’ A thumbnail image pops up alongside each option to assist you.
29SonicWALL ViewPoint 5.0 Administrator’s Guide

Adding a Component Window
5. You also have the option of making this your default page, simply by placing a checkmark in the box labeled ‘Default Page.’
6. Click Add when you are finished. The toolbar now displays the newly added page.In this example, we titled the new page ‘News.’
You can now add and customize component windows to navigate between pages.
Note To edit a page, click Manage Page from the toolbar. Select the page you wish to edit, make your changes, and click Edit to finish.
Note To delete a page, click Manage Page from the toolbar. Select the page you wish to delete and click Delete. Click OK to finish.
Other Features
AutoHideAutoHide is a feature you customize by turning on or off. When AutoHide is turned on, the control bar will hide after an interval of two seconds when the mouse is moved away from the control bar. When AutoHide is turned off, the control bar always appears on the SonicToday dashboard.
To turn AutoHide on, click the Off icon .
To turn AutoHide off, click the On icon
30 SonicWALL ViewPoint 5.0 Administrator’s Guide

Adding a Component Window
Page SelectorWhenever the number of pages added to the SonicToday dashboard exceeds five, a page selector bar appears at the top of the main window with left and right arrows. The arrows can be used to scroll across different pages in both directions. By default, the selector is scrolled to a point where the default page appears on it. Any page can be selected by clicking on the page title.
Component Height Resize
The height of a component can be increased and decreased by stretching or shrinking the resize cursor on the status bar when the mouse is moved over the status bar.
Manual RefreshAside from the automatic refresh, which you configure in the “Editing a Component Window” section on page 24, you can force a refresh on the component window by clicking the refresh icon on the component window header.
Remove or Delete a ComponentAny component window can be removed or deleted from the page by clicking the close icon on the component window header.
31SonicWALL ViewPoint 5.0 Administrator’s Guide

Adding a Component Window
Minimizing or Maximizing a ComponentEach component can be in minimized or maximized state. The components are loaded in the page with the state they were saved in the database.
To minimize a component window, click the minimize icon in the component window header.
To maximize a component window, click the maximize icon in the component window header.
32 SonicWALL ViewPoint 5.0 Administrator’s Guide

CHAPTER 5Configuring User Settings
This chapter describes how to configure the user settings that are available in the Console panel on the User Settings screens.
This chapter includes the following section:
• “General” section on page 33
General This section describes the user settings page to change the ViewPoint administrator password, the ViewPoint inactivity Timeout, and the UI settings.
Figure 12 Console > User Settings > General
33SonicWALL ViewPoint 5.0 Administrator’s Guide

General
Perform the following steps:
1. Enter the old SonicWALL ViewPoint password in the Old ViewPoint Password field.
2. Enter the new SonicWALL ViewPoint password in the New ViewPoint Password field.
3. Reenter the new password in the Confirm New Password field.
Note Password fields will be grayed out for users on a Remote Domain.
4. The ViewPoint Inactivity Timeout period specifies how long SonicWALL ViewPoint waits before logging out an inactive user. To prevent someone from accessing the SonicWALL ViewPoint UI when SonicWALL ViewPoint users are away from their desks, enter an appropriate value in the ViewPoint Inactivity Timeout field. You can disable automatic logout completely by entering a “-1” in this field. The minimum is 5 minutes and the maximum is 120 minutes.
5. Select a value between 10 and 100 in the Max Rows Per Screen field. This value applies only to paginated screens.
6. The Appliance Selection Panel section determines how devices are displayed in the far left panel. You can display only icons (the Icons option), only the name of the appliance (Text), or both icons and names (Icons and text). The default is Icons and Text.
7. When you are finished, click Update. The settings are changed. To clear all screen settings and start over, click Reset.
Note The maximum size of the SonicWALL ViewPoint User ID is 24 alphanumeric characters. The password is one-way hashed and any password of any length can be hashed into a fixed 32 character long internal password.
34 SonicWALL ViewPoint 5.0 Administrator’s Guide

CHAPTER 6Configuring Log Settings
This section describes how to configure Log Settings. This includes adjusting settings on deleting log messages after a certain period of time, and setting criteria for viewing logs.
This chapter includes the following sections:
• “Configuration” section on page 35
• “View Log” section on page 36
Configuration The Log > Configuration screen provides a way to delete log messages older than a specific date.
To delete ViewPoint log messages, perform the following steps:
1. Click the Console tab, expand the Log tree, and click Configuration. The Configuration page displays.
Figure 13 Console > Log > Configuration
2. Select the month, day, and year from the drop down menu.
3. Click Delete Log Messages Older Than.
35SonicWALL ViewPoint 5.0 Administrator’s Guide

View Log
View Log The SonicWALL ViewPoint log keeps track of changes made within the SonicWALL ViewPoint UI, logins, failed logins, logouts, password changes, scheduled tasks, failed tasks, completed tasks, raw syslog database size, syslog message uploads, and time spent summarizing syslog data. To view the SonicWALL ViewPoint log, perform the following steps:
1. Click the Console tab, expand the Log tree, and click View Log. The View Log page displays.
Figure 14 Console > Log > View Log
2. Each log entry contains the following fields:
– #—specifies the number of the log entry.
– Date—specifies the date of the log entry.
– Message—contains a description of the event.
– Severity—displays the severity of the event (Alert, Warning, or FYI).
– SonicWALL—specifies the name of the SonicWALL appliance that generated the event (if applicable).
– User@IP—specifies the user name and IP address.
36 SonicWALL ViewPoint 5.0 Administrator’s Guide

View Log
3. To narrow the search, configure some of the following criteria:
Tip You can press Enter to navigate from one form element to the next in this section.
– Select Time of logs—displays all log entries for a specified range of dates.
– SonicWALL Node—displays all log entries associated with the specified SonicWALL appliance.
– ViewPoint User—displays all log entries with the specified user.
– Message contains—displays all log entries that contain the specified text. This input field provides an auto-suggest functionality that uses existing log message text to predict what you want to type. It fills in the field with the suggested text and you can either press Tab to accept it or keep typing. Different suggestions will appear as you continue to type if log messages match your input.
– Severity—displays log entries with the matching severity level:
–All (Alert, Warning, and FYI)–where FYI mean “For Your Information”
–Alert and Warning
–Alert
– Select the Match case checkbox to make the SonicWALL Node, ViewPoint User, and Message contains search fields case sensitive.
– Select one of Exact Phrase, All Words, or Any Word.
–Exact Phrase matches a log entry that contains exactly what you typed in the Message contains field
–All Words matches a log entry that contains all the words you typed in the Message contains field, but the words can be non-consecutive or in any order
–Any Word matches a log entry that contains any of the words you typed in the Message contains field
4. To view the results of your search criteria, click Start Search. To clear all values from the input fields and start over, click Clear Search. To save the results as an HTML file on your system, click Export Logs and follow the on-screen instructions.
5. To configure how many messages are shown per screen, enter a new value between 10 and 100 in the Show Messages Per Screen field. (default: 10). Click Next to display the next page, or click Previous to display the preceding page.
37SonicWALL ViewPoint 5.0 Administrator’s Guide

View Log
38 SonicWALL ViewPoint 5.0 Administrator’s Guide

CHAPTER 7Configuring the Management Page
This chapter describes the settings available on the Console panel in the Management section. The following sections are found in this chapter:
• “ViewPoint Settings” section on page 39v
• “Alert Settings” section on page 41
• “Sessions” section on page 42
• “ViewPoint Updates” section on page 43
ViewPoint Settings On the ViewPoint Settings page, you can configure email settings, set the system debug level, and synchronize model codes information.
This section describes the following ViewPoint Settings topics:
• “Configuring Email Settings” on page 40
• “Configuring Debug and Synchronizing Model Codes” on page 40
39SonicWALL ViewPoint 5.0 Administrator’s Guide

ViewPoint Settings
Configuring Email SettingsAn SMTP server and an email address are required for sending ViewPoint reports.
To configure these email settings:
1. Click the Console tab.
2. Expand the Management tree and click ViewPoint Settings. The ViewPoint Settings page displays.
3. Type the IP address of the Simple Mail Transfer Protocol (SMTP) server into the SMTP Server field. This server can be the same one that is normally used for email in your network.
4. Type the email account name and domain that will appear in messages sent from the SonicWALL ViewPoint into the ViewPoint Sender’s e-Mail Address field.
5. When finished in the ViewPoint Settings page, click Update. To clear the screen settings and start over, click Reset.
Configuring Debug and Synchronizing Model CodesViewPoint provides a way to send debug messages to the log file, and also allows you to synchronize model codes information.
The Sync Model Codes feature accommodates new SonicWALL product introductions without the need for ViewPoint update. When SonicWALL updates the the corporate server (mysonicwall) with a new product code, it then becomes available to ViewPoint. The task is scheduled to run every 24 hours and is also available manually.
To configure these settings:
1. Select a debug level from the System Debug level drop-down list. The range is 0-3 where a level of 0 provides no debug log messages and a level of 3 provides the maximum number of debug messages.
2. To synchronize the model codes information, click Sync Model Codes information now.
3. When finished in the ViewPoint Settings page, click Update. To clear the screen settings and start over, click Reset.
40 SonicWALL ViewPoint 5.0 Administrator’s Guide

Alert Settings
Alert SettingsThe Alert Settings page specifies which email addresses receive email alerts and notifications during specific times.
To configure the alert notification settings, perform the following steps:
1. Click the Console tab, expand the Management tree and click Alert Settings. The Alert Settings page displays.
Figure 15 Console > Management > Alert Settings
2. Configure the email address(es) that will receive notifications and the times that they will receive them:
– Schedule 1—Specifies who will receive notifications during the first weekday schedule. Enter one or more email addresses (separated by commas) and specify the start and end time for the shift.
– Schedule 2—Specifies who will receive notifications during the second weekday schedule. Enter one or more email addresses (separated by commas) and specify the start and end time for the shift.
– Schedule 3—Specifies who will receive notifications during the third weekday schedule. Enter one or more email addresses (separated by commas) and specify the start and end time for the shift.
41SonicWALL ViewPoint 5.0 Administrator’s Guide

Sessions
– Saturday—Specifies who will receive notifications on Saturday. Enter one or more email addresses (separated by commas) and specify the start and end time for the shift.
– Sunday—Specifies who will receive notifications on Sunday. Enter one or more email addresses (separated by commas) and specify the start and end time for the shift.
3. Select whether the email alert will be sent as HTML, Plain Text, or Plain Text (Pager). The Pager setting sends a very short email to ensure that the email is not cut off by the character limits of some pagers.
4. When you are finished, click Update. The settings are saved.
Sessions The Sessions page of the Management section of the ViewPoint Console allows you to view session statistics for currently logged in ViewPoint users and to end selected sessions.
Managing SessionsOn occasion, it may be necessary to log off other user sessions. To do this, perform the following steps:
1. Click the Console tab, expand the Management tree and click Sessions. The Sessions page displays.
Figure 16 Console > Management > Sessions
2. When more than one session is active, a checkbox is displayed next to each row. Select the check box of each user to log off and click End selected sessions.
The selected users are logged off.
42 SonicWALL ViewPoint 5.0 Administrator’s Guide

ViewPoint Updates
ViewPoint UpdatesThe ViewPoint Updates page provides information for the SonicWALL ViewPoint server. This page lists the ViewPoint components installed on the server, with a checkbox next to each one.
Figure 17 Console > Management > ViewPoint Updates
To download software updates for one or more components, select the checkbox next to the component(s) and then click Download New ViewPoint Software Updates.
To delete one or more components, select the checkbox next to the component(s) and then click Delete Selected Components from List.
43SonicWALL ViewPoint 5.0 Administrator’s Guide

ViewPoint Updates
44 SonicWALL ViewPoint 5.0 Administrator’s Guide

CHAPTER 8Managing Reports in the Console Panel
This section describes how to configure reporting settings on the Console panel. These include how often the summary information is updated, the number of days that summary information is stored, and the number of days that raw data is stored.
The following sections are included in this chapter:
• “Settings” section on page 45
• “Summarizer” section on page 48
• “Email/Archive” section on page 51
• “Scheduled Reports” section on page 52
• “Management” section on page 57
Settings The Settings page under Reports on the Console panel manages the number of days for raw/syslog data storage for reports and provides a check box for enabling the sort option in report tables. You can also specify the number of appliances which can have Log Viewer enabled at the same time.
See the following:
• “Configuring Syslog Data Storage Configuration and Sort Settings” section on page 46
• “Controlling the Number of Appliances with Log Viewer Enabled” section on page 47
45SonicWALL ViewPoint 5.0 Administrator’s Guide

Settings
Configuring Syslog Data Storage Configuration and Sort Settings
ViewPoint requires large amounts of disk space for raw data storage. In previous versions, the maximum raw syslog database size was 2 GB. ViewPoint now provides enhanced database capacity by creating a new 2 GB database everyday. Each file name includes the date it was created for easy reference. Raw syslog data is used to create Custom Reports. See “Configuring and Using Custom Reports” on page 123.
To configure syslog data storage settings and set the sort option for report tables, perform the following steps:
1. Click the Console tab, expand the Reports tree and click Settings.
Figure 18 Console > Reports > Settings
2. Specify the amount of days that you would like to store your syslog data in the Days To Store Raw Data list box and click Update.
3. To enable the report table sort option, select the Enable Sort Option on Report Tables checkbox. To disable sorting, clear the checkbox. Click Update.
46 SonicWALL ViewPoint 5.0 Administrator’s Guide

Settings
Controlling the Number of Appliances with Log Viewer Enabled
You can control the maximum number of managed appliances for which Log Viewer can be enabled. The default setting allows Log Viewer to be enabled on up to five appliances. Because enabling Log Viewer causes raw syslog data uploading, it is resource intensive. Use care in increasing this number, and when enabling Log Viewer on systems.
To change the number of appliances for which Log Viewer can be enabled:
1. On the Console panel, navigate to Reports > Settings.
2. Under Log Viewer Settings, in the Maximum number of appliances on which Log Viewer can be enabled field, enter the number of appliances for which Log Viewer can be enabled. The default is five.
3. Click Update.
Note Limiting the number of appliances for which the Log Viewer is enabled will increase the overall performance of your SonicWALL ViewPoint system.
47SonicWALL ViewPoint 5.0 Administrator’s Guide

Summarizer
SummarizerThis section contains the following subsections:
• “About Summary Data in Reports” on page 48
• “Summarizer Settings” on page 48
About Summary Data in ReportsThese reports are constructed from the most current available summary data. In order to create summary data, the ViewPoint Reporting Module must parse the raw data files.
When configuring ViewPoint Reporting using the screens on the Console panel under Reports, you can select the amount of summary information to store. Make sure the database is large enough to accommodate the number of days that you choose.
Additionally, you can select the number of days that raw syslog data is stored. The raw data is made up of information for every connection. Depending on the amount of traffic, this can quickly consume an enormous amount of space in the database. ViewPoint creates a new 2 GB database for raw syslog data everyday. Be very careful when selecting how much raw information to store. For information on configuring raw data storage, see “Configuring Syslog Data Storage Configuration and Sort Settings” section on page 46.
Summarizer SettingsSonicWALL appliances send their syslog packets to SonicWALL ViewPoint via UDP packets. At the interval you specify, the Summarizer will process those files and store the data in the summary databases. When an appliance is configured to communicate with ViewPoint, you need to verify that the summarizer is scheduled to collect and process data for this unit at an appropriate interval.
To configure reports for summarization, see the “Selecting Reports for Summarization” section on page 99 in the Scheduling and Configuring Reports chapter.
48 SonicWALL ViewPoint 5.0 Administrator’s Guide

Summarizer
To configure Summarizer settings, perform the following steps:
1. Click the Console tab, expand the Reports tree and click Summarizer. The Summarizer page displays.
Figure 19 Console > Reports > Summarizer
2. Specify how often the ViewPoint Reporting Module processes and updates summary information from the Summarize Every list box and click Update.
3. To specify the next summary time, enter a date and time in the Next Scheduled Summary Time field and click Update.
4. To update the summary information now, click the Summarize Now button. SonicWALL ViewPoint will automatically process the latest information and make it available for immediate viewing.
Note This will not affect the normally scheduled summarization updates on ViewPoint.
49SonicWALL ViewPoint 5.0 Administrator’s Guide

Summarizer
5. Select the Enable Web Event Consolidation checkbox to consolidate repetitive syslog event entries within the syslog database, and then select one of the following levels of consolidation:
– Host & Domain - More restrictive, less consolidation
– Domain Only - More general, more consolidation
Enabling Web Event Consolidation promotes search and summarizer efficiency by consolidating the syslog messages that result from a single click (for example, a visit to a Web page), and further correlates events by time proximity, such as multiple visits to the same URL by the same user within a set time, and HTTP header information. ViewPoint consolidates syslog messages under the main domain name.
When Web Event Consolidation is disabled, multiple syslog events are logged for one request. For instance, a single access to www.cnn.com can generate more than 70 syslog messages. Many of the 70 syslog messages refer to the links to other pages like images.cnn.com or video.cnn.com that are included in the Web page. In this simplified example, if Domain Only consolidation is selected, then only one Web event is recorded (cnn.com). If Host & Domain is selected, then you would see three Web events. You would see all 70 Web events if consolidation was not enabled at all.
6. Optionally select the Resolve “Not Rated” categories using message comparison checkbox.
7. In the Reports Summarization Data for Bandwidth Reports section, select the currency type in the Type of Currency field. Over 20 different currencies from around the world are available.
8. Specify an amount based on your chosen currency in the Cost Per Mega Byte Bandwidth Use field.
9. Specify how many days of summarized data the ViewPoint Reporting Module will store in the database from the Days To Store Summarized Data list box (default: 15) and click Update. To save all information, enter All.
Make sure the database is large enough to accommodate the number of days that you choose.
10. To reduce the amount of syslog data stored periodically, specify a time in the Delete Syslog Data Daily at field.
11. To delete summarized data, specify a date in the Delete Summarized Data for field and click Update.
50 SonicWALL ViewPoint 5.0 Administrator’s Guide

Email/Archive
Email/Archive
Configuring Email/Archive SettingsTo configure Email/Archive and Web server settings, perform the following steps:
1. Click the Console tab, expand the Reports tree and click Email/Archive. The Email/Archive page displays.
Figure 20 Console > Reports > Email/Archive
2. This page shows when the next scheduled archive time will occur and when the last weekly and monthly reports were sent.
3. To set the next archive time, enter the date and time in the Next Scheduled Email/Archive Time fields and click Update.
4. To specify the day to send weekly reports, select the day from the Send Weekly Reports Every list box and click Update.
5. To specify the date to send monthly reports, select the date from the Send Monthly Reports Every list box and click Update.
6. Specify the number of days to store archived XML reports in the Days to store XML reports field.
51SonicWALL ViewPoint 5.0 Administrator’s Guide

Scheduled Reports
7. If the Web server address, port, or protocol has changed since SonicWALL ViewPoint was installed, this will affect reporting and you should enter the new address, port, and protocol in the Email/Archive Configuration section.
8. When you are finished, click Update. The changes are saved.
Scheduled Reports The Scheduled Reports page allows you to manage all the report schedules in the system from a central location. This page lists all the schedules in the system, enabling you to monitor the status of these recurring schedules and re-send failed schedules, if needed. For information on adding a new scheduled report, see “Adding or Editing a Scheduled Report” section on page 97.
Under Search Results, the table indicates whether each schedule is enabled, along with information about the last execution time of a schedule, whether it ran successfully and the error that occurred if it failed, the last run type (scheduled or one time run), along with the node, owner and other relevant information.
The Summary section provides status information on your report schedules.
The Search Criteria section provides settings for searching report schedules. Results of your searches are displayed in the Search Results section.
52 SonicWALL ViewPoint 5.0 Administrator’s Guide

Scheduled Reports
To search for scheduled reports:1. Click the Console tab, expand the Reports tree and click Scheduled Reports. The
Scheduled Reports page displays.
Figure 21 Console > Reports > Scheduled Reports
2. Define the Search Criteria tab. The Search Criteria tab contains the following elements to refine your search:
– Schedule Type - Select from the following schedule types:
–All Schedules
–Daily Schedules
–Weekly Schedules
–Monthly Schedules
– Status - Select from the following status conditions:
–All
–Failed
–In Progress
–Success
53SonicWALL ViewPoint 5.0 Administrator’s Guide

Scheduled Reports
–In Queue
–Partial Failure
– SonicWALL Node - Select from the following SonicWALL nodes:
–All
–Per Unit View
– Owner - Displays the owner (admin).
– Name Contains - Enter a context string to search by keywords.
– Error Contains - Enter a context string to search by keywords.
– Use Condition - Select from the following conditions:
–And
–Or
– Match Case - Select this checkbox to make your searches case sensitive.
3. Click Start Search to begin searching, or click Clear Search to reset all fields and start over.
The results of your search are displayed in a table in the Search Results section. You can adjust the number of schedules displayed, go directly to a row of the table, or navigate to other screens by clicking on links within the table.
To work with the search results:1. To adjust the number of schedules displayed in the table, enter a number of rows to
display in the Show Schedules Per Screen field, and then click on the checkmark.
2. To go directly to a row of the table, enter the row number in the Go To Schedule Number field, and then click on the checkmark.
3. The columns in the table are as follows:
– The check box allows you select the schedule for emailing or archiving.
– The notepad icon is a link to the Schedule Properties page.
– ID - The schedule ID number used to identify this schedule. You can click on the column heading to sort by this field. An arrow is displayed in the column heading when this field is the basis for sorting, and indicates ascending or descending order.
– Enabled - A green check mark indicates that this schedule is enabled, and a red X means that it is disabled.
– Name - The name of the report. Click on the highlighted report name link to access the report for editing. You can click on the column heading to sort by this field. An arrow is displayed in the column heading when this field is the basis for sorting, and indicates ascending or descending order.
54 SonicWALL ViewPoint 5.0 Administrator’s Guide

Scheduled Reports
– Type - All, Daily Schedules, Weekly Schedules, and Monthly Schedules.
– Unit/Group/Devices(s) - The host name of the SonicWALL appliance.
– Last Run (Local) - The date when the report was last generated. You can click on the column heading to sort by this field. An arrow is displayed in the column heading when this field is the basis for sorting, and indicates ascending or descending order.
– Status - Includes the following report status options:
–Blue: Queued, waiting to be processed.
–Yellow: Currently processing.
–Orange: Report completed with errors.
–Red: Report failed with errors.
–Green: Report processed successfully.
You can click on the column heading to sort by this field. An arrow is displayed in the column heading when this field is the basis for sorting, and indicates ascending or descending order.
– Last Run Type - Indicates if the most recent run was a scheduled run or a one-time execution. You can click on the column heading to sort by this field. An arrow is displayed in the column heading when this field is the basis for sorting, and indicates ascending or descending order.
– Last Error - Displays the error condition from the most recent run, if any. You can click on the column heading to sort by this field. An arrow is displayed in the column heading when this field is the basis for sorting, and indicates ascending or descending order.
– Owner - Indicates the user ID of the user who created the schedule. You can click on the column heading to sort by this field. An arrow is displayed in the column heading when this field is the basis for sorting, and indicates ascending or descending order.
4. To view the properties for a schedule, click the notepad icon in that row. The Schedule Properties page displays.
5. To view the report, click on the name of the report. Your screen will change to the report screen on the Firewall or SSL-VPN panel.
55SonicWALL ViewPoint 5.0 Administrator’s Guide

Scheduled Reports
Resending SchedulesApart from selecting multiple schedules for a one-time execution by selecting the appropriate checkboxes and clicking the Email/Archive the Selected Schedules now, you can re-send required schedules using the Re-send the selected schedules for dates option.
Figure 22 Scheduled Reports Screen - Lower Section
To resend any schedules, follow the procedures below:
1. Select the Schedule Type (Daily, Weekly, or Monthly) from the Search Criteria section and click Start Search. This lists all the schedules of the selected type. Select the checkboxes of the schedules you want to resend.
2. Provide a start date (and an end date if applicable). Reports are generated for the specified date/date range.
3. Click Re-send the selected schedules for dates. Reports are generated for the specific dates and emailed/archived as a one time option for all the schedules selected.
56 SonicWALL ViewPoint 5.0 Administrator’s Guide

Management
Management Report Data Management allows the SonicWALL ViewPoint administrator to backup large amounts of report data incrementally and at specified intervals using MDTA. Typically, the total amount of data stored in an archive is equal to at least 30 days, although best benefits are seen when storing at least 60 days of summarizer data. MDTA allows this archive to be built over time, archiving as little as 1 day of data each time the MDTA process is run.
Note Total days to store summarized data in reports is set separately in the Console > Reports > Summarizer screen. Set this field for a value greater than 60 days for best results.
Figure 23 Console > Reports > Management
57SonicWALL ViewPoint 5.0 Administrator’s Guide

Management
Configuring Report Data ManagementAs an administrator, you choose the number of days worth of data to archive each time the MDTA process is run. With the exception of the current month, all available data is eligible for archiving. For example, if you specify 3 days as the number of days to archive, MDTA will archive 3 days of data, starting with the oldest available data and will repeat this process every day. In order to obtain optimal performance when viewing reports however, SonicWALL ViewPoint ensures that the current month is always kept in un-archived form.
Step 1 In the ViewPoint Administrator Interface, navigate to Console > Reports > Management.
Step 2 Check the box next to Enable Data Archive and click the corresponding Update button.
Step 3 Configure Data Archiving as follows, clicking the corresponding Update button after each line is completed:
Note High-traffic systems can generate reports that consume large amounts of memory, disk space and CPU time when using MDTA. Set your Number of Days to Archive and Scheduled Archive Time accordingly. To view when MDTA operations are starting and how long the process is taking, navigate to the Console > Log > View Log screen and look (or search) for or “start” and “completed” times for “Report Data Archive.”
Save Data Archive Transaction Logs
Select to save truncated data archive transaction logs during each MDTA operation. Click the Update button. This option is deselected by default in order to conserve disk space.
Next Scheduled Archive Time
Schedule an initial date (mm/dd/yyyy) and time (in 24-hour format) for the MDTA operation. Click the Update button. MDTA operations will take place every day at the time you specify, starting with your initial date selection.
Number of Days to Archive
Specify the number of days worth of data to consider for each MDTA operation.
Archive Data Immediately
Press this button to immediately start an on-demand MDTA operation. The archive will run immediately but your scheduled archive operation will still take place.
58 SonicWALL ViewPoint 5.0 Administrator’s Guide

CHAPTER 9Using Diagnostics
This chapter describes the diagnostic information that ViewPoint provides, including database capacity planning tools and summarizer status information.
This chapter includes the following sections:
• “Capacity Planning” section on page 59
• “Summarizer Status” section on page 62
Capacity Planning The Capacity Planning feature provides performance metrics for your network administrator to plan, design, and expand your ViewPoint server deployment. One of the challenges of growing a network is to know when you may need to add a new server into your deployment. The Capacity Planning feature provides a convenient lookup that details when you may need to add new resources to your network. This feature has information on the Syslog Collector and Summarizer metrics. The Summarizer metrics are available only for ViewPoint deployments and that have Distributed Summarizer enabled (enabled by default on ViewPoint 5.0). The metrics are available for the past 24 hours, past seven days, and past 30 days.
These metrics are reset (to zero), every 24 hours for daily metrics, every seven days for weekly metrics, and every 30 days for monthly metrics. Weekly metrics are not shown unless the data collection for weekly metrics started earlier than the daily metrics. Similarly, monthly metrics are not shown unless data collection for monthly metrics started earlier than for daily and weekly metrics. ViewPoint will not display metrics for a component if the daily statistics collection started more than 26 hours earlier. This will generally indicate that the component is not active.
59SonicWALL ViewPoint 5.0 Administrator’s Guide

Capacity Planning
Figure 24 Console > Diagnostics > Capacity Planning
To reach the Capacity Planning screen, go to the Console panel of ViewPoint and then navigate to Diagnostics > Capacity Planning. The Dial Charts show the percent of total capacity used by the Syslog Collector or the Summarizer. Results are calculated over the last 5 days.
For the Syslog Collector, the calculation measures the amount of idle time spent waiting for syslog packets to arrive compared to the amount of time spent reading and processing syslog packets. A result of 100% would indicate that during at least one sampling period in the last 5 days, the Syslog Collector spent no time waiting for packets.
60 SonicWALL ViewPoint 5.0 Administrator’s Guide

Capacity Planning
For the Summarizer, the calculation measures the total time the summarizer is running compared to the time it is sleeping. Maximum capacity for the Summarizer is considered to be 12 hours per day of run-time. As shown above, 52% of capacity indicates that the Summarizer had a peak execution time of over 6 hours (52% of 12 hours) in at least one of the last 5 days.
As another example, the average syslogs summarized per minute on a system is 18,108. The average number of syslogs received on that system is 91 per firewall, per minute. For a reasonable estimate of the total number of security appliances this system should be able to handle, assuming that the Summarizer was to constantly summarize 24 hours (as in the case of a dedicated Summarizer), divide the number of syslogs per minute (18,108) by the number of syslogs per appliance per minute (91). This yields an estimate of 198 security appliances, assuming that the current appliances are a fair sample of the security appliances on your network.
61SonicWALL ViewPoint 5.0 Administrator’s Guide

Summarizer Status
Summarizer StatusThe Summarizer Status page displays information on the current status of the selected summarizer.
Figure 25 Console > Diagnostics > Summarizer Status
62 SonicWALL ViewPoint 5.0 Administrator’s Guide

Summarizer Status
The Summarizer Status page is divided into four sections:
Summarizer Information:
• Summarizer: Select which summarizer you are viewing status for. The summarizers are listed by IP address, for example: 192.168.168.10
Syslog File Information
The Syslog File Information table is divided into three columns:
• Syslog File Type: The type of files being reported on.
There are ten main syslog file types:
– Processed Files
– Unprocessed Files
– Grouped Files
– Not Mine Files
– Infected Files
– Archived Files
– Bad Files
– Upload Pending Files
– Uploaded Files
– Bad Upload Files
• File Stats: The number of syslog files in the category and their size in Megabytes.
• Oldest: The date and time on the oldest file in the category.
Summarizer Thread Information
The Summarizer Thread Information shows what tasks the summarizer is performing at the moment the Console > Diagnostics > Summarizer Status page displays. Refresh your browser display or leave the page and return to it to update the information.
Summarizer Statistics
The Summarizer Statistics report on the tasks the summarizer has performed in and on where it is in its schedule:
• Over the past 24 hours
– Number of Syslogs Summarized (and time taken)
– Average Syslogs Summarized Per Minute
• Over the past 7 days
– Number of Syslogs Summarized (and time taken)
– Average Syslogs Summarized Per Minute
63SonicWALL ViewPoint 5.0 Administrator’s Guide

Summarizer Status
• Over the past 30 days
– Number of Syslogs Summarized (and time taken)
– Average Syslogs Summarized Per Minute
• Summarizer Memory Consumption (in bytes)
• Last Run Time
• Next Run Time
64 SonicWALL ViewPoint 5.0 Administrator’s Guide

CHAPTER 10Granular Event Management
This chapter describes how to configure and use the Granular Event Management (GEM) feature in a ViewPoint environment.
This chapter contains the following sections:
• “Granular Event Management Overview” section on page 65
• “Using Granular Event Management” section on page 67
• “Configuring Granular Event Management” section on page 69
• “Viewing Current Alerts” section on page 76
Granular Event Management OverviewGranular Event Management (GEM) provides a customized and controlled manner in which events are managed and alerts are customized and enabled. On the Console panel, GEM allows you to systematically configure each sub-component of your alert in order for the alert to best accommodate your needs.
The GEM alert has multiple sub-components, some of which have further subcomponents. It is not necessary to configure all sub-components prior to creating an alert.
• Severities: Severity is used to tag an alert as Critical, Warning, or Information. Severities are included within each Threshold. You can change the severity levels of the threshold elements listed on the Console > Events > Threshold page.
• Thresholds: A threshold defines the condition that must be matched to trigger an event and send an alert. Each threshold is associated with a Severity to tag the generated alert as critical, warning, or information.
65SonicWALL ViewPoint 5.0 Administrator’s Guide

Granular Event Management Overview
One or more threshold elements are defined within a threshold. Each threshold includes the following elements: an Operator, a Value, and a Severity. When a value is received for an alert type, the GEM framework examines threshold elements to find a match for the specified condition. If a match is found (one or more conditions match), the threshold with the highest severity containing a matching element is used to trigger an event.
• Schedules: You can use Schedules to specify the day(s) and time (intervals) in which to generate an alert. You can also invert a schedule, which means that the schedule is the opposite of the time specified in it. For example:
– Generate an alert during weekdays only, or weekends only, or only during business hours.
– Do not generate an alert during a time period when the unit, network, or database are down for maintenance.
What is Granular Event Management?The purpose of Granular Event Management is to provide all the event handling and alerting functionality for ViewPoint. The ViewPoint management interface provides screens for centralized event management on the Console panel, including screens for Events > Threshold, Schedule, and Alert Settings. The Firewall panel also provides an Events > Alert Settings screen where you can enable or disable alerts.
You can enable or disable an alert at the global or unit level in ViewPoint. At the global level, the alert is then applied to all units. Whenever you add a new unit to ViewPoint, the alerts set at the global level are applied to the new unit.
How Does Granular Event Management Work?The Granular Event Management framework provides customized event handlingfor specific alerts about database and database log size, and security service subscription licenses. For a list of the predefined alerts, see “Using Granular Event Management” on page 67.
66 SonicWALL ViewPoint 5.0 Administrator’s Guide

Using Granular Event Management
Using Granular Event ManagementFor convenience and usability, a number of default settings are predefined for severities, schedules, thresholds, and alerts. You can edit the predefined values to customize the settings for thresholds and schedules. The predefined defaults for each panel and screen are as follows:
Table 1 GEM Predefined Default Objects
Panel Screens Predefined Default ObjectsConsole Events > Thresholds Unit Status
Database Size Status
Database Log Size Status (on MySQL DB only)
Console Events > Schedule Schedule Groups:
• 24x7
• Weekdays 24 hours
• 8x5
• Weekend
Schedules:
• Schedule: admin
• Monday 24 hours
• Monday business hours
• Tuesday 24 hours
• Tuesday business hours
• Wednesday 24 hours
• Wednesday business hours
• Thursday 24 hours
• Thursday business hours
• Friday 24 hours
• Friday business hours
• Saturday 24 hours
• Sunday 24 hours
Console Events > Alert Settings Database Info
Database Size Status
67SonicWALL ViewPoint 5.0 Administrator’s Guide

Using Granular Event Management
About AlertsThe Events > Alert Settings screens are available in the Console and Firewall panels. You can enable or disable alerts on these screens.
The GEM framework provides different types of alert types for the respective areas of the ViewPoint application:
• Firewall panel: Alert settings for Reporting
• Console panel: Alert settings for the ViewPoint application
Table 2 GEM Alert Types
Database Log Size Status (on MySQL DB only)
Firewall Events > Alert Settings Intrusion License
Anti Spyware License
Warranty License
CFS License
Anti Virus License
Panel Screens Predefined Default Objects
Panel location Available Alert Types Console Date Base Info
Database Size Status
Database Log Size Status (on MySQL DB only)
Firewall Anti Virus License
CFS License
Warranty License
Anti Spyware License
Intrusion License
68 SonicWALL ViewPoint 5.0 Administrator’s Guide

Configuring Granular Event Management
Configuring Granular Event ManagementTo set up the GEM environment after installing ViewPoint, start with the Events screens on the Console panel. You should examine the Threshold and Schedule screens and make any necessary configuration changes. Then you can enable alerts in the Events screens on the Console panel and Firewall panel.
See the following sections:
• “Configuring Events on the Console Panel” section on page 69
• “Enabling or Disabling Alerts on the Firewall Panel” section on page 75
Configuring Events on the Console PanelIn the Events screens on the Console panel, you can configure the frequency of subscription expiration and task failure notifications, as well as severities, thresholds, schedules, and alerts for handling events.
See the following sections:
• “Configuring Event Thresholds” on page 69
• “Configuring Event Schedules” on page 72
• “Enabling or Disabling Alerts on the Console Panel” on page 75
Configuring Event ThresholdsIn the Events > Threshold screen, you can view existing event thresholds and configure their elements, and add custom thresholds. A threshold defines the condition for which an event is triggered. Predefined thresholds have names similar to predefined Alert Types. Each threshold can contain one or more threshold elements. An element consists of an Operator, a Value, and a Severity.
The following tasks are described in this section:
• “Editing an Event Threshold Element” on page 70
• “Enabling/Disabling Event Thresholds and Threshold Elements” on page 71
69SonicWALL ViewPoint 5.0 Administrator’s Guide

Configuring Granular Event Management
Editing an Event Threshold Element
To edit an existing element of a Threshold, perform the following steps:
1. On the Events > Threshold screen, click the Edit icon located in the Configure column in the element row.
2. In the Edit Threshold Element window, you can edit the following fields:
– Operator
– Value
– Description
– Severity
– Disable
3. In the Operator field, select from the drop down menu the type of operator to apply to your threshold element..
4. In the Value field, enter the value for your threshold element.
5. In the Description field, enter the description for your threshold element.
70 SonicWALL ViewPoint 5.0 Administrator’s Guide

Configuring Granular Event Management
6. In the Severity field, select the severity priority from the drop down menu. These are color coded for your easy reference on the Events > Threshold screen.
7. To disable the threshold element, click the Disable check box. See “Enabling/Disabling Event Thresholds and Threshold Elements” section on page 71.
8. Click Update.
Enabling/Disabling Event Thresholds and Threshold Elements
The GEM feature provides a Disable check box that allows you to disable or enable thresholds or individual elements within that threshold. If it is needed again, you can simply enable it.
You can disable a threshold by disabling all its elements. You can also disable individual elements within a threshold.
To enable or disable Thresholds and/or their elements, perform the following tasks:
1. On the Console panel, navigate to the Events > Threshold screen. On this screen, you are able to view existing Thresholds. You can also view existing elements within those thresholds by clicking the expand button by a threshold. You have the following two options for the enabling/disabling feature:
– You can enable or disable a Threshold by disabling/enabling all the elements that exist within it.
– You can enable/disable the individual elements within a Threshold.
2. To enable or disable a threshold and/or elements, click the edit button that is on the element level.
71SonicWALL ViewPoint 5.0 Administrator’s Guide

Configuring Granular Event Management
3. Select the Disable checkbox to disable the element or de-select the Disable checkbox to enable the element.
4. Click Update.
Configuring Event SchedulesThe next component on the Console panel is Events > Schedule. In this screen, you can add, delete, or configure schedules and schedule groups.
Schedule groups are one or more schedules grouped within an object. Administrators and Owners can edit these objects. Other users should be able to view or use them only if the Visible to Non-Administrators check box is selected.
The following tasks are described in this section:
• “Adding an Event Schedule” on page 72
• “Editing an Event Schedule” on page 74
• “Adding an Event Schedule Group” on page 74
• “Deleting a Schedule or Schedule Group” on page 75
Adding an Event Schedule
In Events > Schedules you can add, delete, or configure schedules. You will see your schedules and schedule groups, their descriptions, and whether they are enabled. You can also individually delete one schedule or schedule group at a time by selecting the trash-icon on the right hand side for each row. For quick reference, you can hover your mouse over the descriptions to quickly view the type of schedule and the days and times when it is active.
To add an event schedule, perform the following steps:
1. On the Events > Schedules screen, click Add Schedule.
2. Select the Visible to Non-Administrators check box if you want the schedule to be visible and usable by non-administrators.
3. To temporarily disable a schedule, select the Disable checkbox.
72 SonicWALL ViewPoint 5.0 Administrator’s Guide

Configuring Granular Event Management
4. Click Invert to create a schedule that is “off ” during the dates and times that you specify.
5. In the Schedule field, you can create one or more schedules. For each schedule, configure either:
• One Time Occurrence
–Fill in the Date and Time fields.
• Recurrence
–Fill in Days, Start Time, and End Time fields.
6. Click Add to add this schedule to the Schedule List text box.
7. To delete an entry from the Schedule List text box, select the entry that you want to delete, and then click Delete. Click Delete All to delete all entries.
8. Click Update when you are finished.
73SonicWALL ViewPoint 5.0 Administrator’s Guide

Configuring Granular Event Management
Editing an Event Schedule
To edit an existing schedule, click the Edit icon on the right side of the Events > Schedule screen. The screen and procedure for editing are the same as those for adding a schedule. See “Adding an Event Schedule” section on page 72.
Adding an Event Schedule Group
You can combine several schedules into a schedule group on the Events > Schedule screen. To add a schedule group, perform the following steps:
1. On the Events > Schedule screen, click the Add Schedule Group button.
2. Enter the name of your schedule group in the Name field.
3. Enter a description of your schedule group in the Description field.
4. Click the Visible to Non-Administrators check box to allow this schedule group to be viewed and used by non administrators.
5. Click the Disable check box to temporarily disable the schedule group.
6. In the Schedules field, select the schedule(s) to add to your schedule group, and then use the arrow buttons to move the selected schedule into or out of the group. To move multiple schedule groups and/or schedules all at once, hold the CTRL button on your keyboard while making your selections.
7. Click Update.
74 SonicWALL ViewPoint 5.0 Administrator’s Guide

Configuring Granular Event Management
Deleting a Schedule or Schedule Group
You can delete schedules or schedule groups, or you can remove schedules from schedule groups.
To delete an event schedule, schedule group, or remove a schedule from a schedule group:
1. Navigate to the Events > Schedule screen.
2. Click the check boxes of the schedule groups or schedules that you want deleted. When you click the schedule group check box, the schedules within that schedule group will be deleted as well.
3. To remove a schedule from a schedule group, click the expand button on the schedule group, and select the schedules you wish to remove within that group.
4. To delete the selected schedule group(s) or remove the selected schedules from a group, click the Delete Schedule Group(s)/Remove Schedules from Group button.
5. To delete the selected schedule(s), click the Delete Schedule(s) button.
Enabling or Disabling Alerts on the Console PanelThe Console > Events > Alert Settings screen provides three predefined alerts that apply to ViewPoint as a whole. You can hover your mouse over these to display information about them. You can enable or disable these alerts by selecting or clearing the checkbox in the Enable column for the alert.
Enabling or Disabling Alerts on the Firewall PanelYou can enable or disable alerts for events pertaining to security services licenses on the Firewall panel.To enable or disable an alert:
1. To enable an alert, select the checkbox under Enabled in the row for the alert.
2. To disable an alert, clear the checkbox under Enabled in the row for the alert.
3. Click Enable/Disable Alert(s).
75SonicWALL ViewPoint 5.0 Administrator’s Guide

Viewing Current Alerts
Viewing Current AlertsYou can view a list of current alerts on the Events > Current Alerts page of the Firewall panel. Select a global view or unit to view current alerts for your selection.
76 SonicWALL ViewPoint 5.0 Administrator’s Guide

CHAPTER 11ViewPoint Reporting Features
This chapter describes how to use ViewPoint reporting, including the type of information that can appear in reports. A description of the available features in the user interface is provided. Settings for reporting on the Console panel are described, as well as information about the reporting customization tool for creating report templates.
This chapter includes the following sections:
• “ViewPoint Reporting Overview” section on page 77
• “Navigating ViewPoint Reporting” section on page 81
• “Managing ViewPoint Reports on the Console Panel” section on page 93
ViewPoint Reporting OverviewMonitoring critical network events and activity, such as security threats, inappropriate Web use, and bandwidth levels, is an essential component of network security. ViewPoint Reporting complements SonicWALL's Internet security offerings by providing detailed and comprehensive reports of network activity.
The ViewPoint Reporting Module is a software application that creates dynamic, Web-based network reports. The ViewPoint Reporting Module generates both real-time and historical reports to offer a complete view of all activity through SonicWALL Internet security appliances. With ViewPoint Reporting, you can monitor network access, enhance security, and anticipate future bandwidth needs.
You can search saved reports by using the report search bar, available in most report screens in the ViewPoint UI. The search bar provides pre-populated quick settings for the search field, and a drop-down calendar for the start and end dates. The search operator field offers a comprehensive list of search operators that varies depending on the search field, which can be either text-based or numeric.
77SonicWALL ViewPoint 5.0 Administrator’s Guide

ViewPoint Reporting Overview
You can search all columns of report data except columns that contain computed values, such as %, Cost, or Browse Time. ViewPoint waits until you click Search before it begins building the new report.
The ViewPoint Reporting Module:
• Displays bandwidth use by IP address and service
• Identifies inappropriate Web use
• Provides detailed reports of attacks
• Collects and aggregates system and network errors
• Shows VPN events and problems
• Tracks Web usage by users and by Web sites visited
• Provides detailed daily firewall logs to analyze specific events.
Note The ViewPoint Reporting Module receives its information from the stream of syslog data sent by each SonicWALL appliance and stores it in the SonicWALL ViewPoint database or as files on the hard-disk.
78 SonicWALL ViewPoint 5.0 Administrator’s Guide

ViewPoint Reporting Overview
Viewing ViewPoint ReportsThe ViewPoint reports are available on the Firewall tab of the ViewPoint interface:
Figure 26 ViewPoint Firewall Tab
The ViewPoint Reports view is divided into three panes:
Figure 27 The ViewPoint Reports View
• A list of views and individual units referred to as the TreeControl: In the left pane, you can select a view or unit to display reports that apply to the selected view or unit. MyReportsView is the default selection and is also referred to as the global view.
• A list of reports: The reports available in this list change according to your selection in the TreeControl pane. The reports are divided into categories. You can click on the plus sign next to a category to view the list of reports in that category. You can click on an individual report name to view that report.
79SonicWALL ViewPoint 5.0 Administrator’s Guide

ViewPoint Reporting Overview
• The report: The right pane displays the report that you selected in the middle pane for the view or unit that you selected in the TreeControl. For most reports, the search bar is provided at the top of the pane. Above the search bar a link to the Scheduler is provided. You can change the time for the report to run by clicking the Schedule link or its clock icon in the upper right. A quick access link to your system’s printer is also available in the upper right corner. To print the report, click the Print link or icon. To access the display settings for the report, click More Options to the right of the search bar.
The SonicWALL ViewPoint reporting feature provides the following configurable reports:
Table 3 Configurable Reports
General Provides general unit and license status.Dashboard Provides a high-level activity summary.Custom Report* Provides Web activity report with details from raw data
*Custom Reports are only available at the unit level.Bandwidth Provides bandwidth usage reports.Services* Provides events and usage by service protocol.
*Services reporting is only available at the unit level.Web Usage Provides Web usage reports.Web Filter Provides web filter event reports.FTP Usage Provides FTP usage reports.Mail Usage Provides mail usage reports.VPN Usage Provides VPN usage reports.Attacks Provides attack event reports.Virus Attacks Provides virus attack event reports.Anti-Spyware Provides spyware event reports.Intrusion Prevention Provides intrusion event reports.Authentication Provides login reports.
80 SonicWALL ViewPoint 5.0 Administrator’s Guide

Navigating ViewPoint Reporting
Navigating ViewPoint ReportingViewPoint Reporting is a robust and powerful tool you can use to view detailed reports for individual SonicWALL appliances.
This section describes each view and what to consider when making changes. It also describes the Search Bar and display options for interactive reports, as well as other enhancements provided in SonicWALL ViewPoint . See the following sections:
• “Global Views” on page 82
• “Unit View” on page 83
• “Using Interactive Reports” on page 84
• “Searching for a Report” on page 85
• “Collapsible TreeControl Pane” on page 90
• “Enable/Disable Scheduled Reports” on page 91
• “Combined Reports” on page 91
• “Improved Navigation” on page 91
81SonicWALL ViewPoint 5.0 Administrator’s Guide

Navigating ViewPoint Reporting
Global ViewsFrom the Global view of the Firewall Panel, Summary and Over Time reports are available for all SonicWALL appliances connected to SonicWALL ViewPoint.
To open the Global view, click the MyReportsView icon in the upper-left hand corner of the left pane.
Figure 28 Global View Reports Page Showing the Dashboard Summary
As you navigate the SonicWALL ViewPoint Reports Panel screens with the Global view selected and view different reports, the settings that you specify are maintained in effect throughout the session.
82 SonicWALL ViewPoint 5.0 Administrator’s Guide

Navigating ViewPoint Reporting
Unit ViewFrom the Unit view of the Firewall panel, reports contain detailed data for the selected SonicWALL appliance. To open the Unit view, click the Firewall tab. Then, click a SonicWALL appliance in the left pane of the SonicWALL ViewPoint UI. The report page for the SonicWALL appliance displays.
Figure 29 Unit View Reports Page Showing the Dashboard > Summary
As you navigate the Firewall panel with a single SonicWALL appliance selected and change settings, those settings will remain in effect throughout the session.
83SonicWALL ViewPoint 5.0 Administrator’s Guide

Navigating ViewPoint Reporting
Using Interactive ReportsViewPoint provides interactive reporting to create a clear and visually pleasing display of information. The following figures provide examples of an interactive report graph and a pie chart for Summary and Top Users. You can control the way the information is displayed by adjusting the settings which are collapsed in the search bar.
Figure 30 Interactive Report Graph
Figure 31 Pie Chart
84 SonicWALL ViewPoint 5.0 Administrator’s Guide

Navigating ViewPoint Reporting
Searching for a ReportThe search bar feature provides search and configuration capabilities for every report. In addition to the original quickset functions, the search bar has intuitive search fields to provide context-based searching.
Figure 32 Search Bar Tool
The search bar contains a number of helpful components that allow you to specify search parameters and locate a report with ease. The components of the search bar include:
• A column drop-down list: The searchable column drop-down list contains all the searchable columns of a report. It is context-based, containing different options in different reports. The column drop-down list defines criteria for the search and filter functions.
• An operator drop-down list: There are two types of operator sets. If the content of the selected column is character-based, a character-based list is displayed. If the column contains numerical data, a list with mathematical symbols is displayed.
• A search text field: You can input a search string into this field.
• Start date and end date calendar fields: You can also search for reports by date. Clicking on the Start field displays a drop-down calendar where you can select day, month, and year by using the side arrows to navigate. You may also navigate through dates by clicking on the arrows located beside the start date and the end date fields.
• Detailed drop-down menu
85SonicWALL ViewPoint 5.0 Administrator’s Guide

Navigating ViewPoint Reporting
The collapsed and expanded Search Bar views are shown below:
Figure 33 Search Bar Collapsed
Figure 34 Search Bar Expanded
86 SonicWALL ViewPoint 5.0 Administrator’s Guide

Navigating ViewPoint Reporting
The search bar feature consists of a column drop-down list, an operator drop-down list, a search text field, and a detailed pull-down menu. Search/Filter functions can be performed by utilizing various components reporting at unit level.
The drop-down list contains all the searchable columns of a report. It is context-based, meaning that it contains different options in different reports. The column drop-down list defines criteria for search and filter functions to work on.
Figure 35 Column Drop-down List
There are two different operator sets. If the content of the selected column is character-based, the character based operators will show as demonstrated in Figure 36.
Figure 36 Character-based Operators
A character-based list contains Equals, Start with, End with, and Contains operators. If the content of the selected column contains numerical data, a list with mathematical symbols plus the between operator selection will display as shown in Figure 37.
Figure 37 Numerical Data-based Operators
87SonicWALL ViewPoint 5.0 Administrator’s Guide

Navigating ViewPoint Reporting
Figure 38 shows a generated report with user name (Users) starting with (Start With) “10.50.20” (the value of the search text field).
Figure 38 Report with User-filtered
88 SonicWALL ViewPoint 5.0 Administrator’s Guide

Navigating ViewPoint Reporting
Figure 39 shows a generated report in which the Hit count (Hits column) is greater than (>) “100” (the value of the search field).
Figure 39 Reports with Hits-filtered
Figure 40 shows the calendar module of the search bar. You can use the calendar module to easily select a date for the Start or End field. You can also manually type in a date. For single day reports, the End field is disabled.
Figure 40 Calendar
89SonicWALL ViewPoint 5.0 Administrator’s Guide

Navigating ViewPoint Reporting
The detailed options are “per report” based. For example, if you select “PIE” as the chart type for report A, you will still see Bar chart in report B if the bar chart was the existing chart type. The detailed drop-down menu can be expanded by clicking More Options as shown in the red circle below.
As Figure 41 and Figure 42 show, the options in the detailed drop-down menu are context-based. Figure 41 shows the detailed options of the “Web Usage By User” report. As you can see, Figure 42 contains different options because it is specific to the By User report.
Figure 41 Context-based Detail Options
Figure 42 Web Usage by User - Report Display Settings
Collapsible TreeControl PaneThe unit TreeControl pane can be collapsed to free up screen space by clicking on the the small arrow button to the right of the Add Unit, Modify Unit, Refresh, and Find buttons above the TreeControl pane. The panel can be brought back by clicking the same button.
90 SonicWALL ViewPoint 5.0 Administrator’s Guide

Navigating ViewPoint Reporting
Enable/Disable Scheduled ReportsViewPoint allows you to disable a scheduled report without deleting it. This allows you to re-use the report at a later time without having to create it again. To enable or disable a report, navigate to the Configuration > Scheduled Reports page under the Firewall tab. This screen shows all the scheduled reports on the current appliance. Select the checkbox in the row for a report(s) that you wish to disable, and click the Disable Selected Scheduled Reports button above the table. After confirmation, the check mark in the Enabled column is grayed out. To re-enable the report, use the Enable Selected Scheduled Reports button above the table.
Combined ReportsUsers familiar with ViewPoint 4.0 will find two categories of reports that are no longer visible on the function tree: the Browse Time report and the ROI report. The information from these two reports have been folded into the Web Usage and Bandwidth reports, respectively. The Web Usage report pages now feature a Browse Time column. The Bandwidth report pages feature a Cost($) column that displays all the information previously displayed by the ROI reports.
Improved NavigationTo save time, ViewPoint now features linked reports. Web Usage and Web Filter reports now link their By User and By Site pages. It is now possible to navigate directly from the Web Usage > By User page to a Web Usage > By Site page or from the Web Filter > By User page to a Web Filter > By Site page detailing the information of the site that the user has been browsing. Click the Plus sign next to the entry in the User column to show details, and hover the mouse over a site. A sticky tooltip will display with a link to the corresponding site’s report page. This makes navigating from one report to the next much easier and makes retrieving detailed information simple.
91SonicWALL ViewPoint 5.0 Administrator’s Guide

Navigating ViewPoint Reporting
Sample Navigation Use CaseThis sample use case demonstrates the improved navigation feature. In this use case you will open up the Web Usage> By User report and observe what sites the top browser has been visiting. Then you will move directly from the By User report to a detailed By Site report.
1. Navigate to the Web Usage> By User report from the Firewall tab.
2. Click the Plus button next to any IP address in the User column. This displays detailed information about the sites that the user at that address has been visiting.
3. Hover your mouse over a site in this list. Click the Navigate to Top Visited Web Sites By Site link to navigate directly to the Web Usage> By Site report page.
92 SonicWALL ViewPoint 5.0 Administrator’s Guide

Managing ViewPoint Reports on the Console Panel
The Web Usage> By Site report page shows detailed information about Web traffic to this site. Information in this report include the IP addresses of users who have browsed that site, as well as how much time they have spent browsing.
Managing ViewPoint Reports on the Console Panel
There are management settings for the ViewPoint Reporting Module on the ViewPoint Console panel. The Firewall panel contains limited configuration screens, used for managing scheduled reports.
The Reports section on the Console panel is divided into sections that allow you to manage the following:
Table 4 Console > Reports
Section SettingsSettings Data Storage Configuration
Report Settings/Options
Log Viewer Settings
Summarizer
Reports Data Summarization Interval
Reports Summarization Data for Top Usage
Reports Summarization Data for Bandwidth Reports
Days to store Summarized Reports data in Database
Email/Archive Email/Archive Time Settings
Days to Store Archived/Published reports
Email/Archive Configuration - Web Server Details
Scheduled Reports Summary
Search Criteria
Search Results
Management Report Data Management Settings
93SonicWALL ViewPoint 5.0 Administrator’s Guide

Managing ViewPoint Reports on the Console Panel
The Reports section of the Console panel controls settings for syslog data collection, summarizer configuration, email and archiving, scheduling reports, and archiving report data.
• For information about syslog data collection settings, see the “Configuring Syslog Data Storage Configuration and Sort Settings” section on page 46 in the Managing Reports in the Console Panel chapter.
• For information about the summarizer, see the following sections in the Managing Reports in the Console Panel chapter:
– “About Summary Data in Reports” section on page 48
– “Summarizer Settings” section on page 48
• For information about Email and Archiving settings, see the “Configuring Email/Archive Settings” section on page 51 in the Managing Reports in the Console Panel chapter.
• For a description of how to schedule reports in the Console panel, see the “Scheduled Reports” section on page 52 in the Managing Reports in the Console Panel chapter.
• For information about archiving report data using the Move Data to Archive (MDTA) feature, see the “Management” section on page 57 in the Managing Reports in the Console Panel chapter.
94 SonicWALL ViewPoint 5.0 Administrator’s Guide

CHAPTER 12Scheduling and Configuring Reports
This chapter provides information about scheduling automatic reports and configuring data summarization. It also contains instructions for configuring settings for the Dashboard > Summary report and describes how to create customized reports in PDF format.
This chapter includes the following sections:
• “Configuring Scheduled Reports” section on page 95
• “Selecting Reports for Summarization” section on page 99
• “Using Summarize Now” section on page 101
• “Configuring Dashboard Summary Reports” section on page 104
• “Exporting Reports to PDF” section on page 106
Configuring Scheduled ReportsSonicWALL ViewPoint Reporting can automatically send reports to any email addresses that you specify. This section contains the following:
• “Viewing or Managing Scheduled Reports” on page 96
• “Adding or Editing a Scheduled Report” on page 97
95SonicWALL ViewPoint 5.0 Administrator’s Guide

Configuring Scheduled Reports
Viewing or Managing Scheduled ReportsTo view , delete, or enable/disable currently scheduled reports, perform the following steps:
1. Click the Firewall tab.
2. Select a SonicWALL appliance.
3. Expand the Configuration tree and click Scheduled Reports. The Scheduled Reports page displays.
Figure 43 Reports > Configuration > Scheduled Reports
4. On the Scheduled Reports page, to add a new scheduled report, click Add. See “Adding or Editing a Scheduled Report” on page 97.
5. To edit a report, click the notepad icon in that row. See “Adding or Editing a Scheduled Report” on page 97.
6. To delete a report, select the checkbox in that row and then click Delete Selected Scheduled Reports.
7. To enable a disabled report, select the checkbox in that row and then click Enable Selected Scheduled Reports.
8. To disable a scheduled report, select the checkbox in that row and then click Disable Selected Scheduled Reports.
9. To select all reports in the list, click Select All Scheduled Reports.
96 SonicWALL ViewPoint 5.0 Administrator’s Guide

Configuring Scheduled Reports
Adding or Editing a Scheduled ReportYou can add a new scheduled report or edit an existing one on the Firewall panel on the Configuration > Scheduled Reports screen. When adding or editing the report, you can configure its name, category, formats, cover page, summary report page, and detailed reports page. You can also use or create a profile for the detailed reports page settings.
To add or edit a new scheduled report, perform the following steps:
1. Navigate to the Configuration > Scheduled Reports page and do one of the following:
– To add a new schedule report, click the Add button.
– To edit an existing report, click the notepad icon in that row. The Scheduled Report Configuration window displays.
2. Enter a name for the report in the Name field.
3. To email the report, select the Email check box. The screen expands to show email configuration settings.
4. Enter the IP address of the mail server into the SMTP Server field.
5. By default, the ViewPoint Reporting Module will use the email address that was configured in the Console panel in the Management > ViewPoint Settings screen as the Sender email address. To change it, enter a new Sender email address in the Source Email Address field.
6. Enter one or more destination email addresses, separated by semicolons, into the Destination Email Addresses field.
7. Enter the Subject Line that will appear in reports sent from the ViewPoint Reporting Module in the Email Subject field.
8. Enter text that will appear in the message body in the Email Body field.
9. To copy the contents of the report into the body of the email message, select the Send Reports Inline check box. To send the file as an email attachment, make sure this check box is deselected.
Note Reports can only be sent inline when all data is sent in a single report.
10. To archive the file on the server’s hard disk, select the Archive check box and enter a path in the Save Directory field.
Specify the directory where the file will be archived in the Save Directory field.
11. For Report Type, select Daily, Weekly, or Monthly.
12. For Report Format, select HTML, XML, or PDF.
97SonicWALL ViewPoint 5.0 Administrator’s Guide

Configuring Scheduled Reports
13. Select either Include all data in a single report or Zip Reports into a single file.
14. If you selected PDF for the Report Format, you can create a password to protect it by selecting Password Protect the PDF File and typing a password into the Password field. Users must input the password to view the contents of a password-protected PDF file. The content can be copied or printed, but is not editable by a PDF editor.
15. If the zip file is selected, you can create a password for it by selecting Password Protect the Zip File and typing a password into the Password field.
Note When both PDF and Zip Reports into a single file are selected, you can password-protect the PDF, but not the zip file.
16. By default, the SonicWALL logo is used on reports. To select another logo, click Browse next to the Logo File field or type the path and filename into the field.
17. For the Cover Page, enter a Title and Subtitle and select colors for the Foreground and Background of the cover page.
18. For Summary Report Page, you can select up to 4 reports. Select a report for the summary page from the Choose the Summary Reports drop down list, and then click Add.
19. For Detailed Report Page, do one of the following:
– Click Select an existing profile, and then select the profile to use from the Profile Name drop-down list.
– Click Create a new profile, type a profile name into the New Profile Name field, and then select the checkboxes in the Report list for each report to be included. You can click the checkbox next to the Report heading to select all reports in the list.
20. Optionally click Configure Filters Options. For this procedure see “Configuring Filters and Options” on page 99.
21. To see a preview of this scheduled report, click PREVIEW.
22. When finished, click ADD.
98 SonicWALL ViewPoint 5.0 Administrator’s Guide

Selecting Reports for Summarization
Configuring Filters and Options1. At the bottom of the Scheduled Report Configuration page, click the Configure
Filters/Options button. The Configure Filters/Options page displays.
2. Select whether the reports will contain a chart and table or table only.
3. Select the number of sites to display in Top Sites reports (default: 10).
4. Select the number of users to display in Top Users reports (default: 10).
5. Select the number of sites to display in Sites by User reports (default: 5).
6. Select the number of items to display in all other reports (default: 10).
7. Select the number of entries per item to display in all other reports (default: 10).
8. Click the Update button to apply changes. The new report will appear in the list on the Scheduled Reports page.
Selecting Reports for SummarizationThis section describes how to tune the performance of the Summarizer by configuring which reports will be created. When an appliance is configured to communicate with ViewPoint, you need to prepare it for syslog data collection for reporting. Make sure the summarizer is collecting data for the reports you want for this unit.
To configure the Summarizer settings, perform the following steps:
1. Click the Firewall tab.
99SonicWALL ViewPoint 5.0 Administrator’s Guide

Selecting Reports for Summarization
2. Expand the Configuration tree and click Summarizer Settings. The Summarizer Settings page provides a list of reports and a correlating description of each report. Each report contains a checkbox that you can select to generate a summarized report.
Figure 44 Firewall > Configuration > Summarizer Settings
3. Select the checkbox of each report type to summarize.
4. When you are finished, click Update. Your configuration changes are saved automatically.
100 SonicWALL ViewPoint 5.0 Administrator’s Guide

Using Summarize Now
Using Summarize NowThe Summarize Now feature allows the administrator to create instant summary reports without affecting the regularly scheduled summary reports. You can use Summarize Now to test that the Summarizer is gathering data for a managed unit. The SonicWALL ViewPoint Summarize Now feature is located in the Console tab under Reports > Summarizer. The SonicWALL ViewPoint Summarizer creates summary reports by default every 8 hours. Summary reports can be configured by the administrator to occur every 1 to every 24 hours.
To use the Summarize Now feature, perform the following tasks:
1. Click the Console tab at the top of the screen.
2. In the left pane, expand Reports and click Summarizer.
Figure 45 Console > Reports > Summarizer
3. Click Summarize Now.
101SonicWALL ViewPoint 5.0 Administrator’s Guide

Using Summarize Now
4. You will see a pop-up window verifying that you want to summarize the data now. Summarizing data using Summarize Now is a one-time action and will not affect the scheduled summary. Click OK to continue.
5. Navigate to Log > View Log in the left pane. Search for the message Report Data Summarized to verify that the Summarize Now action has completed.
Figure 46 Console > Log > View Log
6. When Summarize Now has completed, click the Firewall tab at the top of the screen. In the left-most pane, click MyReportsView or click an appliance.
Note You may see incomplete data if you view the Summary section of a selected report before the Summarize Now process is complete. Wait for the Report Data Summarized message to be displayed in Log > View Log.
102 SonicWALL ViewPoint 5.0 Administrator’s Guide

Using Summarize Now
7. In the center pane, click a report to expand it, then click the Summary option underneath it. For example, click Bandwidth, then click Summary to review the summarized bandwidth usage data.
Figure 47 Reports > Bandwidth > Summary
8. Navigate to the Summary section of other reports in the center pane to see other summarized data.
103SonicWALL ViewPoint 5.0 Administrator’s Guide

Configuring Dashboard Summary Reports
Configuring Dashboard Summary ReportsIn the Configuration > Dashboard page, you can configure settings to control the information displayed by the Dashboard > Summary screen. Settings are available for the following:
• Summary statistics list at the top left of the Dashboard > Summary page
• Alerts list at the top right of the Dashboard > Summary page
• Reports list in the main body of the Dashboard > Summary page
Figure 48 Reports > Configuration > Dashboard Page
To configure Dashboard Summary report settings, perform the following steps:
1. Click the Firewall tab.
2. Expand the Configuration tree and click Dashboard.
104 SonicWALL ViewPoint 5.0 Administrator’s Guide

Configuring Dashboard Summary Reports
3. In the Summary / Statistics List section, to add a statistic to the Dashboard > Summary page, select it from the drop-down list and then click Add.
Figure 49 Add Statistic
4. To remove a statistic from the Dashboard > Summary page, select the checkbox under the trashcan icon for that statistic, and then click Delete.
5. In the Alerts List section, to add an alert to the Dashboard > Summary page and to receive an email alert when the alert setting is matched, select an event type from the drop-down list, type a threshold value into the Threshold field, and then click Add.
Alerts are emailed using the settings configured in the Console > Management screens. See “ViewPoint Settings” on page 39 and “Alert Settings” on page 41.
Figure 50 Alerts List and Threshold
6. To remove an alert, select the checkbox under the trashcan icon for that alert, and then click Delete.
7. In the Reports List section, to add a report to the Dashboard > Summary page, select the report type from the drop-down list, and then click Add.
8. To remove a report from the Dashboard > Summary page, select the checkbox under the trashcan icon for that report, and then click Delete.
105SonicWALL ViewPoint 5.0 Administrator’s Guide

Exporting Reports to PDF
Exporting Reports to PDFViewPoint can create scheduled email reports in PDF. Called Compliance Reports, this feature allows you to export regular reports in universally readable format.
Compliance Report OverviewA Compliance Report is a report that collects report data and presents it in an organized format.
The ViewPoint Compliance Report feature allows administrators to provide more customized report summaries and to create more formal and defined layout of report information in PDF format. This feature provides the following benefits:
• Customizable cover page (Default also available)
• Customize Summary/ Descriptions for the reports.
• Ability to customize a set of reports.
• Three reports can be persisted as a profile so that it can be consumed by less novice users in the system.
• In the end result, reports can be generated in Industry Standard PDF format.
• Compressed format: The size of the file is small compared to and equivalent HTML report.
• The print quality is higher.
• This feature has the ability to open a 200 page PDF report with ease. In comparison, opening the same report in HTML takes a more extensive amount of time using IE, as it is weighed down by memory and other systems.
RequirementsAdobe Reader ® plug-in is required for the preview function.
How Do Compliance Reports Work?ViewPoint has the capability to generate both online and scheduled reports in HTML format. Since PDF has become a standard document format for distribution, the compliance reports will be based on this universal standard. Moreover, users should be able to customize/define sections throughout the report. For example, they can assign different logos/titles to the cover pages for their customers.
106 SonicWALL ViewPoint 5.0 Administrator’s Guide

Exporting Reports to PDF
Adding a New Scheduled Compliance ReportThis section includes the following sub-sections:
• “Customizing Your Cover Page” section on page 108
• “Customizing Your Summary Report Page” section on page 109
• “Customizing Your Detailed Reports Page” section on page 110
• “Editing Existing Profiles” section on page 111
• “Verifying User Compliance Reports Configuration” section on page 113
To begin creating a new customized Compliance Report, perform the following steps:
1. Navigate to Firewall > Configuration > Scheduled Reports.
2. Click the ADD button, to add a scheduled report.
3. The Scheduled Report Configuration page displays. In the General section, enter the name of your report into the Name field, and the report description.
4. In the Category section, select the Email check box. The details window displays:
• SMTP Server field: Enter your SMTP Server IP address or hostname.
• Source Email Address field: Enter your Source Email Address.
• Destination Email Address field: Enter the Destination Email Address(es).
• Email Subject field: Enter your Email Subject.
• Email Body field: Enter your Email Body.
Figure 51 New Scheduled Report Category Settings
5. To archive a directory, click the Archive check box. Enter the your desired directory you want to archive into the Save Directory field.
107SonicWALL ViewPoint 5.0 Administrator’s Guide

Exporting Reports to PDF
To change the format and settings of your customized compliance report, perform the following steps:
6. In the Format and Settings category, select the Report Type that reflects the time interval you want to view your reports, either Daily, Weekly, or Monthly.
7. Select the PDF report format in the Report Format category. Selecting the PDF option will open additional fields to allow you to customize the set up of the Cover Page, Summary Report Page, and Detailed Report Page of your report in PDF format.
8. To zip all of your reports into a single file, select the check box next to the Zip Reports into a single file check box.
Note PDF will disable some options that are only applicable to HTML.
9. For custom reports, enter the template folder name into the Template Folder Name field.
Customizing Your Cover PageThe Cover Page section allows the user to design a cover page for their report using different color schemes.
1. Title field: Enter the document title.
2. Subtitle field: Enter the document subtitle. (Optional).
Figure 52 Scheduled Report Cover Page Settings
108 SonicWALL ViewPoint 5.0 Administrator’s Guide

Exporting Reports to PDF
3. Select the color for the Title and Subtitle’s foreground and background by clicking the gradient color box in the right side of the each field. You may select a color by either choosing a color on the color bar and then selecting its value in the color box or by typing in the HTML color.
Figure 53 Cover Page Color Settings
4. The color codes are automatically filled in the corresponding fields once the color chooser window is closed.
Customizing Your Summary Report PageThe Summary Report Page allows you to add new reports and individually customize their appearance.
1. On the Summary report page, select the type of summary reports you need, up to a maximum of 4 reports. Then, click the Add button. The report will be created based on the type of summary report you have selected.
2. Enter the report title in and report description in the appropriate fields.
3. Select the text color for the title and description.
4. Select the background color for both fields.
5. Select the order in the Order drop-down window.
Figure 54 Summary Reports Order List
6. You may continue to add reports based on the summary you select in the Summary Reports drop-down menu. Repeat steps 1-5 to add more summary reports.
109SonicWALL ViewPoint 5.0 Administrator’s Guide

Exporting Reports to PDF
Customizing Your Detailed Reports PageThe Details Report Page provides you with a list of reports you may select to include in your report summaries. You can refine your setting for your report in more detail in the Detailed Report Settings category. First, select the appropriate profile setting for your report. If you are creating a new profile, select the Create a New Profile button.
1. New Profile Name field: Enter the name of your new profile.
Figure 55 New Profile Information
2. To determine the type of reports that will be summarized in your compliance report, check the boxes next to the reports you need. Sub-folders are revealed to each folder by clicking the plus icon. When all sub-folders are selected, the main folder will be selected.
3. When you have completed your selection(s) of reports, scroll down the page until you see a check button with Configure Filters/Options beside it. Click the check mark button.
Figure 56 Configure Filters/Options
110 SonicWALL ViewPoint 5.0 Administrator’s Guide

Exporting Reports to PDF
4. In the Configure Filter/Options section, you are able to decide how your filter and display is set. Once you have clicked the check button, fill out the table accordingly.
Figure 57 Filter Settings
Editing Existing ProfilesA profile is associated with selected reports from the report list. You have the ability to go back and edit existing profiles in your scheduled reports. Since the report list is populated based on the report type selection, a profile is associated with the report type also. Instead of three categories, there will only be two: single day or multi-days. A profile in a single report will not be seen be seen by the users when they select weekly or monthly as report types.
To edit existing profiles, perform the following tasks:
1. Click the Edit icon, located next to the report name you want to edit.
Figure 58 Edit Existing Profile
2. In the Detailed Page section, choose the Select an existing profile button.
111SonicWALL ViewPoint 5.0 Administrator’s Guide

Exporting Reports to PDF
Note You are able to delete an existing profile in that section by clicking the Delete Selected Scheduled Reports button located at the top of the page.
3. From the drop-down list in the Detailed Report Page, select the profile name you wish to edit. Choose the reports you want to add or remove from that profile. If a new profile has the same name as one of the existing profiles, the behavior will be the same as users opening the existing profile and edit the report list. When selecting an existing profile, the associated reports are checked in the report list automatically.
Figure 59 Detailed Report Page
A default cover page is provided.
Figure 60 Default cover page
112 SonicWALL ViewPoint 5.0 Administrator’s Guide

Exporting Reports to PDF
Verifying User Compliance Reports ConfigurationIf you have chosen the PDF version of making this report, you now have the option to see a preview of the report covers you have created and how all of the report summaries you added will fit into that template.
To review your customize PDF settings, click the Preview button.
Figure 61 PDF Report Preview Button
Figure 62 Cover page; Summary page; and Details page Preview
Note The images used for the preview do not use actual data.
113SonicWALL ViewPoint 5.0 Administrator’s Guide

Exporting Reports to PDF
114 SonicWALL ViewPoint 5.0 Administrator’s Guide

CHAPTER 13Viewing Reports
This chapter describes how to generate reports using the SonicWALL ViewPoint Reporting Module.
The following section describes how to configure the settings for viewing reports:
• “Managing Report Settings” section on page 116
Select from the following reports:
• “Viewing General Status Reports” section on page 119
• “Viewing Dashboard Reports” section on page 120
• “Configuring and Using Custom Reports” section on page 123
• “Viewing Bandwidth Reports” section on page 139
• “Viewing Services Reports” section on page 147
• “Viewing Web Usage Reports” section on page 149
• “Viewing Web Filter Reports” section on page 168
• “Viewing File Transfer Protocol Reports” section on page 183
• “Viewing Mail Usage Reports” section on page 190
• “Viewing VPN Usage Reports” section on page 197
• “Viewing Attacks Reports” section on page 209
• “Viewing Virus Attacks Reports” section on page 219
• “Viewing Anti-Spyware Reports” section on page 226
• “Viewing Intrusion Prevention Reports” section on page 233
• “Viewing Authentication Reports” section on page 242
• “Viewing the Log” section on page 245
115SonicWALL ViewPoint 5.0 Administrator’s Guide

Managing Report Settings
Managing Report SettingsAll of the reports in ViewPoint report on data gathered on a specific date or range of dates. You can also edit the report settings for each report by using the Search Bar and the More Options button.
Editing Report SettingsTo edit the report settings, use the Search Bar at the top of the report. You can search other reports, set the start and end dates for a report to view, or click More Options to access other Report Display Settings. For a detailed description, see the “Searching for a Report” section on page 85.
Figure 63 Report Display Settings on Search Bar
Selecting a Graphical DisplaySome reports allow you to specify how many items to display in the report. Select 5, 10, 20, 50, 100, or All from the Number of Items list. This allows you to limit the display to a the specified number in order to make the report easier to read.
Many reports offer different graphical displays for the data, such as a bar-graph or a pie chart. To select a graphical display, select Chart and Table under Report Display Settings and choose the display type from the Chart Type list. Your selection should display immediately in the report screen. For most reports you can choose Area, Bar, Pie or Plot.
116 SonicWALL ViewPoint 5.0 Administrator’s Guide

Managing Report Settings
Figure 64 Area, Bar, Pie, and Plot Charts
Setting a Date or Date RangeSummary reports display only information for a single date. Over-time reports display information over a date range.
Selecting a Single DateTo select a single date for a report, click on the Start or End fields in the Search Bar to display the drop-down calendar. The End field is only configurable for Over Time reports. In the calendar, you can set the month by clicking the single arrows (<, >), or the year by clicking the double arrows (<<, >>). To select the month or year from a drop-down list, click and hold the arrow button. Click Search to begin building the report.
Figure 65 Drop-down Calendar
117SonicWALL ViewPoint 5.0 Administrator’s Guide

Managing Report Settings
Selecting a Date Range
To select a date range for an Over Time report, select a Start Date and End Date in the Search Bar, and then click Search. You can use the drop-down calendars by clicking in either field.
Additional SettingsMany reports have additional settings that you can select such as source and destination interfaces to report traffic through or how to display names and IP addresses. Make your selection from these lists and click Search.
Troubleshooting Reports One of the most common error messages when a report does not display is “No Data”. There are several reasons why you might see this error, and SonicWALL ViewPoint 5.0 and higher displays the most likely reason and points you to the screen where you can make the necessary adjustments.
Some examples are shown in the following figures.
Figure 66 Appliance is Down
Figure 67 Appliance in a Provisioned State
Figure 68 Configured for Status Only
118 SonicWALL ViewPoint 5.0 Administrator’s Guide

Viewing General Status Reports
Viewing General Status ReportsThe General > Status page contains information on the SonicWALL appliance or group of SonicWALL appliances.
To view the Status page, perform the following steps:
1. Click the Firewall tab.
2. Select the global icon or a SonicWALL appliance.
3. Expand the General tree and click Status. The Status page displays.
Figure 69 Firewall > General > Status
4. The sections contain the following information:
– Node information—Information on the firewall(s) is displayed at the global or unit level.
– Syslog Categories—The types of syslog data selected to be collected for the selected appliance.
– Syslog Servers—The IP address and Port number of the syslog servers configured to collect data from the selected appliance.
119SonicWALL ViewPoint 5.0 Administrator’s Guide

Viewing Dashboard Reports
–Synchronize Applicance Information with ViewPoint—Click the Synchronize Applicance Information Now link to refresh status data about the monitored appliances. This status information is normally updated every 24 hours.
– Getting Started With ViewPoint—Click the Open Getting Started Instructions In New Window link to open the ViewPoint installation and initial configuration instructions in a separate window.
Viewing Dashboard ReportsDashboard reports display an overview of bandwidth, uptime, intrusions and attacks, and alerts for managed SonicWALL firewalls. The Security Dashboard report provides data about worldwide security threats that can affect your network. The Dashboard also displays data about threats blocked by the SonicWALL security appliance.
Select from the following:
• “Viewing the Dashboard Summary Report” on page 120
Viewing the Dashboard Summary ReportThe Dashboard Summary report displays statistics, alerts, graphical summary reports, and a list of available custom report templates. Displayed statistics can include total bandwidth, total attacks and other measurable information. The alerts list is displayed when the configured threshold has been reached. A wide range of graphical reports are also available for display.
You can configure the Dashboard > Summary report contents in the Firewall > Configuration > Dashboard page. For a description of the configuration procedure, see “Configuring Dashboard Summary Reports” section on page 104.
To view the Dashboard Summary report, perform the following steps:
1. Click the Firewall tab.
2. Select the global icon or a SonicWALL appliance.
120 SonicWALL ViewPoint 5.0 Administrator’s Guide

Viewing Dashboard Reports
3. Expand the Dashboard tree and click Summary.
Figure 70 Dashboard Summary page
4. The tables at the top of the page display the totals, using megabytes for the bandwidth totals.
5. The graphical display breaks down the information as follows:
– Bandwidth—shown by group when viewed at global level. At the unit level, the bandwidth is shown per hour.
– HTTP Bandwidth—at the unit level, this is shown as a pie chart with eight slices. The top seven Web users by IP address are each shown as a slice, with all other HTTP bandwidth combined in the eighth slice.
– Attacks Events—at the global level, both attack events and virus attack attempts are shown per group. At unit level, these are shown per hour (not pictured).
– Custom Report Templates—your “favorites” list of saved custom report templates. See “Configuring and Using Custom Reports” on page 123.
You can click the Edit icon next to the template on this page to edit the template in the Custom Report page and save it using the Save Template button. To delete the template, click the Delete icon.
121SonicWALL ViewPoint 5.0 Administrator’s Guide

Viewing Dashboard Reports
Viewing Custom Reports on the DashboardSonicWALL ViewPoint provides access to your saved Custom Report templates on the Dashboard > Summary page for the appliance. The template must have been previously created and saved for the same appliance on the Custom Reports > Internet Activity page.
Figure 71 Custom Report Templates on Dashboard
When you click on a saved template, the detailed report page is displayed in Full Mode with the same categories in the same order as in the template that you saved. In the report page, the Print and PDF icons are available, along with the pagination controls. There is no link to Split Mode and no Save Template button since this template is already saved.
You can also configure or delete a saved template from the Dashboard > Summary page.
To access a custom report from the Dashboard:
1. Select a unit for which Log Viewer is enabled, and then navigate to Dashboard > Summary.
2. Locate the box labeled Custom Report Templates. All saved templates for this appliance are listed in the box.
122 SonicWALL ViewPoint 5.0 Administrator’s Guide

Configuring and Using Custom Reports
3. Do one of the following:
• To generate a Custom Report, click a saved template in the Custom Report Templates box.
• To configure a saved template, click the Configure icon for that template, make the desired changes, and then click OK. For configuration instructions, see “Configuring and Using Custom Reports” on page 123.
• To delete a saved template, click the Delete icon for that template and then click OK in the confirmation dialog box.
Configuring and Using Custom ReportsCustom Reports are available at the unit level for appliances visible on the Firewall tab. Log Viewer must be enabled for the appliance. For information about enabling Log Viewer, see “Viewing the Log” on page 245.
When configuring a Custom Report on the Custom Reports > Internet Activity page, the Template Section acts as a query builder. You select the criteria for the report that you want, and SonicWALL ViewPoint uses your input to query the raw syslog database for the information, and then outputs the report. The Template Section consists of two parts: the Date/Time section and the Report Layout section.
After building your query in the Template Section and clicking the Generate Report button, the report is displayed in the Report Section. The Report Section is displayed in the lower half of the page, under the Template Section; this layout is called Split Mode. You can easily toggle between Split Mode and Full Mode. Full Mode can be used to display only the Template Section or only the Report Section in a full page view.
The Report Section displays the report and provides controls for pagination, printing, and exporting the report in PDF format. You can also click the Save Template button in this section if you want to save the settings for this report as a template for reuse later.
See the following sections for detailed information:
• “Toggling Between Split Mode and Full Mode” on page 124
• “Configuring the Date and Time” on page 126
• “Configuring the Report Layout and Generating the Report” on page 128
• “Generating the Custom Report” on page 135
• “Viewing a Custom Report” on page 136
• “Printing a Page or Exporting a PDF of the Report” on page 138
• “Saving the Report Template” on page 139
123SonicWALL ViewPoint 5.0 Administrator’s Guide

Configuring and Using Custom Reports
Toggling Between Split Mode and Full ModeThe Custom Report > Internet Activity page contains two main sections, Template Section and Report Section, which can be displayed together or independently depending on the mode.
When the Custom Report > Internet Activity page is initially displayed for a selected appliance, the Template Section is displayed in Full Mode. Split Mode is available, but the Report Section displays no data until a report has been generated. Figure 72 shows the Template Section displayed in Full Mode.
Figure 72 Full Mode - Template Section
124 SonicWALL ViewPoint 5.0 Administrator’s Guide

Configuring and Using Custom Reports
After generating a report, the page automatically changes to Split Mode and displays the report settings in the Template Section in the top half of the page and the report results in the Report Section in the lower portion. Figure 73 shows the Template Section and Report Section displayed in Split Mode.
Figure 73 Split Mode Display
At any time, you can change to Full Mode if you want to display either the Template Section or the Report Section individually. From Full Mode, you can easily change back to Split Mode.
125SonicWALL ViewPoint 5.0 Administrator’s Guide

Configuring and Using Custom Reports
To toggle between Split Mode and Full Mode:
1. Select a unit for which Log Viewer is enabled, and then navigate to Custom Reports > Internet Activity.
2. On a page that is currently displayed in Full Mode, to change the view to Split Mode click the <Split Mode> button at the right side of the section heading.
3. On a page that is currently displayed in Split Mode, do one of the following to change to a Full Mode display of either the Template Section or the Report Section:
– Click the <Full Mode> button to the right of the Template Section heading.
– Click the <Full Mode> button to the right of the Report Section heading.
Configuring the Date and TimeAt the top of the Template Section of the Custom Reports > Internet Activity page, the Date/Time region provides a way to designate the time period to use when generating the report. You can select either a Dynamic Date Range or a Static Date Range.
Figure 74 Date / Time Settings
Dynamic Date RangeThere are four choices for the Dynamic Date Range:
• Today – Uses log data from the current date, beginning just after midnight
• Yesterday – Uses log data from just after midnight of the previous day, up to and including the most recent log message from the current date
• Week to Date – Uses log data from the current date, plus the five preceding days
• Month to Date – Uses log data from the beginning of the current month, up to and including the most recent log message from the current date
When generating a report with a template containing a dynamic date range setting, the dates used when referencing the log data are relative to the current date. Thus, two reports generated from the same template on different days will provide different results.
126 SonicWALL ViewPoint 5.0 Administrator’s Guide

Configuring and Using Custom Reports
To select a Dynamic Date Range:
1. Select a unit for which Log Viewer is enabled, and then navigate to Custom Reports > Internet Activity.
2. In the Template Section under Date/Time, select the Dynamic Date Range radio button.
3. In the drop-down list, select Today, Yesterday, Week to Date, or Month to Date.
Static Date RangeThe Static Date Range selection allows you to specify the exact dates and times of log data to be used for the report. You can specify a single date or a date range, and indicate the exact hour, minute, and second for both the beginning and the end of the period for the report.
A popup calendar makes it easy to select the Start Date and End Date for the date range, as shown in Figure 75.
Figure 75 Static Date Range Calendar
To specify a Static Date Range:
1. Select a unit for which Log Viewer is enabled, and then navigate to Custom Reports > Internet Activity.
2. In the Template Section under Date/Time, select the Static Date Range radio button.
3. Click the Start Date field to access the pop-up calendar.
127SonicWALL ViewPoint 5.0 Administrator’s Guide

Configuring and Using Custom Reports
4. Use the navigation arrows near the top of the calendar to change the year or month. Click the << button to move to the previous year, or hold the button to select from a list of years. Click the >> button to move to the next year, or hold the button to select from a list of years. Similarly, click the < or > to move back or ahead by one month, or hold the button to select from a list of months.
5. Click the desired start date in the calendar. This adds the date to the Start Date field and closes the calendar.
6. For the Start Time, select the hour, minute, and second from the drop-down lists. These settings specify the earliest data to be included in the report.
7. For the End Time, select the hour, minute, and second from the drop-down lists. These settings specify the most recent data to be included in the report.
8. To change the settings back to the defaults, click Reset at the bottom of the Template Section. Note that this will change the Report Layout region as well as the Date/Time region back to default settings.
Configuring the Report Layout and Generating the Report
Located in the Template Section of the Custom Reports > Internet Activity page below the Date/Time region, the Report Layout region provides a way to specify the type of data to include, and the format of the report. The Report Layout region has a Detailed Report tab and a Summary Report tab. The report appearance and the way information is organized is quite different between a Detailed Report and a Summary Report.
The Detailed Report tab contains a list of eight data categories that you can add as report fields, and allows you to specify query values for each. The categories you select will appear as column headings in the report.
The Summary Report tab allows you to structure a report showing the top elements of Internet activity. You can select the number of top elements, whether to base the comparisons on total traffic, received traffic, or transmitted traffic, and the two data categories to evaluate when determining the top elements. The generated report provides graphical output that you can click to drill down for detailed information.
For more information about each of these Report Layout tabs, see the following sections:
• “Detailed Reports” on page 129
• “Summary Reports” on page 133
128 SonicWALL ViewPoint 5.0 Administrator’s Guide

Configuring and Using Custom Reports
Detailed ReportsThe Detailed Report tab is the default view in the Report Layout region.
Figure 76 Detailed Report Tab
The Select Report Field drop-down list contains eight data categories that you can add as column headings in the report. The categories are:
• Full URL – Adds a column containing the full URL of each Web site visited
• Category – Adds a column containing the category of each site visited, such as Gambling or Adult/Mature Content
• Domain – Adds a column containing the domain name of each site visited
• Protocol – Adds a column containing the protocol used by the traffic
• Received Traffic– Adds a column containing the number of bytes received from the visited site
• Transmitted Traffic – Adds a column containing the number of bytes transmitted to the site
• Total Traffic – Adds a column containing the total number of bytes received and transmitted
• User – Adds a column containing the user ID or IP address
To include a field in the report, select a choice from the list and then click Add. When you click Add, a row is populated in the table below, which has three column headings: Field, Filter, and Options.
Note When you place your mouse cursor over the row, under the Field heading, the cursor changes to a “move” cursor. You can drag and drop the rows to rearrange the column ordering in the final report.
129SonicWALL ViewPoint 5.0 Administrator’s Guide

Configuring and Using Custom Reports
In the Filter column, two fields are displayed: an operator field and an input field. The operator field is a drop-down list containing the operator choices for the selected report field. See “Filter Operators” on page 134 for a description of each operator. The input field can be a drop-down list or a standard input field, depending on the selected report field.
The operators and input fields are defined in Table 5 for each report field.
Table 5 Operators and Input Fields for Each Data Type
Data Type Operators Input Field
Full URL EqualsStart withEnd withContains
The input field is a standard input field where you can type in the URL to match, such as:http://www.funnyyoutubevideo.com/funniest.htmlLeave the input field blank if you choose not to filter by a certain URL.
Category Equals The input field is a drop-down list containing an alphabetized list of all the content filtering categories, such as Adult/Mature Content, Gambling, Military, etc. Leave the default of All in the input field if you choose not to filter by a certain category.
Domain EqualsStart withEnd withContains
The input field is a standard input field where you can type in the domain to match, such as sonicwall.com. Leave the input field blank if you choose not to filter by a certain domain.
Protocol EqualsStart withEnd withContains
The input field is a standard input field where you can type in the protocol to match, such as FTP. Leave the input field blank if you choose not to filter by a certain protocol.
Received Traffic =>>=<<=!=
The input field is a standard input field where you can type in the number of bytes to match or compare to. Leave the input field blank if you choose not to filter by a certain amount of traffic.
130 SonicWALL ViewPoint 5.0 Administrator’s Guide

Configuring and Using Custom Reports
In the Options column, two icons are displayed: an Eye and an X . You can click the Eye to toggle whether the report field on that row will be displayed in the final report. This allows you to filter the report results based on the selected report field and related filter value, but not display the field as a column. When you click on the Eye icon within a row, the icon greys out to show that this field will not be displayed in the final report. The filter value will still be used to filter results from the raw syslog database to apply towards the report.
For example, you might specify the following Field/Operator/Filter Value: Protocol/=/http. It would make sense to click the Eye icon to disable the Protocol field from being shown in the report, since it would always just be “http” and would not add any interesting information to the final report. Contrast this with simply specifying the Protocol field and leaving the Filter Value blank, in which case you would want to enable the Eye so that this column would appear in the report showing a variety of protocols such as udp/dns, tcp/http, udp/ntp, or numbered protocols such as udp/389 (the LDAP protocol) or tcp/445 (MS Server Message Block (SMB) file sharing).
Clicking the X icon under Options deletes the selected report field from the table, so it will not be used to generate the report results nor will it be displayed in the report. Use the X icon instead of the Eye when you do not choose to filter the report results based on the field.
The Detailed Report tab also contains the Sort By drop-down list. The list contains the Date/Time option and any other report fields that you have selected from the eight data types. The choice you select will be used to order the results in the report from the first page to the last.
Transmitted Traffic
=>>=<<=!=
The input field is a standard input field where you can type in the number of bytes to match or compare to. Leave the input field blank if you choose not to filter by a certain amount of traffic.
Total Traffic =>>=<<=!=
The input field is a standard input field where you can type in the number of bytes to match or compare to. Leave the input field blank if you choose not to filter by a certain amount of traffic.
User EqualsStart withEnd withContains
The input field is a standard input field where you can type in the user ID to match. Leave the input field blank if you choose not to filter by a certain user.
Data Type Operators Input Field
131SonicWALL ViewPoint 5.0 Administrator’s Guide

Configuring and Using Custom Reports
To configure a detailed report:
1. Select a unit for which Log Viewer is enabled, and then navigate to Custom Reports > Internet Activity.
2. In Report Layout region of the Template Section of the Custom Reports > Internet Activity page, select the Detailed Report tab.
3. In the Select report field drop-down list, select a data type to include in the report, and then click Add. A row for this field is populated in the table below. Repeat this step to add other fields.
4. Optionally select an operator from the drop-down list under Filter in a table row, and type in or select an input value to be matched when the database is queried. Repeat this step for other rows to add filter values for those fields.
5. To prevent a field from appearing in the final report, click the Eye icon in that row so that the icon appears greyed out. To allow the field to be displayed in the report, click the greyed out Eye icon to return it to normal appearance.
6. To delete a field from the table, click the X icon in that row.
7. To sort the report pages by a different field than the default of Date/Time, select the desired field from the Sort by drop-down list.
8. To change the settings back to the defaults, click Reset at the bottom of the Template Section. Note that this will change the Date/Time region and the Report Layout region back to default settings.
132 SonicWALL ViewPoint 5.0 Administrator’s Guide

Configuring and Using Custom Reports
Summary ReportsThe Summary Report tab is available in the Report Layout region of the Template Section.
Figure 77 Summary Report Tab
The Top drop-down list provides selections for the number of entries to display in the report. For example, if the User field is selected below as a Summary Group, and 5 is selected in the Top drop-down list, the report will provide entries for the top five users. Available numbers in the Top drop-down list are 5, 10, 20, 50, and 100.
The Summary Base drop-down list offers a selection of traffic types that will be used to determine the top usage for the selected field. The Summary Base choices are Total traffic, Received traffic, or Transmitted traffic.
Below the Top and Summary Base fields, you can create one or two Summary Groups from the choices listed on the left side. The listed available fields are Category, Domain, Protocol, and User. To select a field for a Summary Group, simply drag and drop the desired field from the list to either the Level 1 Summary Group or Level 2 Summary Group boxes. When the field name is dragged to one of these, the operator drop-down list and filter input value field are displayed, allowing you to specify values to match when the data is searched. See “Filter Operators” on page 134 for a description of each operator.
Either the Level 1 Summary Group field or the Level 2 Summary Group field can be used alone; the resulting report will look the same in both cases.
When both the Level 1 and Level 2 Summary Group fields are populated, the report will display the top entries for the Level 2 field for each of the top entries for the Level 1 field. For example, if User is dragged to the Level 1 Summary Group and Domain is dragged to the Level 2 Summary Group, and 5 is selected in the Top drop-down list, the generated report will display the top five domains visited by each of the top five users.
133SonicWALL ViewPoint 5.0 Administrator’s Guide

Configuring and Using Custom Reports
To configure a summary report:
1. Select a unit for which Log Viewer is enabled, and then navigate to Custom Reports > Internet Activity.
2. In Report Layout region of the Template Section of the Custom Reports > Internet Activity page, select the Summary Report tab.
3. In the Top drop-down list, select the number of entries to be displayed in the report.
4. In the Summary Base drop-down list, select one of Total Traffic, Received Traffic, or Transmitted Traffic to use when determining which are the top elements in the selected field.
5. To specify the field for the Level 1 Summary Group, click and drag the desired field from the list on the left to the Level 1 Summary Group field, and then release your mouse button to drop the field into position. The filter operator and input field are displayed next to the field name.
6. To specify the field for the Level 2 Summary Group, click and drag the desired field from the list on the left to the Level 2 Summary Group field, then release your mouse button to drop the field into position. The filter operator and input field are displayed next to the field name.
7. To specify a filter operator and filter value for a Summary Group, select the operator from the drop-down list next to the field and type a filter value into the input field to the right of the operator.
8. To change the settings back to the defaults, click Reset at the bottom of the Template Section. Note that this will change the Date/Time region as well as the Report Layout region back to default settings.
Filter OperatorsWhen configuring the Report Layout on either the Detailed Report tab or the Summary Report tab, you can specify filter values to be matched in the database during report generation. Depending on the selected field type, text string or numeric, several filter operators are available. The filter operators are used with a filter input value to determine which data should be included in the report.
The operators are defined as shown in Table 6.
134 SonicWALL ViewPoint 5.0 Administrator’s Guide

Configuring and Using Custom Reports
Table 6 Filter Operators
Generating the Custom ReportThe Generate Report button at the bottom of the Template Section is used to create the report. Before clicking Generate Report, use the Template Section to specify the time period for the report and the contents and layout of the report.
Note Custom Reports are available at the unit level for appliances visible on the Firewall tab. Log Viewer must be enabled for the appliance. For information about enabling Log Viewer, see “Viewing the Log” on page 245.
Operator DefinitionEquals Only data that exactly matches the filter input text will be
included in the report
Start with Data that begins with the input text will be included in the report
End with Data that ends with the input text will be included in the report
Contains Data that contains the input text will be included in the report
= Only data that exactly matches the filter input numerical value will be included in the report
> Data values that are greater than the input numerical value will be included in the report
>= Data values that are greater than or equal to the input numerical value will be included in the report
<= Data values that are less than or equal to the input numerical value will be included in the report
< Data values that are less than the input numerical value will be included in the report
!= Data values that are not equal to the input numerical value will be included in the report
135SonicWALL ViewPoint 5.0 Administrator’s Guide

Configuring and Using Custom Reports
To generate a custom report:
1. Select a unit for which Log Viewer is enabled, and then navigate to Custom Reports > Internet Activity.
2. In the Date/Time region of the Template Section, specify the time period that the report will cover. For detailed information and instructions, see “Configuring the Date and Time” on page 126.
3. In the Report Layout region of the Template Section, specify the contents and appearance of the report. For detailed information and instructions, see “Configuring the Report Layout and Generating the Report” on page 128.
4. Click Generate Report to create the report using the specified configuration.
Viewing a Custom ReportAfter you click Generate Report, the Report Section is displayed in Split Mode in the lower half of the main window, even if you previously were in Full Mode for the Template Section.
Pagination controls are displayed at the upper right of the report, just below the Save Template button and the printer and PDF icons. Navigation buttons are provided to take you to the first page, next page, previous page, and last page, or you can specify an exact page number in the field.
Figure 78 Pagination Controls
In a Detailed Report, the selected report fields are displayed as column headings. You can click on any column heading to sort that page by the values in the column that you click. Click again to toggle between ascending and descending order on that page. When
136 SonicWALL ViewPoint 5.0 Administrator’s Guide

Configuring and Using Custom Reports
you navigate away from that page and then come back using the pagination controls, the page reverts to the original sorting order as specified in the Sort by field of the Template Section before generating the report.
Figure 79 Detailed Report Page
In a Summary Report, the Report Section displays the traffic volume as horizontal bar charts. This lets you see the information at a glance, such as who consumed the most bandwidth and which domains they visited the most.
Figure 80 Summary Report Page
137SonicWALL ViewPoint 5.0 Administrator’s Guide

Configuring and Using Custom Reports
You can click on a bar in the chart to pop up detailed information, just like the detailed report with all of the columns for all fields. The report lists details about this Summary Group field only. For example, if the Summary Group contains the User field and you click on a bar for one of the top users, the report displays the date and time of all Internet activity for the user, and includes data for every field available for detailed reports. A scroll bar is provided along the bottom of the Detailed Information window to allow viewing of all eight fields plus the date and time column.
The Detailed Information window is shown in Figure 81.
Figure 81 Detailed Information Popup from a Summary Report
Printing a Page or Exporting a PDF of the ReportTo print the current page of the report, click the printer icon at the top of the Report Section. Your normal print dialog box pops up. This prints only the page that is currently displayed.
To export the entire report in PDF format, click the PDF icon at the top of the Report Section. A PDF file is generated showing the report results in table format. The PDF can contain a maximum of 10,000 records. If your report contains more than 10,000 records, you can use the Static Date Range fields to adjust the dates and regenerate the report to shorten its length. You can save the PDF using any filename and location.
138 SonicWALL ViewPoint 5.0 Administrator’s Guide

Viewing Bandwidth Reports
Saving the Report TemplateAfter generating the report, you can save the settings for this report as a template for reuse. You can select the saved template from the Template Section or from the Dashboard > Summary page at a later time, and use it to generate a report using the same settings. For information about using the template on the Dashboard > Summary page, see “Troubleshooting Reports” on page 118.
The template is saved for the currently selected appliance and for the specific user. The saved template will not be available for other appliances or for other users.
To save the report template:
1. In the Report Section in the upper right corner, click the Save Template button.
2. In the popup dialog box, type in a descriptive name for the template, up to 40 characters. The number of remaining characters allowed in the name is displayed below the input field and changes as you type.
3. Click Save. If you are in a Full Mode display of the Report Section, you can verify that the template has been saved by changing back to Split Mode and viewing the contents of the Template drop-down list.
Viewing Bandwidth ReportsBandwidth reports display the amount of data transferred through one or more selected SonicWALL appliances. These reports include the cost of consumed network bandwidth per 100 megabytes transferred through the selected appliances.
Bandwidth reports are an ideal starting point for viewing overall bandwidth usage. You can view bandwidth usage view by hour, day, or over a period of days. Additionally, you can view the top users of bandwidth.
From this information, you can determine network strategies. For example, if you need more bandwidth, you might need to upgrade network equipment, or you might simply need to curtail the bandwidth usage of a few employees.
Note All reports appear in the Firewall’s time zone.
139SonicWALL ViewPoint 5.0 Administrator’s Guide

Viewing Bandwidth Reports
Select from the following:
• “Viewing the Bandwidth Summary Report” on page 140
• “Viewing the Top Users of Bandwidth” on page 141
• “Viewing Bandwidth Usage Over Time” on page 143
• “Viewing the Top Users of Bandwidth Over Time” on page 145
Viewing the Bandwidth Summary Report The Bandwidth Summary report contains information on the amount of traffic handled by a SonicWALL appliance during each hour of the specified day, or at the global level, for all SonicWALL appliances for the day.
To view the Bandwidth Summary report, perform the following steps:
1. Click the Firewall tab.
2. Select the global icon or a SonicWALL appliance.
3. Expand the Bandwidth tree and click Summary. The Summary page displays.
Figure 82 Firewall > Bandwidth > Summary
4. The bar graph displays the amount of bandwidth transferred during each hour of the day.
140 SonicWALL ViewPoint 5.0 Administrator’s Guide

Viewing Bandwidth Reports
5. The table contains the following information:
– Hour—when the sample was taken.
– Events—number of events or “hits.”
– Cost ($)—amount of the expense per 100 megabytes. You can configure this in the Cost Per Mega Byte Bandwidth Use field in the Console > Reports > Summarizer screen.
– MBytes—number of megabytes transferred.
– % of MBytes—percentage of megabytes transferred during this hour, compared to the day. For example, if 1000 megabytes of data was transferred during the day and 100 megabytes was transferred at the 12:00 time period, the % of MBytes field will display 10%.
6. The ViewPoint Reporting Module shows yesterday’s report. To change the date of the report and other settings, click the Start or End field to access the drop-down calendar, or click More Options for report display settings.
7. Under Report Display Settings you can set:
– Display Type: Chart and Table, or Table Only
– Chart Type: Area, Bar, Pie or Plot chart
– Select the Source and Destination interfaces to view
– If you want to track bandwidth usage in both directions, select the Bi-directional check box.
See “Managing Report Settings” on page 116.
8. When you are finished, click Search. The ViewPoint Reporting Module displays the report for the selected day.
Note These settings will stay in effect for all summary reports during your active login session.
Viewing the Top Users of BandwidthThe Top Users report displays the users who used the most bandwidth on the specified date and the correlating expense.
To view the Top Users report, perform the following steps:
1. Click the Firewall tab.
2. Select a SonicWALL appliance.
141SonicWALL ViewPoint 5.0 Administrator’s Guide

Viewing Bandwidth Reports
3. Expand the Bandwidth tree and click Top Users. The Top Users page displays.
Figure 83 Firewall > Bandwidth > Top Users
4. The pie chart displays the percentage of bandwidth transferred by each user.
5. The table contains the following information:
– Users—the IP address of the user.
– Connections—number of events or “hits.”
– Cost ($)—amount of the expense per 100 megabytes. You can configure this in the Cost Per Mega Byte Bandwidth Use field in the Console > Reports > Summarizer screen.
– MBytes—number of megabytes.
– % of MBytes—percentage of megabytes transferred by this user, compared to all users. For example, if 1000 megabytes of data was transferred during the day and 200 megabytes was transferred by the top user, the % of MBytes field will display 20%.
6. By default, the ViewPoint Reporting Module shows yesterday’s report, a pie chart, and the ten top users. To change the date of the report and other settings, click the Start or End field to access the drop-down calendar, or click More Options for report display settings.
142 SonicWALL ViewPoint 5.0 Administrator’s Guide

Viewing Bandwidth Reports
7. Under Report Display Settings you can set:
– Display Type: Chart and Table, or Table Only
– Chart Type: Area, Bar, Pie or Plot chart
– Number of Users
– Rows per Screen
See “Managing Report Settings” on page 116.
8. To display a limited number of users, use the Search Bar fields.
Note The search bar fields use pattern matching with operators such as “contains”. For example, “john” will match john_smith, john42, or big_john.
9. When you are finished, click Search. The ViewPoint Reporting Module displays the report for the selected day.
Note These settings will stay in effect for all similar reports during your active login session.
Viewing Bandwidth Usage Over TimeThe Bandwidth Over Time report displays the daily amount of traffic and the total daily expense for consumed network bandwidth handled by a SonicWALL appliance or a group of SonicWALL appliances for the specified time period.
To view the Bandwidth Over Time report, perform the following steps:
1. Click the Firewall tab.
2. Select the global icon or a SonicWALL appliance.
143SonicWALL ViewPoint 5.0 Administrator’s Guide

Viewing Bandwidth Reports
3. Expand the Bandwidth tree and click Over Time. The Over Time page displays.
Figure 84 Firewall > Bandwidth > Over Time
4. The bar graph displays the amount of bandwidth transferred during each day of the specified time period.
5. The table contains the following information:
– Date—when the sample was taken.
– Connections—number of hits.
– Cost ($)—amount of the expense per 100 megabytes. You can configure this in the Cost Per Mega Byte Bandwidth Use field in the Console > Reports > Summarizer screen.
– MBytes—number of megabytes transferred.
– % of MBytes—percentage of megabytes transferred during this day, compared to the time period. For example, if 100,000 megabytes of data was transferred during the time period and 25,000 megabytes was transferred on one day, the % of MBytes field will display 25%.
6. To change the date of the report and other settings, use the Search Bar and click the Start or End fields to access the drop-down calendar, or click More Options for report display settings.
144 SonicWALL ViewPoint 5.0 Administrator’s Guide

Viewing Bandwidth Reports
7. Under Report Display Settings you can set:
– Display Type: Chart and Table, or Table Only
– Chart Type: Area, Bar or Plot chart
See “Managing Report Settings” on page 116.
8. When you are finished, click Search. The ViewPoint Reporting Module displays the report for the selected date range.
Note These settings will stay in effect for all similar reports during your active login session.
Viewing the Top Users of Bandwidth Over TimeThe Top Users Over Time report displays the users who used the most bandwidth and accumulated the highest cost during the specified date range. This report is available at the unit level.
To view the Top Users Over Time report, perform the following steps:
1. Click the Firewall tab.
2. Select a SonicWALL appliance.
3. Expand the Bandwidth tree and click Top Users Over Time. The Top Users Over Time page displays.
145SonicWALL ViewPoint 5.0 Administrator’s Guide

Viewing Bandwidth Reports
Figure 85 Firewall > Bandwidth > Top Users Over Time
4. The pie chart displays the percentage of bandwidth transferred by each user.
5. The table contains the following information:
– Users—the IP address of the user.
– Connections—number of events or “hits.”
– Cost—total amount of the expense per 100 megabytes.
– MBytes—number of megabytes.
– % of MBytes—percentage of megabytes transferred by this user, compared to all users. For example, if 1000 megabytes of data was transferred during this period and 200 megabytes was transferred by the top user, the % of MBytes field will display 20%.
6. The ViewPoint Reporting Module shows yesterday’s report. To change the date range of the report and other settings, click the Start or End field to access the drop-down calendar, or click More Options for report display settings.
7. Under Report Display Settings you can set:
– Display Type: Chart and Table, or Table Only
– Chart Type: Area, Bar, Pie or Plot chart
– Number of Users
– Rows per Screen
See “Managing Report Settings” on page 116.
146 SonicWALL ViewPoint 5.0 Administrator’s Guide

Viewing Services Reports
8. To display a limited group of users, enter the user IDs in the Search Bar fields.
Note The search bar fields use pattern matching with operators such as “contains”. For example, “john” will match john_smith, john42, or big_john.
9. When you are finished, click Search. The ViewPoint Reporting Module displays the report for the selected users and date range.
Note These settings will stay in effect for all similar reports during your active login session.
Viewing Services ReportsService reports provide information on the amount of data transmitted through the selected SonicWALL appliance by each service.
Service reports are useful for revealing inappropriate usage of bandwidth and can help determine network policies. For example, if there is a large spike of bandwidth usage, you can determine whether this is caused by regular web access, someone using FTP to transfer large files, an attempted Denial of Service (DoS) attack, or another service.
Note All reports appear in the Firewall’s time zone.
The procedures for viewing the Services Reports are described in the following section:
• “Viewing the Services Summary Report” on page 147
Note You cannot view services reports from the global view.
Viewing the Services Summary Report The Services Summary report displays the amount of traffic handled by each service during each hour of the specified day.
To view the Services Summary report, perform the following steps:
147SonicWALL ViewPoint 5.0 Administrator’s Guide

Viewing Services Reports
1. Click the Firewall tab.
2. Select a SonicWALL appliance.
3. Expand the Services tree and click Summary. The Summary page displays.
Figure 86 Firewall > Services > Summary
4. The bar graph displays the amount of bandwidth used by each service during each hour of the day.
5. The table contains the following information:
– Protocol—the service.
– Events—number of events or “hits.”
– MBytes—Number of Megabytes.
– % of MBytes—percentage of megabytes transferred by this service on the selected day, compared to all other services. For example, if 10,000 megabytes of data was transferred during the day and 5,000 of the megabytes were transferred, the % of MBytes field will display 50%.
6. To change the date of the report and other settings, use the Search Bar and click the Start or End field to access the drop-down calendar, or click More Options for report display settings.
7. Under Report Display Settings you can set:
– Display Type: Chart and Table, or Table Only
– Chart Type: Area, Bar or Plot chart
148 SonicWALL ViewPoint 5.0 Administrator’s Guide

Viewing Web Usage Reports
See “Managing Report Settings” on page 116.
8. When you are finished, click Search. The ViewPoint Reporting Module displays the report for the selected date.
Note These settings will stay in effect for all similar reports during your active login session.
Viewing Web Usage ReportsWeb usage reports provide information on the amount of web usage that occurs through the selected SonicWALL appliance(s).
Web usage reports can be used to view web bandwidth usage by the hour, day, or over a period of days. Additionally, you can view the top users of web bandwidth and view the most visited sites.
For the Summary and Over Time reports, and for all reports involving Users, the browse time is also provided in one column of the table. The browse time is the amount of time consumed browsing the Internet through one or more selected SonicWALL appliances. The browse time is not displayed in reports for Category or Sites.
Note All reports appear in the Firewall’s time zone.
Select from the following:
• “Viewing the Web Usage Summary Report” on page 150
• “Viewing the Top Web Sites” on page 151
• “Viewing the Top Users of Web Bandwidth” on page 153
• “Viewing Web Usage by User” on page 155
• “Viewing Web Usage By Site” on page 156
• “Viewing Web Usage By Category” on page 158
• “Viewing Web Usage Over Time” on page 159
• “Viewing Top Sites Over Time” on page 161
• “Viewing Top Users Over Time” on page 163
• “Viewing Web Usage By User Over Time” on page 165
• “Viewing Web Usage By Category Over Time” on page 166
149SonicWALL ViewPoint 5.0 Administrator’s Guide

Viewing Web Usage Reports
Viewing the Web Usage Summary Report The Web Usage Summary report contains information on the amount of HTTP bandwidth handled by a SonicWALL appliance or all SonicWALL appliances during each hour of the specified day. The report includes information on the amount of time spend browsing the Internet behind a SonicWALL appliance or all SonicWALL appliances.
To view the Web Usage Summary report, perform the following steps:
1. Click the Firewall tab.
2. Select the global icon or a SonicWALL appliance.
3. Expand the Web Usage tree and click Summary. The Summary page displays.
Figure 87 Firewall > Web Usage > Summary
4. The bar graph displays the amount of HTTP bandwidth transferred during each hour of the day.
5. The table contains the following information:
– Hour—when the sample was taken.
– Events—number of events or “hits.”
– Browse Time—number of hours, minutes, and seconds spent browsing non-job function-related sites on the Internet.
Browse Time is calculated as follows:
(Number Of Pages / Noise Reduction Factor) * Average Browse Time Per Page
150 SonicWALL ViewPoint 5.0 Administrator’s Guide

Viewing Web Usage Reports
"Number Of Pages" is the number of hits (responses by the web site to build the page) when a User accesses a web page (www.sonicwall.com).
"Noise Reduction Factor" is the average noise we want to exclude per page (like eliminating pop-up links, images, and more). The factory default is 40.
"Average Browse Time Per Page" is the time allocated to read a page.
Noise Reduction Factor and Average Browse Time Per page are configurable in the database directly, but are not exposed in ViewPoint management interface.
– MBytes—number of megabytes transferred.
– % of MBytes—percentage of megabytes transferred during this hour, compared to the day. For example, if 1000 megabytes of HTTP data was transferred during the day and 100 megabytes was transferred at the 12:00 time period, the % of MBytes field will display 10%.
6. To change the date of the report and other settings, use the Search Bar and click the Start or End field to access the drop-down calendar, or click More Options for report display settings.
7. Under Report Display Settings you can set:
– Display Type: Chart and Table, or Table Only
– Chart Type: Area, Bar or Plot chart
See “Managing Report Settings” on page 116.
8. When you are finished, click Search. The ViewPoint Reporting Module displays the report for the selected date.
Viewing the Top Web SitesThe Top Sites report displays the web sites that used the most HTTP bandwidth on the specified date. To view the Top Sites report, perform the following steps:
1. Click the Firewall tab.
2. Select a SonicWALL appliance.
151SonicWALL ViewPoint 5.0 Administrator’s Guide

Viewing Web Usage Reports
3. Expand the Web Usage tree and click Top Sites. The Top Sites page displays.
Figure 88 Firewall> Web Usage > Top Sites
4. The pie chart displays the percentage of bandwidth used to access the top sites.
5. The table contains the following information:
– Site—URL or IP address of the site.
– Hits—number of hits.
– MBytes—number of megabytes transferred.
– Category—the web site category.
– % of MBytes—percentage of megabytes transferred between this site, compared to all other HTTP traffic. For example, if 10,000 megabytes of data was transferred during the day and 5,000 megabytes was transferred between the appliance and Ebay, the % of MBytes field will display 50% and you have a problem.
6. To change the date of the report and other settings, use the Search Bar and click the Start or End field to access the drop-down calendar, or click More Options for report display settings.
152 SonicWALL ViewPoint 5.0 Administrator’s Guide

Viewing Web Usage Reports
7. Under Report Display Settings you can set:
– Display Type: Chart and Table, or Table Only
– Chart Type: Area, Bar, Pie or Plot chart
– Number of Sites
– Rows per Screen
See “Managing Report Settings” on page 116.
8. When you are finished, click Search. The ViewPoint Reporting Module displays the report for the selected date.
Note These settings will stay in effect for all similar reports during your active login session.
Viewing the Top Users of Web BandwidthThe Top Users report displays the users who used the most HTTP bandwidth and the amount of time they spent browsing the Internet on the specified date.
To view the Top Users report, perform the following steps:
1. Click the Firewall tab.
2. Select a SonicWALL appliance.
3. Expand the Web Usage tree and click Top Users. The Top Users page displays.
Figure 89 Firewall > Web Usage > Top Users
153SonicWALL ViewPoint 5.0 Administrator’s Guide

Viewing Web Usage Reports
4. The pie chart displays the percentage of bandwidth transferred by each of the top users.
5. The table contains the following information:
– Users—the IP address of the user.
– Hits—number of hits.
– Browse Time—number of hours, minutes, and seconds spent browsing non-job function-related sites on the Internet.
– MBytes—number of megabytes transferred.
– % of MBytes—percentage of megabytes transferred by this user, compared to all users. For example, if 1000 megabytes of data was transferred during the day and 200 megabytes was transferred by the top user, the % of MBytes field will display 20%.
6. The ViewPoint Reporting Module shows yesterday’s report. To change the date of the report and other settings, use the Search Bar and click the Start or End field to access the drop-down calendar, or click More Options for report display settings.
7. Under Report Display Settings you can set:
– Display Type: Chart and Table, or Table Only
– Chart Type: Area, Bar, Pie or Plot chart
– Number of Users
– Rows per Screen
See “Managing Report Settings” on page 116.
8. To display a limited group of users, enter the user IDs in the Search Bar fields.
Note The search bar fields use pattern matching with operators such as “contains”. For example, “john” will match john_smith, john42, or big_john.
9. When you are finished, click Search. The ViewPoint Reporting Module displays the report for the selected day.
Note These settings will stay in effect for all similar reports during your active login session.
154 SonicWALL ViewPoint 5.0 Administrator’s Guide

Viewing Web Usage Reports
Viewing Web Usage by UserThe By User report displays a list of all users, their top sites, the number of hits to each site, the time spent browsing, and the amount of data transferred.
To view the By User report, perform the following steps:
1. Click the Firewall tab.
2. Select a SonicWALL appliance.
3. Expand the Web Usage tree and click By User. The By User page displays.
Figure 90 Firewall> Web Usage > By User
4. The table contains the following information:
– User—the IP address of the user.
– Hits—the number of hits to each web site visited by the user.
– Browse Time—number of hours, minutes, and seconds spent browsing non-job function-related sites on the Internet.
– MBytes—the number of megabytes transferred.
5. You can navigate directly from the Web Usage > By User page to a Web Usage > By Site page detailing the information of the site the user has been browsing. Click the Plus sign to the left of the User name or IP address to show details, and then hover the mouse over a site. A sticky tooltip will display with a link to the corresponding site’s report page.
6. The ViewPoint Reporting Module shows yesterday’s report. To change the date of the report and other settings, use the Search Bar and click the Start or End field to access the drop-down calendar, or click More Options for report display settings.
155SonicWALL ViewPoint 5.0 Administrator’s Guide

Viewing Web Usage Reports
7. Under Report Display Settings you can set:
– Number of Users
– Number of Sites per User
– Rows per Screen
See “Managing Report Settings” on page 116.
8. To display a limited group of users, enter the user IDs in the Search Bar fields.
Note The search bar fields use pattern matching with operators such as “contains”. For example, “john” will match john_smith, john42, or big_john.
9. When you are finished, click Search. The ViewPoint Reporting Module displays the report for the selected day.
Note These settings will stay in effect for all similar reports during your active login session.
Viewing Web Usage By SiteThe By Site report displays a list of all sites, the users that accessed the sites, the number of hits to each site, and the amount of data transferred.
To view the By Site report, perform the following steps:
1. Click the Firewall tab.
2. Select a SonicWALL appliance.
156 SonicWALL ViewPoint 5.0 Administrator’s Guide

Viewing Web Usage Reports
3. Expand the Web Usage tree and click By Site. The By Site page displays.
Figure 91 Firewall > Web Usage > By Site
4. The table contains the following information:
– Site—the URL of the site.
– Hits—the number of hits to the web site, by user.
– MBytes—the number of megabytes transferred, by the user.
– Category—the category of the site.
5. You can navigate directly from the Web Usage > By Site page to a Web Usage > By User page detailing the information of the users who have been browsing the site. Click the Plus sign to the left of the Site to show details, and then hover the mouse over a user. A sticky tooltip will display with a link to the corresponding user report page.
6. The ViewPoint Reporting Module shows yesterday’s report and all web sites. To change the date of the report or web sites displayed, use the Search Bar and click the Start or End field to access the drop-down calendar, or click More Options for report display settings.
7. Under Report Chart Types you can set:
– Number of Sites
– Number of Users per Site
– Rows per Screen
See “Managing Report Settings” on page 116.
8. To display a limited group of sites, enter the sites in the Search Bar fields.
Note The search bar fields use pattern matching with operators such as “contains”. For example, “john” will match john_smith, john42, or big_john.
157SonicWALL ViewPoint 5.0 Administrator’s Guide

Viewing Web Usage Reports
9. When you are finished, click Search. The ViewPoint Reporting Module displays the report for the selected day.
Note These settings will stay in effect for all similar reports during your active login session.
Viewing Web Usage By CategoryThe Web Usage By Category report displays a list of the top Web site categories, the number of hits to each category, the amount of data transferred, and the percentage of data transferred.
To view the By Category report, perform the following steps:
1. Click the Firewall tab.
2. Select a SonicWALL appliance.
3. Expand the Web Usage tree and click By Category. The By Category page displays.
Figure 92 Firewall > Web Usage > By Category
4. The table contains the following information:
– Category—the web site category.
– Hits—the number of hits to the Web site category.
158 SonicWALL ViewPoint 5.0 Administrator’s Guide

Viewing Web Usage Reports
– MBytes—the number of megabytes transferred.
– % of MBytes—the percentage of megabytes transferred.
5. The ViewPoint Reporting Module shows yesterday’s report and all web site categories. To change the date of the report or web site categories displayed, use the Search Bar and click the Start or End field to access the drop-down calendar, or click More Options for report display settings.
6. Under Report Display Settings you can set:
– Display Type: Chart and Table, or Table Only
– Chart Type: Area, Bar, Pie or Plot chart
– Number of Items
– Entries per Item
– Rows per Screen
See “Managing Report Settings” on page 116.
7. When you are finished, click Search. The ViewPoint Reporting Module displays the report for the selected day.
Note These settings will stay in effect for all similar reports during your active login session.
Viewing Web Usage Over TimeThe Web Usage Over Time report displays the daily amount of HTTP bandwidth and browse time handled by a SonicWALL appliance or all SonicWALL appliances for the specified time period.
To view the Web Usage Over Time report, perform the following steps:
1. Click the Firewall tab.
2. Select the global icon or a SonicWALL appliance.
159SonicWALL ViewPoint 5.0 Administrator’s Guide

Viewing Web Usage Reports
3. Expand the Web Usage tree and click Over Time. The Web Activity page displays.
Figure 93 Firewall > Web Usage > Over Time
4. The bar graph displays the amount of HTTP bandwidth transferred during each day of the specified time period.
5. The table contains the following information:
– Date—when the sample was taken.
– Connections—the number of connections or hits.
– Browse Time—number of hours, minutes, and seconds spent browsing non-job function-related sites on the Internet.
– MBytes—the number of megabytes transferred.
– % of MBytes—the percentage of megabytes transferred during this day, compared to the time period. For example, if 100,000 megabytes of data was transferred during the time period and 25,000 megabytes was transferred on one day, the % of MBytes field will display 25%.
6. To change the date range of the report, use the Search Bar and click the Start or End field to access the drop-down calendar, or click More Options for report display settings.
160 SonicWALL ViewPoint 5.0 Administrator’s Guide

Viewing Web Usage Reports
7. Under Report Display Settings you can set:
– Display Type: Chart and Table, or Table Only
– Chart Type: Area, Bar or Plot chart
See “Managing Report Settings” on page 116.
8. When you are finished, click Search. The ViewPoint Reporting Module displays the report for the selected date range.
Note These settings will stay in effect for all similar reports during your active login session.
Viewing Top Sites Over TimeThe Top Sites Over Time report displays the most visited web sites for the specified time period.
To view the Top Sites Over Time report, perform the following steps:
1. Click the Firewall tab.
2. Select a SonicWALL appliance.
161SonicWALL ViewPoint 5.0 Administrator’s Guide

Viewing Web Usage Reports
3. Expand the Web Usage tree and click Top Sites Over Time. The Top Sites Over Time page displays.
Figure 94 Firewall > Web Usage > Top Sites Over Time
4. The bar graph displays the amount of HTTP bandwidth transferred during each day of the specified time period.
5. The table contains the following information:
– Site—URL or IP address of the site.
– Hits—the number of hits.
– MBytes—the number of megabytes transferred.
– Category—the website category.
– % of MBytes—the percentage of megabytes transferred between this site, compared to all other HTTP traffic. For example, if 1,000,000 megabytes of data was transferred during the day and 500,000 megabytes was transferred between the appliance and Ebay, the % of MBytes field will display 50% and you have a problem.
6. To change the date range of the report, use the Search Bar and click the Start or End field to access the drop-down calendar, or click More Options for report display settings.
162 SonicWALL ViewPoint 5.0 Administrator’s Guide

Viewing Web Usage Reports
7. Under Report Display Settings you can set:
– Display Type: Chart and Table, or Table Only
– Chart Type: Area, Bar, Pie or Plot chart
– Number of Sites
– Rows per Screen
See “Managing Report Settings” on page 116.
8. When you are finished, click Search. The ViewPoint Reporting Module displays the report for the selected date range.
Note These settings will stay in effect for all similar reports during your active login session.
Viewing Top Users Over TimeThe Top Users Over Time report displays the top users of bandwidth and the amount of time they spent browsing the Internet for the specified time period. To view the Top Users Over Time report, perform the following steps:
1. Click the Firewall tab.
2. Select a SonicWALL appliance.
163SonicWALL ViewPoint 5.0 Administrator’s Guide

Viewing Web Usage Reports
3. Expand the Web Usage tree and click Top Users Over Time. The Top Users Over Time page displays.
Figure 95 Firewall > Web Usage > Top Users Over Time
4. The graph provides a graphical display of the percentage of bandwidth transferred by each of the top users over the specified time period.
5. The table contains the following information:
– Site—URL or IP address of the site.
– Hits—number of hits.
– Browse Time—number of hours, minutes, and seconds spent browsing non-job function-related sites on the Internet.
– MBytes—number of megabytes transferred.
– Category—the category of the site.
– % of MBytes—percentage of megabytes transferred by this user, compared to all users. For example, if 1000 megabytes of data was transferred during the period and 200 megabytes was transferred by the top user, the % of MBytes field will display 20%.
6. To change the date range of the report, use the Search Bar and click the Start or End field to access the drop-down calendar, or click More Options for report display settings.
164 SonicWALL ViewPoint 5.0 Administrator’s Guide

Viewing Web Usage Reports
7. Under Report Display Settings you can set:
– Display Type: Chart and Table, or Table Only
– Chart Type: Area, Bar, Pie or Plot chart
– Number of Users
– Rows per Screen
See “Managing Report Settings” on page 116.
8. When you are finished, click Search. The ViewPoint Reporting Module displays the report for the selected date range.
Note These settings will stay in effect for all similar reports during your active login session.
Viewing Web Usage By User Over TimeThe By User Over Time report displays a list of all users, their top sites, the number of hits to each site, the time spent browsing, and the amount of data transferred for the specified time period.
To view the By User Over Time report, perform the following steps:
1. Click the Firewall tab.
2. Select a SonicWALL appliance.
3. Expand the Web Usage tree and click By User Over Time. The By User Over Time page displays.
Figure 96 Firewall > Web Usage > By User Over Time
165SonicWALL ViewPoint 5.0 Administrator’s Guide

Viewing Web Usage Reports
4. The table contains the following information:
– User—the IP address of the user.
– Hits—number of hits to each web site visited by the user.
– Browse Time—number of hours, minutes, and seconds spent browsing non-job function-related sites on the Internet.
– MBytes—number of megabytes transferred.
5. To change the date range of the report, use the Search Bar and click the Start or End field to access the drop-down calendar, or click More Options for report display settings.
6. Under Report Display Settings you can set:
– Number of Users
– Number of Sites per User
– Rows per Screen
See “Managing Report Settings” on page 116.
7. When you are finished, click Search. The ViewPoint Reporting Module displays the report for the selected date range.
Note These settings will stay in effect for all similar reports during your active login session.
Viewing Web Usage By Category Over TimeThe By Category Over Time report displays a list of all users, their top sites, the number of hits to each site, and the amount of data transferred for the specified time period.
To view the By Category Over Time report, perform the following steps:
1. Click the Firewall tab.
2. Select a SonicWALL appliance.
166 SonicWALL ViewPoint 5.0 Administrator’s Guide

Viewing Web Usage Reports
3. Expand the Web Usage tree and click By Category Over Time. The By User Over Time page displays.
Figure 97 Firewall > Web Usage > By Category Over Time
4. The table contains the following information:
– Category—the website category.
– Hits—number of hits to each web site visited by the user.
– MBytes—number of megabytes transferred.
– % of MBytes—percentage of megabytes transferred by this user, compared to all users. For example, if 1000 megabytes of data was transferred during the period and 200 megabytes was transferred by the top user, the % of MBytes field will display 20%.
5. To change the date range of the report, use the Search Bar and click the Start or End field to access the drop-down calendar, or click More Options for report display settings.
6. Under Report Display Settings you can set:
– Display Type: Chart and Table, or Table Only
– Chart Type: Area, Bar, Pie or Plot chart
– Number of Items
– Entries per Item
– Rows per Screen
See “Managing Report Settings” on page 116.
167SonicWALL ViewPoint 5.0 Administrator’s Guide

Viewing Web Filter Reports
7. When you are finished, click Search. The ViewPoint Reporting Module displays the report for the selected date range.
Note These settings will stay in effect for all similar reports during your active login session.
Viewing Web Filter ReportsWeb filter reports provide information on the number of attempts that users made to access blocked web sites through the selected SonicWALL appliance(s). These reports include web sites blocked by the Content Filter List, customized keyword filtering, and domain name filtering.
Web filter reports can be used to view blocked site access attempts by the hour, day, or over a period of days. Additionally, you can view the users that most frequently attempt to access blocked sites and the most popular blocked sites.
Note All reports appear in the Firewall’s time zone.
Select from the following:
• “Viewing the Web Filter Summary Report” on page 169
• “Viewing the Web Filter Top Sites Report” on page 170
• “Viewing the Top Users that Try to Access Blocked Sites” on page 172
• “Viewing the Blocked Sites for Each User” on page 173
• “Viewing Blocked Sites Sorted By Site” on page 174
• “Viewing Blocked Sites Sorted By Category” on page 176
• “Viewing Blocked Site Attempts Over Time” on page 177
• “Viewing the Top Blocked Site Attempts Over Time” on page 178
• “Viewing the Top Blocked Site Users Over Time” on page 180
• “Viewing Blocked Sites for Each User Over Time” on page 181
• “Viewing Blocked Sites By Category Over Time” on page 182
168 SonicWALL ViewPoint 5.0 Administrator’s Guide

Viewing Web Filter Reports
Viewing the Web Filter Summary Report The Web Filter Summary report contains information on the number of times users attempt to access blocked sites for the specified day.
To view the Web Filter Summary report, perform the following steps:
1. Click the Firewall tab.
2. Select the global icon or a SonicWALL appliance.
3. Expand the Web Filter tree and click Summary. The Summary page displays.
Figure 98 Firewall > Web Filter > Summary
4. The bar graph displays the number of blocked sites that users attempted to access during each hour of the day.
169SonicWALL ViewPoint 5.0 Administrator’s Guide

Viewing Web Filter Reports
5. The table contains the following information:
– Hour—time when the sample was taken.
– Attempts—the number of attempts to access blocked sites.
– % of Attempts—the percentage of attempts during this hour, compared to the day. For example, if 100 attempts occurred during the day and 20 attempts occurred at the 12:00 time period, the % of Attempts field will display 20%.
6. To change the date of the report, use the Search Bar and click the Start or End field to access the drop-down calendar, or click More Options for report display settings.
7. Under Report Display Settings you can set:
– Display Type: Chart and Table, or Table Only
– Chart Type: Area, Bar or Plot chart
See “Managing Report Settings” on page 116.
8. When you are finished, click Search. The ViewPoint Reporting Module displays the report for the selected date.
Viewing the Web Filter Top Sites Report The Web Filter Top Sites report displays the top blocked web sites that users attempted to access on the specified date.
To view the Top Sites report, perform the following steps:
1. Click the Firewall tab.
2. Select a SonicWALL appliance.
170 SonicWALL ViewPoint 5.0 Administrator’s Guide

Viewing Web Filter Reports
3. Expand the Web Filter tree and click Top Sites. The Top Sites page displays.
Figure 99 Firewall > Web Filter > Top Sites
4. The graph provides a display of the number of access attempts for each of the top twenty blocked web sites.
5. The table contains the following information:
– Site—the URL or IP address of the site.
– Attempts—the number of attempts.
– Category—the web site category.
– % of Attempts—percentage of attempts to access the blocked site, compared to all other blocked site attempts. For example, if 500 attempts were made during the day and 100 of those attempts were for www.badsite.com, its % of Attempts field will display 20%.
6. To change the date of the report, use the Search Bar and click the Start or End field to access the drop-down calendar, or click More Options for report display settings.
7. Under Report Display Settings you can set:
– Display Type: Chart and Table, or Table Only
– Chart Type: Area, Bar, Pie or Plot chart
– Number of Sites
– Rows per Screen
See “Managing Report Settings” on page 116.
8. When you are finished, click Search. The ViewPoint Reporting Module displays the report for the selected date.
171SonicWALL ViewPoint 5.0 Administrator’s Guide

Viewing Web Filter Reports
Viewing the Top Users that Try to Access Blocked Sites
The Web Filter Top Users report displays the users who made the most attempts to access blocked sites on the specified date.
To view the Top Users report, perform the following steps:
1. Click the Firewall tab.
2. Select a SonicWALL appliance.
3. Expand the Web Filter tree and click Top Users. The Top Users page displays.
Figure 100 Firewall > Web Filter > Top Users
4. The pie chart displays the top users with the most blocked site attempts.
5. The table contains the following information:
– Users—the IP address of the user.
– Attempts—the number of attempts.
– Category—the web site category.
– % of Attempts—percentage of attempts to access the blocked site, compared to all other user attempts. For example, if 500 attempts were made during the day and 250 of those attempts were made by a single user, that user’s % of Attempts field will display 50%.
6. By default, ViewPoint Reporting shows yesterday’s report, a pie chart, and the ten top users. To change these settings, use the Search Bar and click the Start or End field to access the drop-down calendar, or click More Options for report display settings.
172 SonicWALL ViewPoint 5.0 Administrator’s Guide

Viewing Web Filter Reports
7. Under Report Display Settings you can set:
– Display Type: Chart and Table or Table Only
– Chart Type: Area, Bar, Pie or Plot chart
– Number of Users
– Rows per Screen
See “Managing Report Settings” on page 116.
8. When you are finished, click Search. The ViewPoint Reporting Module displays the report for the selected date range.
9. These settings will stay in effect for all similar reports during your active login session.
Viewing the Blocked Sites for Each UserThe Web Filter By User report displays the top blocked web sites that each user attempted to access on the specified date.
To view the Web Filter By User report, perform the following steps:
1. Click the Firewall tab.
2. Select a SonicWALL appliance.
3. Expand the Web Filter tree and click By User. The By User page displays.
Figure 101 Firewall > Web Filter > By User
4. The table contains the following information:
– User—the IP address of the user.
– Site—the top five sites visited by the user.
– Attempts—the number of attempts the user made to access each web site.
173SonicWALL ViewPoint 5.0 Administrator’s Guide

Viewing Web Filter Reports
5. You can navigate directly from the Web Filter > By User page to a Web Filter > By Site page detailing the information of the site the user has been browsing. Click the Plus sign to the left of the User name or IP address to show details, and then hover the mouse over a site. A sticky tooltip will display with a link to the corresponding site’s report page.
6. By default, the ViewPoint Reporting Module shows yesterday’s report, a pie chart, and the ten top users. To change these settings, use the Search Bar and click the Start or End field to access the drop-down calendar, or click More Options for report display settings.
7. Under Report Display Settings you can set:
– Number of Users
– Number of Sites per User
– Rows per Screen
See “Managing Report Settings” on page 116.
8. When you are finished, click Search. The ViewPoint Reporting Module displays the report for the selected settings.
9. These settings will stay in effect for all similar reports during your active login session.
Viewing Blocked Sites Sorted By SiteThe Web Filter By Site report displays the top blocked web sites that were accessed by users.
To view the Web Filter By Site report, perform the following steps:
1. Click the Firewall tab.
2. Select a SonicWALL appliance.
174 SonicWALL ViewPoint 5.0 Administrator’s Guide

Viewing Web Filter Reports
3. Expand the Web Filter tree and click By Site. The By Site page displays.
Figure 102 Firewall > Web Filter > By Site
4. The table contains the following information:
– Site—the top five sites visited by the user.
– Attempts—the number of attempts the user made to access each web site.
– Category—the web site category.
5. You can navigate directly from the Web Filter > By Site page to a Web Filter > By User page detailing the information of the users who have been browsing the site. Click the Plus sign to the left of the Site to show details, and then hover the mouse over a user. A sticky tooltip will display with a link to the corresponding user report page.
6. By default, the ViewPoint Reporting Module shows yesterday’s report, a pie chart, and the ten top users. To change these settings, use the Search Bar and click the Start or End field to access the drop-down calendar, or click More Options for report display settings.
7. Under Report Display Number of Users per Site:
– Rows per Screen
See “Managing Report Settings” on page 116.
8. Search for web site addresses in the Search Bar fields.
9. When you are finished, click Search. The ViewPoint Reporting Module displays the report for the selected date.
175SonicWALL ViewPoint 5.0 Administrator’s Guide

Viewing Web Filter Reports
Viewing Blocked Sites Sorted By CategoryThe Web Filter By Category report displays the top categories of web sites that were accessed by users.
To view the Web Filter By Category report, perform the following steps:
1. Click the Firewall tab.
2. Select a SonicWALL appliance.
3. Expand the Web Filter tree and click By Category. The By Site page displays.
Figure 103 Firewall > Web Filter > By Category
4. The table contains the following information:
– Category—the web site category.
– Attempts—the number of attempts the user made to access each web site.
– % of Attempts—the percentage of attempts to access the blocked site, compared to all other user attempts. For example, if 500 attempts were made during the day and 250 of those attempts were made by a single user, his % of Attempts field will display 50%.
5. By default, the ViewPoint Reporting Module shows yesterday’s report, a pie chart, and the ten top users. To change these settings, use the Search Bar and click the Start or End field to access the drop-down calendar, or click More Options for report display settings.
6. Under Report Display Settings you can set:
– Display Type: Chart and Table, or Table Only
– Chart Type: Area, Bar, Pie or Plot chart
176 SonicWALL ViewPoint 5.0 Administrator’s Guide

Viewing Web Filter Reports
– Number of Items
– Entries per Item
– Rows per Screen
See “Managing Report Settings” on page 116.
7. When you are finished, click Search. The ViewPoint Reporting Module displays the report for the selected date range.
Viewing Blocked Site Attempts Over TimeThe Web Filter Over Time report displays the number of attempts that were made to access blocked web sites for the specified time period.
To view the Web Filter Over Time report, perform the following steps:
1. Click the Firewall tab.
2. Select the global icon or a SonicWALL appliance.
3. Expand the Web Filter tree and click Over Time. The Over Time page displays.
Figure 104 Firewall > Web Filter > Over Time
4. The bar graph displays the number of attempts that were made to access blocked web sites during each day of the specified time period.
177SonicWALL ViewPoint 5.0 Administrator’s Guide

Viewing Web Filter Reports
5. The table contains the following information:
– Date—the day when the sample was taken.
– Attempts—the number of attempts to access blocked web sites.
– % of Attempts—the percentage of attempts to access the blocked site on the day, compared to the time period. For example, if 5,000 attempts were made during the time period and 500 were made on one day, its % of Attempts field will display 10%.
6. To change date range of the report, use the Search Bar and click the Start or End field to access the drop-down calendar, or click More Options for report display settings.
7. Under Report Display Settings you can set:
– Display Type: Chart and Table, or Table Only
– Chart Type: Area, Bar or Plot chart
See “Managing Report Settings” on page 116.
8. When you are finished, click Search. The ViewPoint Reporting Module displays the report for the selected date range.
Note These settings will stay in effect for all similar reports during your active login session.
Viewing the Top Blocked Site Attempts Over TimeThe Top Sites Over Time report displays the top blocked web sites for the specified time period.
To view the Web Filter Over Time report, perform the following steps:
1. Click the Firewall tab.
2. Select a SonicWALL appliance.
178 SonicWALL ViewPoint 5.0 Administrator’s Guide

Viewing Web Filter Reports
3. Expand the Web Filter tree and click Top Sites Over Time. The Top Sites Over Time page displays.
Figure 105 Firewall > Web Filter > Top Sites Over Time
4. The graph displays the number of access attempts for each of the top blocked web sites during the specified time period.
5. The table contains the following information:
– Site—the URL or IP address of the site.
– Attempts—the number of attempts.
– Category—the web site category.
– % of Attempts—the percentage of attempts to access the blocked site, compared to all other blocked site attempts. For example, if 500 attempts were made during the period and 100 of those attempts were for www.badsite.com, its % of Attempts field will display 20%.
6. To change date range of the report, use the Search Bar and click the Start or End field to access the drop-down calendar, or click More Options for report display settings.
7. Under Report Display Settings you can set:
– Display Type: Chart and Table, or Table Only
– Chart Type: Area, Bar, Pie or Plot chart
– Number of Sites
– Rows per Screen
See “Managing Report Settings” on page 116.
8. When you are finished, click Search. The ViewPoint Reporting Module displays the report for the selected date range.
179SonicWALL ViewPoint 5.0 Administrator’s Guide

Viewing Web Filter Reports
Viewing the Top Blocked Site Users Over TimeThe Web Filter Top Users Over Time report displays the users who made the most attempts to access blocked sites during the specified time period.
To view the Top Users Over Time report, perform the following steps:
1. Click the Firewall tab.
2. Select a SonicWALL appliance.
3. Expand the Web Filter tree and click Top Users Over Time. The Top Users Over Time page displays.
Figure 106 Firewall > Web Filter > Top Users Over Time
4. The pie chart displays the top users with the most blocked site attempts.
5. The table contains the following information:
– Users—the IP address of the user.
– Attempts—the number of attempts.
– Category—the web site category.
– % of Attempts—the percentage of attempts to access the blocked site, compared to all other user attempts. For example, if 500 attempts were made during the period and 250 of those attempts were made by a single user, his % of Attempts field will display 50%.
6. To change date range of the report, use the Search Bar and click the Start or End field to access the drop-down calendar, or click More Options for display settings.
180 SonicWALL ViewPoint 5.0 Administrator’s Guide

Viewing Web Filter Reports
7. Under Report Display Settings you can set:
– Display Type: Chart and Table, or Table Only
– Chart Type: Area, Bar, Pie or Plot chart
– Number of Sites
– Rows per Screen
See “Managing Report Settings” on page 116.
8. When you are finished, click Search. The ViewPoint Reporting Module displays the report for the selected date range.
Viewing Blocked Sites for Each User Over TimeThe Web Filter By User report displays the top blocked web sites that each user attempted to access during the specified time period.
To view the By User Over Time report, perform the following steps:
1. Click the Firewall tab.
2. Select a SonicWALL appliance.
3. Expand the Web Filter tree and click By User Over Time. The By User Over Time page displays.
Figure 107 Firewall > Web Filter > By Users Over Time
4. The table contains the following information:
– User—the IP address or name of the user.
– Attempts—the number of attempts the user made to access each web site.
5. To change date range of the report, use the Search Bar and click the Start or End field to access the drop-down calendar, or click More Options for report display settings.
181SonicWALL ViewPoint 5.0 Administrator’s Guide

Viewing Web Filter Reports
6. Under Report Display Settings you can set:
– Display Type: Chart and Table, or Table Only
– Chart Type: Area, Bar, Pie or Plot chart
– Number of Users
– Rows per Screen
See “Managing Report Settings” on page 116.
7. When you are finished, click Search. The ViewPoint Reporting Module displays the report for the selected date range.
Note These settings will stay in effect for all similar reports during your active login session.
Viewing Blocked Sites By Category Over TimeThe Web Filter By Category Over Time report displays the top categories that users attempted to access.
To view the By Category Over Time report, perform the following steps:
1. Click the Firewall tab.
2. Select a SonicWALL appliance.
3. Expand the Web Filter tree and click By Category Over Time. The By Category Over Time page displays.
Figure 108 Firewall > Web Filter > By Category Over Time
182 SonicWALL ViewPoint 5.0 Administrator’s Guide

Viewing File Transfer Protocol Reports
4. The table contains the following information:
– Category—the web site category.
– Attempts—number of attempts the user made to access each web site.
– % of Attempts—the percentage of attempts to access the blocked site, compared to all other user attempts. For example, if 500 attempts were made during the period and 250 of those attempts were made by a single user, his % of Attempts field will display 50%.
5. To change date range of the report, use the Search Bar and click the Start or End field to access the drop-down calendar, or click More Options for report display settings.
6. Under Report Display Settings you can set:
– Display Type: Chart and Table, or Table Only
– Chart Type: Area, Bar, Pie or Plot chart
– Number of Items
– Entries per Item
– Rows per Screen
See “Managing Report Settings” on page 116.
7. When you are finished, click Search. The ViewPoint Reporting Module displays the report for the selected date range.
Viewing File Transfer Protocol ReportsFTP usage reports provide information on the amount of FTP usage that occurs through the selected SonicWALL appliance(s).
FTP usage reports can be used to view FTP bandwidth usage by the hour, day, or over a period of days. Additionally, you can view the top users of FTP bandwidth.
General bandwidth reports do not always provide a complete picture of network bandwidth usage. If a large amount of FTP traffic occurs during peak times, you might need more bandwidth, you might need to upgrade network equipment, or you might ask employees to use compression or transfer large files during non-peak times.
Note All reports appear in the Firewall’s time zone.
183SonicWALL ViewPoint 5.0 Administrator’s Guide

Viewing File Transfer Protocol Reports
Select from the following:
• “Viewing the FTP Summary Report” on page 184
• “Viewing the Top FTP Sites By User” on page 185
• “Viewing FTP Bandwidth Usage Over Time” on page 187
• “Viewing the Top Users of FTP Bandwidth Over Time” on page 189
Viewing the FTP Summary Report The FTP Summary report contains information on the amount of FTP bandwidth handled by a SonicWALL appliance or all SonicWALL appliances during the specified day.
To view the FTP Summary report, perform the following steps:
1. Click the Firewall tab.
2. Select the global icon or a SonicWALL appliance.
3. Expand the FTP Usage tree and click Summary. The Summary page displays.
Figure 109 Firewall > FTP Usage > Summary
4. The bar graph displays the amount of FTP bandwidth transferred during each hour of the day.
184 SonicWALL ViewPoint 5.0 Administrator’s Guide

Viewing File Transfer Protocol Reports
5. The table contains the following information:
– Hour—when the sample was taken.
– Events—the number of FTP events.
– MBytes—the number of megabytes transferred.
– % of MBytes—the percentage of megabytes transferred during this hour, compared to the day. For example, if 1000 megabytes of FTP data was transferred during the day and 100 megabytes was transferred at the 12:00 time period, the % of MBytes field will display 10%.
6. The ViewPoint Reporting Module shows yesterday’s report. To change the date or other report settings, use the Search Bar and click the Start or End field to access the drop-down calendar, or click More Options for report display settings.
7. Under Report Display Settings you can set:
– Display Type: Chart and Table, or Table Only
– Chart Type: Area, Bar, Pie or Plot chart
See “Managing Report Settings” on page 116.
8. When you are finished, click Search. The ViewPoint Reporting Module displays the report for the selected date.
Viewing the Top FTP Sites By UserThe By User report displays the users who used the most FTP bandwidth on the specified date.
To view the By User report, perform the following steps:
1. Click the Firewall tab.
2. Select a SonicWALL appliance.
185SonicWALL ViewPoint 5.0 Administrator’s Guide

Viewing File Transfer Protocol Reports
3. Expand the FTP Usage tree and click By User. The By User page displays.
Figure 110 Firewall > FTP Usage > By User
4. The pie chart displays the percentage of bandwidth used by each user. To view the sites visited by each user, expand the user’s site tree (indicated by a ‘+’ sign).
5. The table contains the following information:
– Users—the IP address of the user.
– Events—the number of FTP Events.
– MBytes—the number of megabytes transferred.
– % of MBytes—the percentage of megabytes transferred during this hour, compared to the day. For example, if 1000 megabytes of FTP data was transferred during the day and 100 megabytes was transferred at the 12:00 time period, the % of MBytes field will display 10%.
6. By default, the ViewPoint Reporting Module shows yesterday’s report, a pie chart, and the ten top users. To change these settings, use the Search Bar and click the Start or End field to access the drop-down calendar, or click More Options for report display settings.
186 SonicWALL ViewPoint 5.0 Administrator’s Guide

Viewing File Transfer Protocol Reports
7. Under Report Display Settings you can set:
– Display Type: Chart and Table, or Table Only
– Chart Type: Area, Bar, Pie or Plot chart
– Number of Users
– Number of Sites per User
– Rows per Screen
See “Managing Report Settings” on page 116.
8. To display a limited group of users, use the Search Bar fields.
Note The search bar fields use pattern matching with operators such as “contains”. For example, “john” will match john_smith, john42, or big_john.
9. When you are finished, click Search. The ViewPoint Reporting Module displays the report for the selected date range.
Viewing FTP Bandwidth Usage Over TimeThe FTP Usage Over Time report displays the daily amount of FTP bandwidth handled by a SonicWALL appliance or all SonicWALL appliances for the specified time period.
To view the FTP Usage Over Time report, perform the following steps:
1. Click the Firewall tab.
2. Select the global icon or a SonicWALL appliance.
187SonicWALL ViewPoint 5.0 Administrator’s Guide

Viewing File Transfer Protocol Reports
3. Expand the FTP Usage tree and click Over Time. The FTP Activity page displays.
Figure 111 Firewall > FTP Usage > Over Time
4. The bar graph displays the amount of FTP bandwidth transferred during each day of the specified time period.
5. The table contains the following information:
– Date—when the sample was taken.
– Connections—the number of FTP connections.
– MBytes—the number of megabytes transferred.
– % of Usage—the percentage of megabytes transferred during this day, compared to the time period. For example, if 10,000 megabytes of FTP data was transferred during the time period and 2,500 megabytes of FTP data was transferred on one day, the % of Usage field will display 25%.
6. To change the date range of the report, use the Search Bar and click the Start or End field to access the drop-down calendar, or click More Options for report display settings.
7. Under Report Display Settings you can set:
– Display Type: Chart and Table, or Table Only
– Chart Type: Area, Bar or Plot chart
See “Managing Report Settings” on page 116.
8. When you are finished, click Search. The ViewPoint Reporting Module displays the report for the selected date range.
188 SonicWALL ViewPoint 5.0 Administrator’s Guide

Viewing File Transfer Protocol Reports
Viewing the Top Users of FTP Bandwidth Over TimeThe By Users Over Time report displays the users who used the most FTP bandwidth for the specified time period.
To view the By Users Over Time report, perform the following steps:
1. Click the Firewall tab.
2. Select a SonicWALL appliance.
3. Expand the FTP Usage tree and click By Users Over Time. The By Users Over Time page displays.
Figure 112 Firewall > FTP Usage > By Users Over Time
4. The table contains the following information:
– Users—the IP address of the user.
– Events—the number of FTP Events.
– MBytes—the number of megabytes transferred.
– % of MBytes—the percentage of megabytes transferred by this user, compared to all users. For example, if 10000 megabytes of data was transferred during the period and 2000 megabytes was transferred by the top user, the % of MBytes field will display 20%.
5. To change the date range of the report, use the Search Bar and click the Start or End field to access the drop-down calendar, or click More Options for report display settings.
189SonicWALL ViewPoint 5.0 Administrator’s Guide

Viewing Mail Usage Reports
6. Under Report Display Settings you can set:
– Display Type: Chart and Table, or Table Only
– Chart Type: Area, Bar, Pie or Plot chart
– Number of Users
– Number of Sites per User
– Rows per Screen
See “Managing Report Settings” on page 116.
7. To display a limited group of users, use the Search Bar fields.
Note The search bar fields use pattern matching with operators such as “contains”. For example, “john” will match john_smith, john42, or big_john.
8. When you are finished, click Search. The ViewPoint Reporting Module displays the report for the selected date range.
Viewing Mail Usage ReportsMail usage reports provide information on the amount of mail usage that occurs through the selected SonicWALL appliance(s).
Mail usage reports can be used to view mail bandwidth usage by the hour, day, or over a period of days. Additionally, you can view the top users of mail bandwidth.
Note Mail usage reports include SMTP, POP3, and IMAP traffic.
General bandwidth reports do not always provide a complete picture of network bandwidth usage. If a large amount of mail traffic occurs during peak times, you might want to take some of the following actions:
• Add bandwidth
• Upgrade network equipment
• Ask employees to use compression or transfer large files during non-peak times
• Ask employees to place large files on an FTP site rather than sending them as mail attachments.
190 SonicWALL ViewPoint 5.0 Administrator’s Guide

Viewing Mail Usage Reports
Note All reports appear in the Firewall’s time zone.
Select from the following:
• To view a summary of the daily mail usage, see “Viewing the Mail Usage Summary Report” on page 191.
• To view the users who consume the most mail bandwidth, see “Viewing the Top Users of Mail Bandwidth” on page 193.
• To view mail usage over a period of time, see “Viewing Mail Usage Over Time” on page 194.
• To view the users who consume the most mail bandwidth over time, see “Viewing the Top Users of Mail Bandwidth Over Time” on page 196.
Viewing the Mail Usage Summary Report The Mail Usage Summary report contains information on the amount of mail handled by a SonicWALL appliance or all SonicWALL appliances during the specified day.
To view the Mail Usage Summary report, perform the following steps:
1. Click the Firewall tab.
2. Select the global icon or a SonicWALL appliance.
191SonicWALL ViewPoint 5.0 Administrator’s Guide

Viewing Mail Usage Reports
3. Expand the Mail Usage tree and click Summary. The Summary page displays.
Figure 113 Firewall > Mail Usage > Summary
4. The bar graph displays the amount of mail sent and received during each hour of the day.
5. The table contains the following information:
– Hour—when the sample was taken.
– Events—the number of mail events.
– MBytes—the number of megabytes transferred.
– % of MBytes—the percentage of megabytes transferred during this hour, compared to the day. For example, if 10,000 megabytes of mail was transferred during the day and 1,000 megabytes was transferred at the 12:00 time period, the % of MBytes field will display 10%.
6. The ViewPoint Reporting Module shows yesterday’s report. To change the date of the report or the report display settings, use the Search Bar and click the Start or End field to access the drop-down calendar, or click More Options for display settings.
7. Under Report Display Settings you can set:
– Display Type: Chart and Table, or Table Only
– Chart Type: Area, Bar or Plot chart
See “Managing Report Settings” on page 116.
8. When you are finished, click Search. The ViewPoint Reporting Module displays the report for the selected date.
192 SonicWALL ViewPoint 5.0 Administrator’s Guide

Viewing Mail Usage Reports
Viewing the Top Users of Mail BandwidthThe Top Users report displays the users who sent and received the most mail on the specified date.
To view the Top Users report, perform the following steps:
1. Click the Firewall tab.
2. Select a SonicWALL appliance.
3. Expand the Mail Usage tree and click Top Users. The Top Users page displays.
Figure 114 Firewall > Mail Usage > Top Users
4. The pie chart displays the percentage of mail sent and received by the top mail users.
5. The table contains the following information:
– Users—the IP address of the user.
– Events—the number of mail messages sent and received.
– MBytes—the number of megabytes transferred.
– % of MBytes—the percentage of megabytes transferred by this user, compared to all users. For example, if 10000 megabytes of data was transferred during the day and 2000 megabytes was transferred by the top user, the % of MBytes field will display 20%.
193SonicWALL ViewPoint 5.0 Administrator’s Guide

Viewing Mail Usage Reports
6. By default, the ViewPoint Reporting Module shows yesterday’s report, a pie chart, and the ten top users. To change the date of the report or the report display settings, use the Search Bar and click the Start or End field to access the drop-down calendar, or click More Options for report display settings.
7. Under Report Display Settings you can set:
– Display Type: Chart and Table, or Table Only
– Chart Type: Area, Bar, Pie or Plot chart
– Number of Users
– Rows per Screen
See “Managing Report Settings” on page 116.
8. When you are finished, click Search. The ViewPoint Reporting Module displays the report for the selected date.
Viewing Mail Usage Over TimeThe Mail Usage Over Time report displays the daily amount of mail handled by a SonicWALL appliance or all SonicWALL appliances for the specified time period.
To view the Mail Usage Over Time report, perform the following steps:
1. Click the Firewall tab.
2. Select the global icon or a SonicWALL appliance.
194 SonicWALL ViewPoint 5.0 Administrator’s Guide

Viewing Mail Usage Reports
3. Expand the Mail Usage tree and click Over Time. The Over Time page displays.
Figure 115 Firewall > Mail Usage > Over Time
4. The bar graph displays the amount of mail sent and received during each day of the specified time period.
5. The table contains the following information:
– Date—when the sample was taken.
– Connections—the number of mail messages.
– MBytes—the number of megabytes transferred.
– % of MBytes—the percentage of megabytes transferred by this user, compared to all users. For example, if 10000 megabytes of data was transferred during the day and 2000 megabytes was transferred by the top user, the % of MBytes field will display 20%.
6. To change the date range of the report, use the Search Bar and click the Start or End field to access the drop-down calendar, or click More Options for report display settings.
7. Under Report Display Settings you can set:
– Display Type: Chart and Table, or Table Only
– Chart Type: Area, Bar or Plot chart
See “Managing Report Settings” on page 116.
8. When you are finished, click Search. The ViewPoint Reporting Module displays the report for the selected date range.
195SonicWALL ViewPoint 5.0 Administrator’s Guide

Viewing Mail Usage Reports
Viewing the Top Users of Mail Bandwidth Over TimeThe Top Users Over Time report displays the users who sent and received the most mail during the specified time period.
To view the Top Users Over Time report, perform the following steps:
1. Click the Firewall tab.
2. Select a SonicWALL appliance.
3. Expand the Mail Usage tree and click Top Users Over Time. The Top Users Over Time page displays.
Figure 116 Firewall > Mail Usage > Top Users Over Time
4. The pie chart displays the percentage of mail sent and received by the top mail users.
5. The table contains the following information:
– Users—the IP address of the user.
– Events—the number of mail messages sent and received.
– MBytes—the number of megabytes transferred.
– % of MBytes—the percentage of megabytes transferred by this user, compared to all users. For example, if 10,000 megabytes of data was transferred during the period and 2000 kilobytes was transferred by the top user, the % of MBytes field will display 20%.
196 SonicWALL ViewPoint 5.0 Administrator’s Guide

Viewing VPN Usage Reports
6. To change the date range of the report, use the Search Bar and click the Start or End field to access the drop-down calendar, or click More Options for report display settings.
7. Under Report Display Settings you can set:
– Display Type: Chart and Table, or Table Only
– Chart Type: Area, Bar, Pie or Plot chart
– Number of Users
– Rows per Screen
See “Managing Report Settings” on page 116.
8. To display a limited group of users, use the Search Bar fields.
The search bar fields use pattern matching with operators such as “contains”. For example, “john” will match john_smith, john42, or big_john.
9. When you are finished, click Search. The ViewPoint Reporting Module displays the report for the selected date range.
Viewing VPN Usage ReportsVPN Usage reports provide information on the amount of VPN usage that occurs through the selected SonicWALL appliance(s).
VPN Usage reports can be used to view VPN usage by the hour, day, or over a period of days. Additionally, you can view the top users of VPN.
General bandwidth reports do not always provide a complete picture of network bandwidth usage. If a large amount of VPN traffic occurs, you might need to add bandwidth, upgrade network equipment, or reconfigure the VPN network.
Note All reports appear in the Firewall’s time zone.
Select from the following:
• To view a summary of the daily VPN bandwidth usage, see “Viewing the VPN Usage Summary Report” on page 198.
• To view the users who consume the most VPN bandwidth, see “Viewing the Top VPN Users” on page 199.
• To view VPN bandwidth usage over a period of time, see “Viewing VPN Usage Over Time” on page 201.
• To view the users who consume the most VPN bandwidth over time, see “Viewing VPN Usage Over Time” on page 201.
197SonicWALL ViewPoint 5.0 Administrator’s Guide

Viewing VPN Usage Reports
• To view the users who consume the most VPN bandwidth over time, see “Viewing the Top VPN Users Over Time” on page 202.
• To view VPN usage by policy, see “Viewing VPN Usage By Policy” on page 204.
• To view VPN usage by policy over time, see “Viewing the Top VPN Policies Over Time” on page 205.
• To view hourly VPN usage by policy, see “Viewing Hourly VPN Usage By Policy” on page 207.
• To view VPN services usage, see “Viewing the VPN Services Summary Report” on page 208.
Viewing the VPN Usage Summary Report The VPN Usage Summary report contains information on the number of VPN connections made through a SonicWALL appliance or all SonicWALL appliances during the specified day.
To view the VPN Usage Summary report, perform the following steps:
1. Click the Firewall tab.
2. Select the global icon or a SonicWALL appliance.
3. Expand the VPN Usage tree and click Summary. The Summary page displays.
Figure 117 Firewall > VPN Usage > Summary
198 SonicWALL ViewPoint 5.0 Administrator’s Guide

Viewing VPN Usage Reports
4. The bar graph displays the number of VPN connections made during each hour of the day.
5. The table contains the following information:
– Hour—when the sample was taken.
– Events—the number of mail events.
– MBytes—the number of megabytes transferred.
– % of MBytes—the percentage of megabytes transferred by this user, compared to all users. For example, if 10,000 megabytes of data was transferred during the period and 2000 kilobytes was transferred by the top user, the % of MBytes field will display 20%.
6. The ViewPoint Reporting Module shows yesterday’s report. To change the date range of the report, use the Search Bar and click the Start or End field to access the drop-down calendar, or click More Options for report display settings.
7. Under Report Display Settings you can set:
– Display Type: Chart and Table, or Table Only
– Chart Type: Area, Bar or Plot chart
See “Managing Report Settings” on page 116.
8. When you are finished, click Search. The ViewPoint Reporting Module displays the report for the selected date range.
Viewing the Top VPN Users The Top Users report displays the users who made the most VPN connections on the specified date.
To view the Top Users report, perform the following steps:
1. Click the Firewall tab.
2. Select a SonicWALL appliance.
199SonicWALL ViewPoint 5.0 Administrator’s Guide

Viewing VPN Usage Reports
3. Expand the VPN Usage tree and click Top Users. The Top Users page displays.
Figure 118 Firewall > VPN Usage > Top Users
4. The pie chart displays the VPN connections for the top VPN users.
5. The table contains the following information:
– Users—the IP address of the user.
– Connections—the number of VPN connections.
– MBytes—the number of megabytes transferred.
– % of MBytes—the percentage of megabytes transferred by this user, compared to all users. For example, if 10,000 megabytes of data was transferred during the period and 2000 kilobytes was transferred by the top user, the % of MBytes field will display 20%.
6. By default, the ViewPoint Reporting Module shows yesterday’s report, a pie chart, and the ten top users. To change the date of the report, use the Search Bar and click the Start or End field to access the drop-down calendar, or click More Options for report display settings.
7. Under Report Display Settings you can set:
– Display Type: Chart and Table, or Table Only
– Chart Type: Area, Bar, Pie or Plot chart
– Number of Users
– Rows per Screen
200 SonicWALL ViewPoint 5.0 Administrator’s Guide

Viewing VPN Usage Reports
See “Managing Report Settings” on page 116.
8. When you are finished, click Search. The ViewPoint Reporting Module displays the report for the selected date.
9. These settings will stay in effect for all similar reports during your active login session.
Viewing VPN Usage Over TimeThe VPN Usage Over Time report displays the daily number of VPN connections made through a SonicWALL appliance or all SonicWALL appliances during the specified time period.
To view the VPN Usage Over Time report, perform the following steps:
1. Click the Firewall tab.
2. Select the global icon or a SonicWALL appliance.
3. Expand the VPN Usage tree and click Over Time. The Over Time page displays.
Figure 119 Firewall > VPN Usage > Over Time
4. The bar graph displays the number of VPN connections made during each day of the specified time period.
201SonicWALL ViewPoint 5.0 Administrator’s Guide

Viewing VPN Usage Reports
5. The table contains the following information:
– Date—when the sample was taken.
– Connections—the number of connections.
– MBytes—the number of megabytes transferred.
– % of MBytes—the percentage of megabytes transferred by this user, compared to all users. For example, if 10,000 megabytes of data was transferred during the period and 2000 kilobytes was transferred by the top user, the % of MBytes field will display 20%.
6. To change the date range of the report, use the Search Bar and click the Start or End field to access the drop-down calendar, or click More Options for report display settings.
7. Under Report Display Settings you can set:
– Display Type: Chart and Table, or Table Only
– Chart Type: Area, Bar or Plot chart
See “Managing Report Settings” on page 116.
8. When you are finished, click Search. The ViewPoint Reporting Module displays the report for the selected date range.
Viewing the Top VPN Users Over TimeThe Top Users report displays the users who made the most VPN connections for the specified time period.
To view the Top Users report, perform the following steps:
1. Click the Firewall tab.
2. Select a SonicWALL appliance.
202 SonicWALL ViewPoint 5.0 Administrator’s Guide

Viewing VPN Usage Reports
3. Expand the VPN Usage tree and click Top Users Over Time. The Top Users Over Time page displays.
Figure 120 Firewall > VPN Usage > Top Users Over Time
4. The pie chart displays the VPN connections for the top VPN users.
5. The table contains the following information:
– Users—the IP address of the user.
– Connections—the number of VPN connections.
– MBytes—the number of megabytes transferred.
– % of MBytes—the percentage of megabytes transferred by this user, compared to all users. For example, if 10,000 megabytes of data was transferred during the period and 2000 kilobytes was transferred by the top user, the % of MBytes field will display 20%.
6. To change the date range of the report, use the Search Bar and click the Start or End field to access the drop-down calendar, or click More Options for report display settings.
203SonicWALL ViewPoint 5.0 Administrator’s Guide

Viewing VPN Usage Reports
7. Under Report Display Settings you can set:
– Display Type: Chart and Table, or Table Only
– Chart Type: Area, Bar, Pie or Plot chart
– Number of Users
– Rows per Screen
See “Managing Report Settings” on page 116.
8. When you are finished, click Search. The ViewPoint Reporting Module displays the report for the selected date range.
Viewing VPN Usage By PolicyThe VPN Usage By Policy report contains information on VPN usage for a SonicWALL appliance, organized by policy.
To view the VPN Usage By Policy report, perform the following steps:
1. Click the Firewall tab.
2. Select a SonicWALL appliance.
3. Expand the VPN Usage tree and click By Policy. The By Policy page displays.
Figure 121 Firewall > VPN Usage > By Policy
4. The pie chart displays the amount of data transferred for each policy.
204 SonicWALL ViewPoint 5.0 Administrator’s Guide

Viewing VPN Usage Reports
5. The table contains the following information:
– Policy—the name of the policy.
– Events—the number of VPN events.
– MBytes—the number of megabytes transferred.
– % of MBytes—the percentage of megabytes transferred for this policy, compared to all other policies. For example, if a total of 10,000 megabytes was transferred and 2,500 megabytes was transferred for one policy, the % of Usage field will display 25%.
6. The ViewPoint Reporting Module shows yesterday’s report. To change the date of the report, use the Search Bar and click the Start or End field to access the drop-down calendar, or click More Options for report display settings.
7. Under Report Display Settings you can set:
– Display Type: Chart and Table, or Table Only
– Chart Type: Area, Bar, Pie or Plot chart
– Number of Items
– Rows per Screen
See “Managing Report Settings” on page 116.
8. When you are finished, click Search. The ViewPoint Reporting Module displays the report for the selected date.
Viewing the Top VPN Policies Over TimeThe By Policy Over Time report displays the top VPN Policies for the specified time period.
To view the By Policy Over Time report, perform the following steps:
1. Click the Firewall tab.
2. Select a SonicWALL appliance.
205SonicWALL ViewPoint 5.0 Administrator’s Guide

Viewing VPN Usage Reports
3. Expand the VPN Usage tree and click By Policy Over Time. The By Policy Over Time page displays.
Figure 122 Firewall > VPN Usage > By Policy Over Time
4. The pie chart displays the VPN connections for the top policies.
5. The table contains the following information:
– Policy—the name of the policy.
– Events—the number of VPN events.
– MBytes—the number of megabytes transferred.
– % of MBytes—the percentage of megabytes transferred for this policy, compared to all other policies for the period. For example, if a total of 100,000 megabytes was transferred and 3,000 megabytes was transferred for one policy, the % of MBytes field will display 3%.
6. To change the date range of the report, use the Search Bar and click the Start or End field to access the drop-down calendar, or click More Options for report display settings.
206 SonicWALL ViewPoint 5.0 Administrator’s Guide

Viewing VPN Usage Reports
7. Under Report Display Settings you can set:
– Display Type: Chart and Table, or Table Only
– Chart Type: Area, Bar, Pie or Plot chart
– Number of Items
– Rows per Screen
See “Managing Report Settings” on page 116.
8. When you are finished, click Search. The ViewPoint Reporting Module displays the report for the selected date range.
Viewing Hourly VPN Usage By PolicyThe VPN Usage By Policy Hourly report contains information on hourly VPN usage for a SonicWALL appliance, organized by policy.
To view the VPN Usage By Policy Hourly report, perform the following steps:
1. Click the Firewall tab.
2. Select a SonicWALL appliance.
3. Expand the VPN Usage tree and click By Policy Hourly. The By Policy Hourly page displays.
Figure 123 Firewall > VPN Usage > By Policy Hourly
4. The table contains the following information:
– Hour—the period of time.
– Events—the number of VPN events.
– MBytes—the number of megabytes transferred.
5. The ViewPoint Reporting Module shows yesterday’s report. To change the date range of the report, use the Search Bar and click the Start or End field to access the drop-down calendar, or click More Options for report display settings.
207SonicWALL ViewPoint 5.0 Administrator’s Guide

Viewing VPN Usage Reports
6. Under Report Display Settings you can set:
– Display Type: Chart and Table, or Table Only
– Chart Type: Area, Bar or Plot chart
– Hour Begin
– Hour End
See “Managing Report Settings” on page 116.
7. When you are finished, click Search. The ViewPoint Reporting Module displays the report for the selected date.
Viewing the VPN Services Summary Report The Services Summary report displays the amount of traffic handled by each service during each hour of the specified day.
To view the Services Summary report, perform the following steps:
1. Click the Firewall tab.
2. Select a SonicWALL appliance.
3. Expand the VPN Usage tree and click By Service. The By Service page displays.
Figure 124 Firewall > VPN Usage > By Service
208 SonicWALL ViewPoint 5.0 Administrator’s Guide

Viewing Attacks Reports
4. The bar graph displays the amount of bandwidth used by each service during each hour of the day.
5. The table contains the following information:
– Protocol—the service.
– Events—the number of events or “hits.”
– MBytes—the number of megabytes.
– % of MBytes—the percentage of megabytes transferred by this service on the selected day, compared to all other services. For example, if 1,000 megabytes were transferred and 900 megabytes were handled by the HTTP service, the % of Mbytes field will display 90%.
6. The ViewPoint Reporting Module shows yesterday’s report. To change the date of the report, use the Search Bar and click the Start or End field to access the drop-down calendar, or click More Options for report display settings.
7. Under Report Display Settings you can set:
– Display Type: Chart and Table, or Table Only
– Chart Type: Area, Bar or Plot chart
See “Managing Report Settings” on page 116.
8. When you are finished, click Search. The ViewPoint Reporting Module displays the report for the selected date.
9. These settings will stay in effect for all similar reports during your active login session.
Viewing Attacks ReportsAttacks reports show the number of attacks that were directed at or through the selected SonicWALL appliance(s). These include denial of service attacks, intrusions, probes, and all other malicious activity directed at the SonicWALL appliance or computers on the LAN or DMZ.
Note All reports appear in the Firewall’s time zone.
209SonicWALL ViewPoint 5.0 Administrator’s Guide

Viewing Attacks Reports
Select from the following:
• To view a summary of the attacks, see “Viewing the Attack Summary Report” on page 210.
• To view the attacks by attack category, see “Viewing the Attacks By Category” on page 212.
• To view the attacks by source IP address, see “Viewing the Errors Report” on page 213.
• To view a summary of the errors and exceptions, see “Viewing the Errors Report” on page 213.
• To view attacks over a period of time, see “Viewing Attack Reports Over Time” on page 215.
• To view errors and exceptions over a period of time, see “Viewing Errors Over Time” on page 217.
Viewing the Attack Summary Report The Attack Summary report contains information on the number of attacks attempted on a SonicWALL appliance or all SonicWALL appliances during the specified day.
To view the Attack Summary report, perform the following steps:
1. Click the Firewall tab.
2. Select the global icon or a SonicWALL appliance.
210 SonicWALL ViewPoint 5.0 Administrator’s Guide

Viewing Attacks Reports
3. Expand the Attacks tree and click Summary. The Summary page displays.
Figure 125 Firewall > Attacks > Summary
4. The bar graph displays the number of attacks attempted during each hour of the day. The table contains the following information:
– Hour—when the sample was taken.
– Attacks—the number of attack attempts.
– % of Attacks—the percentage of attacks during this hour, compared to the day. For example, if 1,000 attacks occurred during the day and 100 attacks occurred during the 2:00 time period, the % of Attacks field will display 10%.
5. The ViewPoint Reporting Module shows yesterday’s report. To change the date of the report, use the Search Bar and click the Start or End field to access the drop-down calendar, or click More Options for report display settings.
6. Under Report Display Settings you can set:
– Display Type: Chart and Table, or Table Only
– Chart Type: Area, Bar or Plot chart
See “Managing Report Settings” on page 116.
7. When you are finished, click Search. The ViewPoint Reporting Module displays the report for the selected date.
211SonicWALL ViewPoint 5.0 Administrator’s Guide

Viewing Attacks Reports
Viewing the Attacks By CategoryThe Attacks By Category report displays the attacks that occurred on the specified date, sorted by category.
To view the Attacks By Category report, perform the following steps:
1. Click the Firewall tab.
2. Select a SonicWALL appliance.
3. Expand the Attacks tree and click By Category. The By Category page displays.
Figure 126 Firewall > Attacks > By Category
4. The pie chart displays the percentage of each type of attack. To view source and destination information on the individual attacks, expand the category tree (indicated by a ‘+’ sign).
5. The table contains the following information:
– Type—the type of attack
– Source—the IP address of the source
– Destination—the IP address to the destinationClick the highlighted source or destination IP address to access the Who is Source Website.
212 SonicWALL ViewPoint 5.0 Administrator’s Guide

Viewing Attacks Reports
– Attacks—the number of attacks
– % of Attacks—the percentage of this type of attack, compared to all other attack types. For example, if 5,000 attacks occurred during the day and the IP Spoof makes up 500 of the attacks, its % of Attacks field will display 10%.
6. By default, the ViewPoint Reporting Module shows yesterday’s report, a pie chart, and the ten top categories. To change the date of the report, use the Search Bar and click the Start or End field to access the drop-down calendar, or click More Options for report display settings.
7. Under Report Display Settings you can set:
– Display Type: Chart and Table, or Table Only
– Chart Type: Area, Bar, Pie or Plot chart
– Number of Items
– Entries per Item
– Rows per Screen
See “Managing Report Settings” on page 116.
8. When you are finished, click Search. The ViewPoint Reporting Module displays the report for the selected date.
9. These settings will stay in effect for all similar reports during your active login session.
Viewing the Errors Report The Errors Summary report contains information on the number of dropped packets on a SonicWALL appliance or all SonicWALL appliances during the specified day.
To view the Errors report, perform the following steps:
1. Click the Firewall tab.
2. Select the global icon or a SonicWALL appliance.
213SonicWALL ViewPoint 5.0 Administrator’s Guide

Viewing Attacks Reports
3. Expand the Attacks tree and click Errors. The Errors page displays.
Figure 127 Firewall > Attacks > Errors
4. The bar graph displays the packets that were dropped during each hour of the day.
5. The table contains the following information:
– Hour—when the sample was taken.
– Packets—the number of dropped packets.
– % of Packets—the percentage of packets dropped during this hour, compared to the day. For example, if 1,000 packets were dropped during the day and 100 packets were dropped during the 1:00 time period, the % of Packets field will display 10%.
6. The ViewPoint Reporting Module shows yesterday’s report.To change the date of the report, use the Search Bar and click the Start or End field to access the drop-down calendar, or click More Options for report display settings.
7. Under Report Display Settings you can set:
– Display Type: Chart and Table, or Table Only
– Chart Type: Area, Bar or Plot chart
See “Managing Report Settings” on page 116.
8. When you are finished, click Search. The ViewPoint Reporting Module displays the report for the selected date.
214 SonicWALL ViewPoint 5.0 Administrator’s Guide

Viewing Attacks Reports
Viewing Attack Reports Over TimeThe Attacks Over Time report displays the daily number of attempted attacks during the specified time period.
To view the Attacks Over Time report, perform the following steps:
1. Click the Firewall tab.
2. Select the global icon or a SonicWALL appliance.
3. Expand the Attacks tree and click Attacks Over Time. The Attacks Over Time page displays.
Figure 128 Firewall > Attacks > Attacks Over Time
4. The bar graph displays the number of attacks attempted each day of the time period.
5. The table contains the following information:
– Date—when the sample was taken.
– Attacks—the number of attacks.
– % of Attacks—the percentage of attacks on this day, compared to the time period. For example, if 10,000 attacks occurred during the time period and 1,000 attacks occurred on Thursday, its % of Attacks field will display 10%.
6. To change the date range of the report, use the Search Bar and click the Start or End field to access the drop-down calendar, or click More Options for report display settings.
215SonicWALL ViewPoint 5.0 Administrator’s Guide

Viewing Attacks Reports
7. Under Report Display Settings you can set:
– Display Type: Chart and Table, or Table Only
– Chart Type: Area, Bar or Plot chart
See “Managing Report Settings” on page 116.
8. When you are finished, click Search. The ViewPoint Reporting Module displays the report for the selected date range.
Viewing the Attacks By Category Over TimeThe Categories Over Time report displays the number of attacks in each attack category during the specified time period.
To view the Categories Over Time report, perform the following steps:
1. Click the Firewall tab.
2. Select the global icon or a SonicWALL appliance.
3. Expand the Attacks tree and click Categories Over Time. The Categories Over Time page displays.
Figure 129 Firewall > Attacks > Categories Over Time
4. The bar graph displays the number of attacks attempted each day of the specified time period. To view source and destination information on the individual attacks, expand the category tree (indicated by a ‘+’ sign).
216 SonicWALL ViewPoint 5.0 Administrator’s Guide

Viewing Attacks Reports
5. The table contains the following information:
– Type—the type of attack
– Source—the IP address of the source
– Destination—the IP address to the destinationClick the highlighted source or destination IP address to access the Whois Source Website.
– Attacks—the number of attacks
– % of Attacks—the percentage of this type of attack, compared to all other attack types. For example, if 5,000 attacks occurred during the day and the IP Spoof makes up 500 of the attacks, its % of Attacks field will display 10%.
6. To change the date range of the report, use the Search Bar and click the Start or End field to access the drop-down calendar, or click More Options for report display settings.
7. Under Report Display Settings you can set:
– Display Type: Chart and Table, or Table Only
– Chart Type: Area, Bar, Pie or Plot chart
– Number of Items
– Entries per Item
– Rows per Screen
See “Managing Report Settings” on page 116.
8. When you are finished, click Search. The ViewPoint Reporting Module displays the report for the selected date range.
Viewing Errors Over TimeThe Errors Over Time report displays the number of errors during the specified time period.
To view the Errors Over Time report, perform the following steps:
1. Click the Firewall tab.
2. Select the global icon or a SonicWALL appliance.
217SonicWALL ViewPoint 5.0 Administrator’s Guide

Viewing Attacks Reports
3. Expand the Attacks tree and click Errors Over Time. The Dropped Packets & Exceptions page displays.
Figure 130 Firewall > Attacks > Errors Over Time
4. The bar graph displays the number of packets that were dropped during each day of the specified time period.
5. The table contains the following information:
– Date—when the sample was taken.
– Dropped Packets—the number of dropped packets.
– % of Errors—the percentage of dropped packets on this day, compared to the time period. For example, if 10,000 packets were dropped during the time period and 1,000 packets were dropped on Wednesday, its % of Attacks field will display 10%.
6. To change the date range of the report, use the Search Bar and click the Start or End field to access the drop-down calendar, or click More Options for report display settings.
7. Under Report Display Settings you can set:
– Display Type: Chart and Table, or Table Only
– Chart Type: Area, Bar or Plot chart
See “Managing Report Settings” on page 116.
8. When you are finished, click Search. The ViewPoint Reporting Module displays the report for the selected date range.
218 SonicWALL ViewPoint 5.0 Administrator’s Guide

Viewing Virus Attacks Reports
Viewing Virus Attacks ReportsVirus Attacks reports show the number of virus attacks that were directed at or through the selected SonicWALL appliance(s).
Note All reports appear in the Firewall’s time zone.
If the selected appliance is not licensed for SonicWALL Gateway Anti-Virus, a sample report is displayed, as shown in Figure 131. You can click the Click Here link near the top to view the global dashboard report showing all viruses and similar attacks currently being monitored by SonicWALL, or click the link at the bottom of the page to read detailed information about SonicWALL Gateway Anti-Virus and other subscription services.
Figure 131 Sample Virus Attack Report
219SonicWALL ViewPoint 5.0 Administrator’s Guide

Viewing Virus Attacks Reports
Select from the following reports:
• To view the top virus, see “Viewing the Top Viruses By Attack Attempts Report” on page 221.
• To view the virus attacks by top destinations, see “Viewing the Virus Attack Attempts Report” on page 222.
• To view virus attacks over time, see “Viewing the Virus Attack Attempts Report” on page 222.
• To view virus attacks over a period of time, see “Viewing the Virus Attacks By User Report” on page 224.
• To view virus attacks by top destinations over time, see “Viewing Anti-Spyware Reports” on page 226.
9. Expand the Virus Attacks tree and click Summary. The Summary page displays
Figure 132 Firewall > Virus Attacks > Summary
10. The bar graph displays the number of virus attacks attempted during each hour of the day. The table contains the following information:
– Hour—the hour of the day for which the summary is provided.
– Attempts—the number of times the virus attempted to infect the device during a pre-set time interval (the hour of the day is the default).
– % of Attempts—the percent of attempts the current virus entry comprises as a portion of the aggregate number of virus attempts on the device during a pre-set time interval (the hour of the day is the default).
220 SonicWALL ViewPoint 5.0 Administrator’s Guide

Viewing Virus Attacks Reports
11. The ViewPoint Reporting Module shows yesterday’s report. To change the date range of the report, use the Search Bar and click the Start or End field to access the drop-down calendar, or click More Options for report display settings.
12. Under Report Display Settings you can set:
– Display Type: Chart and Table, or Table Only
– Chart Type: Area, Bar or Plot chart
See “Managing Report Settings” on page 116.
13. When you are finished, click Search. The ViewPoint Reporting Module displays the report for the selected date range.
Viewing the Top Viruses By Attack Attempts ReportThe Top Viruses By Attack Attempts report displays the top viruses for the specified date.
To view the Top Viruses, perform the following steps:
1. Click the Firewall tab.
2. Select the global icon or a SonicWALL appliance.
3. Expand the Virus Attacks tree and click By Virus. The Top Viruses By Attack Attempts page displays.
Figure 133 Firewall > Virus Attacks > By Virus
221SonicWALL ViewPoint 5.0 Administrator’s Guide

Viewing Virus Attacks Reports
4. The pie chart displays the percentage of virus attacks attempted in a given day.
5. The table contains the following information:
– Virus—the name of the virus.
– Attempts—the number of attack attempts.
– % of Attempts—the percentage of attempts as compared to the day.
6. The ViewPoint Reporting Module shows yesterday’s report. To change the date range of the report, use the Search Bar and click the Start or End field to access the drop-down calendar, or click More Options for report display settings.
7. Under Report Display Settings you can set:
– Display Type: Chart and Table, or Table Only
– Chart Type: Area, Bar, Pie or Plot chart
– Number of Items
– Entries per Item
– Rows per Screen
See “Managing Report Settings” on page 116.
8. When you are finished, click Search. The ViewPoint Reporting Module displays the report for the selected date range.
Viewing the Virus Attack Attempts ReportThe Virus Attack Attempts report displays the number of virus attempts over the specified time range.
To view the Virus Attack Attempts report, perform the following steps:
1. Click the Firewall tab.
2. Select the global icon or a SonicWALL appliance.
222 SonicWALL ViewPoint 5.0 Administrator’s Guide

Viewing Virus Attacks Reports
3. Expand the Virus Attacks tree and click Over Time. The Virus Attack Attempts page displays.
Figure 134 Firewall > Virus Attacks > Over Time
4. The bar graph displays the number of virus attempts that were made during each day over a specified time period.
5. The table contains the following information:
– Date—the date of when the sample was taken.
– Attempts—the number of attempted virus attacks.
– % of Attempts—the percentage of attempted virus attacks in a day compared to the time period. For example, if 5,000 attempts were made during the time period and 500 were made on one day, its % of Attempts field will display 10%.
6. To change the date range of the report, use the Search Bar and click the Start or End field to access the drop-down calendar, or click More Options for report display settings.
223SonicWALL ViewPoint 5.0 Administrator’s Guide

Viewing Virus Attacks Reports
7. Under Report Display Settings you can set:
– Display Type: Chart and Table, or Table Only
– Chart Type: Area, Bar, Pie or Plot chart
– Number of Items
– Entries per Item
– Rows per Screen
See “Managing Report Settings” on page 116.
8. When you are finished, click Search. The ViewPoint Reporting Module displays the report for the selected date range.
Viewing the Virus Attacks By User ReportThe Virus Attacks By User report displays the number of virus attack attempts over the specified time range.
To view the Virus Attacks By User report, perform the following steps:
1. Click the Firewall tab.
2. Select the global icon or a SonicWALL appliance.
224 SonicWALL ViewPoint 5.0 Administrator’s Guide

Viewing Virus Attacks Reports
3. Expand the Virus Attacks tree and click By Viruses Over Time. The Virus Attacks By User page displays.
Figure 135 Firewall > Virus Attacks > By Viruses Over Time
4. The pie chart displays the percentage of virus attacks attempted in a given day.
5. The table contains the following information:
– Virus—the name of the virus.
– Attempts—the number of attack attempts.
– % of Attempts—the percentage of attempts compared to the day.
6. The ViewPoint Reporting Module shows yesterday’s report. To change the date range of the report, use the Search Bar and click the Start or End field to access the drop-down calendar, or click More Options for report display settings.
225SonicWALL ViewPoint 5.0 Administrator’s Guide

Viewing Anti-Spyware Reports
7. Under Report Display Settings you can set:
– Display Type: Chart and Table, or Table Only
– Chart Type: Area, Bar, Pie or Plot chart
– Number of Items
– Entries per Item
– Rows per Screen
See “Managing Report Settings” on page 116.
8. When you are finished, click Search. The ViewPoint Reporting Module displays the report for the selected date range.
Viewing Anti-Spyware ReportsSonicWALL Anti-Spyware is included within the SonicWALL Gateway Anti-Virus (GAV), Anti-Spyware and Intrusion Prevention Service (IPS) unified threat management (UTM) solution. SonicWALL UTM delivers a comprehensive, real-time gateway security solution for your entire network.
Unlike other threat management solutions, SonicWALL Gateway Anti-Virus, Anti-Spyware and Intrusion Prevention Service has the capacity to analyze files of any size in real-time without the need to add expensive hardware drive or extra memory. SonicWALL Gateway Anti-Virus, Anti-Spyware and Intrusion Prevention Service includes a pro-active alerting mechanism that notifies network administrators when a new threat is discovered. Granular policy tools and an intuitive user interface enable administrators to configure a custom set of detection or prevention policies tailored to their specific network environment. Network administrators can create global policies between security zones and group attacks by priority, simplifying deployment and management across a distributed network.
226 SonicWALL ViewPoint 5.0 Administrator’s Guide

Viewing Anti-Spyware Reports
If the selected appliance is not licensed for SonicWALL Anti-Spyware, a sample report is displayed, as shown in Figure 136. You can click the Click Here link near the top to view the global dashboard report showing all spyware and similar attacks currently being monitored by SonicWALL, or click the link at the bottom of the page to read detailed information about SonicWALL Anti-Spyware and other subscription services.
Figure 136 Sample Spyware Attack Report
See the following sections to view Anti-Spyware reports:
• “Viewing a Spyware Summary” on page 228
• “Viewing Spyware Attempts By Category” on page 229
• “Viewing Spyware Attempts Over Time” on page 230
• “Viewing Spyware Attempts By Category Over Time” on page 232
227SonicWALL ViewPoint 5.0 Administrator’s Guide

Viewing Anti-Spyware Reports
Viewing a Spyware SummaryThe Anti-Spyware Summary report contains information on the number of spyware attempts by hour of the day.
To view a spyware Summary, perform the following steps:
1. Click the Firewall tab.
2. Select the global icon or a SonicWALL appliance.
3. Expand the Anti-Spyware tree and click Summary. The Summary page displays.
Figure 137 Firewall > Anti-Spyware > Summary
4. The bar graph displays the number of virus attacks attempted during each hour of the day.
5. The table contains the following information:
– Hour—the hour of the day for which the summary is provided.
– Attempts—the number of times the spyware attempted to infect the device during a pre-set time interval (the hour of the day is the default).
– % of Attempts—the percent of attempts the current spyware entry comprises as a portion of the aggregate number of spyware attempts on the device during a pre-set time interval (the hour of the day is the default).
6. The ViewPoint Reporting Module shows yesterday’s report. To change the date range of the report, use the Search Bar and click the Start or End field to access the drop-down calendar, or click More Options for report display settings.
228 SonicWALL ViewPoint 5.0 Administrator’s Guide

Viewing Anti-Spyware Reports
7. Under Report Display Settings you can set:
– Display Type: Chart and Table, or Table Only
– Chart Type: Area, Bar or Plot chart
See “Managing Report Settings” on page 116.
8. When you are finished, click Search. The ViewPoint Reporting Module displays the report for the selected date range.
9. Note this page displays the number of spyware attempts that occurred during two-hour intervals during the past day.
Viewing Spyware Attempts By CategoryThese reports display the spyware activity by category including the actual category or classification of the spyware, the priority, and the event/attacks type. By using the category as criteria, you can display details about the type/message text and number of events.
To view spyware attempts by category, perform the following steps:
1. Click the Firewall tab.
2. Select a SonicWALL appliance.
3. Expand the Anti-Spyware tree and click By Category. The By Category page displays.
Figure 138 Firewall > Anti-Spyware > By Category
229SonicWALL ViewPoint 5.0 Administrator’s Guide

Viewing Anti-Spyware Reports
4. The pie chart displays the percentage of spyware attempts by category.
5. The table contains the following information:
– Category—the category of the spyware.
– Attempts—the number of times the spyware attempted to infect the device using the category as a criteria.
– % of Attempts—the percent of attempts the current spyware entry comprises as a portion of the aggregate number of spyware attempts using the category as a criteria.
6. To change the date range of the report, use the Search Bar and click the Start or End field to access the drop-down calendar, or click More Options for report display settings.
7. Under Report Display Settings you can set:
– Display Type: Chart and Table, or Table Only
– Chart Type: Area, Bar, Pie or Plot chart
– Number of Items
– Entries per Item
– Rows per Screen
See “Managing Report Settings” on page 116.
8. When you are finished, click Search. The ViewPoint Reporting Module displays the report for the selected date range.
Viewing Spyware Attempts Over TimeYou can display spyware attempts over a set time interval. These reports are available at the unit and global levels similar to the other summary reports. To view spyware attempts using pre-set time intervals as the viewing criteria, perform the following steps:
1. Click the Firewall tab.
2. Select the global icon or a SonicWALL appliance.
230 SonicWALL ViewPoint 5.0 Administrator’s Guide

Viewing Anti-Spyware Reports
3. Expand the Anti-Spyware tree and click Over Time. The Over Time page displays.
Figure 139 Firewall > Anti-Spyware > Over Time
4. The bar graph displays the number of spyware attempts that were made during each day over a specified time period.
5. The table contains the following information:
– Date—the date for which the summary is provided.
– Attempts—the number of times the spyware attempted to infect the device during a specific date.
– % of Attempts—the percent of attempts the current spyware entry comprises as a portion of the aggregate number of spyware attempts on the device during a pre-set time interval.
6. To change the date range of the report, use the Search Bar and click the Start or End field to access the drop-down calendar, or click More Options for report display settings.
7. Under Report Display Settings you can set:
– Display Type: Chart and Table, or Table Only
– Chart Type: Area, Bar or Plot chart
See “Managing Report Settings” on page 116.
8. When you are finished, click Search. The ViewPoint Reporting Module displays the report for the selected date range.
231SonicWALL ViewPoint 5.0 Administrator’s Guide

Viewing Anti-Spyware Reports
Viewing Spyware Attempts By Category Over TimeYou can generate reports that display the spyware activity by category, such as the category, priority, and events/attacks over time. Using the category over time statistic as criteria for report generation provides details about the type/message text and number of events.
To view Anti-Spyware attempts using categories over time intervals as the viewing criteria, perform the following steps:
1. Click the Firewall tab.
2. Select a SonicWALL appliance.
3. Expand the Anti-Spyware tree and click By Category Over Time. The By Category Over Time page displays.
Figure 140 Firewall > Anti-Spyware > By Category Over Time
4. The pie chart displays the percentage of spyware attempts by category. The table contains the following information:
– Category—the category of the virus.
– Attempts—the number of times the spyware attempted to infect the device during a pre-set time interval.
– % of Attempts—the percent of attempts the current spyware entry comprises as a portion of the aggregate number of spyware attempts on the device during a pre-set time interval.
5. To change the date range of the report, use the Search Bar and click the Start or End field to access the drop-down calendar, or click More Options for report display settings.
232 SonicWALL ViewPoint 5.0 Administrator’s Guide

Viewing Intrusion Prevention Reports
6. Under Report Display Settings you can set:
– Display Type: Chart and Table, or Table Only
– Chart Type: Area, Bar, Pie or Plot chart
– Number of Items
– Entries per Item
– Rows per Screen
See “Managing Report Settings” on page 116.
7. To display a limited group of items, use the Search Bar fields.
Note The search bar fields use pattern matching with operators such as “contains”. For example, “john” will match john_smith or john42.
8. When you are finished, click Search. The ViewPoint Reporting Module displays the report for the selected date range.
Viewing Intrusion Prevention ReportsThe Intrusion Prevention Service (IPS) reports show the number of attempted intrusions that occurred during the specified time period.
Note All reports appear in the Firewall’s time zone.
If the selected appliance is not licensed for SonicWALL Intrusion Prevention Service, a sample report is displayed, as shown in Figure 141. You can click the Click Here link near the top to view the global dashboard report showing all intrusions and similar attacks currently being monitored by SonicWALL, or click the link at the bottom of the page to read detailed information about SonicWALL Intrusion Prevention Service and other subscription services.
233SonicWALL ViewPoint 5.0 Administrator’s Guide

Viewing Intrusion Prevention Reports
Figure 141 Sample Intrusion Report
Select from the following intrusion reports:
• To view a summary of the attacks, see “Viewing the Intrusion Prevention Summary Report” on page 235.
• To view the attacks by source IP address, see “Viewing the Errors Report” on page 213.
• To view a summary of the errors and exceptions, see “Viewing the Errors Report” on page 213.
• To view attacks over a period of time, see “Viewing Attack Reports Over Time” on page 215.
• To view errors and exceptions over a period of time, see “Viewing Errors Over Time” on page 217.
234 SonicWALL ViewPoint 5.0 Administrator’s Guide

Viewing Intrusion Prevention Reports
Viewing the Intrusion Prevention Summary Report The Attack Summary report contains information on the number of attempted intrusions on a SonicWALL appliance or all SonicWALL appliances during the specified day.
To view the IPS Summary report, perform the following steps:
1. Click the Firewall tab.
2. Select the global icon or a SonicWALL appliance.
3. Expand the Intrusion Prevention tree and click Summary. The Summary page displays.
Figure 142 Firewall > Intrusion Prevention > Summary
4. The bar graph displays the number of intrusions attempted during each hour of the day.
235SonicWALL ViewPoint 5.0 Administrator’s Guide

Viewing Intrusion Prevention Reports
5. The table contains the following information:
– Hour—when the sample was taken.
– Intrusions—the number of intrusion attempts.
– % of Intrusions—the percentage of intrusion attempts on this day, compared to the time period. For example, if 10,000 intrusion attempts occurred during the time period and 1,000 intrusion attempts occurred on Thursday, its % of Intrusions field will display 10%.
6. The ViewPoint Reporting Module shows yesterday’s report. To change the date of the report, use the Search Bar and click the Start or End field to access the drop-down calendar, or click More Options for report display settings.
7. Under Report Display Settings you can set:
– Display Type: Chart and Table, or Table Only
– Chart Type: Area, Bar or Plot chart
See “Managing Report Settings” on page 116.
8. When you are finished, click Search. The ViewPoint Reporting Module displays the report for the selected date.
Viewing Intrusion Attempts By CategoryThese reports display the intrusion activity by category including the actual category or classification of the intrusion, the priority, and the event/attacks type. By using the category as criteria, you can display details about the type/message text and number of events.
To view intrusion attempts by category, perform the following steps:
1. Click the Firewall tab.
2. Select a SonicWALL appliance.
236 SonicWALL ViewPoint 5.0 Administrator’s Guide

Viewing Intrusion Prevention Reports
3. Expand the Intrusion Prevention tree and click By Category. The By Category page displays.
Figure 143 Firewall > Intrusion Prevention > By Category
4. The pie chart displays a list of intrusions attempted by category. The table contains the following information:
– Category—the category of the intrusion attempt.
– Intrusions—the number of intrusion attempts.
– % of Intrusions—the percentage of intrusion attempts as a portion of the aggregate number of intrusion attempts using the category as a criteria.
5. To change the date of the report, use the Search Bar and click the Start or End field to access the drop-down calendar, or click More Options for report display settings.
237SonicWALL ViewPoint 5.0 Administrator’s Guide

Viewing Intrusion Prevention Reports
6. Under Report Display Settings you can set:
– Display Type: Chart and Table, or Table Only
– Chart Type: Area, Bar, Pie or Plot chart
– Number of Items
– Entries per Item
– Rows per Screen
See “Managing Report Settings” on page 116.
7. When you are finished, click Search. The ViewPoint Reporting Module displays the report for the selected date.
Viewing Intrusions Over TimeThe Over Time report displays the daily number of intrusion attempts during the specified time period.
To view the Intrusions Over Time report, perform the following steps:
1. Click the Firewall tab.
2. Select the global icon or a SonicWALL appliance.
238 SonicWALL ViewPoint 5.0 Administrator’s Guide

Viewing Intrusion Prevention Reports
3. Expand the Intrusion Prevention tree and click Intrusions Over Time. The Intrusions Over Time page displays.
Figure 144 Firewall > Intrusion Prevention > Over Time
4. The bar graph displays the number of intrusions attempted each day of the specified time period.
5. The table contains the following information:
– Date—when the sample was taken.
– Intrusions—the number of intrusion attempts.
– % of Intrusions—the percentage of intrusion attempts on this day, compared to the time period. For example, if 10,000 intrusion attempts occurred during the time period and 1,000 intrusion attempts occurred on Thursday, its % of Intrusions field will display 10%.
6. To change the date range of the report, use the Search Bar and click the Start or End field to access the drop-down calendar, or click More Options for report display settings.
239SonicWALL ViewPoint 5.0 Administrator’s Guide

Viewing Intrusion Prevention Reports
7. Under Report Display Settings you can set:
– Display Type: Chart and Table, or Table Only
– Chart Type: Area, Bar or Plot chart
See “Managing Report Settings” on page 116.
8. When you are finished, click Search. The ViewPoint Reporting Module displays the report for the selected date range.
Viewing Intrusion Reports By Category Over TimeYou can generate reports that display the intrusion activity by category, such as the category, priority, and events/attacks over time. Using the category over time statistic as criteria for report generation provides details about the type/message text and number of events. To view intrusion attempts using categories over time intervals as the viewing criteria, perform the following steps:
1. Click the Firewall tab.
2. Select a SonicWALL appliance.
240 SonicWALL ViewPoint 5.0 Administrator’s Guide

Viewing Intrusion Prevention Reports
3. Expand the Intrusion Prevention tree and click By Category Over Time. The By Category Over Time page displays.
Figure 145 Firewall > Intrusion Prevention > By Category Over Time
4. The pie chart displays a list of intrusions attempted by category over time. The table contains the following information:
– Category—the category of the intrusion attempt.
– Intrusions—the number of attempted intrusions during a pre-set time interval.
– % of Intrusions—the percentage of intrusion attempts the current intrusion entry comprises as a portion of the aggregate number of intrusion attempts on the device during a pre-set time interval.
5. The ViewPoint Reporting Module shows yesterday’s report. To change the date range of the report, use the Search Bar and click the Start or End field to access the drop-down calendar, or click More Options for report display settings.
241SonicWALL ViewPoint 5.0 Administrator’s Guide

Viewing Authentication Reports
6. Under Report Display Settings you can set:
– Display Type: Chart and Table, or Table Only
– Chart Type: Area, Bar, Pie or Plot chart
– Number of Items
– Entries per Item
– Rows per Screen
See “Managing Report Settings” on page 116.
7. When you are finished, click Search. The ViewPoint Reporting Module displays the report for the selected date range.
Viewing Authentication ReportsThe login reports show user logins, administrator logins, and failed login attempts for users and administrators. Authentication reports are available at the unit level.
Note All reports appear in the Firewall’s time zone.
Select from the following:
• “Viewing the User Login Report” on page 242
• “Viewing the Administrator Login Report” on page 243
• “Viewing the Failed Login Report” on page 244
Viewing the User Login Report The user login report shows users that logged on to the SonicWALL appliance during the specified day to bypass content filtering or to remotely access local network resources.
To view the User Login report, perform the following steps:
1. Click the Firewall tab.
2. Select a SonicWALL appliance.
242 SonicWALL ViewPoint 5.0 Administrator’s Guide

Viewing Authentication Reports
3. Expand the Authentication tree and click User Login. The User Login page displays.
Figure 146 Firewall > Authentication > User Login
4. The table contains the following information:
– User—the user name.
– Time—time the user logged in.
5. The ViewPoint Reporting Module shows yesterday’s report. To change the date of the report, use the Search Bar and click the Start or End field to access the drop-down calendar.
See “Managing Report Settings” on page 116.
6. When you are finished, click Search. The ViewPoint Reporting Module displays the report for the selected date.
Viewing the Administrator Login Report The administrator login report shows successful administrator logins during the specified day. This report is useful for identifying misuse and unauthorized management of a SonicWALL appliance.
To view the Admin Login report, perform the following steps:
1. Click the Firewall tab.
2. Select a SonicWALL appliance.
243SonicWALL ViewPoint 5.0 Administrator’s Guide

Viewing Authentication Reports
3. Expand the Authentication tree and click Admin Login. The Admin Login page displays.
Figure 147 Firewall > Authentication > Admin Login Page
4. The table contains the following information:
– User—the user name.
– Time—time the user logged in.
5. To change the date range of the report, use the Search Bar and click the Start or End field to access the drop-down calendar.
See “Managing Report Settings” on page 116.
6. When you are finished, click Search. The ViewPoint Reporting Module displays the report for the selected date range.
Viewing the Failed Login Report The failed login report shows failed login attempts for users and administrators that attempted to log on to the SonicWALL appliance during the specified day. This report is useful for identifying unauthorized access attempts and potentially malicious activity.
To view the Failed Login report, perform the following steps:
1. Click the Firewall tab.
2. Select a SonicWALL appliance.
3. Expand the Authentication tree and click Failed Login. The page displays.
Figure 148 Firewall > Authentication > Failed Login
244 SonicWALL ViewPoint 5.0 Administrator’s Guide

Viewing the Log
4. The table contains the following information:
– User—the user name.
– Time—time the user logged in.
– IP Address—IP address of the user.
5. The ViewPoint Reporting Module shows yesterday’s report. To change the date of the report, use the Search Bar and click the Start or End field to access the drop-down calendar.
See “Managing Report Settings” on page 116.
6. When you are finished, click Search. The ViewPoint Reporting Module displays the report for the selected date.
Viewing the LogThe Log Viewer contains detailed information on each transaction that occurred on the SonicWALL appliance. This information is stored for the time that you specified in the configuration settings.
Note The Log Viewer displays raw log information for every connection. Depending on the amount of traffic, this can quickly consume a large amount of space in the database. It is highly recommended to be careful when choosing the number of days of information that will be stored. For more information, see “Scheduling and Configuring Reports” on page 95.
Viewing the Log for a SonicWALL Appliance To view the Log, perform the following steps:
1. Click the Firewall tab.
2. Select a SonicWALL appliance.
245SonicWALL ViewPoint 5.0 Administrator’s Guide

Viewing the Log
3. Expand the Log Viewer tree and click Search. The Search page displays.
Figure 149 Firewall > Log Viewer > Search
4. Select Enable Log Viewer and then click Update to turn on collection of raw data in the database and enable viewing of that log data. This can consume a large amount of space in your database. Review your database space constraints before enabling the log viewer. The maximum number of appliances for which Log Viewer can be enabled is controlled on the Console > Reports > Settings page. See “Controlling the Number of Appliances with Log Viewer Enabled” on page 47.
Note Custom Reports are available on appliances with Log Viewer enabled. See “Configuring and Using Custom Reports” on page 123.
5. Under Select Search Criteria, select the date range to view data from in the Start Date and End Date fields.
6. Enter the starting time of events to view in the Start Time field.
7. Enter the ending time of events to view in the End Time field.
8. To limit the report to data originating from specific IP addresses or users, enter the source IP address or user name in the Source IP/User field. To view all IP addresses, enter All.
9. To view log entries for data originating from a particular port, enter the port number in the Source Port field.
10. To limit the report to data going to specific IP addresses or hosts, enter the destination IP address or host name in the Destination IP/Hostname field. To view log entries for data going to all IP addresses, enter All.
11. To view log entries for data going to a particular port, enter the port number in the Destination Port field.
12. Select the type of events to view from the Message Category list box.
246 SonicWALL ViewPoint 5.0 Administrator’s Guide

Viewing the Log
13. To limit the report to messages containing a specific text string, enter the text in the Message Text field. Leave the field blank to view all messages.
14. Select the number of entries to display per page from the Results Per Page field.
15. Click Generate Report. The Log Viewer Results page displays.
Figure 150 Firewall > Log Viewer Results
16. Search through the entries to find the information for which you are searching. To view the next page of entries, click Next.
17. To generate another report, click Search again in the Log Viewer tree.
247SonicWALL ViewPoint 5.0 Administrator’s Guide

Viewing the Log
248 SonicWALL ViewPoint 5.0 Administrator’s Guide

CHAPTER 14SSL VPN Reporting
This chapter describes how to manage SonicWALL ViewPoint SSL VPN reporting by customizing and defining scheduled reports and summarization for SSL VPN appliances.
For details about viewing specific SSL VPN reports, see “Viewing SSL VPN Reports” on page 255.
This chapter contains the following sections:
• “SSL VPN Reporting Overview” section on page 249
• “Using and Configuring SSL VPN Reporting” section on page 250
SSL VPN Reporting OverviewThis section provides an introduction to the SSL VPN reporting feature. This section contains the following subsections:
• “What is SSL VPN Reporting?” section on page 250
• “Benefits of SSL VPN Reporting” section on page 250
• “How Does SSL VPN Reporting Work?” section on page 250
After reading the ViewPoint SSL VPN Reporting Overview section, you will understand the main steps to be taken in order to create and customize reports successfully.
249SonicWALL ViewPoint 5.0 Administrator’s Guide

Using and Configuring SSL VPN Reporting
What is SSL VPN Reporting?SSL VPN reporting allows you to configure and design the way you view your reports and the manner in which you receive them. This feature offers various types of static and dynamic reporting in which you can customize the way information is reported.
SonicWALL ViewPoint SSL VPN reporting provides a visual presentation of all your configured report settings and information. With SSL VPN reporting, you are able to view your reports in new enhanced graphs, create scheduled reports, and search for reports using the search bar tool.
Benefits of SSL VPN ReportingThe following enhancements have been incorporated into the SSL VPN reporting feature:
• Interactive charts
• New table structure with ability to adjust column width of data grid
• Improved report navigation
• Report search
• Scheduled reports
How Does SSL VPN Reporting Work?SSL VPN appliances send syslog data to the ViewPoint syslog collector, similar to SonicWALL firewall appliances. Once summarization takes place, you can create, schedule, view, and search for SSL VPN reports from the ViewPoint central reporting interface.
SSL VPN Reporting supports scheduled reports to be sent on a daily, weekly, or monthly basis to any specified email address.
Using and Configuring SSL VPN ReportingThis section describes how to use and configure SSL VPN reporting. See the following subsections:
• “About Viewing Available SSL VPN Report Types” section on page 251
• “Configuring SSL VPN Scheduled Reports” section on page 251
250 SonicWALL ViewPoint 5.0 Administrator’s Guide

Using and Configuring SSL VPN Reporting
About Viewing Available SSL VPN Report TypesTo view the available types of reports for SSL VPN, perform the following steps:
1. Log into your ViewPoint management console.
2. Click the SSL-VPNs tab.
The SSL VPN screen displays the following list of reports:
Node Level reports:
– Bandwidth
–Summary: total connections listed by hour
–Top Users: connections listed by user
–Over Time: connections listed by date
–Top Users Over Time: connections listed by user for the selected date range
– Resources
–Summary: connections per connection protocol (HTTPS, NetExtender, etc)
– Authentication
–User Login: user, time, and source of successful authentication-daily. User Login reports now combine admin users with all other users in the same report.
–Failed login: time and source host of failed logins for one day
Global Level Reports:
– Bandwidth
–Summary: connections per SSL VPN appliance
–Over Time: total connections by date
Configuring SSL VPN Scheduled Reports To configure SSL VPN scheduled reports and summarization, perform the following tasks:
1. On the SSL-VPN tab, navigate to Configuration > Scheduled Reports.
2. Click the Add button.
251SonicWALL ViewPoint 5.0 Administrator’s Guide

Using and Configuring SSL VPN Reporting
3. The Scheduled Report Configuration form displays. Fill out the fields accordingly. For more information, see the following sections:
– “Configuring Scheduled Reports” on page 95
– “Exporting Reports to PDF” on page 106.
Figure 151 SSL VPN Scheduled Report Configuration Page
Configuring SSL VPN Summarization1. On the SSL-VPN tab, navigate to Configuration > Summarizer Settings. The
reports that can be summarized for a SSL VPN appliance are configurable at either global or unit level. The screen displays the configuration appropriate for the level. The report type lists can also be expanded for a detailed description of report content.
252 SonicWALL ViewPoint 5.0 Administrator’s Guide

Using and Configuring SSL VPN Reporting
The report types you can summarize are shown below.
Figure 152 SSL VPN Report Types Available for Summarization
SSL VPN reports generated in ViewPoint can be exported in PDF format, providing easy online transfer. For more information about the Summarizer and exporting reports in PDF format, see:
– “Selecting Reports for Summarization” on page 99
– “Using Summarize Now” on page 101
– “Exporting Reports to PDF” on page 106
253SonicWALL ViewPoint 5.0 Administrator’s Guide

Using and Configuring SSL VPN Reporting
254 SonicWALL ViewPoint 5.0 Administrator’s Guide

CHAPTER 15Viewing SSL VPN Reports
This chapter describes the available reports for SonicWALL SSL VPN appliances.
For information on how to configure scheduled reports and summarization, see:
• “Using and Configuring SSL VPN Reporting” on page 250
Select from the following reports:
• “Viewing SSL VPN Bandwidth Reports” section on page 256
• “Viewing SSL VPN Resource Reports” section on page 262
• “Viewing SSL VPN Authentication Reports” section on page 264
• “Viewing the SSL VPN Log” section on page 266
255SonicWALL ViewPoint 5.0 Administrator’s Guide
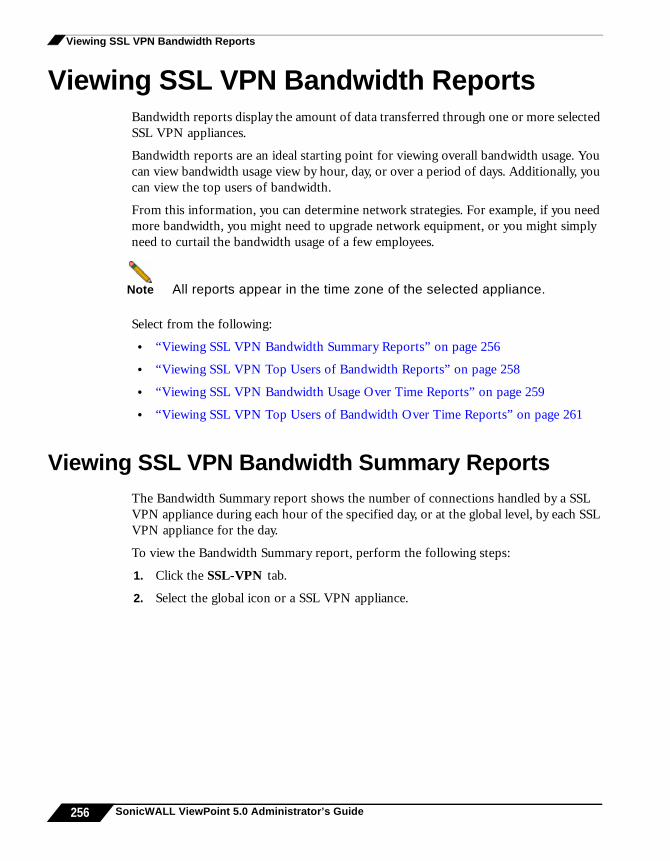
Viewing SSL VPN Bandwidth Reports
Viewing SSL VPN Bandwidth ReportsBandwidth reports display the amount of data transferred through one or more selected SSL VPN appliances.
Bandwidth reports are an ideal starting point for viewing overall bandwidth usage. You can view bandwidth usage view by hour, day, or over a period of days. Additionally, you can view the top users of bandwidth.
From this information, you can determine network strategies. For example, if you need more bandwidth, you might need to upgrade network equipment, or you might simply need to curtail the bandwidth usage of a few employees.
Note All reports appear in the time zone of the selected appliance.
Select from the following:
• “Viewing SSL VPN Bandwidth Summary Reports” on page 256
• “Viewing SSL VPN Top Users of Bandwidth Reports” on page 258
• “Viewing SSL VPN Bandwidth Usage Over Time Reports” on page 259
• “Viewing SSL VPN Top Users of Bandwidth Over Time Reports” on page 261
Viewing SSL VPN Bandwidth Summary ReportsThe Bandwidth Summary report shows the number of connections handled by a SSL VPN appliance during each hour of the specified day, or at the global level, by each SSL VPN appliance for the day.
To view the Bandwidth Summary report, perform the following steps:
1. Click the SSL-VPN tab.
2. Select the global icon or a SSL VPN appliance.
256 SonicWALL ViewPoint 5.0 Administrator’s Guide

Viewing SSL VPN Bandwidth Reports
3. Expand the Bandwidth tree and click Summary. The Summary page displays.
Figure 153 SSL VPN Unit View: SSL-VPN > Bandwidth > Summary
4. The graph displays the number of connections to the SSL VPN appliance during each hour of the day.
5. The table contains the following information:
– Hour—when the sample was taken.
– Connections—number of connections to the SSL VPN appliance
6. The ViewPoint Reporting Module shows yesterday’s report. To change the date of the report, click the Start field to access the drop-down calendar.
7. After selecting a date, click Search. The ViewPoint Reporting Module displays the report for the selected day.
Note The date setting will stay in effect for all similar reports during your active login session.
257SonicWALL ViewPoint 5.0 Administrator’s Guide

Viewing SSL VPN Bandwidth Reports
Viewing SSL VPN Top Users of Bandwidth ReportsThe Top Users report displays the users who used the most connections on the specified date.
To view the Top Users report, perform the following steps:
1. Click the SSL-VPN tab.
2. Select a SSL VPN appliance.
3. Expand the Bandwidth tree and click Top Users. The Top Users page displays.
Figure 154 SSL VPN Unit View: SSL-VPN > Bandwidth > Top Users
4. The pie chart displays the percentage of connections used by each user.
258 SonicWALL ViewPoint 5.0 Administrator’s Guide

Viewing SSL VPN Bandwidth Reports
5. The table contains the following information for all users:
– Users—the user name
– Connections—number of connection events or “hits”
6. By default, the ViewPoint Reporting Module shows yesterday’s report, a pie chart for the top six users, and a table for all users. To change the date of the report, click the Start field to access the drop-down calendar.
7. To display a limited number of users, use the Search Bar fields.
Note The search bar fields use pattern matching with operators such as “contains”. For example, “john” will match john_smith, john42, or big_john.
8. When you are finished, click Search. The ViewPoint Reporting Module displays the report for the selected day.
Note The date setting will stay in effect for all similar reports during your active login session.
Viewing SSL VPN Bandwidth Usage Over Time Reports
The Bandwidth Usage Over Time report displays the daily number of connections handled by a SSL VPN appliance or a group of SSL VPN appliances for the specified time period.
To view the Bandwidth Usage Over Time report, perform the following steps:
1. Click the SSL-VPN tab.
2. Select the global icon or a SSL VPN appliance.
259SonicWALL ViewPoint 5.0 Administrator’s Guide

Viewing SSL VPN Bandwidth Reports
3. Expand the Bandwidth tree and click Over Time. The Over Time page displays.
Figure 155 SSL VPN Unit View: SSL-VPN > Bandwidth > Over Time
4. The graph displays the number of connections during each day of the specified time period.
5. The table contains the following information:
– Date—when the sample was taken
– Connections—number of hits
6. To change the date of the report, use the Search Bar and click the Start or End fields to access the drop-down calendar.
7. When you are finished, click Search. The ViewPoint Reporting Module displays the report for the selected date range.
Note These date settings will stay in effect for all similar reports during your active login session.
260 SonicWALL ViewPoint 5.0 Administrator’s Guide

Viewing SSL VPN Bandwidth Reports
Viewing SSL VPN Top Users of Bandwidth Over Time Reports
The Top Users Over Time report displays the users who used the most connections during the specified date range. This report is available at the unit level.
To view the Top Users Over Time report, perform the following steps:
1. Click the SSL-VPN tab.
2. Select a SSL VPN appliance.
3. Expand the Bandwidth tree and click Top Users Over Time. The Top Users Over Time page displays.
Figure 156 SSL VPN Unit View: SSL-VPN > Bandwidth > Top Users Over Time
4. The pie chart displays the percentage of connections used by the top users.
261SonicWALL ViewPoint 5.0 Administrator’s Guide

Viewing SSL VPN Resource Reports
5. The table contains the following information for all users:
– Users—the user name of the user
– Connections—number of connection events or “hits”
6. The ViewPoint Reporting Module shows yesterday’s report. To change the date range of the report, click the Start or End field to access the drop-down calendar.
7. To display a limited group of users, enter the user IDs in the Search Bar fields.
Note The search bar fields use pattern matching with operators such as “contains”. For example, “john” will match john_smith, john42, or big_john.
8. When you are finished, click Search. The ViewPoint Reporting Module displays the report for the selected users and date range.
Note These settings will stay in effect for all similar reports during your active login session.
Viewing SSL VPN Resource ReportsResource reports provide information on the amount of data transmitted through the selected SSL VPN appliance by each service or protocol.
Resource reports are useful for revealing inappropriate usage of bandwidth and can help determine network policies. For example, if there is a large spike of bandwidth usage, you can determine whether this is caused by regular Web access, someone using FTP to transfer large files, an attempted Denial of Service (DoS) attack, or another service.
Note All reports appear in the appliance’s time zone.
The procedure for viewing the Resource Summary Report is described in the following section:
• “Viewing SSL VPN Resource Summary Reports” on page 263
Note You cannot view resource reports from the global view.
262 SonicWALL ViewPoint 5.0 Administrator’s Guide

Viewing SSL VPN Resource Reports
Viewing SSL VPN Resource Summary ReportsThe Resource Summary report displays the number of connections handled by each service or protocol during the specified day.
To view the Resource Summary report, perform the following steps:
1. Click the SSL-VPN tab.
2. Select a SSL VPN appliance.
3. Expand the Resources tree and click Summary. The Resource Summary page displays.
Figure 157 SSL VPN: SSL-VPN > Resources > Summary
4. The graph displays the number of connections used by each service or protocol during the day.
5. The table contains the following information:
263SonicWALL ViewPoint 5.0 Administrator’s Guide

Viewing SSL VPN Authentication Reports
– Resource name—the service or protocol
– Connections—number of connection events or “hits”
6. To change the date of the report, use the Search Bar and click the Start field to access the drop-down calendar.
7. When you are finished, click Search. The ViewPoint Reporting Module displays the report for the selected date.
Note This date setting will stay in effect for all similar reports during your active login session.
Viewing SSL VPN Authentication ReportsThe Authentication reports show user logins and failed login attempts. Authentication reports are available at the unit level.
Note All reports appear in the appliance’s time zone.
Select from the following:
• “Viewing SSL VPN User Login Reports” on page 264
• “Viewing SSL VPN Failed Login Reports” on page 265
Viewing SSL VPN User Login ReportsThe user login report shows the user name, source host IP address, and time of login for users that logged on to the SSL VPN appliance during the specified day.
To view the User Login report, perform the following steps:
1. Click the SSL-VPN tab.
2. Select a SSL VPN appliance.
264 SonicWALL ViewPoint 5.0 Administrator’s Guide

Viewing SSL VPN Authentication Reports
3. Expand the Authentication tree and click User Login. The User Login page displays.
Figure 158 SSL VPN: SSL-VPN > Authentication > User Login
4. The table contains the following information:
– Type—equal to User Login
– User Name—the user name
– Source Host—the IP address of the user’s computer
– Time—the time that the user logged in
– Duration—the duration of the user login session
5. The ViewPoint Reporting Module shows yesterday’s report. To change the date of the report, use the Search Bar and click the Start field to access the drop-down calendar.
6. When you are finished, click Search. The ViewPoint Reporting Module displays the report for the selected date.
Viewing SSL VPN Failed Login ReportsThe failed login report shows failed login attempts for users who attempted to log into the SSL VPN appliance during the specified day. This report is useful for identifying unauthorized access attempts and potentially malicious activity.
To view the Failed Login report, perform the following steps:
1. Click the SSL-VPN tab.
2. Select a SSL VPN appliance.
265SonicWALL ViewPoint 5.0 Administrator’s Guide

Viewing the SSL VPN Log
3. Expand the Authentication tree and click Failed Login. The Failed Logins page displays.
Figure 159 SSL VPN: SSL-VPN > Authentication > Failed Logins
4. The table contains the following information:
– Type—equal to Failed Login
– User Name—the user name
– Source Host—the IP address of the user’s computer
– Time—the time that the user attempted to log in
– Duration—not applicable
5. The ViewPoint Reporting Module shows yesterday’s report. To change the date of the report, use the Search Bar and click the Start field to access the drop-down calendar.
6. When you are finished, click Search. The ViewPoint Reporting Module displays the report for the selected date.
Viewing the SSL VPN Log The Log Viewer contains detailed information on each transaction that occurred on the SSL VPN appliance. This information is stored for the time that you specified in the configuration settings.
266 SonicWALL ViewPoint 5.0 Administrator’s Guide

Viewing the SSL VPN Log
Note The Log Viewer displays raw log information for every connection. Depending on the amount of traffic, this can quickly consume a large amount of space in the database. It is highly recommended to be careful when choosing the number of days of information that will be stored. For more information, see “Scheduling and Configuring Reports” on page 95.
Viewing the Log for a SSL VPN Appliance To view the Log, perform the following steps:
1. Click the SSL-VPN tab.
2. Select a SSL VPN appliance.
3. Expand the Log Viewer tree and click Search. The Search page displays.
Figure 160 SSL-VPN > Log Viewer > Search
4. Select Enable Log Viewer and then click Update to turn on collection of raw data in the database and enable viewing of that log data. This can consume a large amount of space in your database. Review your database space constraints before enabling the log viewer.
5. Under Select Search Criteria, select the date range to view data from in the Start Date and End Date fields.
6. Enter the starting time of events to view in the Start Time field.
267SonicWALL ViewPoint 5.0 Administrator’s Guide

Viewing the SSL VPN Log
7. Enter the ending time of events to view in the End Time field.
8. To limit the report to data originating from specific IP addresses, enter the source IP address in the Source IP field. To view all IP addresses, enter All.
9. To view log entries for data originating from a particular user, enter the user name in the User field.
10. To limit the report to data going to specific IP addresses or hosts, enter the destination IP address or host name in the Destination IP/Hostname field. To view data for all IP addresses, enter All.
11. Select the type of events to view from the Message Category list box. You can select from the following:
– All Categories
– Connections
– Rejected Connections
– User Events
– Unrecognized Events
12. To limit the report to messages containing a specific text string, enter the text in the Message Text field. Leave the field blank to view all messages.
13. Select the number of entries to display per page from the Results Per Page field.
14. Click Generate Report. The Log Search Results page displays.
Figure 161 SSL-VPN > Log Viewer Results
15. To view the next page of entries, click Next.
16. To generate another report, click Search again in the Log Viewer tree.
268 SonicWALL ViewPoint 5.0 Administrator’s Guide

Appendix A
Technical Tips
This chapter includes the following sections:
• “Log Viewer” section on page 269
• “Real-time Syslog Viewer” section on page 271
• “Forwarding Syslog Data to Another Syslog Server” section on page 272
• “Posting ViewPoint Reporting to Another Web Server for End-User Access” section on page 273
Log Viewer The Log Viewer contains detailed information on each transaction that occurred on the SonicWALL appliance. This information is stored for the time that you specified in the configuration settings.
Note The Log Viewer displays raw log information for every connection. Depending on the amount of traffic, this can quickly consume a large amount of space in the database. It is highly recommended to be careful when choosing the number of days of information that will be stored. For information about setting the number of days data is stored, see “Configuring Syslog Data Storage Configuration and Sort Settings” on page 46.
To configure Log Viewer settings for generating a report, perform the following steps:
1. Start and log into SonicWALL ViewPoint.
269SonicWALL ViewPoint 5.0 Administrator’s Guide

Log Viewer
2. Click the Firewall or SSL-VPN tab.
3. Select a SonicWALL appliance.
4. Expand the Log Viewer tree and click Search. The Search page displays. Log Viewer must be enabled for the appliance in order to display all the fields on the page.
Figure 162 Log Viewer > Search
5. Select Enable Log Viewer and then click Update to turn on collection of raw data in the database and enable viewing of that log data. This can consume a large amount of space in your database. Review your database space constraints before enabling the log viewer. The maximum number of appliances for which Log Viewer can be enabled is controlled on the Console > Reports > Settings page. See “Controlling the Number of Appliances with Log Viewer Enabled” on page 47.
Note Custom Reports are available on appliances with Log Viewer enabled. See “Configuring and Using Custom Reports” on page 123.
6. Select the date to view from the Date list box.
7. Enter the starting time of events to view in the Start Time field.
8. Select the ending date of events to view in the End Date list box
9. Enter the ending time of events to view in the End Time field.
10. Select the type of events to view from the Message Category list box.
11. Enter the source IP address to view in the Source IP Address field. To view all IP addresses, enter All.
270 SonicWALL ViewPoint 5.0 Administrator’s Guide

Real-time Syslog Viewer
12. Enter the destination IP address to view in the Destination IP Address field. To view all IP addresses, enter All.
13. Select the number of entries to display per page from the Results Per Page field.
14. Click Generate Report. The Log Viewer Results page displays.
Figure 163 Log Viewer Results
Real-time Syslog ViewerThe real-time syslog utility enables you to diagnose the system by viewing the syslog messages in real time.
Note Only use this utility when needed for diagnostic purposes.
To open the real-time syslog utility, perform the following steps:
1. Start and log into SonicWALL ViewPoint.
2. Click the Firewall or SSL-VPN tab.
3. Expand Real-Time Viewer and click Syslog. The Real-Time Syslog page appears.
271SonicWALL ViewPoint 5.0 Administrator’s Guide

Forwarding Syslog Data to Another Syslog Server
4. If syslog forwarding is not enabled, select Enable Syslog Forwarding, set the IP address and port used by the syslog reader, and then click Update.
5. If the Syslog Reader is not already running, click Start Syslog Reader.
6. Click Start Button at the bottom of the screen. The Syslog Viewer begins showing the latest syslog entries.
Figure 164 Syslog Viewer Entries
7. To change how many messages are displayed, select a number from the Number of Messages list box at the bottom of the screen.
Figure 165 Number of Messages List Box
8. To change how often the Syslog Viewer is refreshed, select the time from the Refresh Time list box at the bottom of the screen.
9. To stop the viewer, click the Stop button.
10. To search for text, use the browser’s Find utility.
11. When you are finished, close the Syslog Viewer.
Forwarding Syslog Data to Another Syslog Server
To forward SonicWALL ViewPoint syslog data to another syslog server, perform the following steps:
1. Open the sgmsConfig.xml file with a text editor.
272 SonicWALL ViewPoint 5.0 Administrator’s Guide

Posting ViewPoint Reporting to Another Web Server for End-User Access
2. Locate the following line:
Parameter name =“syslog.forwardToHost” value=“”
3. Add the IP address or hostname of the destination syslog server to the value attribute.
4. Save the sgmsConfig.xml file and exit.
5. Ensure that at least firmware 6.3.1.0 is running on the SonicWALL appliances.
Note To configure SonicWALL ViewPoint to not store the syslog data after it has been forwarded, you must disable the ViewPoint Reporting Module. To do this, open the ViewPoint Settings page in the Console Panel, deselect the Enable Reporting check box, and click Update.
Posting ViewPoint Reporting to Another Web Server for End-User Access
To allow end user access to another web server for end-user access, install the SonicWALL ViewPoint Console in redundant mode.
You can then allow end user access to the redundant Console for viewing ViewPoint Reporting real-time and historical reports. End user access will be isolated from the main Console that is used for managing and configuring SonicWALL appliances.
273SonicWALL ViewPoint 5.0 Administrator’s Guide

Posting ViewPoint Reporting to Another Web Server for End-User Access
274 SonicWALL ViewPoint 5.0 Administrator’s Guide

©2008 SonicWALL, Inc. is a registered trademark of SonicWALL, Inc. Other product names mention ed herein may be trademarks and/or registered trademarks of their respective companies.Spec cation s and description s subject to change without notice. G035.4_GMS.GSG.v 1
SonicWALL, Inc.
1143 Borregas Avenue T +1 408.745.9600
Sunnyvale CA 94089-1306 F +1 408.745.9300 www.sonicwall.com
PN: 232-001558-00 10/08