Some Personality Characteristics of Air Traffic Control...
16
AD-A238 072 DoTF ".-91/3 Some Personality Characteristics of Air Traffic Control Specialist Trainees: nteractions of Personality and Aptitude Test Office of Aviation Medicine Scores with FAA Academy Washington, D.C. 20591 Success and Career Expectations Lendell G. Nye William E. Collins Civil Aeromedical Institute Federal Aviation Administration Oklahoma City, Oklahoma 73125 May 1991 Final Report This document is available to the public through the National Technical Information Service, Springfield, Virginia 22161. DTIC fELECTE ' U.S. Department JUL l 119U / ;t 91-04680 of Transportation Administration Dbhlmlm unn.w - 91 7 10 151
Transcript of Some Personality Characteristics of Air Traffic Control...

AD-A238 072
DoTF ".-91/3 Some Personality Characteristicsof Air Traffic Control SpecialistTrainees: nteractions ofPersonality and Aptitude Test
Office of Aviation Medicine Scores with FAA AcademyWashington, D.C. 20591 Success and Career Expectations
Lendell G. NyeWilliam E. Collins
Civil Aeromedical InstituteFederal Aviation AdministrationOklahoma City, Oklahoma 73125
May 1991
Final Report
This document is available to the public throughthe National Technical Information Service,Springfield, Virginia 22161.
DTICfELECTE 'U.S. Department JUL l 119U
/ ;t 91-04680 of TransportationAdministration
Dbhlmlm unn.w - 91 7 10 151

NOTICE
This document is disseminated under the sponsorship ofthe U.S. Department of Transportation in the interest of
information exchange. The United States Governmentassumes no liability for the contents or use thereof.

Technical Report Documentation Page
1. Report No. 2. Government Accession No. 3. Recipient's Catalog No.
DOT/rAA/A-91/8
4. Title and Subtitle 5. Report DateSome Personalty Characteristics of Air Traffic Control May 1991Specialist (ATCS) Trainees: Interactions of Personalit3 6. Performg Organization Code
and Aptitude Test Scores with FAA Academy Success and
Career Expectations 8. Performing Organization Report No.
7. Authorls)
Lendell G. Nye, B.A. and William E. Collins, Ph.D.9. Performing Organization Name and Address 10. Work Unit No. (TRAIS)
FAA Civil Aeromedical InstituteP.O. Box 25082 11. Contract or Grant No.Okahoma City, OK 73125
13. Type of Report and Period Covered
12. Sponsoring Agency Name and Address
Office of Aviation MedicineFederal Aviation Administration800 Independence Avenue, S.W. 14. Sponsoring Agency Code
Washington, D.C. 2059115. Supplementary Notes
This work was performed under task AM-C-91-HRR-123
16. Abstract
The State-Trait Personality Inventory (STPI) is a self-report inventory whichmeasures anxiety, curiosity, and anger (Spielberger, 1979). The three 'trait' scalescores are determined by the frequency of each emotion as stable personalityconstructs. The Multiplex Controller Aptitude Test (MCAT) is the primary selectiontest completed by ATCS applicants. The STPI was given to 1,284 students who enteredthe FAA Academy nonradar screen program between October 1986 and September 1987.
Men and women ATCS trainees exhibited less anxiety and anger than normative groups ofcollege students and Navy recruits. Also, in most comparisons, the ATCS sampleindicated greater curiosity. ATCS pass rates were reduced within each MCAT scorelevel for the groups of entrants with anxiety or anger scores above the normativelevels. Personality trait profiles differed significantly for groups when they werecategorized by both self-expected job performance levels and job satisfaction, butnot aptitude score levels. Analyses indicated significant relationships betweenanxiety and lower job performance self-expectations and between curiosity and higherself-expected job satisfaction. FAA Academy entrants have a group profile indicatingrelatively low levels of trait anxiety and anger. Personality factors can impact a)the predictive validity of the MCAT in determining a student's aptitude for learningair traffic control principles/procedures and b) potentially, organizational goalssuch as increasing employee job satisfaction.
17. Key Words 18. Distribution Statement
Training Document is available to the publicPersonality through the National Technical InformationAnxiety Service, Springfield, Virginia 22161
19. Security Clossf. (of this report) 20. Security Classif. (of this page) 21. No. of Pages 22. Price
Unclassified Unclassified 16
Form DOT F 1700.7 (8-72) Reproduction of completed page authorized

SOME PERSONALITY CHARACTERISTICS OF AIR TRAFFIC CONTROLSPECIALIST (ATCS) TRAINEES: INTERACTIONS OF PERSONALITY
AND APTITUDE TEST SCORES WITH FAA ACADEMY SUCCESSAND CAREER EXPECTATIONS
INTRODUCTION
For this study, the STPI- State-Trait Personality futurejob satisfaction as ATCSs. The FAA has beenInventory (Spielberger, 1979) was the personality monitoring facets of employee job satisfaction us-measure used to examine three issues. The STPI is ing the Job Satisfaction Survey (Myers, Schroeder,a self-report instrument comprised of scales, which VanDeventer, & Collins, 1988) since 1984 and hasmeasure the personality dimensions of anxiety, cu- been using those survey findings to meet its per-riosity, and anger. The scores for the three "trait" ceived responsibilities to implement organizationalsubscales for the emotions of anxiety, curiosity, and changes leading to increased employee job satisfac-anger are determined by the self-reported frequency tion. Job satisfaction has been defined (Locke, 1976)of each emotion and are considered to be indicators as "a pleasurable or positive emotional state result-of stable personality constructs. By contrast, the ing from the appraisal of one's job or job experi-"state" subscales ask the respondent to indicate how ence." Although management has an important rolehe/she feels at the present time. Generally, anxiety to play in meeting employee needs, there are someis defined by subjective feelings such as nervous- indications that job satisfaction attitudes may beness, tension, insecurity, and lack of self-confi- more consistent over time than would be expected,dence. Anger is described by terms such as irrita- given changes in the work environment (Staw &tion, rage, and lack of self-control. The personality Ross, 1985). Also, to some degree, employees"bringdimension of curiosity is related to descriptors such a positive or negative disposition to the work set-as inquisitive, eager, stimulated, and mentally ac- ting, process information about the job in a way thattive. is consistent with that disposition, and then experi-
ence job satisfaction or dissatisfaction as a result"The first question examined whether there were (Staw, Bell, & Clausen, 1986). Similarly, it has beenpersonality differences between men and women on argued (Schmitt & Pulakos, 19g5)thatsomeperson-the STPI dimensions and also compared the STPI ality characteristics create a predisposition for fa-results of our sample of FAA Academy entrants vorably evaluating aspects of the work environ-with normative group data. Gender differences on ment. For this study, it was hypothesized that anthe Sixteen Personality FactorQuestionnaire (I6PF, increased curiosity level would be related to a moreCattell, 1970) were examined (Karson & O'Dell, positive predisposition or anticipation of job satis-1974) and the conclusion made that the factor struc- faction. Conversely, higher scores on both anxietytures of the 16PF scales for men and women Air and anger subscales, as measured by the STPI,Traffic Control Specialist (ATCS) applicants were would correspond to a significant degree with lowervery similar. Examining their descriptive statistics, self-expectations of job satisfaction.only on the '' scale (tender-mindedness) was thegender group effect size (d statistic) found to reach The third purpose of this study was to examine andCohen's (1969) classification for a "large" differ- clarify the interrelationships among aptitude testence between gender groups. In a previous study results, STPI personality traits (anxiety, curiosity,(Collins, Schroeder, & Nye, 1989), both trait anxi- and anger), job performance self-expectations, andety and state anxiety scores of FAA Academy en- FAA Academy nonradar screen performance.trants were lower than normative groups of college Newly-hired Air Traffic Control Specialists arestudents and Navy personnel in flight training. Gen- required to successfully complete a nonradar screen-der differences in trait anxiety were found in the ing program (pass/fail) at the FAA Academy innormative group of college students and also in a Oklahoma City prior to being assigned to an airstudy of community volunteers (Stoner & Spencer, traffic control facility, where they then are required1986); with women indicating higher levels of trait to continue in phases of classroom, simulation, andanxiety in both studies. on-the-job training. The "screen" measures aptitude
for the ATCS occupation based on performance onThe second purpose of this study was to determine paper-and-pencil tests and ability to apply airtrafficthe nature of the relationships between expressed control procedures in laboratory simulation prob-personality characteristics and attitudes regarding lems.
I

The Multiplex Controller Aptitude Test (MCAT) actual training performance, which could be ex-has been used by the Federal.Aviation Administra- plained as the function of a) aptitude, as reflected bytion since 1981 as the primary selection test of a selection test (MCAT) scores, and b) the trait anxi-battery of tests administered to applicants for the ety construct, a component of which directly in-ATCS occupation. The MCAT is a timed paper- volves the lack of self-esteem and self-confidence.and-pencil test in which the individual first exam-ines tabular data about aircraft altitude, speed, and METHODScourse, along with a map illustrating several aircraftat different locations on various flight paths. Appli- The State-Trait Personality Inventory (STPI) wascants are required to correctly compute aircraft given to the students who entered the FAA Acad-time-and-distance travel patterns and identify po- emy nonradar screen program between Octobertential conflicts among flight paths. The predictive 1986 and September 1987. Also, a biographicalvalidity of the MCAT has been documented in questionnaire (BQ) was completed at the same test-various studies (Della Rocco & Manning, 1990; ing session during the first week of attendance at theSchroeder, Dollar, & Nye, 1990; Manning, Kegg, & FAA Academy. A total of 1,482 subjects completedCollins, 1988; VanDeventer, Collins, Manning, both the BQ and STPI. Of that total, 1,284 finishedTaylor & Baxter, 1984; and Sells, Dailey, & Pickrel, the FAA Academy screen and received a final grade.1984). Entrants who withdrew prior to completion of the
screen were not given a final grade. Those who hldAnxiety, measured as a personality trait using the previously attended the FAA Academy and hadState-Trait Personality Inventory, was found to be failed orwithdrew ("recycled") were excluded frominversely related to a) successful completion of the the sample.FAA Academy nonradar program in the en routeoption prior to 1986 and b) achieving full perfor- TheSTPliscomprisedofatotalof60items, dividedmance level as an ATCS after field training (Collins, into six subscales. The scores for three "trait"Schroeder, & Nye, 1989). subscales are determined by the frequency (i.e.,
almost never, sometimes, often, and almost always)Those trainees who reported above-average perfor- of each emotion, while the "state" subscales ask themance self-expectations for themselves as ATCSs respondent to indicate how he/she feels at the presentat the beginning of Academy screen programs were time (i.e., not at all, somewhat, moderately so, andlater found to have higher actual pass rates (Collins, very much so). The total scores for each subscale areNye, & Manning, 1990; VanDeventer, Collins, obtained by summing the item responses, giving aManning, Taylor, & Baxter, 1984). These expecta- range of possible scores from a minimum of 10 to ations were defined and measured based on a self- maximum of 40. The Cronbach (alpha) reliabilitiesprojection of effectiveness (relative to peers) both in ranged from .86 for state anxiety to .66 for the statefuture training and at the full performance level as anger scale. For this study, only the trait effects ofair traffic controllers. the STPI on Academy screen performance were
evaluated (anxiety, alpha = .77; curiosity, alpha =A recent model of work attitudes, motivation, and .82; and anger, alpha = .76).performance (Katzell & Thompson, 1990) postu-lated that ability-related resources directly affect The BQ that was administered was comprised ofboth performance and expectancy; the later term 145 items that addressed various aspects of thewas defined by Campbell and Pritchard (1976) as entrant's background (for example, education andthe subjective likelihood that a given level of indi- aviation-related experience) and current attitudesvidual effort will result in the achievement of a regarding his/her career goals and expectations.performance goal. Also, an individual's perceptionsof having the personal resources, including cogni- Anticipated job satisfaction was measured by self-tive and behavioral skills, that are necessary to reported responses, using a five-point scale fromaccomplish a goal have been termed self-efficacy "not at all" to "a very great extent," to three items(Bandura, 1982). Perceived self-efficacy was found from the Biographical Questionnaire:to help explain numerous motivations, achievementstrivings and career goals, for example. Thus, one a) Do you expect that working for the federalspecific hypothesis tested in the current study was government will be desirable?that there existed a positive and significant relation-ship between performance self-expectations and
2

TABLE 1: Means, Standard Deviations, and Group Comparisons of State-Trait PersonalityInventory (STP1) Scores - Anxiety, Curiosity, and Anger Scales
Normative GroupsColleee Studen Navy Recruits ATCS Trainees
Men Women Men Women Men Women
n = (95) (185) (198) (72) (1237) (274)
Trait AnxieMean 17.88 19.38 19.17 19.24 14.86 15.08SD 4.47 5.65 5.14 5.56 3.54 3.30t value -6.43* -9.33* -11.38* -6.07*
State AnxieyMean 17.95 19.06 24.05 23.88 16.22 15.71SD 5.52 6.25 7.14 7.94 4.80 4.61t value -2.96 -6.24* -14.90* -8.37*
Trait CuriosityMean 29.67 29.30 28.72 31.10 31.27 31.66SD 5.05 4.53 5.10 4.97 4.22 3.95t value 3.08* 5.76* 6.68* 0.89
State CuriosityMean 26.85 26.17 27.12 30.83 30.08 30.25SD 5.72 5.45 6.35 5.73 5.65 5.28t value 5.31* 7.97* 6.18* 0.88
Trait AngrMean 18.65 19.14 20.88 19.63 16.03 15.93SD 5.06 4.97 5.73 5.32 3.49 3.55t value -4.96* -7.58* -11.57* -5.58*
State AngerMean 13.42 14.24 17.38 15.07 10.38 10.18SD 5.38 5.75 7.27 6.38 1.45 0.61t value -5.49* -9.57* -13.51* -6.50*
* Separate variance t-test statistic significant at p< .001 for same-gender comparisons between thenormative groups and the ATCS trainees.
b) Do you expect that management will be b) Of all the air traffic controllers in the country,supportive of your concerns? at what percentile do you think you will be
able to perform? (5-point scale ranging fromc) Do you expect to be satisfied with your job? "the lowest 10%" to "the top 10%").
For this study, performance self-expectations were The entrants' scores were obtained for the Multi- - -measured by the self-reported responses to the fol- plex Controller Aptitude Test (MCAT). Also, the "Wlowing two items: entrants' subsequent Academy screen results (suc-
cessful completion, failure, or withdrawal) and the 3a) How long do you think that it will take you to final Academy grades were available from a data- 3
become fully effective in your current job? (5- base maintained in the Human Resources Research -
point scale ranging from "much longer than Division atthe Civil Aeromedical Institute (CAMD.most others" to "much less time than mostothers"), .+.+t .
Av,1 labillty Codem3 Avll nd/ok
3' Speia
Z +

TABLE 2: Multivariate Analysis of Variance Assessing Relationships of STPI Trait Measures withTrainee Self-Expectations of Job Satisfaction Levels
Trait Scales in z Scores
T-Anx T-Cur T-Ang
ffec Mean Mean Mean N
Job Satisfaction Expect.- .258 -.278 .139 442Moderate or Limited
Job Satisfaction Expect.- -. 120 .129 -.064 950Considerable or Great
Total sample .000 .000 .000 1392
Bartlett test of sphericity (3,1390) - 318.38, p < .001
Multivariate Tes Univariate Tests
F E
Hotelling 25.55 <.001 T-Anx 44.37 <.001T-Cur 51.77 <.001T-Ang 12.45 <.001
RESULTS AND DISCUSSION Personality Characteristics and Job SatisfactionDisposition. A multivariate analysis of variance
The results of group comparisons of ATCS trainees (Table 2) was conducted using standardized scores (zwith samples of college students and Navy recruits scores) for the three personality trait subscales for afrom Spielberger (1979) are shown in Table 1. dichotomy of groups based on self-expected jobBecause the variances of the scale scores were not satisfaction (to a "considerable" or "very great"found to be equal (i.e., the scale standard deviations extent and to a "moderate" or "limited" extent). Thiswere lower for both men and women ATCSs), procedure also allowed for the determination ofseparate variance t-tests were performed. The corn- effect size differences on the STPI dimensionsparisons were by gender and each comparison indi- between the two groups. The Hotelling multivariatecated that men and women ATCS trainees reported test for job satisfaction expectation groups was sig-less trait and state anxiety than did Spielberger's nificant (F=25.55, p<.001): the univariate tests indi-samples (t values, -2.96 to - 14.90). Similarly, lower cated thatthe differences were most prominent in thelevels of both trait and state anger were reflected in curiosity (F=51.77, p<.001, d=.41) and anxietyeach comparison by t values -5.49 to -13.51. Also, (F=44.37, p<.001, d=.38) scale scores and second-the ATCS sample reported greater trait and state arily in the anger (F=12.55, p<.001, d=.20) dimen-curiosity inmostof the between-group comparisons sion. These findings were consistent with the hy-(t values, 0.89 to 7.97). In other words, significant pothesized results; the curiosity personality dimen-differences (p<.001) were found in all but two of the sion being positively, but the anxiety and anger24 between-group, by-gender comparisons. dimensions being negatively, associated with self-
expectations of employees' future job satisfaction.There were no significant gender group differenceswithin our ATCS sample for any of the trait or state For a more descriptive representation of the relation-measures. This last finding contrasted with gender ships between STPI scales and the future job satis-differences in trait anxiety, which occurred in the faction criterion, the standardized scores for traitnormative group of college students and also in a anxiety, trait curiosity, and trait anger for the samplestudy of community volunteers (Stoner & Spencer, were recoded into categories: less than -1.0, -1.0 to1986) in which women indicated higher levels of zero, zero through 1.0, and greater than 1.0. Table 3trait anxiety. shows the percentages of students within the job
4

TABLE 3: STPI Trait Scale Levels and Job Satisfaction Self-Expectations
Curiosi - X2 (43.96), p < .001, N = 1,486
Extent of exoected Job Satisfaction as an ATCS
Moderate ConsiderableQr limited or g_ r at[l
z Scores < -1.0 45.4% 54.6%-1.0 to 0.0 35.4% 64.6%0.0 thru 1.0 28.7% 71.3%z Scores > 1.0 20.0% 80.0%
Total 32.5% 67.5%
Anxy- X2 (42.58), p < .001, N = 1,486
Moderate Considerableor limited orVyga-m
z Scores < -1.0 21.7% 78.3%-1.0 to 0.0 29.0% 71.0%0.0 thru 1.0 34.5% 65.5%z Scores > 1.0 48.2% 51.8%
Total 32.5% 67.5%
A - X2 (12.99), P < .01, N - 1,486
Moderate Considerableor limited or very great
z Scores < -1.0 26.2% 73.8%-1.0 to 0.0 30.2% 69.8%0.0 thru 1.0 36.2% 63.8%z Scores > 1.0 40.2% 59.8%
Total 32.5% 67.5%
5

TABLE 4: Effects of STPI Personality Traits, ATC Aptitude Test Scores, Education Level, MilitaryATC Experience, Gender, and ATCS Self-Performance Expectations on Future JobSatisfaction
T-Cur Educ T-Anx T-Ang JobExp MiIATC Gender MCATT-Cur ---Educ .00 ---T-Anx -.34 .05 ---T-Ang -. 12 -.05 .39 ---JobExp .18 -.09 -.26 -.04 ---MiIATC .01 -.28 -.09 .07 .15 ---Gender .03 .05 .02 -.02 -. 11 -.09 -
MCAT -.05 .04 .02 -.05 .14 -. 19 -. 12 -
JobSat .30 -. 12 -.24 -. 14 .16 .09 .00 .00
Variable Beta Weight F i1nif.
T-Curiosity .24 79.10 p <.001Education Level (I= H.S., 2=Assoc. Deg.,
3=Bach. Deg., 4=Post Grad) -. 11 15.34 p<.001T-Anxiety -. 10 10.23 p<.001T-Anger -.08 7.96 p <.01Job Performance Expectations as ATCS .07 6.79 p< .01Military ATC Experience (No=0, Yes= 1) .05 3.01Gender (Men= 1, Women=2) .01 .26ATC Aptitude Test Score (MCAT)* .01 .19
Multiple R = .36, F(8,1347) = 26.14
* MCAT - Multiplex Controller Aptitude Test selection test for ATCS applicants.
Note: The dependent variable (JobSat) - future job satisfaction - is the mean of three items from theBiographical Questionnaire involving the extent of expected a) desirability of working for the federalgovernment, b) management support of employee concerns, and c) overall job satisfaction.
satisfaction expectation groups. The effect of curi- educational level, and military air traffic controlosity on job satisfaction self-expectations (x2 (3) experience). The beta weights of the variables were=43.96, p < .001) was reflected in the finding that examined to estimate the relative importance of the80.0% of the students who had trait curiosity scores association of these variables with self-expectationsthat were at least one standard deviation higher than of future job satisfaction. The beta weights indicatedthe ATCS mean expressed greater likelihood of job that trait curiosity (B=.24, F=79. 10) tended to corre-satisfaction. Conversely, only about one-half(51.8%) spond most significantly with anticipated job satis-of the group with trait anxiety scores and 59.8 % of faction, while gender, aptitude test scores, and priorthose with anger scores (at least one standard devia- military experience were not significant predictorstionaboveoursamplenorm)expectedtobesatisfied in the regression equation. As found in previouswith their jobs as ATCSs. analyses, increasing anxiety and anger levels were
related inversely with self-expectations. Job perfor-Table 4 presents a correlation matrix and results of mance self-expectations were significantly, and posi-regressing the future job satisfaction criterion mea- tively associated with self-expectations of job satis-sure on not only the STPI scale scores, but also other faction. Also, a significant but small (B = -.11, F =potentially relevant and interrelated variables; in- 15.34) inverse effect was indicated for educationalcluding MCAT scores, subjective performance ex- level and the job satisfaction criterion.pectations, and several demographic items (gender,
6

TABLE S: Multivariate Analysis of Variance Assessing Relationships of STPI Trait Measures withTrainee Self-Expectations of Future ATCS Performance Level
Trait Scales in z Scores
T-Anx T-Cur T-Ang
GrouD Effect Mean Mean Mean N
Performance Expect.-Average or Lower .276 -. 144 .027 508
Performance Expect.-Above Average -. 158 .083 -.016 884
Total sample .000 .000 .000 1392
Bartlett test of sphericity (3,1390) = 342.17, p < .001
Multivariate Test Univariate Tests
F 11L. F ~ g
Hotelling 24.19 <.001 T-Anx 63.48 <.001T-Cur 16.57 <.001T-Ang 0.59 >.05
Personality Characteristics, Performance Expec- between the trait anger characteristic and the crite-tations, and Academy Screen Results. A multiva- rion measure was not significant as indicated byriate analysis of variance (Table 5) was conducted x2(3) = 2.78, p>.0 5 .using the standardized scores (z scores) for the threepersonality trait subscales fora dichotomy of groups, Table 7 presents a correlation matrix and the resultsbased on subjective performance expectations of of a multiple regression analysis with the trainees'"above average" and "average or lower" compared performance self-expectation criterion and the fol-with other ATCSs. The Hotelling multivariate test lowing variables: the STPI trait measures, the scoresfor performance self-expectation groups was sig- on the Multiplex Controller Aptitude Test (MCAT),nificant (F=24.19,p<.001) with the univariate tests previous experience (yes/no) in military air trafficindicating that the differences were most prominent control, educational level, and gender. The betain anxiety scores (F-63.48, p<.001, d=.43), and weights indicated that higher trait anxiety (B= -.23,secondarily in curiosity level (F=16.57, p<001, F=63.94) tended to correspond to lower perfor-d=.23). mance self-expectations. Also there was a small
effect (B= -.07, F=8.53) in the regression equationTh: strongest effect on performance self-expecta- for gender, with women reporting lower job self-ions was anxiety (x2(3)= 69.03,p<.001), reflected expectations than did men. By contrast, previous
in the finding that 76.3% of the students who had military experience, higher MCAT scores, andtrait anxiety scores that were at least one standard greater curiosity were positively related and addeddeviation lower than the ATCS mean also expressed significantly to prediction of the criterion.above average performance expectations (Table 6).Conversely, less than one-half (46.0%) of the group Table 8 shows the Academy screen pass rates of ourwith trait anxiety scores at least one standard devia- sample groaped by MCAT score level and STPI traittion higher than our ATCS sample mean expected level. The dichotomy of trait scores was based onabove average job performance. Trait curiosity was "high" equalling the level of one rounded-pointalso significantly related to performance expecta- above the mean scores of the normative groupstions (x2(3) = 19.31,p<.001), with higher curiosity (anxiety -20, anger - 21, curiosity - 30). Consistentreflected in greater confidence. The relationship with previous results, relatively small percentages
7

TABLE 6: STPI Trait Scale Levels and Trainee Performance Self-Expectations
Anxie- X2 (69.03), p < .001, N = 1,486
Performance Self-Expectations compared with other ATCSs
Average Aboveor Lower Average
z Scores < -1.0 23.7% 76.3%-1.0 to 0.0 29.8% 70.2%0.0 thru 1.0 44.1% 55.9%z Scores > 1.0 54.0% 46.0%
Total 37.1% 62.9%
Curiosiy - X (19.31), p <.001, N 1,486
Average Aboveor Lower Average
z Scores < -1.0 45.5% 54.5%-1.0 to 0.0 39.9% 60.1%0.0 thru 1.0 33.5% 66.5%z Scores > 1.0 29.1% 70.9%
Total 37.1% 62.9%
Anger - X2 (2.78), p > .05, N = 1,486
Average Aboveor Lower Average
z Scores < -1.0 32.2% 67.8%-1.0 to 0.0 37.2% 62.8%0.0 thru 1.0 37.8% 62.2%z Scores > 1.0 40.1% 59.9%
Total 37.1% 62.9%
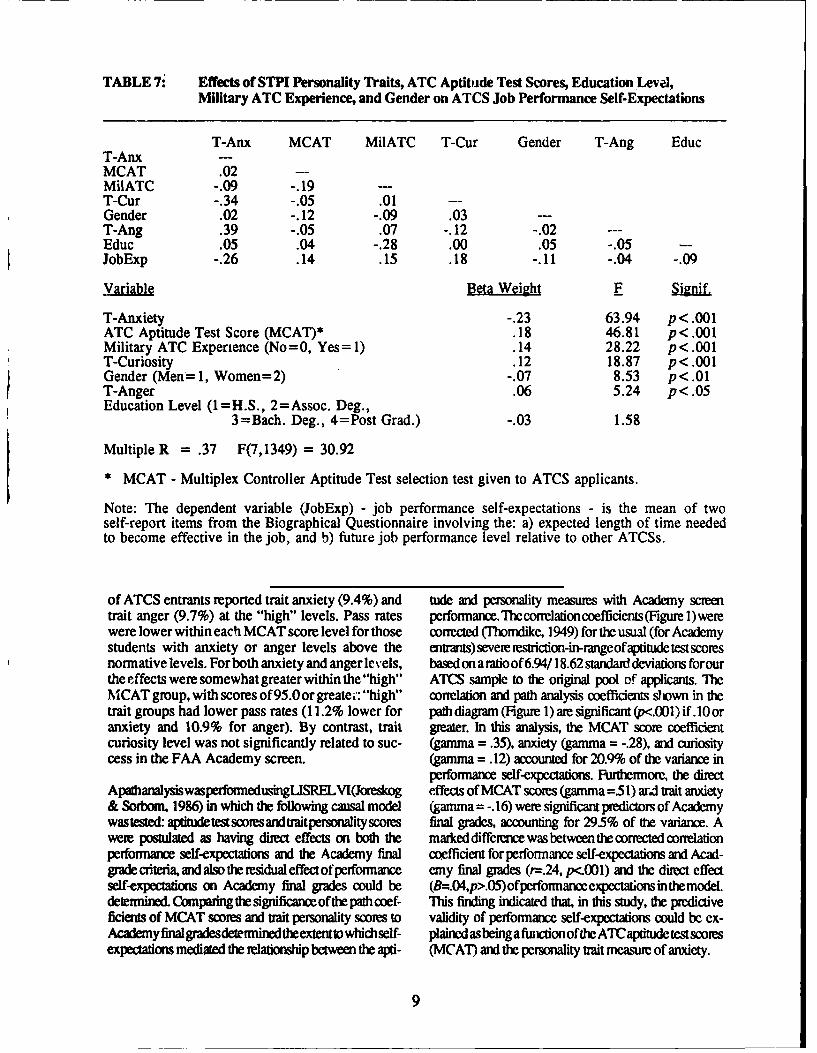
TABLE 7: Effects of STPI Personality Traits, ATC Aptitude Test Scores, Education Level,Military ATC Experience, and Gender on ATCS Job Performance Self-Expectations
T-Anx MCAT Mi1ATC T-Cur Gender T-Ang EducT-Anx ---MCAT .02 ---MilATC -.09 -. 19 ---T-Cur -.34 -.05 .01 ---Gender .02 -. 12 -.09 .03 ---T-Ang .39 -.05 .07 -. 12 -.02Educ .05 .04 -.28 .00 .05 -.05 --JobExp -.26 .14 .15 .18 -. 11 -.04 -.09
Variabl Beta Weight F Sinif
T-Anxiety -.23 63.94 p<.001ATC Aptitude Test Score (MCAT)* .18 46.81 p<.001Military ATC Experience (No=0, Yes= 1) .14 28.22 p<.001T-Curiosity .12 18.87 p<.001Gender (Men= 1, Women=2) -.07 8.53 p<.01T-Anger .06 5.24 p <.05Education Level (1=H.S., 2=Assoc. Deg.,
3=Bach. Deg., 4=Post Grad.) -.03 1.58
Multiple R = .37 F(7,1349) = 30.92
* MCAT - Multiplex Controller Aptitude Test selection test given to ATCS applicants.
Note: The dependent variable (JobExp) - job performance self-expectations - is the mean of twoself-report items from the Biographical Questionnaire involving the: a) expected length of time neededto become effective in the job, and b) future job performance level relative to other ATCSs.
of ATCS entrants reported trait anxiety (9.4%) and tude and personality measures with Academy screentrait anger (9.7%) at the "high" levels. Pass rates performance.Theconrrlaioncoefficients(Figure 1)werewere lower within each MCAT score level for those corrected (Thomdike, 1949) for the usual (for Academystudents with anxiety or anger levels above the enrants) severe restriction-in-rangeofaptitude testscoresnormative levels. For both anxiety and anger levels, based on a ratio of6.94/ 18.62 standard deviations forourtheeffects were somewhat greater within the "high" ATCS sample to the original pool of applicants. TheMCAT group, with scores of 95.0 or greate1 : "high" correlation and path analysis coefficients shown in thetrait groups had lower pass rates (11.2% lower for path diagram (Figure 1) are significant (.001) if.10 oranxiety and 10.9% for anger). By contrast, trait greater. In this analysis, the MCAT score coefficientcuriosity level was not significantly related to sue- (gamma = .35), anxiety (gamma = -.28), and curiositycess in the FAA Academy screen. (gamma = .12) accounted for 20.9% of the variance in
performance self-expectations. Furhermore, the directApathanalysiswaspefoumedusingSRELVI(Joekog effects of MCAT scores (gamma =51) ar- trait anxiety& Sorbom, 1986) in which the following causal model (gamma = -. 16) were significant predictors of Academywastested: aptitudetestscoresandwraitpersonalityscores final grades, accounting for 29.5% of the variance. Awere postulated as having direct effects on both the marked difference was between the corrected correlationperformance self-expectations and the Academy final coefficient for performance self-expectations and Acad-grade criteria, and also the residual effect ofperformance cmy final grades (r=.24, p<.001) and the direct effectself-expectations on Academy final grades could be (B=.04,p>.05) ofprfomance expectations in the model.detennined. Comparing the significance ofthe path coef- This finding indicated that, in this study, the predictiveficients of MCAT scores and trait personality scores to validity of performance self-expectations could be ex-Academyfmlgdesdeteminedtheextentto which self- plained asbeinga function of the ATC aptitude test scoresexpectations mediated the relationship between the apt- (MCAT) and the personality trait measure of anxiety.
9

TABLE 8: Academy Screen Pass Rates for MCAT and STPI Levels
Anxiety Anger Curiosity% Pass % of % Pass % of % Pass % of
GROUPS Screen Sample Screen Sample Screen Sample
Lower MCAT- High Trait 46.0 4.9 49.4 6.0 56.1 42.1Lower MCAT- Lower Trait 56.6 56.0 56.5 54.9 55.0 18.8High MCAT- High Trait 63.8 4.5 63.8 3.7 72.4 25.7High MCAT- Lower Trait 75.0 34.6 74.7 35.4 76.2 13.4
Note: (n = 1,284), Multiplex Controller Aptitude Test (MCAT) levels are "Lower" = 70-95 and"High" = 96-112.
State Trait Personality Inventory (STPI) "Lower" levels are trait anxiety < 20, trait anger < 21, andtrait curiosity < 30.
CONCLUSIONS
The results of this study confirm earlier findings For the last issue of this study, both ATCS job(Collins, Schroeder, & Nye, 1989), that recently performance self-expectations and Academy screenemployed ATCS trainees continued to have a per- performance were related to aptitude test scores andsonality profile that is relatively low in anxiety. to trait anxiety levels. The predictive validity of theAlso, our sample was low on the anger dimension MCAT was demonstrated to have been impacted bybut high on the curiosity measure of the STPI. This the anxiety personality dimension. It was found that,finding could be a further example of applicant self- to some extent, future performance self-expecta-selection and/or the nature of the selection process tions (conceptualized as a measure of self-efficacy)itself. Significantgenderdifferences forATCS train- reflected a realistic self-evaluation of future jobees were not found on any of the STPI dimensions, performance (success in the Academy screen) at ana finding consistent with previous research, e.g., initial stage in the trainees'careers. Also, the impactKarson and O'Dell (1974), which found that the of self-efficacy on Academy screen performancepersonality profiles of men and women interested in could be explained in terms of relative ability (MCATthe air traffic control occupation were more similar test scores) and personality characteristics (absencethan dissimilar. of anxiety) found in successful air traffic control-
lers.With respect to self-expectations of future job satis-faction, significant differences were found in theperceptions of newly hired air traffic controllers.Since the sample for this study included only first-time Academy entrants and the self-expected jobsatisfaction items were completed at the beginningof the ATCS screen program, many potential situ-ational factors were mitigated that could affect jobsatisfaction. Thus, these results suggest that thepotential exists for some degree of biased affect (orpredisposition) regarding future job satisfaction andthat some of the variability is reflected by the STPIdimensions. Specifically, greater future job satis-faction was associated with higher levels of curios-ity but lower levels of the anxiety and anger person-ality dimensions.
10

FIGURE 1: Correlation Matrix and Path Analysis of STPI Measures, Aptitude Test Scores, JobPerformance Self-Expectations, and Final Academy Grades
PerfEx Grades Anx-T Cur-T An-T
PerfExp ---Grades .24 ---Anx-T -.27 -. 11 ---Cur-T .18 -.04 -.33 ---Ang-T -.04 -.02 .40 -. 12 ---MCAT .33 .52 .03 -.05 -.05
Note: Coefficients are corrected for restriction-in-range of aptitude test (MCAT) scores.
Structural Path Coefficients
(Maximum Likelihood)
.51
.35MCAT
.12 VCUR-T > PERFORMANCE .04 ACADEMY
.08 SELF- > FINALANG-T - > EXPECTATIONS GRADES-.28 A
ANX-T .2
-.16>
Note: MCAT= Multiplex Controller Aptitude Test; PERFEXP= JobPerformance Self-expectations; ANX-T= Trait Anxiety; ANG-T=
Trait Anger; CUR-T= Trait Curiosity. Path coefficients of.10 or greater were significant (n=1 142, p=<.001).
11

REFERENCES
Bandura, A. (1982). Self-efficacy mechanism in Karson, S., & O'Dell, J. W. (1974). Personalityhuman agency. American Psychologist, 37, differences between male and female air taf-122-147. fic controller applicants. Aerospace Medi-
cine, 4=, 596-598.Campbell, J. P., & Pritchard, R. D. (1976). Moti-
vation theory in industrial and organizational Katzell, R. A., & Thompson, D. E. (1990). Anpsychology. In M. D. Dunnette (Ed.), Hand- integrative model of work attitudes, motiva-book of industrial and organizational psy- tion, and performance. Human Performance,chology (pp. 63 -130). New York: John Wiley 3(2, 63-85.and Sons.
Cattell, R. B., Eber, H. W., & Tatsuoka, M. M. Locke, E. A. (1976). The nature and causes ofjob(1970). Handbook for the 16PF. Institute for satisfaction. In M. D. Dunnette (Ed.), Hand-Personality and Ability Testing. Champaign, book of industrial and organizational psychol-IL. ogy, (pp. 1297-1349). New York: John Wiley
and Sons.Cohen, J. (1977). Statistical power analysis for
thebehaviorasciences.New York: Academic Manning, C. A, Kegg, P. S., & Collins, W. E.Press. (1989). Selection and screening programs for
AirTraffic Control Specialists. InR. S. JensenCollins, W. E., Schroeder, D. J., & Nye, L. G. (Ed.), Aviation Psychology (pp. 321-341).
(1989).RelationshipsofanxietyscorestoAcad- Brookfield: Gower Technical.emy and field training performance of AirTraffic Control Specialists. Washington, D. Myers, J. G., Schroeder, D. J., VanDeventer, A.C.: Federal Aviation Administration Report D., & Collins, W. E. (1988). 1988 FAA jobNo. DOT/FAA/AM-89-7. satisfaction survey: National report. Wash-
ington, DC: FAA Office of Aviation Medi-Collins, W. E., Nye, L. G, & Manning, C. A. cine.
(1990). Studies of poststrike Air Traffic Con-trol Specialist trainees: i!. Changes in demo- Schmitt, N., & Pulakos, E. D. (1985). Predictinggraphic characteristics of Academy entrants job satisfaction: Is there a general satisfactionand biodemographic predictors of success in factor? International Journal of Psychology,air traffic controller selection and Academy 2D, 155-167.r7reening. Washington, D. C.: FAA Office ofAviation Medicine Report No. DOT/FAN Schroeder, D. J., Dollar, C. S., & Nye, L. G.AM-90/4. (1990). Correlates of two experimental tests
with performance in the FAA Academy airDella Rocco, P. S., & Manning, C. A. (1990). trafficcontrolnonradarscreenprogram. Wash-
Selection of air traffic con-trollers for auto- ington, D. C.: FAA Office of Aviation Medi-mated systems: Applications from current re- cine Report No. DOT/FAA/AM-90/8.search. Washington, DC: FAA Office of Avia-tion Medicine Report No. DOT/FAA/AM- Sells, S.B., Dailey, J.T., & Pickrel, E.W. (1984).90/13. Selection of air traffic controllers. Washing-
ton, DC: Federal Aviation AdministrationJoreskog, K G., & Sorbom D. (1986). LISREL VI: Report No. FAA-AM-84-2.
Analysis of linear structural relationships bythe method of maximum likelihood: User'sguide (4th ed.). Mooresville, IN: ScientificSoftware, Inc.
12

Spielberger, CD. (1979). Pirliminary manual forthe State-Trait Personality Inventory. Inven-tory. Tamnpa, Florida: Human Resores Inst-tuite, U of South Florida.
Staw, B. hL, & Ross, L. (1985). Stability in themidst of drange: A dispositional approach tojob attitudes. Jocral of Applied Psychology,MD,469480.
Staw, B. K~, Bell, N.EF., & Clusen, J. A. (1986).Mwe dispositional approach to job attitudes: Alifetime longitudinal test. Administrative Sci-aeiKs Quarterly, 56-77.
Stoner, S. B., & Spencer, W. B. (1986). Age andsex differences on the State-Trait PersonalityIwnvetry. Psychological Reports 52.13 15-1319. Tbomdike, IL L. (1949). Personnel Se-lecuon. New York: Wiley and Sons.
Vz anwvetr, A. D., Collins, W. F., bMannng CA,.&TaylorD. K(l984).ShaiesfpartmLkeAir Traffi ControlSpecialiuraineer:l. Age,biographical factors, and selection test per-formnce related to Academy training suc-cess. Washington, D. C: Federal Aviation.Administration Report No. FAA-AM-84-6.
13 *U.L GOVERNMENT PAINTING OMCE. W99 - S634WII