Some pages of this thesis may have been removed for...
242
Some pages of this thesis may have been removed for copyright restrictions. If you have discovered material in Aston Research Explorer which is unlawful e.g. breaches copyright, (either yours or that of a third party) or any other law, including but not limited to those relating to patent, trademark, confidentiality, data protection, obscenity, defamation, libel, then please read our Takedown policy and contact the service immediately ([email protected])
Transcript of Some pages of this thesis may have been removed for...

Some pages of this thesis may have been removed for copyright restrictions.
If you have discovered material in Aston Research Explorer which is unlawful e.g. breaches copyright, (either yours or that of a third party) or any other law, including but not limited to those relating to patent, trademark, confidentiality, data protection, obscenity, defamation, libel, then please read our Takedown policy and contact the service immediately ([email protected])

1
The Integration of ProxiMAX
Randomisation with CIS Display for the
Production of Novel Peptides.
Andrew James Poole
Doctor of Philosophy
ASTON UNIVERSITY
September 2015
©Andrew James Poole
Andrew James Poole asserts his moral right to be identified as the author of this thesis.
This copy of the thesis has been supplied on condition that anyone who consults it is
understood to recognise that its copyright rests with its author and that no quotation from this
thesis and no information derived from it may be published without proper acknowledgement.

2
Aston University
The Integration of ProxiMAX Randomisation with CIS Display for the Production of Novel Peptides.
Andrew James Poole Doctor of Philosophy
September 2015
Thesis Summary
Saturation mutagenesis is a powerful tool in modern protein engineering, which
permits key residues within a protein to be targeted in order to potentially enhance specific functionalities. However, the creation of large libraries using conventional saturation mutagenesis with degenerate codons (NNN or NNK/S) has inherent redundancy and consequent disparities in codon representation. Therefore, both chemical (trinucleotide phosphoramidites) and biological methods (sequential, enzymatic single codon additions) of non-degenerate saturation mutagenesis have been developed in order to combat these issues and so improve library quality.
Large libraries with multiple saturated positions can be limited by the method used to screen them. Although the traditional screening method of choice, cell-dependent methods, such as phage display, are limited by the need for transformation. A number of cell-free screening methods, such as CIS display, which link the screened phenotype with the encoded genotype, have the capability of screening libraries with up to 1014 members.
This thesis describes the further development of ProxiMAX technology to reduce library codon bias and its integration with CIS display to screen the resulting library. Synthetic MAX oligonucleotides are ligated to an acceptor base sequence, amplified, and digested, subsequently adding a randomised codon to the acceptor, which forms an iterative cycle using the digested product of the previous cycle as the base sequence for the next. Initial use of ProxiMAX highlighted areas of the process where changes could be implemented in order to improve the codon representation in the final library. The refined process was used to construct a monomeric anti-NGF peptide library, based on two proprietary dimeric peptides (Isogenica) that bind NGF. The resulting library showed greatly improved codon representation that equated to a theoretical diversity of ~69%. The library was subsequently screened using CIS display and the discovered peptides assessed for NGF-TrkA inhibition by ELISA. Despite binding to TrkA, these peptides showed lower levels of inhibition of the NGF-TrkA interaction than the parental dimeric peptides, highlighting the importance of dimerization for inhibition of NGF-TrkA binding. Keywords: non-degenerate, saturation mutagenesis, anti-NGF, codon randomisation,

3
Acknowledgements
I would like to thank my supervisor Dr Anna Hine for giving me the opportunity of this Ph.D.
as well as her guidance and encouragement throughout the entirety of the process. My
thanks are also extended to Dr Andy Sutherland, and his group, for offering help and
feedback during our group meetings.
My thanks are also extended to my industrial sponsors, Isogenica, specifically Dr Chris
Ullman, Dr Laura Frigotto, Dr Matt Smith, for his help with the library and MiSeq analysis,
and Dr Gabriela Ivanova-Berndt for the mass spectrometry analysis. I would also like to
thank everybody else at Isogenica for making me feel welcome during my time at the
company.
I would also like to thank both past and present members of the research group. Dr Sam
Hebaishi and Jenn Lines for offering continued help and insight throughout, along with Dr Mo
Ashraf, Mike Tredgett, Marta Fraszczak and Jacob Kerin, as well as Dr Dave Nagel for his
consultation and help regarding the protein expression and refolding.
My thanks are also extended to the members of my office and lab including Dr Heather
Currinn, Dr James Barwell, Dr Marvin Dilworth, as well as many others, without whom this
Ph.D. would have been far less enjoyable.
Finally I thank my family who have supported me throughout my entire life, I am truly grateful
for everything you have done for me, and Jade for her love, understanding and support with
all matters scientific or not throughout this time.

4
Contents
1. Chapter 1: Introduction .................................................................................................. 16
1.1. Site-Directed and Saturation Mutagenesis ............................................................. 16
1.2. Degenerate Saturation Mutagenesis ...................................................................... 18
1.3. Saturation Mutagenesis with Limited Degeneracy .................................................. 20
1.3.1. NNK/S Saturation ............................................................................................ 20
1.3.2. 22-c Trick ........................................................................................................ 21
1.4. Non-degenerate Saturation Mutagenesis ............................................................... 21
1.4.1. Chemical Approaches to Non-degeneracy ...................................................... 21
1.4.2. PCR-Based Methodologies ............................................................................. 25
1.4.3. Sequential, Enzymatic Single Codon Additions ............................................... 28
1.5. Comparison of Saturation Mutagenesis Methods ................................................... 30
1.5.1. Library Size/Diversity ...................................................................................... 30
1.5.2. Codon Bias ..................................................................................................... 32
1.5.3. Encoded Truncation ........................................................................................ 32
1.5.4. Practicality of Application ................................................................................ 33
1.6. Screening Technologies ......................................................................................... 34
1.6.1. In vivo Cell-Dependent Display Systems ......................................................... 34
1.6.2. In vitro Cell-Free Display Systems .................................................................. 37
1.7. Peptides as Therapeutic Agents ............................................................................. 42
1.8. Nerve Growth Factor (NGF) ................................................................................... 43
1.8.1. NGF Structure ................................................................................................. 43
1.8.2. NGF Receptors ............................................................................................... 45
1.8.3. NGF-Receptor Interaction ............................................................................... 46
1.8.4. Clinical Use of Anti-NGF Therapy ................................................................... 48

5
1.9. Project Outline ....................................................................................................... 49
2. Chapter 2: Materials and Methods ................................................................................. 51
2.1. Materials ................................................................................................................ 51
2.1.1. Media Recipes ................................................................................................ 51
2.1.2. Broth Recipes ................................................................................................. 51
2.1.3. Buffer Recipes ................................................................................................ 52
2.1.4. Other Solutions ............................................................................................... 59
2.1.5. Cell Lines ........................................................................................................ 61
2.1.6. Vectors ............................................................................................................ 61
2.2. Methods ................................................................................................................. 62
2.2.1. Enzyme Dependent Reactions ........................................................................ 62
2.2.2. ProxiMAX Procedure ....................................................................................... 64
2.2.3. Refined ProxiMAX Procedure.......................................................................... 69
2.2.4. Electrophoresis ............................................................................................... 71
2.2.5. Transformation of Escherichia Coli .................................................................. 74
2.2.6. Plasmid Purification (Small scale) ................................................................... 75
2.2.7. Ethanol Precipitation ....................................................................................... 75
2.2.8. Phenol/Chloroform Extraction ......................................................................... 76
2.2.9. Protein Expression and Purification ................................................................. 76
2.2.10. CIS Display .................................................................................................. 83
2.2.11. NGF Inhibition Assay ................................................................................... 85
3. Chapter 3: ProxiMAX Randomisation: Single Reaction Equimolar Ligation Library ....... 88
3.1 Introduction ............................................................................................................ 88
3.2 MAX Oligonucleotide and Library Framework Preparation ..................................... 90

6
3.3 ProxiMAX Saturation Cycling ................................................................................. 92
3.4 ProxiMAX Saturation Cycling with Re-designed MAX Oligonucleotides ................. 94
3.5 Completed Library Analysis .................................................................................... 99
3.6 Discussion ............................................................................................................ 104
4. Chapter 4: Anti-NGF Peptide Library-ProxiMAX Process Refinement. ........................ 109
4.1. Introduction .......................................................................................................... 109
4.2. Framework and MAX Oligonucleotide Preparation ............................................... 111
4.3. ProxiMAX Saturation Cycling of Anti-NGF Peptide Library ................................... 115
4.4. Completed Anti-NGF Peptide Library Analysis ..................................................... 121
4.5. ProxiMAX Saturation Cycling of Resynthesized LH Anti-NGF Peptide Library ..... 127
4.6. Resynthesized LH Anti-NGF Peptide Library Analysis.......................................... 130
4.7. Discussion ............................................................................................................ 133
5. Chapter 5: Recombinant Human Nerve Growth Factor Expression, Purification and
Activity Testing in an Escherichia Coli Expression System ................................................. 137
5.1. Introduction .......................................................................................................... 137
5.2. Expression and purification of β-NGF using pJ434 ............................................... 138
5.3. β-NGF Sub-Cloning into pETSUMO ..................................................................... 141
5.4. pETSUMO-βNGF Expression Optimisation in E.coli Bl21. .................................... 145
5.5. pETSUMO-βNGF Expression and Purification in E.coli SHuffle. .......................... 149
5.6. Preparation, Purification and Refolding of Insoluble SUMO-βNGF ....................... 152
5.7. SUNO-βNGF Activity Testing ............................................................................... 158
5.8. Discussion ............................................................................................................ 161
6. Chapter 6: Anti-NGF Peptide Selection, Screening and Testing. ................................. 165
6.1. Introduction .......................................................................................................... 165
6.2. Biotinylation of rh-βNGF ....................................................................................... 166

7
6.3. Library Selections Using CIS Display ................................................................... 169
6.4. Cloning of Selection Output .................................................................................. 171
6.5. Screening of Selection Output .............................................................................. 173
6.6. Sequencing of Screening Output .......................................................................... 179
6.7. Anti-NGF Peptide Testing .................................................................................... 182
6.8. Discussion ............................................................................................................ 195
6.8.1. Biotinylation ................................................................................................... 195
6.8.2. Library Screening .......................................................................................... 195
6.8.3. Peptide Testing - ELISA Results ................................................................... 198
7. Chapter 7: Discussion and Conclusions ...................................................................... 204
7.1. Summary of Results ............................................................................................. 204
7.2. Discussion and Conclusions ................................................................................ 209
7.2.1. ProxiMAX Randomisation ............................................................................. 209
7.2.2. CIS Display ................................................................................................... 211
7.2.3. Peptides: Therapeutics, Interactions and Optimisation .................................. 212
8. References .................................................................................................................. 216
9. Appendices ................................................................................................................. 232
9.1. Appendix 1. Single Reaction Ligation Library Codon Representation Table ......... 232
9.2. Appendix 2. Anti-NGF PeptideLibrary Framework Sequences ............................. 233
9.3. Appendix 3. 72-mer Anti-NGF Peptide Library Codon Representation Tables ...... 234
9.4. Appendix 4. 63-mer Anti-NGF Peptide Library Codon Representation Tables ...... 236
9.5. Appendix 5. Re-Synthesised Final Anti-NGF Peptide Library Codon Representation
Tables ............................................................................................................................. 238
9.6. Appendix 6. pET SUMO/CAT Positive Expression Control Plasmid Map (taken from
Champion™ pET SUMO Protein Expression System manual, Invitrogen) ...................... 240
8
9.7. Appendix 7. pET SUMO Sequencing Primers ...................................................... 241

9
Table of Figures
Figure 1.1. The Genetic Code .............................................................................................. 19
Figure 1.2. NNK Limited Genetic Code................................................................................. 20
Figure 1.3. MAX Randomisation Schematic (taken from (Hughes et al., 2003)) ................... 27
Figure 1.4. Theoretical Library Diversity using Different Saturation Mutagenesis Methods
(Ashraf et al., 2013) .............................................................................................................. 31
Figure 1.5. Library display methods illustration (taken from (Baxter et al., 2014)) ................. 41
Figure 1.6. NGF Structure (taken from (Wiesmann and De Vos, 2001)) ............................... 44
Figure 1.7. NGF Dimerization (taken from (Wiesmann and De Vos, 2001)) .......................... 44
Figure 1.8. NGF-TrkA-d5 Structure (taken from (Wiesmann et al., 1999)) ............................ 47
Figure 3.1. ProxiMAX Randomisation Process Schematic .................................................... 89
Figure 3.2. Picogreen Standard Curve ................................................................................. 90
Figure 3.3. ProxiMAX Saturation Cycling .............................................................................. 92
Figure 3.4 Oligonucleotide Contamination and Concatemers ............................................... 94
Figure 3.5. Picogreen Standard Curve ................................................................................. 95
Figure 3.6. Saturation Cycling with Re-designed MAX Oligonucleotides .............................. 97
Figure 3.7. Six Cycle Comparison of Saturation Cycling PCR Products ............................... 98
Figure 3.8. Sequencing Results Randomised Array ........................................................... 101
Figure 3.9. Codon Representation of Single Reaction Equimolar Library ........................... 102
Figure 4.1. ProxiMAX Randomisation Process Illustration .................................................. 110
Figure 4.2 Original Anti-NGF Peptide Sequence Homology ............................................... 111
Figure 4.3. Library Construction Overview .......................................................................... 111
Figure 4.4. LH Framework Construction Overview ............................................................. 113
Figure 4.5. Refined Saturation Cycling and Quantification of LH Anti-NGF Library ............. 117
Figure 4.6. Refined Saturation Cycling and Quantification of RH Anti-NGF Library ............ 120
Figure 4.7. RH 6 cycle comparison and LH+RH ligation ..................................................... 121
Figure 4.8. Codon Representation of Full length (72-mer) Anti-NGF Peptide Library .......... 123
Figure 4.9. Codon Representation of Truncated (63-mer) Anti-NGF Peptide Library .......... 124

10
Figure 4.10. LH Internal Amplification Cycle Comparison ................................................... 126
Figure 4.11. Saturation Cycling and Quantification of Re-synthesised LH Anti-NGF Library
........................................................................................................................................... 129
Figure 4.12. Resynthesized LH Cycle Comparison............................................................. 129
Figure 4.13. Codon Representation of Re-synthesised LH Anti-NGF Peptide Library ......... 131
Figure 5.1 pJ434-NGF_optEc Plasmid Map ....................................................................... 139
Figure 5.2. pJ434-β-NGF Expression and Purification ........................................................ 140
Figure 5.3. pETSUMO Plasmid Map (taken from Champion™ pET SUMO Protein Expression
System manual, Invitrogen) ................................................................................................ 141
Figure 5.4. β-NGF TA Cloning ............................................................................................ 142
Figure 5.5. pETSUMO-βNGF Colony Screening ................................................................ 143
Figure 5.6. pETSUMO-βNGF Sequencing .......................................................................... 144
Figure 5.7 Initial pETSUMO-β-NGF Expression in E.coli Bl21 ............................................ 146
Figure 5.8. pETSUMO-β-NGF Expression Optimisation in E.coli Bl21 ................................ 148
Figure 5.9. pETSUMO-βNGF Expression Optimisation in E.coli SHuffle ............................ 150
Figure 5.10. pETSUMO-βNGF Soluble Fraction Purification .............................................. 152
Figure 5.11. pETSUMO-βNGF Soluble Fraction Purification .............................................. 154
Figure 5.12. SUMO-βNGF Refolding .................................................................................. 156
Figure 5.13. BCA Assay BSA Standard Curve ................................................................... 157
Figure 5.14. SUMO-βNGF Digestion and Purification ......................................................... 159
Figure 5.15. β-NGF Activity Assay...................................................................................... 160
Figure 6.1. CIS Display Overview ....................................................................................... 166
Figure 6.2. rh-βNGF Biotinylation ....................................................................................... 168
Figure 6.3. CIS Display Recovery PCR .............................................................................. 170
Figure 6.4. Selection Output Amplification and Re-introduction of Restriction Site ............. 171
Figure 6.5. NcoI/NotI Cloning Digestion .............................................................................. 172
Figure 6.6. Selection Output Screening .............................................................................. 179
Figure 6.7. Colony Screening ............................................................................................. 180
Figure 6.8. Screening Output Sequencing .......................................................................... 181

11
Figure 6.9. Simplified TrkA Inhibition ELISA Illustration ...................................................... 184
Figure 6.10. Example TrkA Inhibition ELISA Results .......................................................... 185
Figure 6.11. Initial Peptide Testing ..................................................................................... 188
Figure 6.12. Broad Concentration Range Peptide Testing .................................................. 191
Figure 6.13. Library Peptide Dose Curves .......................................................................... 192
Figure 6.14. Unnatural Amino Acid Peptide Dose Curves................................................... 193
Figure 6.15. Changes in Amino Acid Representation Before and After Selection for NGF
Binding ............................................................................................................................... 196
Figure 6.16. NGF-TrkA-d5 binding pocket (original image taken from Wiesmann et al.
(Wiesmann et al., 1999)) .................................................................................................... 198

12
Table of Tables
Table 1.1. Library Size ......................................................................................................... 31
Table 1.2. Encoded Bias (Ashraf et al., 2013) ...................................................................... 32
Table 1.3. Encoded Truncation (Ashraf et al., 2013)............................................................. 33
Table 1.4. Min/max no. of Primers to Saturate Contiguous Codons ...................................... 34
Table 2.1. Single Reaction Ligation MAX Oligonucleotide Sequences.................................. 64
Table 2.2 Re-designed Single Reaction Ligation MAX Oligonucleotide Sequences ............. 65
Table 2.3 Single Reaction Ligation Library MAX Codon Identity ........................................... 65
Table 2.4. Single Reaction Ligation Library MiSeq Primers .................................................. 68
Table 2.5. Anti-NGF Peptide Library MiSeq Primers ............................................................. 68
Table 2.6. Refined MAX Oligonucleotide Sequences ........................................................... 69
Table 2.7. Anti-NGF Peptide Library MAX Codon Identity .................................................... 70
Table 3.1. MAX Oligonucleotide Picogreen Measurements .................................................. 91
Table 3.2. Library Build Overview ......................................................................................... 91
Table 3.3. Re-designed MAX Oligonucleotide Picogreen Measurements. Picogreen
measurements ..................................................................................................................... 96
Table 3.4. MiSeq Library Length Distribution ...................................................................... 101
Table 3.5. Library Sequence Diversity ................................................................................ 103
Table 3.6. Mathematical Analysis of Library Diversity ......................................................... 103
Table 4.1. LH Anti-NGF Peptide Library Build Overview ..................................................... 112
Table 4.2. RH Anti-NGF Peptide Library Build Overview .................................................... 112
Table 4.3. LH Hairpin Quantification ................................................................................... 114
Table 4.4. RH Hairpin Quantification .................................................................................. 115
Table 4.5. Anti-NGF Peptide Library MiSeq Length Distribution ......................................... 122
Table 4.6. Mathematical Analysis of Anti-NGF Peptide Library Diversity ............................ 125
Table 4.7. Anti-NGF Peptide Library Sequence Diversity for 72-mer and 63-mer ............... 125
Table 4.8. Re-synthesised LH Anti-NGF Peptide Library MiSeq Length Distribution........... 130

13
Table 4.9. Mathematical Analysis of Re-syntehesisied LH Anti-NGF Peptide Library Diversity.
........................................................................................................................................... 132
Table 4.10. Re-synthesised LH Anti-NGF Peptide Library Sequence Diversity ................... 132
Table 5.1. pETSUMO-βNGF Cloning ................................................................................. 143
Table 5.2. SUMO-βNGF BCA Assay Quantification ........................................................... 157
Table 6.1. CIS Display Selections Plan .............................................................................. 169
Table 6.2. Selection Output pHEN Cloning ......................................................................... 173
Table 6.3. Library Peptide Identity and Sequences............................................................. 182
Table 6.4. Unnatural Amino Acid Peptide Identity and Sequences. .................................... 183
Table 6.5 Consensus of Amino Acid Preferences in Anti-NGF Peptide Monomers After
Taking Library Composition into Account. .......................................................................... 197
Table 6.6. Comparison of Consensus and Actual Peptide Sequences ............................... 202

14
Abbreviations
Amp Ampicillin
ATP Adenosine triphosphate
bp Base pair(s)
BSA Bovine serum albumin
dNTPs Deoxynucleotide
DMF Dimethylformamide
DMT N,N-Dimethyltryptamine
DNA Deoxyribose nucleic acid
EDTA Ethylenediaminetetraacetic acid
Fmoc 9-fluorenylmethyl carbamate
IPTG Isopropyl β-D-1-thiogalactopyranoside
Kan Kanamycin
LB Luria broth
Mins Minute(s)
NEB New England Biolabs
NGF Nerve Growth Factor
OD Optical density
PAGE Polyacrylamide gel electrophoresis
PBS Phosphate buffered saline
PBST Phosphate buffered saline/0.1% Tween
PCR Polymerase chain reaction
PNK Polynucleotide kinase
rh-βNGF Recombinant human β nerve growth factor
RNA Ribonucleic acid
Rpm Revolutions per minute
w/v Weight to volume
v/v Volume to volume
X-gal 5-Bromo-4-Chloro-3 indolyl-β-D-galactopyranoside

15
Chapter 1
Introduction

16
1. Chapter 1: Introduction
Directed mutagenesis techniques are becoming ever-more important tools in the field of
protein engineering. Rather than randomly making changes within a protein these techniques
rely on more detailed targeting of key residues allowing rational structural changes to be
implemented. These directed mutagenesis techniques have evolved from the substitution of
a single critical residue with another, to the ability to fully randomise/saturate multiple
residues either contiguously or at disparate locations in a protein. Whilst single substitutions
may highlight the importance of a residue in a set tertiary structure without drastic alterations,
the ability to target multiple positions can provide a more holistic overview of the roles that
different residues play within a proteins tertiary structure. High-throughput protein
engineering generates highly diverse libraries maximising the chance for novel
improvements to be discovered, whether in the fields of stability, binding affinity etc.
However, the high-throughput production of diverse protein libraries is only as powerful as
the ability with which to screen them. Modern advances in high-throughput screening
techniques allow libraries with an even greater number of members to be efficiently screened
in less time than ever before.
Therefore the general aim of this project is to integrate and demonstrate new high-throughput
methods of library generation and screening for a peptide that inhibits the binding of nerve
growth factor (NGF) to its receptor.
1.1. Site-Directed and Saturation Mutagenesis
Site-directed mutagenesis in its simplest form involves the substitution of one codon with
another one at specific single location. This usually involves the use of mutagenic primers
containing the three altered nucleotides that are then annealed to the wild type ssDNA and
subsequently incorporated. However, replacing a single codon with another one is a very
low-throughput and laborious process as only a single mutant is generated at a time.

17
Saturation mutagenesis on the other hand is a method in which a single codon is replaced to
encode all twenty amino acids, so creating a randomised library. This is hugely beneficial in
terms of protein engineering as many variants of single gene can be generated quickly
becoming a process that is truly high-throughput. Saturation mutagenesis has been used to
improve the activity and stability of enzymes (Siloto and Weselake, 2012, Valetti and Gilardi,
2013, Reetz, 2013), engineering the binding of antibodies (Sidhu and Kossiakoff, 2007) and
transcription factors (Pattanaik et al., 2010, Smith et al., 2013) as well as engineering
regulatory elements (Patwardhan et al., 2009) and ribosome binding sites (Wang et al.,
2009).
A number of techniques have been developed that allow further knowledge of the structure-
function relationship of proteins to be gained, which particularly target regions critical to
functionality. CASTing (combinatorial active site saturation test) is one such method that can
be used to identify important catalytic residues within the active site of an enzyme. This is
achieved by designing and generating small randomised libraries of enzyme mutants. Two
spatially close residues around the enzyme’s active site are randomised, which allows for
any conformational effects that may not result from a single mutation (Reetz et al., 2005).
The choice of positions to randomise is decided from analysis of the wild-type enzyme bound
to a substrate. Due to the fact that multiple positions are randomised at the same time, high
diversity is created and can be seen as a good alternative to error-prone PCR (Reetz et al.,
2006b). To highlight the effectiveness of this process, CASTing was used on a lipase from
Pseudomonas aeruginosa. Five pairs of interacting amino acids, critical to activity, were
identified. This data was used to generate five mutagenized libraries ultimately resulting eight
important hits that showed increased hydrolysis rates compared to the wild type enzyme
(Reetz et al., 2005).
A second such method is BFIT (B factor iterative test), which is designed to identify residues
involved in the stability of a protein (Reetz et al., 2006a). It was identified that the
thermostability of mesophilic enzymes was proportional to their rigidity. B factors (values)
were obtained in order to identify which positions at which to increase the enzymes’ rigidity.

18
Those residues with the highest B factors, reflecting the most flexible bonds, were then
chosen for saturation mutagenesis to form focussed libraries. The best gene was then used
for a second round of saturation mutagenesis at another site and subsequently focussed
through the remaining sites. This was applied lipase Lip A from Bacillus subtilis eventually
resulting in the screening of 8000 clones with significant increases in thermostability
observed (Reetz et al., 2006a, Reetz and Carballeira, 2007).
1.2. Degenerate Saturation Mutagenesis
Phosphoramidite chemistry is the industry standard for the synthesis of oligonucleotides.
This process involves adding nucleoside phosphates, one base at a time (in the 3’5’
direction) to a solid support and then exposing it to an acid/base to remove its protecting
groups which then allows the formation of a bond with a new nucleoside, added in solution.
This process is repeated to form an oligonucleotide. This chemistry can be used either to
make oligonucleotides with a single, specific sequence or to introduce randomised bases,
which can be introduced during oligonucleotide synthesis by using mixed pools of
nucleotides, rather than single nucleotides, at specific cycles during the synthesis process
(Derbyshire et al., 1986).
Traditionally, to generate such randomised libraries, a synthetic cassette containing codons
specified as NNN (where any combination of the four nucleotides is possible) is created
using chemical synthesis. That cassette is then inserted into the original gene. This is
relatively simple and creates large diversity that is only limited by the amount of positions that
can be randomised due the ability to screen the resulting libraries.
The genetic code has inherent redundancy as there are 64 (43) possible combinations of
nucleotides to encode only 20 amino acids. This degeneracy is not evenly represented
across the amino acids with six codons encoding the most common amino acids whilst only a
single codon encodes the least common (Figure 1.1). As multiple codons can encode the
same amino acid there can be large disparities between codon representations within

19
conventional methods of saturation mutagenesis as the number of codons targeted is
increased (Table 1.2). This in turn can lead to vast libraries, for example the full saturation of
10 amino acids would result in library with 1.024x10¹³ combinations (Kille et al., 2013), which
can increase pressure on later screening efforts. The presence of termination codons within
the genetic code also limits the quality of libraries generate using NNN as the percentage of
truncated sequences will increase as the number of saturated positions is increased (Table
1.3). The degeneracy of the genetic code also limits the number of positions that can be
randomised because of the ability to screen the resulting libraries.
Figure 1.1. The Genetic Code. All 64 possible combinations of nucleotides with their corresponding amino acids. Serine is used as an example of the most commonly occurring amino acids whilst tryptophan is used as an example of the least common amino acids.

20
1.3. Saturation Mutagenesis with Limited Degeneracy
1.3.1. NNK/S Saturation
In attempting to combat the issues observed with NNN saturation, it is possible to limit the
degeneracy using methods such as NNK/S. The NNK/S method relies on using
oligonucleotides that have limited degeneracy within the randomised codons. NNK/S, where
N=A, C, T or G, K=G or T and S=G or C, reduces the degeneracy by half (down to 32
possible codons rather than a 64 possible codons) whilst still encoding all 20 amino acids
(Reetz et al., 2008, Kille et al., 2013). Within this mix the ratio of the most common: least
common is reduced (Figure 1.2) although a bias is still present, which becomes more
significant the more positions that are randomised (section 1.5). Again, by limiting the codons
used, encoded truncation is reduced compared with NNN although it is still present (section
1.5) (Tang et al., 2012).
Figure 1.2. NNK Limited Genetic Code. The 32 combinations of nucleotides using NNK. Serine is used as an example of the most commonly occurring amino acids whilst tryptophan is used as an example of the least common amino acids.
21
1.3.2. 22-c Trick
The 22c-trick reduces the codon : amino acid ratio to 22:20 (Kille et al., 2013). This PCR-
based method is achieved for a single targeted residue by using a mix of 3 oligonucleotide
primers with one of each carrying an NDT (where N=A, T, C or G; D= A, G or T (12 codons)),
VHG (V= A, G or C; H= A, C or T (9 codons)) and a TGG codon. These in combination do
reduce the codon to amino acid ratio and also eliminate the presence of termination codons
but do still contain a redundant codon for both valine and leucine.
To analyse the effectiveness of the mutagenesis techniques, Leu426 of cyclohexanone
monooxygenase (CHMO) was targeted with both the 22c-trick and NNK. Although the initial
comparison of the 22c-trick to NNK was generally favourable, further mutagenesis studies of
genes encoding CHMO and phenylacteone monoxygenase (PAMO) showed poor saturation
with a high frequency of wild type bases in particular at the second and third positions (Kille
et al., 2013).
1.4. Non-degenerate Saturation Mutagenesis
Due to the inherent redundancy within the genetic code, various methods of non-degenerate
saturation have been devised, which aim to remove redundant codons altogether. These
tend to be either chemical or oligonucleotide-based approaches but all share the same
objectives of creating smaller, focused randomised libraries without redundancy. These key
methods are summarised in the following sections.
1.4.1. Chemical Approaches to Non-degeneracy
The core methodology of all chemical approaches to non-degenerate saturation involves the
use of either di- or tri-nucleotide phosphoramidite building blocks during oligonucleotide
synthesis. As the construction of trinucleotide phosphoramidites is stepwise process from the
original starting material via intermediate products to the final trinucleotide, it is of particular

22
importance to use suitable protecting groups. This allows selective deblocking functionality
required for the next reaction step whilst also conferring stability stable during the final
introduction of the phosphoramidite and throughout the following oligonucleotide synthesis.
1.4.1.1. Trinucleotide Phosphoramidites/Phosphotriesters
The use of trinucleotide phosphoramidites as a mutagenesis technique was first reported by
Sondek and Shortle (1992), who tested the coupling efficiency of two blocked and protected
trinucleotide phosphoramidites (dGCT and dGGT). Whilst increasing phosphoramidite
concentration gave increasing coupling efficiency, it was notable that even the highest
trinucleotide phosphoramidite concentration resulted in a coupling efficiency of only 4%
compared with 99% for the same concentration of monomer phosphoramidite (Sondek and
Shortle, 1992).
This principle was taken on further by Virnekas and co-workers, who employed a full set of
20 trinucleotide phosphoramidites, using two 3’-O-phenoxyacetyl (Pac) protected
mononucleotides and seven dinucleotides (Virnekas et al., 1994). The approach enabled the
synthesis of all 20 trinucleotides in the fewest possible coupling reactions, with a yield of 25-
40% of trinucleotide phosphoramidites achieved. In order to test the trinucleotide synthesis,
two sets of tetranucleotides were produced. The first used normal phosphoramidites whilst
the other used trinucleotide phosphoramidites to bind to a support thymine. No significant
difference was observed. The trinucleotides were subsequently used to make two primers for
the light chain of an antibody. Although sequencing showed that all trinucleotide
phosphoramidites had been incorporated correctly, uneven representation was observed. It
was concluded that there were varying coupling rates during synthesis, as the original
mixture of trinucleotide phosphoramidites were equally proportioned (Virnekas et al., 1994).
Two approaches attempted tried to overcome the issues associated with the 3’-OH-
protecting group. Replacement of Pac by tert-butyldimethylsilyl (TBDMS; Lyttle et al., 1995)
yielded by-products such as isometric trimers, at an average coupling efficiency of 71%,
although the final yield of oligonucleotide was low. Meanwhile Gaytan et al. (1998)

23
addressed the protecting group issue by using 9-fluorenylmethyl carbamate (Fmoc) for
protection of the 5’ and DMT (dimethoxytrityl) at the 3’-OH group of deoxyribose. Twenty
Fmoc proctected trinucleotide phosphoramidites were produced by combining five Fmoc-
protected dinucleotide phosphoramidites and four DMT-protected monomers (Gaytan et al.,
1998). These were incorporated into oligonucleotides and used to generate libraries of TEM-
1-β-lactamase variants, although subsequent sequence analysis of clones showed uneven
codon representation. As previously found by Virnekas et al (1994), this uneven codon
representation correlated with differing trinucleotide reactivity.
As an alternative to improve codon representation, Ono et al. (1995) developed a method
utilising phosphotriester chemistry where seven unprotected 3’-OH dimer precursors were
extended in the 3’ direction by coupling an N-acylated nucleoside to the 3’-OH. A coupling
efficiency of 90% was achieved for the final oligonucleotide synthesis using these
trinucleotides. This method also aimed to minimise the number of dimers needed for the
synthesis of trinucleotides for all 20 amino acids. Resulting anti-sense sequences were then
transformed into codons using template-mediated replication (Ono et al., 1995).
Clearly, different trimers exhibit different reaction rates. Therefore reaction factors (RFs)
were determined. By assigning each trinucleotide an RF value, where an RF of 1.0 relates to
the most reactive, and poorer reactivity is reflected in a higher RF value, it can be attempted
to compensate for different reaction rates (Kayushin et al., 1996). Thus, a trimer with an RF
value of 2.0 would be mixed at twice the concentration of one with an RF value of 1.0, in
order to obtain equal incorporation into an oligonucleotide. This method was subsequently
used to create two 12-codon libraries (Kayushin et al., 1999) though significant variations
between codon representation were still observed. The methodology was further developed
to allow the use of partially protected trimers with solid phase synthesis (Kayushin et al.,
2000). Here they were able to increase the yield of the phosphotriesters whilst allowing the
regeneration of the starting materials. However, further work from this group resulted in the
commercialisation of a set of twenty 5’ DMT-protected trinucleotide phosphoramidites (rather

24
than phosphotriesters) supplied by Glen Research Corporation (Gaytan et al., 2009,
Yagodkin et al., 2007).
1.4.1.2. Microarray-Based Methods
As technology has advanced, phosphoramidite chemistry has been fused with micro-array
methods to allow the parallel synthesis of short oligonucleotides. Many different methods
have been developed such as photolabile 5’ protecting groups (Nimblegen/Affymetrix), ink-jet
printing with standard reagents (Agilent), photo-generated acid deprotection (Atactic/Xeotron)
and electrolytic acid/base arrays (Oxamer/Combimatrix). Non-degenerate phosphoramidites
have also been combined with microarrays (Gen9) allowing the construction large non-
degenerate libraries, although these still suffer from the same problems as standard
phosphoramidite chemistry using a solid support. Microarrays are used to produce many
small oligonucleotides that are then joined to form larger oligonucleotides. If one
oligonucleotide contains a deletion (n-1) this problem can be potentially exacerbated
elongated with another n-1 oligonucleotide producing a longer n-2 oligonucleotide containing
two deletions.
1.4.1.3. Chemical Approaches - Summary
Regardless of specific methodology, a major issue associated with phosphoramidite
chemistry is the error rate during the chemical synthesis of oligonucleotides. This error rate
can be as high as 10-3 to 10-2 (Tian et al., 2004) compared with an error rates observed in
nature that can range for 10-8 to 10-7 (Schofield and Hsieh, 2003). Errors commonly occur
when new phosphoramidite monomers fail to couple. These are usually terminated from
growth by acetylation thus producing truncated oligonucleotides, however failure rates in
termination can be up to 0.5% per positon, which will in turn lead to deletion errors. Finally
insertion rates can be up to 0.4% per base as a result of DMT cleavage by excess activator
(Ma et al., 2012).

25
Another downfall of using chemical, trinucleotide-based approaches is the high cost
associated with this type of production which is therefore not practical for the majority of
laboratories. A number of other methods that do not involve such chemical synthesis have
been developed to address the issue of redundancy involved in saturation mutagenesis.
1.4.2. PCR-Based Methodologies
1.4.2.1. Small Intelligent Libraries
Similar to the 22c-trick, this method relies on using four primers, two containing NDT (where
N=A, T, C or G; D= A, G or T (12 codons)) and VMA degeneracies respectively (V= A, G or
C; M= A or C (6 codons)) and two containing single ATG and TGG codons (Tang et al.,
2012). This approach has the initial advantage over the 22c-trick in that it has a 1:1 codon to
amino acid ratio and removes all termination codons and was combined with primer design
software, DC-Analyzer, to assist with the design of small intelligent primers. The DC-
Analyzer software was further adapted to create MDC-Analyzer to aid the design of
degenerate primer sets in multiple contiguous sites (Tang et al., 2014).
However, like the problems faced with 22c-trick, the number of primers required to saturate
multiple residues in close proximity increase substantially for every targeted position (64-128
primers for 3 saturated positions) (section 1.5). Therefore again this method becomes
physically and financially impractical as more residues are targeted.
1.4.2.2. MAX Randomisation
MAX randomisation is another oligonucleotide based method of mutagenesis aimed at
removing the redundancy and bias found in randomised gene libraries. Instead of using all
possible combinations created from NNN, the target was to choose the twenty favoured
codons for expression of each amino acid in Escherichia Coli (E.Coli) (Nakamura et al.,
2000) without the use of complex chemistry techniques. This ensures that the ratio of codons

26
to amino acids is 1:1 no matter how many positions are randomised. It also in turn removes
redundant and termination codons from the process (Hughes et al., 2003). Codon bias
should also be addressed as there is only one codon for every amino acid so each should be
represented equally.
In this process twenty individually-synthesised “selection” oligonucleotides were hybridised to
a “template” oligonucleotide that has been conventionally randomised in certain areas. The
selection oligonucleotides have a conserved region that pairs with their complementary base
pair in the template sequence, which can also aid orientation to the correct alignment. Mis-
annealing between the sets of oligonucleotides is dealt with using a PCR step as only the
ligated selection strand is amplified (Figure 1.3). This method was illustrated by randomising
three contacting positions within a synthetic zinc finger (Hughes et al., 2003). This process
was also used to create sixty overlapping randomised gene libraries for zinc finger proteins
(Hughes et al., 2005).
Compared with other methods, MAX randomisation is relatively easy to implement, though
the process is limited by the fact that no more than two contiguous positions can be
randomised at a single attempt, owing to the requirement of conserved regions to align the
selection oligonucleotides with the template.

27
Figure 1.3. MAX Randomisation Schematic (taken from (Hughes et al., 2003)). A synthetic template oligonucleotide is made with appropriate codons randomised as NNN and invariant bases (represented as continuous lines) corresponding to the parental gene. For each randomised codon, 20 synthetic selection oligonucleotides, each comprising the appropriate complementary invariant region and a codon (the MAX codon) for optimal expression of a single amino acid, are hybridised with the template oligonucleotide. Base-pairing dictates that any single selection oligonucleotide will hybridise with its complement in the template. Selectional hybridisation generates a synthetic cassette for gene randomisation. Here, the template oligonucleotide contains three conventionally randomised codons. The invariant regions of the template are colour-coded to correspond with the complementary invariant regions of the appropriate selection oligonucleotides. Two additional, unique constant oligonucleotides are required in the hybridisation mixture to provide primer-binding and restriction sites at the ends of the cassette. Primer-binding sites are indicated by broken lines. Their location ensures that only the selection strand is amplified by PCR. The resulting DNA cassette is then digested with restriction enzymes, dephosphorylated (to prevent concatemerisation) and cloned.
1.4.2.3. Computational and Bioinformatics Library Design
Apart from these methods described previously, there are computational methods designed
to identify key functional residues in proteins. To generalise these can be broadly split into
methods such as 1. Sequence based statistical analysis; 2. Analysis based off topological
properties of native protein structure; 3.Molecular dynamics simulation. Sequence based

28
statistical methods, such a ConSurf 2005 (Landau et al., 2005), have proved highly
successful in identifying critical sites for protein function, where co-conservation of
evolutionarily conserved residues reflect functional coupling between them. In the case of
structure and topology analysis methods parameters of topological property networks,
derived from residue interaction networks formed by protein tertiary structures, are used to
highlight functionally important residues (del Sol et al., 2006). While these methods can
highlight important residues they give little information of the larger conformational changes,
unlike molecular dynamics simulations that are also designed to take this into account (Su et
al., 2011). Potential library size can be reduced and focussed using data-driven protein
engineering strategies. This is can be achieved in multiple ways such as; 1.by in silico
analysis of the potential fitness of recombinant proteins produced (SCHEMA), 2.Using
protein family sequence alignment to analyse changes amino acid pairs to predict
incompatibilities (FamClash), 3.Prediction of functional variants of a native protein by
analysing key amino acids in critical region (HotSpot wizard and Consurf-HSSP). This type of
analysis aids the rational design of libraries that can greatly reduce the size of the desired
library whilst keeping the quality of the sequences within it (Tang et al., 2014).
1.4.3. Sequential, Enzymatic Single Codon Additions
1.4.3.1. SlonomicsTM
Sloning Biotechnology describes a randomisation method based upon the addition of random
trinucleotides through a more molecular biology based method (Van den Brulle et al., 2008).
This method uses synthetic oligonucleotides that contain a self-complementary region,
causing them to form hairpins, and a three nucleotide overhang. The two types of
oligonucleotide used in this process are termed “splinkers” and “anchors”; where every
splinkers structure is the same apart from its overhang, and the anchors have the same
structure apart from the overhang and the three adjacent bases. The anchor oligonucleotide
also has a biotin modification within the hairpin thus allowing it to bind to a streptavidin-

29
coated surface. A combination of 4096 anchors and 64 splinkers can be used to create a
randomised library that covers all possible eventualities.
Initially a single anchor and splinker are ligated together using the complementary
overhangs, then using the biotin modification immobilised onto a streptavidin-coated plate.
Un-ligated material is washed away whilst ligated product remains bound, which is later
digested using the restriction endonuclease Eam1104I. This releases a product elongated by
three nucleotides that is then used as an acceptor for a new anchor oligonucleotide. This
process is repeated five more times to make an 18bp fragment (Van den Brulle et al., 2008).
This phase is termed the elongation phase. Many of these elongation reactions can be done
parallel creating many independent elongation products.
A second phase termed “transposition” involves releasing the elongation block with
Eam1104I and removing the splinker end of the product with Esp31. These can be
assembled in a pair wise method, which is highly specific due to the specific overhangs, to
form a longer fragment. This process can be repeated five times to create a fragment 462bp
in length (T1 produces a fragment of 32bp; T2 produces a fragment of 61bp; T3 produces a
fragment of 118bp; T4 produces a fragment of 233bp; T5 produces a fragment of 462bp).
SlonoMax® libraries also used the same methodology to allow non-degenerate codon
mutagenesis in the form of arrays and at separate locations. This allows control over codon
representation but is only made within the company and is not available for in-house use
within standard laboratories. Since the acquisition of Sloning Biotechnology by Morphosys in
2010 this service is only available under license.
1.4.3.2. ProxiMAX Randomisation
This process utilises synthetic oligonucleotides to donate specific codons at their termini, at a
non-degenerate ratio, to a conserved acceptor sequence via a blunt-ended ligation. This
ligation is amplified to provide enough working material to maintain diversity, purified and
then digested with type IIs restriction endonucleases. The use of type IIs restriction

30
endonucleases to cut down stream of their recognition site facilitates the removal of the
donator sequence whilst leaving randomised codon in place (Ashraf et al., 2013) (Figure
3.1). This process can be repeated to form an iterative cycle thus enabling the ability to
create a sequential array of randomised positions whilst keeping the inherent advantages of
a codon to amino acid ratio of 1:1. Different sets of donor oligonucleotides can be used per
cycle allow restriction of specific codons for each cycle. An advantage of this method is that
it not only allows the use of all 20 amino acids at a single position but also allows fine control
of the use of specific subsets of amino acids at controllable ratios for each. ProxiMAX
randomisation has been used for the saturation of 11 consecutive codons with the loop of
CDR3 loop of the variable heavy chain of an antibody (Ashraf et al., 2013) with good codon
representation observed for the most part. Further detail and indeed development of
ProxiMAX methodology is provided in Chapters 3 & 4.
1.5. Comparison of Saturation Mutagenesis Methods
Which approach to saturation mutagenesis is best? Key approaches must take into account
library size/diversity; codon bias; truncation caused by termination codons (all are directly
relevant to subsequent screening) and ease of application. The following paragraphs
compare key available approaches to saturation mutagenesis in these contexts.
1.5.1. Library Size/Diversity
Currently, the highest-capacity screening methodologies can handle libraries with a
maximum of 1014 components, whilst cloning limits (relating to phage display etc.) are around
1010 library components. Therefore saturation of multiple residues using degenerate
mutagenesis can quickly result in large libraries that exceed screening and/or cloning
capacity and as such, library size is a significant consideration when designing a saturated
library (Table 1.1).

31
No. of Saturated Codons
NNN NNK/S 22c-trick Non-
degenerate
2 4.10x10³ 1.02 x10³ 4.84 x10² 4.00 x10²
4 1.68 x10⁷ 1.05 x10⁶ 2.34 x10⁵ 1.60 x10⁵
6 6.87 x10¹⁰ 1.07 x10⁹ 1.13 x10⁸ 6.40 x10⁷
8 2.81 x10¹⁴ 1.10 x10¹² 5.49 x10¹⁰ 2.56 x10¹⁰
10 1.15 x10¹⁸ 1.13 x10¹⁵ 2.66 x10¹³ 1.02 x10¹³
Table 1.1. Library Size. Theoretical size of libraries generated using different saturation mutagenesis techniques. NNN=64, NNK/S= 32, 22c-trick=22 and non-degenerate=20 possible nucleotide combinations per saturated position.
Moreover, degeneracy of the genetic code has a great impact on diversity (a measure of the
percentage of unique sequences within a library). Randomisation using NNN at single
position starts with a potential library diversity of ~65% and rapidly falls as the number of
saturated positions increase despite reducing the degeneracy a similar trend is also
observed using NNK/S and even the 22c trick, which has just two degenerate codons. In
contrast, all non-degenerate methods maintain a theoretical 100% diversity, no matter how
many codons are saturated, such that library size then becomes the sole limiting factor when
designing the library (Figure 1.4).
Figure 1.4. Theoretical Library Diversity using Different Saturation Mutagenesis Methods (Ashraf et al., 2013). Diversity was calculated using the formula d = 1/(NΣkpk
2) (Makowski and Soares, 2003) and is in agreement for a 12-mer peptide saturated with codon NNN (Krumpe et al., 2007).
32
1.5.2. Codon Bias
Whilst increased screening capacity may help to nullify the effect of diversity for libraries with
more than three randomised codons, the screening process is again a limiting factor, since
all display screens assume an equal concentration of library components. However, the
interaction between proteins and ligands is not a linear relationship, as proteins in high
concentrations with relatively low affinity can saturate the ligands whilst those in low
concentrations, albeit with higher affinity, may not reach saturation binding levels (Hughes et
al., 2003). Thus, since both affinity and concentration affect the magnitude of detected
protein–ligand interactions (Ashraf et al., 2013), screening of biased protein libraries may
deliver misleading results in terms of optimal “hits”. Again, only non-degenerate saturation
has the potential to deliver unbiased libraries (Table 1.2).
Table 1.2. Encoded Bias (Ashraf et al., 2013). Ratios represent the theoretical relative concentrations of each individual gene combining any of the most common codons (leucine/arginine/serine, NNN/NNK; or leucine/valine, 22c trick) compared with each individual gene containing any combination of the rarest codons [methionine/tryptophan, NNN;cysteine/aspartate/glutamate/phenylalanine/histidine/isoleucine/lysine/methionine/asparagine/glutamine/tryptophan/ tyrosine, NNK; or 18 codons (omitting leucine/valine), 22c trick].
1.5.3. Encoded Truncation
Degenerate and limited degeneracy saturation methods both encode termination codons,
which lead to truncated proteins that are liable to be non-functional, but more seriously, can
cause aggregation (Ashraf et al., 2013) that will likely disrupt subsequent screening assays.
Again, with degenerate mutagenesis, the effect is magnified as the number of saturated

33
positions increase. Both the 22c trick and all non-degenerate methodologies avoid this
problem (Table 1.3).
Table 1.3. Encoded Truncation (Ashraf et al., 2013). Truncation is calculated as the percentage of sequences that contain one or more termination codons within the saturated region.
1.5.4. Practicality of Application
Whilst NNN and NNK degenerate / limited degeneracy approaches are experimentally facile,
as detailed in the preceding paragraphs, the libraries encoded by these methodologies have
numerous problems. The 22c trick and small intelligent libraries would appear to improve
many of those problems, but practicality becomes an issue when saturating multiple codons,
particularly where such codons are contiguous. For example, the number of primers required
rapidly increases if two or more residues in close vicinity are targeted using the 22c-trick (27-
54 primers are required to saturate 3 positions depending on whether or not both sense and
anti-sense primers are needed). Both the numbers and associated synthesis costs soon
become unmanageable practically if more residues need to be saturated. Slonomics™ also
has a high number of primers involved, though these are handled robotically and can be re-
used, as opposed to being specific to each library. In contrast, ProxiMAX would appear to be
a favourable compromise in terms of library quality versus complexity of use and again,
these primers can be re-used (Table 1.4).

34
No. of saturated codons
NNN/NNK/ Trinucleotide
phosphormaidites 22c-trick
Small intelligent libraries
Slonomics ProxiMAX
3
2-3
27-54 64-128
4160 64
6 729-1458 4096-8192
9 19683-39366
2.6-5.2x10⁶
12 5.3x10⁵-1.1x10⁶
1.7-3.4x10⁶
Table 1.4. Min/max no. of Primers to Saturate Contiguous Codons. NN/NNK/trinucleotide oligonucleotides may be used as a DNA cassette, or as primers in PCR-based mutagenesis; SlonomicsTM and ProxiMAX require a fixed number of oligonucleotides and the numbers of primers for the 22c trick and small-intelligent libraries were calculated using the formulae in the respective publications for saturating consecutive codons.
1.6. Screening Technologies
Whilst the ability to create high quality highly diverse libraries is critical, the ability to screen
the libraries shares equal importance as the choice of an inappropriate method can result in
a natural bottle-neck in the overall process. As the title of this project suggests, the focus is
not solely on creating a randomised library, but to combine both library generation and
screening to maximise the efficiency of this process thus increasing the likelihood of
developing novel peptides/proteins. In this case the ultimate goal of the thesis is to analyse
binding events, hence the approaches described in the following section will relate to this.
1.6.1. In vivo Cell-Dependent Display Systems
1.6.1.1. Phage Display
Phage display is the most commonly used method of screening and involves the use of
filamentous phage (Smith, 1985). Phage can be split into filamentous, such as M13 page, or
lytic bacteriophage, such as lambda (Beghetto and Gargano, 2011). DNA libraries are
engineered into specialist phage vectors (phagemids) where mutant DNA is fused to the coat
protein genes, normally PVIII or PIII in the case of filamentous phage or gpV/gpD for lambda
phage, allowing the display of foreign peptide after transcription/translation using the host

35
cellular machinery. Filamentous phage are assembled in the periplasmic space and
subsequently secreted making them ideal for the display of small peptides. On the other
hand, lambda phage, which are assembled in the cytoplasm prior to cell lysis, are used for
the display of larger proteins due to the sensitivity of their tertiary structure to the periplasmic
space. The peptide-phage coat protein fusion is subsequently screened using affinity based
selection, termed biopanning (Hoess, 2001). An immobilised target is incubated with the
phage library allowing binding of suitable targets. This is washed to remove non-specifically
bound phage and then enriched, usually by infection of the phage into bacteria and ensuing
re-growth. During the biopanning process selective pressures can be introduced to increase
the stringency in order to select subpopulations of peptides that best bind the target.
However, these conditions are important in order to select the best population as the
stringency needs to be high enough to isolate high affinity peptides without diminishing yield
(Smith, 1985).
Although phage display has been proven to be the most successful form of display due to its
robustness and stability, it does have some limitations as is the case with all cell-dependent
display methods. The foremost of these is that phage display can be a laborious and time
consuming procedure mainly due to the requirement of transformation in E.coli. As a result,
due to the inefficiencies of the transformation process the maximum size of a phage library is
approximately 1010 members although libraries of 1012 have been reported (Sidhu et al.,
2000). Some foreign proteins have been difficult to display, whilst larger proteins have also
had problems with display due to folding and secretion problems (Fernandez-Gacio et al.,
2003, Levin and Weiss, 2006).
1.6.1.2. Yeast and Bacterial Cell Surface Display
Both yeast and bacterial display use a similar system to that of phage display where the
required library DNA is fused to the coding sequence of a cell wall protein, leading to the
expression of the library on the cell surface (Samuelson et al., 2002, Ullman et al., 2011). In
the case of yeast surface display, the library can be fused to either α-agglutinin or flocculin

36
membrane proteins. Yeast display has the advantage of eukaryotic machinery allowing
display of mammalian proteins in a native-like state (Gai and Wittrup, 2007). With bacterial
cell surface display the peptide can be expressed in both gram-positive and gram-negative
bacteria in a fusion with membrane proteins or bacterial flagella (Bessette et al., 2004,
Daugherty, 2007). Once display on the surface the peptides can undergo biopanning against
a specific immobilised target or in conjunction with cell sorting methods (Rockberg et al.,
2008). However the disadvantages of these systems, like that of phage display, are that they
rely on transformation so can be laborious and time consuming, whilst affinity maturation can
be complicated by the number of other proteins expressed on the cell surface.
1.6.1.3. Baculovirus Display
Baculovirus display can be used to display peptide libraries either on the host cell surface or
on budding virions by utilizing the baculovirus to infect eukaryotic cells. The library is fused to
the major baculovirus envelope protein gp67 under the transcriptional control of the
polyhedron gene promoter (Makela and Oker-Blom, 2008). Cell surface expression can be
particularly beneficial for peptides that require post-translational modifications.
1.6.1.4. Lambda Repressor Display
In lambda repressor display both library peptides and target are fused to separate lambda
transcription repression monomers within a host cell. Interaction of the library and target
promotes dimerization of the monomers which represses transcription of the tof immediate-
early gene. As a result lysis of the host by the lambda phage is inhibited allowing
identification of target binding peptides (Hu et al., 1990).

37
1.6.2. In vitro Cell-Free Display Systems
All cell-free display mechanisms require some method to link the screened phenotype with
the encoded genotype. This link can be either covalent or non-covalent as discussed in the
following paragraphs.
1.6.2.1. Cell-Free Non-covalent Linkages
1.6.2.1.1. Ribosome Display
Ribosome display was originally developed using an E.coli cell lysate for the display of
peptides (Mattheakis et al., 1994). In this process a DNA library undergoes in vitro
transcription/translation where it is transcribed into RNA and subsequently translated using
the S30 ribosomal extract from E.coli. The ribosome stalls on the mRNA, due to the absence
of a termination codon normally required for ribosomal release, resulting in a complex
between the ribosome, with the nascent peptide bound, and the encoding mRNA (Mossner
and Pluckthun, 2001). This creates a physical linkage between the phenotype (protein) and
the genotype (genetic material coding the protein). A C-terminal spacer also prevents steric
hindrance from the ribosomal tunnel thus allowing the displayed peptide to fold correctly.
The complex is disrupted using EDTA and the released RNA is amplified using reverse-
transcription PCR. Ribosome display in both prokaryotic and eukaryotic systems have
successfully displayed antibody fragments (Mattheakis et al., 1994, Hanes and Pluckthun,
1997, He et al., 2007, He and Taussig, 1997, Hanes et al., 1999, He and Taussig, 2002) as
well as the selection of high affinity peptides (Zahnd et al., 2004) .
However, this system has a couple of major flaws such as its sensitivity to RNAse activity
and the stability of the mRNA-ribosome-peptide complex. The stability can be improved
using lowered temperatures, increased magnesium concentration and chloramphenicol to
halt the ribosome (Mattheakis et al., 1994) although these combined changes limit the
selective pressures that can be applied. The use of purified transcription and translation

38
components (PUREsystem (Shimizu et al., 2001, Shimizu et al., 2005)) was shown to
improve the recovery of mRNA 395-fold from the selection of an anti-IL-13 scFv.
1.6.2.1.2. CIS Display
CIS display utilises the ability of the bacterial replication initiator protein RepA to bind to
DNA. By fusing the peptide library to the RepA gene after in vitro transcription/translation, a
genotype-phenotype link is created with RepA-peptide fusion and its encoding DNA. Non-
binding peptides are washed away and the remaining DNA is eluted and amplified by PCR to
form a DNA library ready for the next round of selection. After several rounds of selection
recovered DNA is cloned for the identification of individual target binding peptide sequences
(Odegrip et al., 2004, Eldridge et al., 2009). The mechanisms of CIS display will be further
discussed in chapter 6 (Figure 6.1).
CIS display has successfully been used for the affinity selection of peptide ligands to DO1
and M2 antibodies as well as a non-antibody target lysozyme (Odegrip et al., 2004), with
comparable results to those using ribosome and mRNA display. DNA-based systems have
the advantage that they are considerably more resilient, than other selection systems, to
nucleases and can be generated quickly using normal PCR procedures. Unlike the tight
control of parameters that is normally required when using RNA-based display technologies,
simplified selection conditions such as no control of divalent cation concentration and the
complexes do not require incubation under sterile or ribonuclease-free conditions make
DNA-based systems straighter forward to carry out.
The stability of RepA–DNA complexes was demonstrated by incubating in vitro expressed C-
RepA with an anti-C antibody for 48 h before elution and recovery of associated DNA. No
reduction in DNA yield was observed compared with that obtained using standard selection
conditions (Odegrip et al., 2004). However it was stated the quality of the library DNA itself is
the most variable factor in the technology with the level of deletions and insertions varying
from 0-75% depending on the batch used.
39
1.6.2.1.3. STABLE Display
Streptavidin-biotin linkage in emulsion (STABLE) display requires each molecule of the DNA
library to be biotinylated whilst peptides are expressed as streptavidin fusions (Doi et al.,
2007). Due to the high affinity between streptavidin and biotin a genotype-phenotype link is
created although a capture of efficiency ~1% was reported. Photocleavage of a 2-nitro benzyl
linker between the DNA and biotin can aid elution of selected peptide-DNA complexes.
1.6.2.2. Cell-Free Covalent Linkages
1.6.2.2.1. mRNA Display
mRNA display is related to ribosome display, although it differs by to the formation of a
covalent link, via puromycin, between the template and protein.
Puromycin mimics amino-acyl tRNA thus covalently binding the nascent peptide as a result
of the peptiyl transferase activity of the ribosome (Nemoto et al., 1997, Roberts and Szostak,
1997). Puromycin enters the A site of the ribosome allowing the ribosome, via its peptidyl
transferase activity, to move the nascent peptide onto the O-methyl tyrosine of puromycin
thus covalently linking the library mRNA to its peptide. The RNA is stabilised by forming and
RNA/DNA hybrid by using the DNA primer that delivered the puromycin in a reverse
transcription step. An efficiency of 10-40% of protein/mRNA coupling has been reported
(Wilson et al., 2001, Takahashi et al., 2003, Millward et al., 2007). This has been used in the
incorporation of unnatural amino acids (Li et al., 2002) and probing tissue specific mRNA
libraries (Hammond et al., 2001). Once again the susceptibility to RNAse degradation can be
a limiting factor of mRNA display, although the screening ability of much larger libraries is
greater when compared with in vivo techniques requiring host cell transformation.

40
1.6.2.2.2. P2A System
The P2A system utilises the expression of the P2A bacteriophage replication initiation
protein. A covalent bond formed with the 5’ phosphate of its encoding strand is caused by a
catalytic tyrosine creating a single stranded nick at the viral origin of replication. A scFv can
be fused to the P2A protein thus creating a covalent genotype-phenotype link (Reiersen et
al., 2005). Enrichment rates of 14-300-fold have been reported when this system was used
to select for tetanus toxin binders, although mis-linking to different genotypes have caused
issues with panning results.
1.6.2.2.3. M.HaeIII System
A similar concept to that of the P2A system is the M.HaeIII system, which utilizes the
capacity of HaeIII methyltransferase to covalently link DNA. M.HaeIII forms a covalent bond
with a fluorinated GGFC recognition sequence fused to the library molecule, thus creating a
genotype-phenotype link (Bertschinger and Neri, 2004). However, the production of free
M.HaeII can cause non-specific binding to non-fluorinated recognition sequences in other
DNA molecules, thus reducing the efficiency of the process.
1.6.2.3. In vitro Compartmentalisation
In vitro compartmentalisation utilises water-in-oil emulsions to simulate the natural
compartments of an organism in order to trap DNA and in vitro transcription/translation
components (Tawfik and Griffiths, 1998). By precisely mixing mineral containing surfactants
in water femtolitre droplets with a 1μm diameter can be created, which contain single DNA
molecules from a library. By localising the DNA library molecule and expressed peptide the
fidelity of the genotype-phenotype link can be improved, although it important to minimise
compartment fusion during peptide expression as this can be limitation (Bertschinger and
Neri, 2004).

41
Figure 1.5. Library Display Methods Illustration (taken from (Baxter et al., 2014)). Library display for selection against a target in commonly used library display systems which make use of cellular expression of libraries (top panel) or in vitro cell-free expression (bottom panel). Target of interest, against which libraries are screened, is shown in pink. For the majority of display systems shown, the target is immobilized on a solid support (black dashed lines) via linker (green) and libraries are panned against it in vitro. Library-encoding DNA is shown as a yellow ribbon, or mRNA as a red ribbon, displayed peptide is shown as a light blue oval, with its target-binding site shown as a dark blue triangle. Linker molecules between displayed peptide and the molecule on which it is displayed are shown in grey. Cell walls are shown as yellow rectangles.

42
1.7. Peptides as Therapeutic Agents
Traditional therapeutic agents fall in to two distinct categories; small molecular weight
molecules <500 Da and larger biologics >5000 Da (Craik et al., 2013). Traditionally the use
of small molecules was limited to <500 Da in order to favour the bioavailability from oral
dosages. With the development of recombinant protein expression and improved protein
purification, proteins (>5000 Da), such as insulin and engineered antibodies, became
increasingly popular due to their potency and selectivity. The major advantage of highly
selective therapeutics is that they tend to greatly reduce non-specific side effects in
comparison with small molecules drugs. However due to their increased size and solubility
they are not suitable for oral delivery and are rather delivered by either injection or intranasal
routes.
With the development of genome screening/proteomics the number of protein-protein
interactions (PPIs) is becoming an increasingly important area with more than 320,000
hypothesised and ~39,000 experimentally confirmed (Baxter et al., 2014).
Peptides can potentially fill this 500-5000 Da gap in therapeutics. Peptides are common
within the natural world with the identification more than 7000 naturally occurring, ranging in
physiological roles from hormones, neurotransmitters, growth factors ion channels or
antimicrobial agents (Padhi et al., 2014, Buchwald et al., 2014, Giordano et al., 2014,
Robinson et al., 2014). Their larger sizes and secondary structures allow more interaction
with the target thus conferring increased specificity with fewer potential side effects when
compared to the small molecule drugs. There are more than one hundred peptide based
drugs currently on the market with the majority of them consisting of 8-10 amino acids
although the also go up to 45 amino acids long (Craik et al., 2013). Currently the majority of
peptides-based therapeutics are administered via injection although developments in peptide
modification, such as cyclization, N-Methylation and intramolecular hydrogen bonds, allows
the peptide to retain bioactivity while improve bioavailability to the extent where they are
becoming favourable as therapeutics for oral delivery (Diao and Meibohm, 2013).

43
Conventionally peptides have been unsuitable for oral delivery due acidic and enzymatic
degradation in the gastrointestinal tract.
1.8. Nerve Growth Factor (NGF)
Nerve growth factor (NGF), the target protein of the current study, was first described over 60
years ago by Levi-Montalcini & Hamburger (Levi-Montalcini and Hamburger, 1951) and is the
founding member of the neurotrophin family. The neurotrophin family plays a critical role in
controlling the development and survival of neuronal populations in the central and peripheral
nervous system (Snider, 1994, Aloe et al., 1997). Neurotrophins act upon two classes of
receptors; the high affinity Trk receptors, and the low affinity p75 neurotrophic receptor
(p75NTR) (Yano and Chao, 2000).
1.8.1. NGF Structure
The neurotrophin family, which includes brain-derived neurotrophic factors (BDNF),
neurotrophin-3 (NT-3), neurotrophin-4/5 (NT-4/5) and neurotrophin-6 (Nt-6), all share
sequence homology with approximately 50% conservation (Wiesmann and De Vos, 2001).
The NGF gene is located on human chromosome 1 (Edwards et al., 1988), and like most
other members of neurotrophin family, biologically active NGF consists of a homo-dimer of
two NGF monomers. The structure of NGF was shown to consist of a novel protein fold
(McDonald et al., 1991) where the monomeric form of NGF contains 2 pairs of anti-parallel β-
pleated strands with three loop structures at one end (Bradshaw et al., 1994) and a cysteine
knot at the other (Figure 1.6 ref (Wiesmann and De Vos, 2001)). The cysteine knot consists
of three disulfide bonds, two of which form a closed ring with the third disulfide bond
penetrating the ring. This confers stability to the molecule and has been found in other
dimeric growth factors, such as platelet-derived growth factor and transforming growth factor-
β, which do not share any other significant sequence homology with the neurotrophin family.
44
NGF, and the wider neurotrophin family, forms a parallel homo-dimer with an elongated core
formed by the central β sheets Figure 1.7 (Wiesmann and De Vos, 2001).
Figure 1.6. NGF Structure (taken from (Wiesmann and De Vos, 2001)). Ribbon diagram depicting the structure of the NGF monomer (PDB code 1BFT). The secondary structure elements are labelled and depicted according to McDonald et al. The termini as well as the loop regions, L1-L4, are labelled in red, and the cysteine residues forming the cysteine-knot motif near the top of the molecule are shown in grey and yellow in ball-and-stick rendering.
Figure 1.7. NGF Dimerization (taken from (Wiesmann and De Vos, 2001)). Ribbon diagrams of experimentally determined neurotrophin dimers. The secondary structure elements are depicted as determined with option ‘molauto’ in program Molscript 2 (Kraulis, 1991). All N and C termini are labelled; unlabelled ends arc due to disordered segments in the crystal structures. In all cases, the monomers dimerize in parallel fashion, positioning the N and C termini at the same end of the molecule (top in this figure). Loops important for p75NTR binding (L1, L3, L4) or Trk specificity (L2, L4) are labelled. NGF dimers (left: unbound NGF, PDB access code 1BET; right: NGF from the complex with the second Ig-like domain of its TrkA receptor, PDB access code 1WWW).

45
1.8.2. NGF Receptors
NGF acts upon two receptors; TrkA (part of the Trk family of receptor tyrosine kinases) and
p75NTR. The Trk family share sequence homology and generally consist of an cysteine rich
extracellular domain (domain 1), three leucine rich repeats (domain 2), another cysteine rich
cluster (domain 3) and two immunoglobulin (Ig)-like domains (domains 4 and 5) (Schneider
and Schweiger, 1991). The extracellular domain and intracellular kinase domain are linked
by a single transmembrane helix. A sequence homology of >75% is observed for the
intracellular kinase domain (Chao, 1992) whilst the extracellular domain show sequence
conservation of 50-55% (Lamballe et al., 1991). Domain 5 of the Trk family, which includes
the EF loop, shows the most highly conserved regions with 9, of 11, identical residues
(Ultsch et al., 1999). Whilst NGF is specific to TrkA, TrkB is the receptor for BDNF and NT-4
whereas TrkC is the receptor for NT-3 (Kaplan and Miller, 1997), although NT-3 does also
activate TrkA albeit at significantly higher concentrations than NGF.
There are two isoforms of TrkA that differ from one another by an additional 6 amino acids
near the transmembrane domain in their extracellular domain, with the additional insert
appearing to relax TrkA specificity resulting in enhanced NT-3 mediated signaling (Clary and
Reichardt, 1994). NGF-TrkA binding results in autophosporylation that can lead to
phosphorylation-dependent recruitment sites for adaptor molecules and enzymes that
mediate cytosolic/endosomal pathways such as the Ras-mitogen activated protein kinase
(MAPK), extracellular signal-regulated kinase (ETK), phosphatidylinositol 3-kinase (PI3K)-Akt
and Phospholipase C (PLC)-γ (Aloe et al., 2012).
The second receptor for NGF is p75NTR, which is as transmembrane glycoprotein that shows
equivalent binding to all members of the neurotrophin family at approximately nanomolar
levels (Hallböök et al., 1991). The cytoplasmic domain of p75NTR contains a death domain,
consisting of six α helices, that shares sequence homology to those found in other apoptosis
inducing factors. The extracellular domain of p75NTR contains four cysteine rich domains that
is consistent to the tumor necrosis factor receptor family (Iacaruso et al., 2011). These
receptors tend to have a variable number of cysteine rich repeats containing three disulfide
46
bonds, which when in complex with their ligand they bind along a groove formed by two of
their subunits (Naismith and Sprang, 1998). The cell mediated effect of NGF-p75NTR binding
is dependent on the presence or absence of TrkA. If TrkA is not present, NGF-p75NTR binding
will lead to apoptosis (Frade et al., 1996) whereas NGF- p75NTR binding in the presence of
TrkA will increase the binding affinity of NGF to TrkA which in turn promotes survival
(Meldolesi et al., 2000).
1.8.3. NGF-Receptor Interaction
NGF engages the second Ig-like domain (domain 5) of TrkA through two distinct patches.
The crystal structure of NGF-TrkA-d5 was described by Wiesmann et al. (Wiesmann et al.,
1999) and showed that the NGF dimer bound to two copies of TrkA domain 5 through its
central β sheet region (Figure 1.8). TrkA-d5 contacts NGF through its C-terminal pole with
the cysteine knot, N and C termini at the top of the molecule, leaving the residues important
in the binding of p75NTR exposed. This backs up the hypothesis that NGF can bind TrkA and
p75NTR simultaneously. As mentioned above, two distinct patches termed the ‘specificity
patch’ and the ‘conserved patch’ are required for NGF-TrkA binding, and consist of the N-
terminus of NGF in contact with the ABED sheet of TrkA-d5 and residues from the central β
sheet of NGF and loops AB, C’D and EF of TrkA-d5 respectively (Wiesmann et al., 1999).
The ‘specificity patch’ shows low sequence homology with other neurotrophins and is thought
to be specific for NGF-TrkA, whereas the ‘conserved patch’ features conserved residues in
comparison with other neurotrophin and Trk receptors.
In its unbound state the residues involved in the ‘specificity patch’ are disordered, however
when bound to TrkA these residues at the N-terminal of each NGF monomer form a short
segment of helix that packs against the receptor. The sidechain of Ile6, the central
hydrophobic residue in the patch, penetrates into a hydrophobic pocket of the ABED sheet
and at the bottom of the pocket is a solvent exposed free domain of a disulfide bridge. This
disulfide is conserved across all Trk receptors, however in TrkB this pocket is more
hydrophilic whilst in TrkC the pocket is absent completely (Ultsch et al., 1999). The

47
importance of this patch for the activity of NGF is demonstrated by the removal of 10
residues from NGF causing a 300-fold drop in TrkA affinity (Kahle et al., 1992), whilst a 9-fold
decrease in TrkA affinity is caused the truncation of the first five N-terminal residues (Shih et
al., 1994).
Unlike the ‘specificity patch’, the ‘conserved patch’ involves residues from both NGF
subunits, which are in contact with the AB, C’D, and EF loops at the C-terminal pole of TrkA-
d5 (Wiesmann et al., 1999). The patch is formed by the NGF surface residues Trp21, Ile32,
Phe54 and Phe86, whose sidechains pack against residues in the EF loop of TrkA.
Figure 1.8. NGF-TrkA-d5 Structure (taken from (Wiesmann et al., 1999)). Overall structure of the complex. a, b, Two orientations related by a rotation of 90° about the horizontal axis. The NGF monomers are red and blue; TrkA-d5 is green. The termini, some relevant loops and the secondary structure elements are labelled. In a, loops L2 and L4 of NGF and the C-terminus of TrkA-d5 (residue 382) point towards the membrane.
The binding site of NGF to p75NTR has been interpreted from binding studies using
neurotrophin mutants. As a result of these studies, two spatially distinct regions have been
identified on the surface of NGF. The first of these regions involves residues from the L3 loop
and C-terminal tail of NGF and is mainly composed of residues with a positive charge. The

48
identification of this patch was the result of alanine scanning experiments on NT-3 resulted in
a 100-fold decrease in p75NTR affinity (Urfer et al., 1994, Rydén and Ibáñez, 1997).
The second patch involved in NGF binding of p75NTR is formed from positively charged
residues from L1 and L4 loops. Alanine substitution of Lys32 Lys34 or Lys95 in NGF resulted
in a significant decrease p75NTR affinity (Ibáñez et al., 1992) whilst triple alanine substitutions
of Lys32 Lys34 or Glu35 showed no reduction in TrkA binding (Rydén et al., 1997).
1.8.4. Clinical Use of Anti-NGF Therapy
NGF-TrkA binding on nociceptive neurons activates phospholipase C which results in
sensitisation of TRPV1, a non-selective ligand-gated channel that generates the action
potential resulting in pain signal transmission (Winston et al., 2001, Ji et al., 2002). NGF also
increases TRPV1 expression and its trafficking to the plasma membrane (Ji et al., 2002,
Stein et al., 2006).
Increased levels of NGF have been implicated in a number of pain states, including
inflammatory and neuropathic pain states (Sevcik et al., 2005), neurogenic overactive
bladder and interstitial cystitis (Lowe et al., 1997, Oddiah et al., 1998), prostatitis (Miller et al.,
2002), asthma (Watson et al., 2006) and cancer-induced bone pain (Jimenez-Andrade et al.,
2011). The most common intervention strategies to date in this area involve blocking the
NGF molecule, so preventing its association with TrkA. To this end, an anti-TrkA monoclonal
antibody was shown to inhibit the perception of pain in both inflammatory and neuropathic
pain models (Ugolini et al., 2007).
The administration anti-NGF antibodies has also shown good analgesic effect in a number of
animal models for human disease, such as fracture pain (Koewler et al., 2007), cancer pain
(Mantyh et al., 2010), pancreatic pain (Zhu et al., 2011) and arthritic joint pain (Ghilardi et al.,
2012). Of these anti-NGF antibodies, Tanzeumab has probably been the most successful. It
is a humanized IgG2 monoclonal antibody that binds with high affinity and specificity to NGF
(Abdiche et al., 2008), and is now used as a treatment for osteoarthritis.

49
The development of novel anti-NGF peptides, as an alternative to antibody therapy, to inhibit
the the NGF/TrkA interaction would be an extremely useful addition to the existing arsenal of
pain-modulating therapies and is thus the ultimate target of this study.
1.9. Project Outline
Therefore, this project aims to combine optimised peptide library generation (using ProxiMAX
randomisation) with CIS display to produce and screen a randomised library based on two
anti-NGF peptides, which bind NGF, previously-developed by Isogenica Ltd. Isogenica’s
original anti-NGF peptides were hypothesised to have a helical structure and to dimerize
through cysteine residues present at their C-termini. To further develop these peptides, this
project aimed to develop high affinity monomeric (rather than dimeric) peptide(s) based
around the same binding motif. The binding affinity of the selected peptides would then be
screened (CIS display) using NGF-binding as the selection criterion with the hypothesis that
NGF-binding might inhibit the NGF-TrkA interaction in a manner analogous to that of the
antibody Tanzeumab. This hypothesis was tested by assessing the peptide’(s) ability to
disrupt the NGF-TrkA interaction using an NGF-TrkA inhibition ELISA.

50
Chapter 2
Materials and Methods
51
2. Chapter 2: Materials and Methods
2.1. Materials
2.1.1. Media Recipes
2.1.1.1. Antibiotic selective LB agar
LB Broth Powder (Sigma-Aldrich) 2% w/v
Bacto Agar (DIFCO) 2% w/v
Dry ingredients were dissolved in ddH2O and sterilised by autoclaving at 121°C for 20
minutes. Solutions were left to cool to approximately 50°C and 50-100 μg/ml sterile antibiotic
solution was added as required.
2.1.2. Broth Recipes
2.1.2.1. LB
LB Broth Powder (Sigma-Aldrich) 2% w/v
Powder was dissolved in ddH2O and sterilised by autoclaving at 121°C for 20 minutes. It was
left to cool to approximately 50°C and 50-100 μg/ml sterile antibiotic solution was added as
required.
2.1.2.2. 2TY
2TY Powder (Invitrogen) 3.1% w/v
Glucose 2% w/v

52
Powder was dissolved in ddH2O and sterilised by autoclaving at 121°C for 20 minutes. It was
left to cool to approximately 50°C and 50-100 μg/ml sterile antibiotic solution was added as
required.
2.1.2.3. S.O.C Medium (Invitrogen)
Tryptone 2% w/v
Yeast Extract 0.5% w/v
NaCl 0.01 M
KCl 0.0025 M
MgCl2 0.01 M
MgSO4 0.01 M
Glucose 0.02 M
2.1.3. Buffer Recipes
2.1.3.1. TBE (1x)
Tris(hydroxymethyl)aminomethane 0.089 M
Boric Acid 0.089 M
EDTA solution (pH 8.0) 0.002 M
2.1.3.2. TAE (1x)
Tris(hydroxymethyl)aminomethane 0.04 M
Glacial acetic acid 0.04 M
EDTA solution (pH 8.0) 0.001 M
2.1.3.3. SDS Tris-Glycine Running Buffer (1x)
Tris base 0.025 M
Glycine 0.192 M

53
Sodium dodecyl sulfate 0.1% w/v
2.1.3.4. NuPAGE® MES SDS Running Buffer (1x) pH 7.3
2-(N-morpholino)ethanesulfonic acid 0.05 M
Tris base 0.05 M
Sodium dodecyl sulfate 0.1% w/v
EDTA 0.01 M
2.1.3.5. Blue/orange Loading Buffer
Orange g 0.4%
Bromophenol blue 0.03%
Xylene cyanol FF 0.03%
Ficoll® 400 15%
Tris-HCl (pH 7.5) 0.01 M
EDTA (pH 8.0) 0.05 M
2.1.3.6. Bromophenol Blue Loading Dye
Tris-HCl (pH 7.6) 0.01 M
Bromophenol Blue 0.03%
Xylene cyanol FF 0.03%
Glycerol 60%
EDTA 0.06 M
2.1.3.7. NEB 6x Gel Loading Dye, Blue
Ficoll® 400 15%
EDTA 0.066 M
Tris-HCl (pH 8.0) 0.0198 M
SDS 0.102%
Bromophenol Blue 0.09%

54
2.1.3.8. SDS-PAGE Sample Buffer (1x)
Tris-HCl (pH 6.8) 0.0625 M
Glycerol (100%) 10% v/v
Β-mercaptoethanol 2% v/v
Bromophenol Blue 0.1% w/v
Sodium dodecyl sulfate 2% w/v
2.1.3.9. TE Buffer
Tris-HCl (pH 7.5) 0.01 M
EDTA (pH 8.0) 0.001 M
2.1.3.10. NEB T4 DNA Ligase Buffer (1x)
Tris-HCl (pH 7.5) 0.05 M
MgCL2 0.01 M
Dithiothreitol 0.01 M
ATP 0.001M
2.1.3.11. Thermo Scientific Ligase Buffer (1x)
Tris-HCl 0.04 M
MgCl2 0.01 M
Dithiothreitol 0.01 M
ATP 0.0005 M
2.1.3.12. NEB Taq DNA Polymerase Buffer (1x)
Tris-HCL 0.01 M
KCl 0.05 M

55
MgCl2 0.0015 M
2.1.3.13. NEB ThermoPol Buffer (1x)
Tris-HCl 0.02 M
(NH4)2SO4 0.01 M
KCl 0.01 M
MgSO4 0.002 M
Triton®X-100 0.1% v/v
pH 8.8 at 25°C
2.1.3.14. Promega Pfu Polymerase Buffer (1x)
Tris-HCl (pH 8.8) 0.02 M
KCl 0.01 M
(NH4)2SO4 0.01 M
MgSO4 0.002 M
Triton®X-100 0.1%
BSA 0.1 mg/ml
2.1.3.15. Thermo Scientific Pfu Buffer
Tris-HCl (pH 8.8) 0.2 M
(NH4)SO4 0.1 M
KCl 0.1 M
BSA 1 mg/ml
Triton X-100 1% (v/v)
2.1.3.16. NEB Buffer 2 (1x)
Tis-HCl (pH 7.5) 0.01 M
NaCl 0.05 M

56
MgCl2 0.01 M
Dithiothreitol 0.001 M
2.1.3.17. NEB Buffer 4 (1x)
Potassium acetate 0.005 M
Tris-acetate 0.002 M
Magnesium acetate 0.001 M
Dithiothreitol 0.0001 M
2.1.3.18. NEB T4 PNK Buffer (1x)
Tris-HCl (pH 7.6) 0.07 M
MgCl2 0.01 M
Dithiothreitol 0.0005 M
2.1.3.19. Antarctic Phosphatase Buffer (1x)
Bis-Tris-Propane-HCl 0.05 M
MgCl2 0.0010 M
ZnCl2 0.0001 M
2.1.3.20. Protein Expression and Purification Buffers
2.1.3.20.1. Lysis Buffer (pH 8.0)
NaH2PO4 0.05 M
NaCl 0.3 M
Imidazole 0.01 M

57
2.1.3.20.2. Denaturing Lysis Buffer (pH 8.0)
Urea 8 M
NaH2PO4 0.1 M
Tris-HCl 0.01 M
β-Mercaptoethanol 0.005 M
2.1.3.20.3. Native Column Wash Buffer (pH 8.0)
NaH2PO4 0.05 M
NaCl 0.3 M
Imidazole 0.02 M
2.1.3.20.4. Native Column Elution Buffer (pH 8.0)
NaH2PO4 0.05 M
NaCl 0.3 M
Imidazole 0.25 M
2.1.3.20.5. Denaturing Column Wash Buffer (pH 6.3)
Urea 8 M
NaH2PO4 0.1 M
Tris-HCl 0.01 M
β-Mercaptoethanol 0.005 M
2.1.3.20.6. Denaturing Column Elution Buffer 1 (pH 5.9)
Urea 8 M
NaH2PO4 0.1 M
Tris-HCl 0.01 M
β-Mercaptoethanol 0.005 M

58
2.1.3.20.7. Denaturing Column Elution Buffer 2 (pH 4.5)
Urea 8 M
NaH2PO4 0.1 M
Tris-HCl 0.01 M
β-Mercaptoethanol 0.005 M
2.1.3.20.8. Solubilsation Buffer (pH8.0)
Urea 8 M
NaH2PO4 0.1 M
Tris-HCl 0.01 M
β-Mercaptoethanol 0.005 M
2.1.3.20.9. Refolding buffer
NaH2PO4 0.1 M
L-Argenine 0.1 M
Glutathione (reduced) 0.005 M
Glutathione (oxidised) 0.0005 M
2.1.3.20.10. Native Dilution Elution Buffer (pH 8.0)
NaH2PO4 0.05 M
NaCl 0.3 M
2.1.3.20.11. SUMO Protease –Salt (1x)
Tris-HCl (pH8.0) 0.05 M
Igepal (NP-40) 0.2% v/v
Dithiothreitol 0.001 M
59
2.1.4. Other Solutions
2.1.4.1. Thermo Scientific PEG 4000 Solution
Polyethylene glycol 50% w/v
2.1.4.2. ATP
ATP solutions were prepared using 100 mM stock solution (Bioline) and sterile double
distilled H2O.
2.1.4.3. dNTPs
dNTP solutions were prepared using 100 mM stock solution (Bioline) and sterile double
distilled H2O and then mixed at an equimolar concentration.
2.1.4.4. X-Gal (5-Bromo-4-Chloro-3 indolyl-β-D-galactopyranoside)
X-Gal (5-Bromo-4-Chloro-3 indolyl-β-D-galactopyranoside) was as purchased a 50 mg/ml
solution in DMF from Promega (UK). This was diluted down with DMF to a concentration of
20 mg/ml and subsequently stored at -20°C.
2.1.4.5. Ampicillin Solution
Stock solutions with a final concentration 50 mg/ml were prepared using ampicillin sodium
salt (Sigma-Aldrich-Aldrich) and double distilled water. It was filter sterilised and stored at -
20°C.

60
2.1.4.6. Kanamycin Solution
Stock solutions with a final concentration 50 mg/ml were prepared using ampicillin sodium
salt (Sigma-Aldrich) and double distilled water. It was filter sterilised and stored at -20°C.
2.1.4.7. IPTG (Isopropyl β-D-1-thiogalactopyranoside)
IPTG was dissolved in ddH2O to make a final concentration of 1 M. It was filter sterilised and
stored at -20°C.
2.1.4.8. Lysozyme (Thermo Scientific)
Lysozyme 0.2 mg/ml
Lysozyme (Thermo Scientific) was reconstituted in double distilled water to a concentration of 0.2 mg/ml
2.1.4.9. 10% Ammonium Persulfate
Ammonium Persulfate (Sigma-Aldrich) 10% w/v
2.1.4.10. 20% Sodium Dodecyl Sulfate
Sodium Dodecyl Sulfate (Sigma-Aldrich) 20% w/v
2.1.4.11. CaCl2 Solution
CaCl2 stock solution was dissolved ddH2O to make a final concentration of 1 M and sterilised
by autoclaving.

61
2.1.5. Cell Lines
2.1.5.1. E.coli DH5α Genotype
(F- Φ80lacZ∆M15 ∆(lacZYA-argF) U169 recA1 endA1 hsdR17 (rk-, mk+) phoA supE44 λ- thi-
1 gyrA96 relA1).
2.1.5.2. One Shot® Mach1™-T1R Genotype
F- Φ80lacZΔM15 ΔlacΧ74 hsdR(rK- mK +) ΔrecA1398 endA1 tonA
2.1.5.3. E.coli SHuffle® Genotype
F´ lac, pro, lacIQ / Δ(ara-leu)7697 araD139 fhuA2 lacZ::T7 gene1 Δ(phoA)PvuII phoR ahpC*
galE (or U) galK λatt::pNEB3-r1-cDsbC (SpecR, lacIq) ΔtrxB rpsL150(StrR) Δgor Δ(malF)3)
2.1.5.4. E.coli BL21 (DE3) Genotype
F- ompT hsdSB (rB-mB-) gal dcm (DE3)
2.1.5.5. E.coli TG1
F’[traD36 lacIq ∆(lacZ) M15 proA+B+] glnV (supE) thi-1 ∆(mcrB-hsdSM)5 (rK- mK
- McrB-) thi
∆(lac-proAB)
2.1.6. Vectors
2.1.6.1. SmaI-phosphatased pUC19
SmaI-phophatased pUC19 was purchased from Thermo Scientific (formerly Fermentas).

62
2.1.6.2. pJ434-NGF_optEc
The plasmid pJ434 containing the synthetic gene for NGF expression, optimised for
expression in E.coli, was purchased from DNA 2.0.
2.1.6.3. pET SUMO
The plasmid pET SUMO was purchased from Invitrogen as part of the Champion™ pET
SUMO Expression System.
2.2. Methods
2.2.1. Enzyme Dependent Reactions
2.2.1.1. Phosphorylation Reactions
Unless otherwise stated, phosphorylation reactions were carried out in 1x PNK buffer
(2.1.3.18), 1 mM ATP (2.1.4.2), with 5 units T4 PNK (NEB) and up to 300 pmol of DNA. The
reaction was incubated at 37°C for 30 minutes and the enzyme was then heat inactivated at
65°C for 20 minutes.
2.2.1.2. Filling-in Reactions
Unless otherwise stated ligation reactions were carried out in 1x NEB buffer 2 (2.1.3.16) with
5 units DNA Polymerase I, Large (Klenow) Fragment (NEB), 1 mM dNTPs. This reaction was
incubated at 37°C for 30 min followed by 65°C for 20 min.

63
2.2.1.3. Ligations
Unless otherwise stated ligation reactions were carried out in 1x ligase buffer (2.1.3.10 or
2.1.3.11) with 1 unit of T4 DNA ligase (NEB or Thermo Sicentific) in 20 μl volumes. These
contained 50-100 ng of the appropriate vector and 3-fold molar excess of insert DNA.
Cohesive end ligations were incubated at 22°C for 15-120 minutes, whilst 16°C for 12-16
hours was used for blunt ended ligations. The enzyme was then heat inactivated at 65°C for
10 minutes.
2.2.1.4. Polymerase Chain Reaction (PCR) Reactions
Unless otherwise stated, PCR reactions were carried out in 1x appropriate buffer
(2.1.3.122.1.3.13), 100 μM dNTPs (2.1.4.3), 1.5 mM MgCl2 (if not in the PCR buffer), the
appropriate forward and reverse primers (Eurofins Genomics) and 1 pg - 1 ng of DNA.
Enzyme concentrations varied depending on the manufacturers recommendations. PCR
reactions were carried out under a standard PCR cycle 30 cycles of (95°C, 30s; 55°C, 30s;
72°C, 1 min).
2.2.1.5. Restriction Digest Reactions
Unless otherwise stated restriction digests were performed in 1x appropriated buffer
(2.1.3.16 or 2.1.3.17) and, if required, supplemented with BSA to a final concentration of 0.1
μg/ μl to prevent enzyme star activity. DNA and enzyme concentrations varied depending on
the manufacturers recommendations.

64
2.2.1.6. Dephosphorylation Reactions
Dephosphorylation reactions were performed using 1x antarctic phosphatase buffer
(2.1.3.19) with 1-5 μg of DNA and 5 units of Antarctic Phosphatase. This was incubated at
37°C for 15 minutes and heat inactivated at 70°C for 5 minutes.
2.2.2. ProxiMAX Procedure
2.2.2.1. Original Oligonucleotide Hybridisation
Complementary pairs of ‘MAX’ oligonucleotides (Table 2.1and Table 2.2; MAXR1 – MAXR6
and MAXRC) and base sequences (synthesised by Eurofins Genomics) were mixed together,
at 10 µM final individual concentrations in H2O. These were then hybridised by incubating at
94°C for 5 minutes followed by cooling at 1°C per min to 4°C. The concentration of the
hybridised oligonucleotides was then measured using the PicoGreen® assay (Life
technologies) and the concentration adjusted to 1 µM.
Oligo Name Sequence
Base 5’-PHO-ATCCGATCCTAGTGTATTCTTCGCTGTTCTCTGACTGAT-3’
BaseRC 5’-ATCAGTCAGAGAACAGCGAAGAATACACTAGGATCGGAT-3’
MAX Fwd R1 5’-GTGCTACGATGTCATTGCGAGTCACGTAMAX-3’
MAX Fwd R2 5’-AGGTAGATCAGTGACACGGAGTCACGTAMAX-3’
MAX Fwd R3 5’-ACAGAACAGGCACTTAGGGAGTCACGTAMAX-3’
MAX Fwd R4 5’-GATCTCACAGTCAGATGGGAGTCACGTAMAX-3’
MAX Fwd R5 5’-TTCGACAGTAGCATCTCGGAGTCACGTAMAX-3’
MAX Fwd R6 5’-ATCGACCGTAACTTGAGCGAGTCACGTAMAX-3’
MAXRC 5’-(MAX)RCTACGTGACTC-3’
Base (rev) primer 5’-ATCAGTCAGAGAACAGCG-3’
Primer 1 5’-GTGCTACGATGTCATTGC-3’
Primer 2 5’-AGGTAGATCAGTGACACG-3’
Primer 3 5’-ACAGAACAGGCACTTAGG-3’
Primer 4 5’-GATCTCACAGTCAGATGG-3’
Primer 5 5’-TTCGACAGTAGCATCTCG-3’
Primer 6 5’-ATCGACCGTAACTTGAGC-3’
Table 2.1. Single Reaction Ligation MAX Oligonucleotide Sequences. Sequences for the forward and reverse MAX oligonucleotides, base oligonucleotides and the appropriate cycle primers. The annotation ‘MAX’ refers to the randomised MAX codons whose sequences are highlighted in Table 2.3.

65
Oligo Name Sequence
Base 5’ PHO- CATAGATCCAGCCATCGCACAGTCTAGTACGCCTCAAACTCT
CATCCCGACCATCGCACAGTCTACATT-3’
BaseRC 5’-AATGTAGACTGTGCGATGGTCGGGATGAGAGTTTGAGGCGTACTAGA
CTGTGCGATGGCTGGATCTATG-3’
MAX Fwd R1 5’-GGTCGCAATACAGTAACGGAGTCGTCATMAX-3’
MAX Fwd R2 5’-AGGTCAGACATCGGTGCGGAGTCGTCATMAX-3’
MAX Fwd R3 5’-GCCACTTCCGATTACGCCGAGTCGTCATMAX-3’
MAX Fwd R4 5’-TCACCAATGAGTTGCCTGGAGTCGTCATMAX-3’
MAX Fwd R5 5’-TACACCTGAGCGATAAGCGAGTCGTCATMAX-3’
MAX Fwd R6 5’-CATTCTGTGATCTCTGCCGAGTCGTCATMAX-3’
MAXRC 5’-(MAX)RCATGACGACTC-3’
Base (rev) primer 5’-AATGTAGACTGTGCGATG-3’
Fwd Primer1 5’-GGTCGCAATACAGTAACG-3’
Fwd Primer2 5’-AGGTCAGACATCGGTGCG-3’
Fwd Primer3 5’-GCCACTTCCGATTACGCC-3’
Fwd Primer4 5’-TCACCAATGAGTTGCCTG-3’
Fwd Primer5 5’-TACACCTGAGCGATAAGC-3’
Fwd Primer6 5’-CATTCTGTGATCTCTGCC-3’
Table 2.2 Re-designed Single Reaction Ligation MAX Oligonucleotide Sequences. Re-designed sequences for the forward and reverse MAX oligonucleotides, base oligonucleotides and the appropriate cycle primers. The annotation ‘MAX’ refers to the randomised MAX codons whose sequences are highlighted in Table 2.3.
Codon Sequence
A GCG
C TGC
D GAC
E GAA
F TTT
G GGC
H CAT
I ATT
K AAA
L TTA
M ATG
N AAC
P CCG
Q CAG
R CGT
S TCT
T ACC
V GTG
W TGG
Y TAT
Table 2.3 Single Reaction Ligation Library MAX Codon Identity. Identity of the MAX codons located at the 3’ end of the MAX oligonucleotide used for the single reaction ligation library.

66
2.2.2.2. PicoGreen® Assay
Where dsDNA concentration was assessed, the concentration of each oligonucleotide pair
was measured in triplicate, against λ DNA standards, using PicoGreen® reagent (Life
technologies). Lambda DNA was diluted 300x in TE buffer (2.1.3.9) to a concentration of
1ng/µl, and subsequently serially diluted down to 0.2 ng/µl. A sample of each oligonucleotide
was diluted 50x, and Picogreen reagent 200x with TE buffer (2.1.3.9). Diluted oligonucleotide
(45 µl) was mixed with 45 µl of diluted picogreen reagent and applied to a 96 well plate in
triplicate. Fluorescence was measured on a SpectraMAX Gemini EM microplate fluorimeter
(Molecular Devices), with excitation and emission wavelengths of 480 nm and 520 nm
respectively. Concentrations of dsDNA were calculated using the linear regression formula
generated from the standard curve.
2.2.2.3. Oligonucleotide Sequencing
To ensure that the sequences were correct and that the MAX codons were intact, a sample
of oligonucleotides were sequenced. Samples of the oligonucleotides were phosphorylated
and blunt-ended in a 50 µl reaction containing; 25 µl hybridised oligonucleotide, 1 mM
dNTPs, 10 mM ATP, 10 x PNK buffer, 5 units Klenow fragment (NEB), and 5 units T4
Polynucleotide Kinase (NEB) incubated at 37°C for 30 min and then 65°C for 20 min. After
this, 4 ng of the phosphorylated/blunt-ended oligonucleotides were ligated into pUC19 in a 20
µl reaction containing; 1x ligase buffer, 20 ng pUC19 DNA/SmaI (Thermo Scientific) and 1
unit T4 DNA ligase (NEB; 400 cohesive end units), and incubated at 16°C for 18 hours and
65°C for 20 min. Twenty µl of the ligation were transformed into competent E.coli DH5α and
screened using ampicillin resistance and blue/white screening. Samples of positive colonies
were taken and amplified using colony PCR in a 20 µl reaction containing; 1x Taq
polymerase buffer, 100 µM dNTPs, 50 pmol pUC19 forward and reverse primers and 1 unit
Taq polymerase. These underwent PCR with cycle conditions: 2 min at 95°C, followed by 30
cycles of (95°C, 30s; 55°C, 30s; 72°C, 1 min). These were electrophoresed on a 2%
agarose/TAE gel to check for successful amplification. One µl of colony PCR product was

67
added to a 10 µl reaction containing 3.2 pmol of a pUC19 forward primer, and sent for
sequencing at the Functional Genomics and Proteomics Unit (University of Birmingham).
2.2.2.4. Original ProxiMAX Oligonucleotide Ligation
Appropriate 1 µM hybridised oligonucleotide stocks (i.e Round 1 oligonucleotide pairs for
cycle 1) were combined together to form an equimolar mixture. Ten pmol of this mixture of
oligonucleotide pairs was ligated to 3.3 pmol of base sequence, in a 20 µl reaction
containing 1x NEB buffer 2, 1mM ATP, 5 units Nt.AlwI (NEB) and 1 µl T4 DNA ligase (NEB;
400 cohesive end units). The reaction was incubated at room temperature for 2 hours
followed by 37°C for 30 minutes.
2.2.2.5. Original ProxiMAX Oligonucleotide PCR
The template was serially diluted to 1/10, 1/100 and 1/1000 and duplicate 100 µl
amplifications were set up. These contained 50 pmol primers (the appropriate cycle primer
and a universal primer for the base sequence), 100 µM dNTPs, 1 unit Pfu DNA polymerase
(Promega), 1x Pfu buffer and 1 µl of the diluted template. These underwent PCR with cycle
conditions: 2 min at 95°C, followed by 30 cycles of (95°C, 30s; 54°C, 30s; 72°C, 1 min). The
two PCR reactions were then combined and processed using a MinElute PCR Purification Kit
(Qiagen) according to manufacturer’s instructions.
2.2.2.6. Original ProxiMAX Oligonucleotide Digestion
MinElute-purified DNA was re-suspended in 30 µl H2O, with 25 µl digested in a 50 µl reaction
containing 1x fast digest buffer and 10 units MlyI (Thermo Scientific). The reaction was
incubated at 37°C for 1 hr and then 65°C for 20 min, and the resulting product was
electrophoresed of a 3% agarose/TAE gel to check the digestion was successful. Undigested
material was retained for later examination. The concentration of the digested product was

68
then measured using a Nanodrop 2000c (Thermo Scientific), and the volume required for
~3.3 pmol was calculated. The process was then repeated using the next set of
oligonucleotide pairs and primer (R2 and primer 2 for cycle 2, etc.), but using the digested
cycle 1 product rather than the original base sequence. Reiteration employed the next set of
oligonucleotides as indicated in Table 2.1, Table 2.2 and Table 2.6 for each cycle.
2.2.2.7. MiSEQ Tagging Reaction
Finished library products were amplified by PCR with the reaction containing 10 pmol MiSEQ
primers Table 2.4 and Table 2.5), 100 µM dNTPs, 1 unit Pfu DNA polymerase (Promega) or
1 unit Phusion HSII (Thermo Scientific) and 1 x Pfu buffer or 1x HF buffer. These underwent
PCR with cycle conditions: 2 min at 95°C, followed by 15 cycles of (95°C, 30s; 55°C, 30s;
72°C, 1 min). The PCR reactions were cleaned using a QiaQuick PCR Purification Kit
(Qiagen) according to manufacturer’s instructions and sent to Isogenica for MiSEQ
sequencing.
MiSEQ Fwd 5’-AATGATACGGCGACCACCGAGATCTACACTCTTTCCCTACACGACGCTCTT
CCGATCTNNNNNCATTCTGTGATCTCTGCC-3’
MiSEQ Rev 5’-CAAGCAGAAGACGGCATACGAGATTACAAGGTGACTGGAGTTCAGACGTGT
GCTCTTCCGATCTACTAGACTGTGCGATGGC-3’
Table 2.4. Single Reaction Ligation Library MiSeq Primers. The sequences of the forward and reverse primers used for MiSeq analysis of the “one-pot” ligation library. Primers were purchased from Eurofins Genomics at 0.05 μmol synthesis scale and PAGE-purified.
MiSeqFor 5’-AATGATACGGCGACCACCGAGATCTACACTCTTTCCCTACACGACGCTCTT
CCGATCTNNNNNCACAGGAAACAGGATCTACCATG-3’
MiSeqRev03 5’-CAAGCAGAAGACGGCATACGAGATGCCTAAGTGACTGGAGTTCAGACGTGT
GCTCTTCCGATCTTGGTGAAGATCAGTTGGGGC-3’
MiSeqRev04 5’-CAAGCAGAAGACGGCATACGAGATTGGTCAGTGACTGGAGTTCAGACGTGT
GCTCTTCCGATCTTGGTGAAGATCAGTTGGGGC-3’
Table 2.5. Anti-NGF Peptide Library MiSeq Primers. The sequences of the forward and reverse primers used for MiSeq analysis of the anti-NGF peptide library. Primers were purchased from Eurofins Genomics at 0.05 μmol synthesis scale and PAGE-purified.
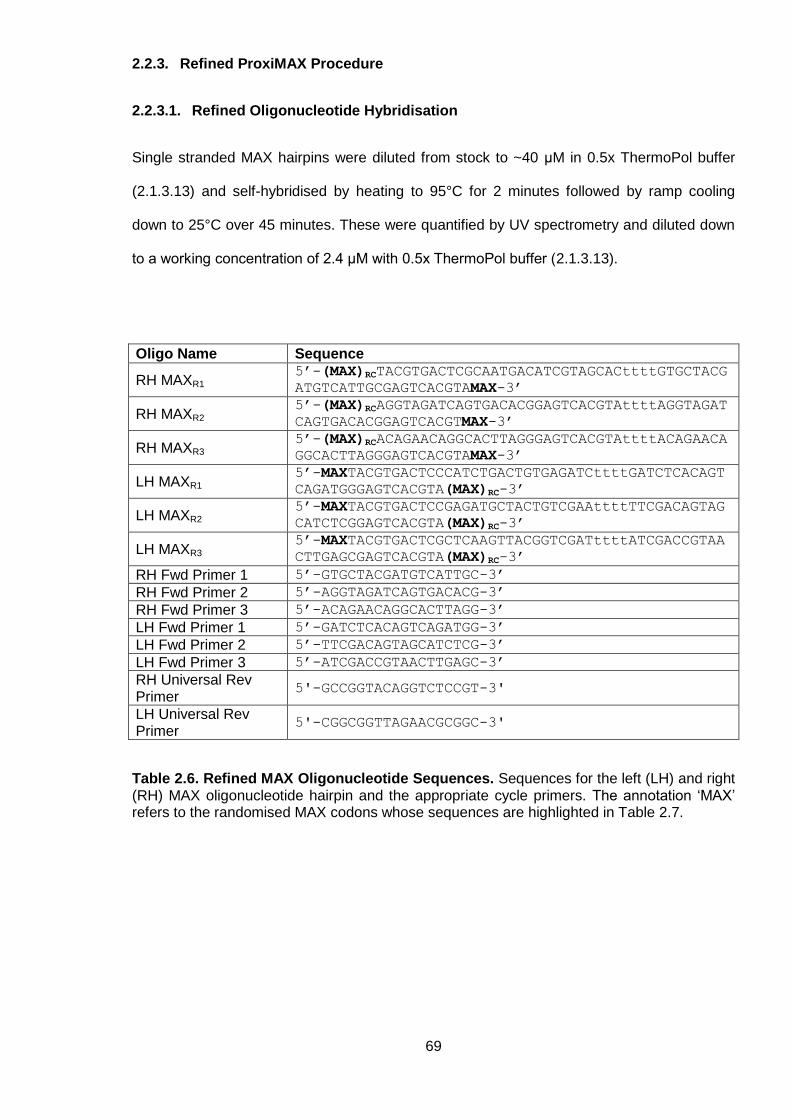
69
2.2.3. Refined ProxiMAX Procedure
2.2.3.1. Refined Oligonucleotide Hybridisation
Single stranded MAX hairpins were diluted from stock to ~40 μM in 0.5x ThermoPol buffer
(2.1.3.13) and self-hybridised by heating to 95°C for 2 minutes followed by ramp cooling
down to 25°C over 45 minutes. These were quantified by UV spectrometry and diluted down
to a working concentration of 2.4 μM with 0.5x ThermoPol buffer (2.1.3.13).
Oligo Name Sequence
RH MAXR1 5’-(MAX)RCTACGTGACTCGCAATGACATCGTAGCACttttGTGCTACG
ATGTCATTGCGAGTCACGTAMAX-3’
RH MAXR2 5’-(MAX)RCAGGTAGATCAGTGACACGGAGTCACGTAttttAGGTAGAT
CAGTGACACGGAGTCACGTMAX-3’
RH MAXR3 5’-(MAX)RCACAGAACAGGCACTTAGGGAGTCACGTAttttACAGAACA
GGCACTTAGGGAGTCACGTAMAX-3’
LH MAXR1 5’-MAXTACGTGACTCCCATCTGACTGTGAGATCttttGATCTCACAGT
CAGATGGGAGTCACGTA(MAX)RC-3’
LH MAXR2 5’-MAXTACGTGACTCCGAGATGCTACTGTCGAAttttTTCGACAGTAG
CATCTCGGAGTCACGTA(MAX)RC-3’
LH MAXR3 5’-MAXTACGTGACTCGCTCAAGTTACGGTCGATttttATCGACCGTAA
CTTGAGCGAGTCACGTA(MAX)RC-3’
RH Fwd Primer 1 5’-GTGCTACGATGTCATTGC-3’
RH Fwd Primer 2 5’-AGGTAGATCAGTGACACG-3’
RH Fwd Primer 3 5’-ACAGAACAGGCACTTAGG-3’
LH Fwd Primer 1 5’-GATCTCACAGTCAGATGG-3’
LH Fwd Primer 2 5’-TTCGACAGTAGCATCTCG-3’
LH Fwd Primer 3 5’-ATCGACCGTAACTTGAGC-3’
RH Universal Rev Primer
5'-GCCGGTACAGGTCTCCGT-3'
LH Universal Rev Primer
5'-CGGCGGTTAGAACGCGGC-3'
Table 2.6. Refined MAX Oligonucleotide Sequences. Sequences for the left (LH) and right (RH) MAX oligonucleotide hairpin and the appropriate cycle primers. The annotation ‘MAX’ refers to the randomised MAX codons whose sequences are highlighted in Table 2.7.

70
Codon Sequence
A GCT
D GAT
E GAA
F TTC
G GGC
H CAT
I ATC
K AAG
L CTG
N AAC
P CCG
Q CAG
R CGT
S TCT
T ACC
V GTG
W TGG
Y TAC
Table 2.7. Anti-NGF Peptide Library MAX Codon Identity. Identity of the MAX codons located at the donor end of the top strand of the MAX oligonucleotide hairpins used for the anti-NGF peptide library.
2.2.3.2. Refined ProxiMAX Oligonucleotide Ligation
Appropriate 2.4 µM MAX hairpin stocks (i.e. Round 1 oligonucleotide pairs for cycle 1) were
ligated individually to 0.4 µM base sequence, in a 20 µl reaction containing 1 Thermo
Scientific ligase buffer, 5% w/v PEG (Thermo Scientific) and 5 µl T4 DNA ligase (Thermo
Scientific). The reaction was incubated at 22°C for 15 min followed by 65°C for 10 minutes.
2.2.3.3. Refined ProxiMAX Oligonucleotide PCR
Quadruple 100 µl amplifications were set up containing 50 pmol primers (the appropriate
cycle primer and a universal primer for the base sequence), 20 µM dNTPs, 2 units Phusion
Hot Start II high-fidelity DNA polymerase (Thermo Scientific), 1 x Phusion HF buffer and 8 µl
of the single hairpin ligation. These underwent initial denaturation at 98°C for 45 secs
followed by 3 cycles of (98°C, 10s; 52°C, 30s; 72°C, 20s), 13 cycles of (98°C, 10s; 55°C,

71
30s; 72°C, 20s) and a final extension of 72°C for 8 min. The four PCR reactions were then
combined and cleaned using a QIAquick PCR Purification Kit (Qiagen) according to
manufacturer’s instructions. DNA concentration was assessed by either UV using a
nanodrop 2000c (Thermo Scientific), or PCR products were electrophoresed, imaged and
pixel density of the respective bands measured using imageJ. PCR products were then
mixed to give an equimolar mix of MAX hairpins, digested as described in 2.2.2.6 and
purified by agarose gel extraction (2.2.4.2.1 and 2.2.4.2.2).
2.2.4. Electrophoresis
2.2.4.1. Agarose gel electrophoresis
Agarose gels were made by dissolving 2% or 3% molecular grade agarose (Invitrogen) in
100 ml 1x TAE buffer, and ethidium bromide was added at a final concentration of 0.5 µg/ml.
The gel was poured into an electrophoresis tank casting tray, set up according to
manufacturer’s instructions and allowed to set. Once set the comb was removed and the
tank was filled up with 1x TAE buffer. DNA was mixed with loading buffer (2.1.3.5, 2.1.3.6 or
2.1.3.7), loaded into the wells and a constant voltage of 10 V/cm was applied to gel until the
dye front had migrated a sufficient distance. The gel was then viewed using a UV
transilluminator (UVP), or using GeneSnap photographic software (GeneSnap).
2.2.4.2. Agarose gel purification of DNA (Low Melting Point Agarose Gel)
2.2.4.2.1. Spin Column Purification
Agarose gels were prepared using low melting point agarose (Invitogen) in 1x TAE buffer
with a final concentration of 0.5 µg/ml ethidium bromide. The gel was poured into an
electrophoresis tank, set up according to manufacturer’s instructions and allowed to set.
Once set the comb was removed and the tank was filled up with 1x TAE buffer (2.1.3.2).
DNA was mixed with loading buffer (2.1.3.5, 2.1.3.6 or 2.1.3.7), loaded into the wells and a

72
constant voltage of 10 V/cm was applied to gel until the dye front had migrated a sufficient
distance. The required DNA band was excised and purified using a GENECLEAN turbo kit
(MP Bio), QIAquick or MinElute Gel extraction kit (Qiagen) according to the manufacturer’s
instructions.
2.2.4.2.2. D-tube Dialyzer (Merck Millipore)
Agarose gels were prepared using low melting point agarose (Invitrogen) in 1x TAE buffer
(2.1.3.2) with a final concentration of 0.5 µg/ml ethidium bromide. The gel was poured into an
electrophoresis tank, set up according to manufacturer’s instructions and allowed to set.
Once set the comb was removed and the tank was filled up with 1x TAE buffer (2.1.3.2).
DNA was mixed with loading buffer (2.1.3.5, 2.1.3.6 or 2.1.3.7), loaded into the wells and a
constant voltage of 10 V/cm was applied to gel until the dye front had migrated a sufficient
distance. The DNA fragment was excised from the agarose gel with a clean, sharp scalpel
and purified using D-tube Dialyzers (Merck Millipore) according to the manufacturer’s
instructions
2.2.4.3. TBE-Polyacrylamide gel electrophoresis
Polyacrylamide gels were made using 10x TBE buffer (2.1.3.1), 40% 37:5:1
acrylamide:bisacrylamide (National diagnostics), 10% APS (2.1.4.9) and TEMED
(N’,N’,N’,N’-Tetraethylmethylethylene diamine) (National diagnostics). The electrophoresis
tank was set up according to manufacturer’s instructions and the gels poured and set. DNA
samples were mixed with loading buffer, loaded onto the gel and constant voltage of 100V
was applied for 1 hour, or until the dye front had travelled an appropriate distance. The gel
was then removed, stained with a 1x TBE/ethidium bromide buffer (final concentration of 0.5
µg/ml) for 10 minutes and imaged on a UV transilluminator (UVP) or using GeneSnap
photographic software (GeneSnap).
73
2.2.4.4. Tris-Glycine Polyacrylamide Gel Electrophoresis
Polyacrylamide resolving gels made were using 1.5 M Tris-HCl (pH 8.8.), 30%
acrylamide/bisacrylamide (37:5:1) (National diagnostics), 20% SDS (2.1.4.10), 10% APS
(2.1.4.9) and TEMED (National diagnostics). Polyacrylamide stacking gels were made using
0.5 M Tris-HCl (pH6.8.), 30% acrylamide/bisacrylamide (37:5:1) (National diagnostics), 20%
SDS (2.1.4.10), 10% APS (2.1.4.9) and TEMED (National diagnostics). The electrophoresis
tank was set up according to manufacturer’s instructions and the gels placed within with 1x
SDS Tris-Glycine running buffer (2.1.3.3). Protein samples were mixed with 2x SDS sample
loading buffer (2.1.3.8), loaded onto the gel and constant voltage of 150V was applied for 1
hour and 10 minutes, or until the dye front had travelled an appropriate distance. The gel was
then removed, stained with Instant blue protein stain (Expedeon) for 30 minutes and imaged
using GeneSnap photographic software (GeneSnap) under white light.
2.2.4.5. Bis-Tris Polyacrylamide Gel Electrophoresis
Precast bis-tris protein gels were purchased from Invitrogen. The electrophoresis tank was
set up according to manufacturer’s instructions and the gels placed within with 1x NuPAGE®
MES-SDS running buffer (2.1.3.4). Protein samples were mixed with 2x SDS sample loading
buffer (2.1.3.8), loaded onto the gel and constant voltage of 180V was applied for 45
minutes, or until the dye front had travelled an appropriate distance. The gel was then
removed, stained with Instant blue protein stain (Expedeon) for 30 minutes and imaged using
GeneSnap photographic software (GeneSnap) under white light.

74
2.2.4.6. Western Blotting
2.2.4.6.1. Semi-Dry Method
PVDF membrane was pre-wetted in 100% methanol and then equilibrated for 10-15 minutes
in 1x transfer buffer (Thermo Scientific) along with filter paper. After equilibration this was
then assembled on a semi-dry blotter (Thermo Scientific) according to the manufacturer’s
protocol and transferred at 25V for 20-45 minutes. After transfer the membrane was then
washed with ultrapure water.
2.2.4.6.2. Protein Detection
The membrane was blocked with 5% w/v milk in PBS with the primary HRP-conjugated
antibody diluted to the appropriate working concentration and was then washed three times
for 10 minutes with PBS + 0.2% Tween. The membrane was then equilibrated with EZ-ECL
buffer for 3 minutes and then dried in the dark. The membrane was then imaged using
UVIChem imaging equipment and captured for 20 minutes.
2.2.5. Transformation of Escherichia Coli
2.2.5.1. CaCl2 Method
Thirty ml LB broth (2.1.2.1) was inoculated with a single E.coli DH5α and incubated overnight
at 37°C. The next day, 30 ml of fresh LB broth was inoculated with 0.3 ml of the overnight
culture and placed in an incubator for 2 hours. The cells were then harvested by
centrifugation at 4000 rpm for 5 min, the supernatant removed, the cells re-suspended with 6
ml ice cold 50 mM CaCl2 (2.1.4.11) and placed on ice for 10 min. This procedure of harvest,
supernatant removal, re-suspension and incubation on ice was repeated two more times with
the final re-suspension in 1.2 ml (rather than 6.0 ml) ice cold CaCl2. The cells were then
placed on ice for 20 min. One hundred µl of competent cells were added to 5 ng transformed
DNA in pre chilled 1.5 ml microcentrifuge tubes and left on ice for 30 min. After 30 min the

75
cells were heat shocked in a 37°C water bath for 30 sec and then transferred back to ice for
2 min. Sterile LB broth (500 µl) was added to each microcentrifuge tube and then incubated
in a 37°C water bath for 40 min. For the use of blue/white screening, after the 40 min
incubation 200 µl of transformations were added to 50 µl 2 % X-GAL (2.1.4.4) and 10 µl 1 M
IPTG (2.1.4.7). These were then plated out on LB agar + AMP plates (2.1.1.1) and incubated
overnight at 37°C.
2.2.5.2. Chemically Competent E.coli
One vial per transformation of the particular strain was thawed on ice for 10 minutes and
transformed according to the manufacturer’s protocol.
2.2.6. Plasmid Purification (Small scale)
Plasmid DNA was purified from cells grown in LB broth (2.1.2.1) using a WizardTM miniprep
kit (Promega) according to the manufacturer’s protocol.
2.2.7. Ethanol Precipitation
DNA was precipitated by adding 1/10th the volume of 3 M sodium acetate (pH5.5) and 2x
volume of ice-cold 100% ethanol. This mixture was then incubated at either -20°C overnight
or -80°C for 1 hour, and the DNA subsequently pelleted by centrifugation (14,000 rpm) at 4°C
for 20 minutes. The supernatant was aspirated and the pellet was washed with 70% ethanol.
The pellet was then dried via aspiration/evaporation and resuspended in an appropriate
buffer.

76
2.2.8. Phenol/Chloroform Extraction
DNA was extracted by the addition of an equal volume phenol: chloroform: isoamyl alcohol
(25:24:1), mixed and centrifuged at 14000 rpm for 30 seconds. The upper aqueous phase
was removed and the process repeated two more times. To remove any residual phenol the
recovered aqueous phase was mixed with an equal volume of chloroform: isoamyl alcohol
(24:1) and subsequently vortexed and centrifuged at 14000 rpm for 30 minutes. The upper
aqueous phase was removed and the DNA recovered by ethanol precipitation (2.2.7) before
resuspension in the appropriate buffer.
2.2.9. Protein Expression and Purification
2.2.9.1. pJ434-NGF_optEc
2.2.9.1.1. Expression
pJ434-NGF_optEc was transformed into E.coli SHuffle® T7 Competent (2.2.5.2) and grown
overnight on LB agar+50 µg/ml kanamycin (2.1.1.1) at 30°C. Two hundred ml LB broth +50
µg/ml kanamycin (2.1.4.6) was inoculated with a single colony and incubated overnight at 30°
whilst shaking at approximately 200 rpm. Fresh LB broth +50 µg/ml kanamycin was
inoculated 10:1 with overnight culture was and incubated 30°C whilst shaking at
approximately 200 rpm until an OD600nm 0.4-0.6. The cultures were induced with 0.4-1.0 mM
IPTG (2.1.4.7) and incubated at 30°C for 4hours or 16°C overnight. Cultures were pelleted by
centrifugation at 10,000 xg and the resulting pellets stored at -20°C.
Prior to induction a 10 ml sample of culture was taken and split into two 5 ml samples to
allow comparison of induced vs. un-induced protein expression. Time-point samples (500 µl)
were taken at 0, 2 and 4 hours and pellet by centrifugation at 10,000 xg for 1 min. The
supernatant was discarded and the cell pellet resuspended in 80 µl 1x SDS sample buffer
(2.1.3.8), boiled at 95°C for 10 minutes and analysed by SDS-PAGE.
77
2.2.9.1.2. Cell Lysate Production (Sonication)
E.coli pellets were resuspended in 0.1x original culture volume of native cell lysis buffer
(2.1.3.20.1) with lysozyme (2.1.4.8) at a final concentration of 0.2 mg/ml and incubated on
ice for 10 minutes. The resuspended cells were then sonicated 10x at 90% power for 20 secs
with 2 minutes on ice between each sonication event. Cell debris and insoluble material were
pelleted by centrifugation at 16,000 xg for 20 minutes at 4°C and the soluble fraction
transferred to a fresh tube.
2.2.9.1.3. Cell Lysate Production (BugbusterTM)
E.coli cell pellets were resuspended in BugbusterTM master mix (Merck Millipore) at 5 ml per
1g wet cell paste. These were incubated at room temperature for 20-30 minutes and the
insoluble debris pelleted by centrifugation at 16,000 xg for 20 minutes at 4°C. Supernatant
containing the soluble fraction was transferred to a fresh tube.
2.2.9.1.4. Purification
Cell lysate as produced in 2.2.9.1.2 or 2.2.9.1.3 was mixed with 1 ml (0.5 ml bed volume) Ni-
NTA (Qiagen) and incubated at room temperature whilst mixing end-over-end for 1 hour. The
mixture was loaded onto a poly-prep® chromatography column (BioRad), allowed to flow
through and that fraction collected. The column was the washed 2x with native column wash
buffer (2.1.3.20.3), followed by 4x with native column elution buffer (2.1.3.20.4). Twenty μl of
each fraction was taken for analysis whilst the remaining fractions were stored at -80°C in
25% glycerol. Sample fractions were mixed with 20 μl 2x SDS sample buffer (2.1.3.8) and
analysed by SDS-PAGE (2.2.4.4, 2.2.4.5).

78
2.2.9.2. pET SUMO-βNGF
2.2.9.2.1. TA Cloning
β-NGF gene was amplified out of pJ434-NGF_optEc and inserted into pETSUMO plasmid
using TA cloning with specific primers to amplify the β-NGF gene. Amplification was
undertaken using the general PCR procedure as described in 2.2.1.4 with a primer annealing
temperature of 51°C. A 3:1 insert: vector molar ratio was used for the ligation, which was
performed according to the general ligation procedure described 2.2.1.3. The pET SUMO-
βNGF was transformed into One Shot® Mach1™-T1R Competent Cells (2.1.5.2) as
described in 2.2.5.2 and resulting clones screened by colony PCR (2.2.2.3). Plasmid DNA
was extracted and purified by miniprep (2.2.6) and sent for sequencing at Eurofins
Genomics.
2.2.9.2.2. Expression
pET SUMO β-NGF was transformed into both SHuffle® T7 Competent E.coli and (NEB)
E.coli BL21 (DE3) One Shot® (2.1.5.3 & 2.1.5.4) and grown overnight on LB agar+50 µg/ml
kanamycin (2.1.1.1) at 30°C and 37°C respectively. LB broth +50 µg/ml kanamycin (200 ml)
(2.1.4.6) was inoculated with a single colony of either cell line and incubated overnight at
30/37°C whilst shaking at approximately 200 rpm. Fresh LB broth +50 µg/ml kanamycin was
inoculated 10:1 of overnight culture was and incubated 30/37°C whilst shaking at
approximately 200 rpm until an OD600nm 0.4-0.6. The cultures were induced with 1.0 mM
IPTG (2.1.4.7) and incubated at 30/37°C for 4hours or 16°C overnight. Cultures were
pelleted by centrifugation at 10,000 xg and stored at -20°C.
Prior to induction, a 10 ml sample of culture was taken and split into two 5 ml samples to
allow comparison of induced vs. un-induced protein expression. Time-point samples (500 µl)
were taken at 0, 2 and 4 hours and pelleted by centrifugation at 10,000 xg for 1 min. The
supernatant was discarded and the cell pellet resuspended in 80 µl 1x SDS sample buffer
(2.1.3.8), boiled at 95°C for 10 minutes and analysed by SDS-PAGE (2.2.4.4, 2.2.4.5).
79
2.2.9.2.3. Soluble Fraction Purification
E.coli cell pellets were resuspended in BugbusterTM master mix (Merck Millipore) at 5ml per
1g wet cell paste. These were incubated at room temperature for 20-30 minutes and the
insoluble debris pelleted by centrifugation at 16,000 x g for 20 minutes at 4°C. Supernatant
containing the soluble fraction was transferred to a fresh tube.
Cell lysate as was mixed with 1 ml (0.5 ml bed volume) Ni-NTA (Qiagen) and incubated at
room temperature whilst mixing end-over-end for 1 hour. The mixture was loaded onto a
poly-prep® chromatography column (BioRad), allowed to flow through and that fraction
collected. The column was the washed 2x with native column wash buffer (2.1.3.20.3),
followed by 4x with native column elution buffer (2.1.3.20.4). Twenty μl of each fraction was
taken for analysis whilst the remaining fractions were stored at -80°C in 25% glycerol.
Sample fractions were mixed with 20 μl 2x SDS sample buffer (2.1.3.8) and analysed by
SDS-PAGE (2.2.4.4, 2.2.4.5).
2.2.9.2.4. Purification under Denaturing Conditions
The cell pellet generated from 2.2.9.2.2 was resuspended in 0.1 original culture volume of
denaturing lysis buffer (2.1.3.20.2) and mixed with 1 ml (0.5 ml bed volume) Ni-NTA (Qiagen)
and incubated at room temperature whilst mixing end-over-end for 1 hour. The mixture was
loaded onto a poly-prep® chromatography column (BioRad), allowed to flow through and that
fraction collected. The column was the washed 2x denaturing column wash buffer
(2.1.3.20.5), followed by 4x with denaturing column elution buffer 1 (2.1.3.20.6) and 4x with
denaturing column elution buffer 2 (2.1.3.20.7). Samples (20 μl) of each fraction were taken
for analysis whilst the remaining fractions were stored at -80°C in 25% glycerol. Sample
fractions were mixed with 20 μl 2x SDS sample buffer (2.1.3.8) and analysed by SDS-PAGE
(2.2.4.4, 2.2.4.5).
80
2.2.9.2.5. Inclusion Body Preparation (BugbusterTM)
The insoluble pellet generated from 2.2.9.2.3 was resuspended the same volume of
BugbusterTM master mix as previously used, to lyse the cell pellet, and incubated at room
temperature for 5 minutes. Six volumes of 1:10 diluted BugbusterTM master mix in deionised
water was added, vortexed for 1 min and the inclusion bodies collected by centrifugation at
5,000 xg for 15 minutes at 4°C. The supernatant was removed and the inclusion bodies
resuspended in 0.5 volume (of the original volume) 1:10 diluted BugbusterTM master mix.
This was repeated three more times but final resuspension was centrifuged at 16,000 xg for
15 minutes at 4°C and the supernatant removed. Inclusion body pellets were then stored at -
80°C.
2.2.9.2.6. Inclusion Body Solubilisation
Inclusion body pellets as prepared in 2.2.9.2.5 were resuspended in solubilisation buffer
(2.1.3.20.8) and mixed end-over-end at room temperature for 2 hours. Insoluble debris was
pelleted by centrifugation at 16,000 xg for 20 minutes, following which the supernatant was
transferred to a clean tube. Pelleted insoluble debris was again resuspended in solubilisation
buffer and mixed end-over-end at room temperature for 2 hours to allow analysis of
solubilisation efficiency.
2.2.9.2.7. Inclusion Body Purification
Solubilised inclusion bodies as prepared in 2.2.9.2.6 were mixed with 1 ml (0.5 ml bed
volume) Ni-NTA (Qiagen) and incubated at room temperature whilst mixing end-over-end for
1 hour. The mixture was loaded onto a poly-prep® chromatography column (BioRad),
allowed to flow through and the fraction collected. The column was the washed 2x denaturing
column wash buffer (2.1.3.20.5), followed by 4x with denaturing column elution buffer 1
(2.1.3.20.6) and 4x with denaturing column elution buffer 2 (2.1.3.20.7). 20 μl of each fraction

81
was taken for analysis whilst the remaining fractions were stored at -80°C with 25% glycerol.
Sample fractions were mixed with 20 μl 2x SDS sample buffer (2.1.3.8) and analysed by
SDS-PAGE (2.2.4.4, 2.2.4.5).
2.2.9.2.8. Refolding
Purified solubilised inclusion bodies prepared as described in 2.2.9.2.7 were incubated with
1ml (0.5ml bed volume) Ni-NTA resin (Qiagen) per 4 ml solubilised inclusion bodies and
mixed by inversion at room temperature for 45-60minutes. This was then passed through a
poly-prep chromatography column (BioRad) and the flow through saved for later analysis.
The resin was washed with 4 bed volumes of denaturing wash buffer (2.1.3.20.5) and the
fractions saved for later analysis. The resin was then resuspended 1:1 v/v in refolding buffer
(2.1.3.20.9) transferred out of the column, diluted 50-fold in refolding buffer and rolled for 5
minutes. The resin was then pelleted, the supernatant removed, resuspended in fresh
refolding buffer (1:50 dilution) and rolled for 5 minutes. This was repeated again but after re-
suspension it was mixed end-over-end at 4°C overnight. The next day this was passed
through a new poly-prep chromatography column (BioRad) and washed with 4 bed volumes
of native wash buffer (2.1.3.20.3). Soluble refolded protein was then eluted with 4x 1 bed
volume native elution buffer (2.1.3.20.4) and fractions saved. Elution fractions were diluted 5-
fold in dilution buffer (2.1.3.20.10) to reduce the imidazole concentration, glycerol was added
to a 25% final concentration and the resulting fractions were stored at -80°C.
2.2.9.3. BCA Protein Quantification Assay
Protein concentration was determined using the BCA assay in the manner described in the
manufacturer’s protocol.

82
2.2.9.4. SUMO-NGF Cleavage
One unit of SUMO protease was added per 5 μg SUMO-NGF fusion with 1x SUMO protease
buffer (2.1.3.20.11). NaCl concentration was kept between 100 mM and 300 mM for optimal
reaction conditions. The reaction was incubated at 30°C for 6 hours and then stored at -
20°C. Twenty μl was removed and prepared for analysis by adding 20 μl 2x SDS sample
buffer (2.1.3.8) and analysed by SDS-PAGE.
2.2.9.5. NGF Activity Assay
TrkA-Fc chimera (125 ng/50 μl; R&D Systems) was incubated on a NUNC F96 Maxisorp
plate (Sigma-Aldrich) at 4°C overnight. The plate was the washed 3x in PBS/0.1% Tween
and 2x PBS. This was then blocked for 1hr at room temperature with BlockerTM 1% casein
(Thermo Scientific) followed by 4x washes with PBS/0.1% Tween and 2x PBS. Recombinant
human β-NGF (30 ng; R&D Systems) was mixed with 50µl 0.1% casein (1:10 diluted
BlockerTM 1% casein in PBS/0.1% Tween). NGF solution (55 µl/well) was transferred into the
NUNC Maxisorp plate and incubated for 40 minutes at room temperature with 50 µl/well
1:200 biotinylated anti-human β-NGF antibody (R&D Systems) in 0.1% casein in PBS/0.1%
Tween. The plate was washed 4x in PBS/0.1% Tween and 2x PBS. Streptavidin-HRP
(Sigma-Aldrich, 1:1000 dilution) in 0.1% casein/PBS/0.1% Tween, 50 µl/well was added to
the plate, which was then incubated for 30 minutes at room temperature followed by 4x
washes with PBS/0.1 Tween and 2x PBS. Finally, TMB reagent (50 µl/well; eBiosciences)
was incubated on the plate for 5-20 minutes, quenched with 50 µl/well 0.5M H2SO4 and the
absorbance read at 450nm.
83
2.2.10. CIS Display
2.2.10.1. Rhβ-NGF Biotinylation
EZ-Link™Sulfo-NHS-Biotin (Thermo Scietific) was reconstituted with ultrapure water to
10mM concentration and was added to rhβ-NGF (R&D systems) at a 20-fold molar excess.
This was incubated on ice for 2 hours and the reaction was stopped with the addition of 250
μl 1M Tris-HCl (pH 7.4). Free biotin was removed by dialysis using a Slide-A-Lyzer dialysis
cassette (MWCO 3KDa) with PBS as an exchange buffer. Exchange buffer was replaced
after 2 hours (twice) followed by overnight at 4°C.
2.2.10.2. Library Selections
An in vitro transcription/translation reaction was set up containing 2 μg library template DNA
along with in Isogenica proprietary buffer, amino acid mix and cell lysate to a total volume of
50 μl. This was incubated for 1 hour at 37°C and subsequently put on ice for 5 minutes.
Dynabeads® M-280 Streptavidin (Life technologies) were prewashed 3x with PBS and
resuspended in the original volume of 2% BSA/PBS/0.1%Tween. Unspecific binders from the
in vitro transcription/translation were discarded using unblocked uncoated beads by mixing
for 30 minutes with 2% BSA/PBS (+/- 1mg/ml heparin depending on stringency). Ten μg of
biotinylated rhβ-NGF (2.2.10.1) was bound to 50 μl prewashed beads for 1 hour in PBS
followed by 2x PBS washes and blocked with 2% BSA/PBS. Deselection supernatant was
transferred to coated beads and washed on a KingFisher™ Flex Magnetic Particle Processor
(Thermo Scientific) according to the designed selection plan. Bound DNA was then heat
eluted at 75°C in 1x ThermoPol buffer (2.1.3.13) for 10 minutes, the beads were captured
and the supernatant transferred to a fresh Eppendorf tube. Selected DNA was then amplified
using reactions containing 10 μM recovery primer, 2 µM dNTPs, 1 x KOD buffer, 25 mM
MgSO4 0.5 units KOD Hot Start DNA polymerase (Merck Millipore Millipore) and 10 µl of the
eluted DNA. These underwent initial denaturation at 95°C for 2 min followed by 35 cycles of
(95°C, 30s; 52°C, 20s; 72°C, 1 min), and a final extension of 72°C for 7 min. The resulting

84
product was purified using Promega WizardTM columns according to the manufacturer’s
protocol and the resulting DNA was used for another round of selections.
2.2.10.3. Library Screening
2.2.10.3.1. Selection Output Cloning
The output from the final round of selections was digested with NcoI (NEB) and NotI (NEB)
(2.2.1.5) and ligated (2.2.1.3) into an Isogenica proprietary phagemid vector. The ligations
were purified using phenol/chloroform extraction (2.2.8), ethanol precipitation (2.2.7) and the
phagemid was transformed into E.coli TG1 (2.1.5.5) as described in 2.2.5.2
2.2.10.3.2. Peptide Phage Expression
Individual colonies from selection output cloning (2.2.10.3.1) were picked into 120 μl 2TY
(2.1.2.2) with 100 μg/ml ampicillin (2.1.4.5) and 2% glucose. This was incubated at 37°C, 225
rpm until cloudy. Glycerol was then added to 25% (v/v) and these precultures were stored at
-80°C.
Thirty μl of preculture was transferred to 300 μl 2TY-Amp-Glu (2.1.2.2, 2.1.4.6) and
incubated at 37°C until the OD600nm was 0.3. Approximately 108 pfu (plaque forming units) of
M13K07 helper phage (NEB) was added and incubated at 37°C with shaking @225 rpm. The
cultures were then pelleted by centrifugation at 3000 xg for 10 mins, the supernatant
discarded and pellets resuspended in 600 μl 2TY-Amp (2.1.2.2,2.1.4.6) +50 μg/ml (2.1.4.6).
This was subsequently incubated at 37°C, with shaking @ 225 rpm overnight and the
following day the cultures were pelleted by centrifugation at 3000 xg for 10 mins. The
supernatant was kept and stored at 4°C ready for analysis by ELISA.

85
2.2.10.3.3. Phage expression ELISA screening
A NUNC F96 Maxisorp plate (Sigma-Aldrich) was coated with 50 ng/well recombinant human
β-NGF (R&D Systems) and incubated overnight at 4°C. The plate was washed 4x PBS/0.1%
Tween and 2x PBS. This was then blocked for 1hr at room temperature with BlockerTM 1%
casein (Thermo Scientific) followed by 4x washes with PBS/0.1% Tween and 2x PBS.
Supernatant produced from (2.2.10.3.2) was diluted 2x in 0.1% casein in PBS/0.1% Tween
and 100 μl/well was added to the Maxisorp plate and incubated at room temperature for 1
hour. The plate was washed again with 4x PBS/0.1% Tween and 2x PBS. Mouse anti-M13
HRP conjugated antibody (Sigma-Aldrich; 1:5000 dilution, 50 µl/well) in 0.1%
casein/PBS/0.1% Tween was incubated on the plate for 30 minutes at room temperature
followed by 4x washes with PBS/0.1 Tween and 2x PBS. TMB reagent (eBiosciences; 50
µl/well) was incubated on the plate for 5-20 minutes, the reaction was quenched with 50
µl/well 0.5M H2SO4 and the absorbance read at 450nm.
2.2.11. NGF Inhibition Assay
TrkA-Fc chimera (125 ng/50 μl; R&D Systems) was incubated on a NUNC F96 Maxisorp
plate (Sigma-Aldrich) at 4°C overnight. The plate was the washed 3x in PBS/0.1% Tween
and 2x PBS. This was then blocked for 1hr at room temperature with BlockerTM 1% casein
(Thermo Scientific) followed by 4x washes with PBS/0.1% Tween and 2x PBS. Thirty ng
recombinant human β-NGF (R&D Systems) was mixed with 50µl of appropriate peptide
concentrations in 0.1% casein in PBS/0.1% Tween. NGF/peptide solutions (55 µl/well) were
transferred into the NUNC Maxisorp plate and incubated for 40 minutes at room temperature
with 50 µl/well 1:200 biotinylated anti-human β-NGF antibody (R&D Systems) in 0.1% casein
in PBS/0.1% Tween. The plate was washed 4x in PBS/0.1% Tween and 2x PBS.
Streptavidin-HRP (Sigma-Aldrich; 1:1000 dilution, 50 µl/well) in 0.1% casein/PBS/0.1%
Tween was incubated on the plate for 30 minutes at room temperature followed by 4x
washes with PBS/0.1 Tween and 2x PBS. TMB reagent (eBiosciences; 50 µl/well) was

86
incubated on the plate for 5-20 minutes, quenched with 50 µl/well 0.5M H2SO4 and the
absorbance read at 450nm.

87
Chapter 3
ProxiMAX Randomisation: Single
Reaction Equimolar Ligation Library
88
3. Chapter 3: ProxiMAX Randomisation: Single Reaction Equimolar Ligation Library
3.1 Introduction
The original ProxiMAX method (2.2.2) relied on the use of single stranded oligonucleotides
that were subsequently hybridised together (2.2.2.1) and quantified (2.2.2.2) to donate an
equimolar mix of MAX codons to an acceptor piece of DNA in a single reaction (Figure 3.1).
MAX codons were chosen based on preferred usage in E.coli as described in (Nakamura et
al., 2000). MAX oligonucleotides contained a single stranded 5’ region to reduce the
formation of concatamers. Blunt ended ligation was used to ligate the donor MAX
oligonucleotide to acceptor sequence (2.2.2.4). In order to keep point mutations to a
minimum high fidelity Pfu DNA polymerase was used to amplify the acceptor:donor complex.
As this is an iterative process, the amount of template employed could influence the
maximum number of randomised codons that can be added is the ability to functionally
screen the final library.
To assess the ProxiMAX method, in its original format, it would be used to add a randomised
array of codons, over six cycles, on to a non-specific piece of acceptor DNA. Specific
subsets of codons based on their structural qualities were used in each cycle (Table 3.2).
From this data the process could be analysed and any flaws could be adjusted in order to
further refine the method.

89
Figure 3.1. ProxiMAX Randomisation Process Schematic. Specially designed ‘MAX’ oligonucleotides (Table 2.1and Table 2.2) are hybridised together. They are then ligated to a conserved base sequence, whilst concurrently undergoing a single strand digestion with Nt.AlwI to cleave base/base ligation. The ligation is amplified using Pfu DNA polymerase and the resulting product cleaned using QIAGEN Minelute kit. The cleaned product is digested with MlyI, and the ligation/amplification/digestion process is repeated using the digested product of the previous cycle as the base sequence.
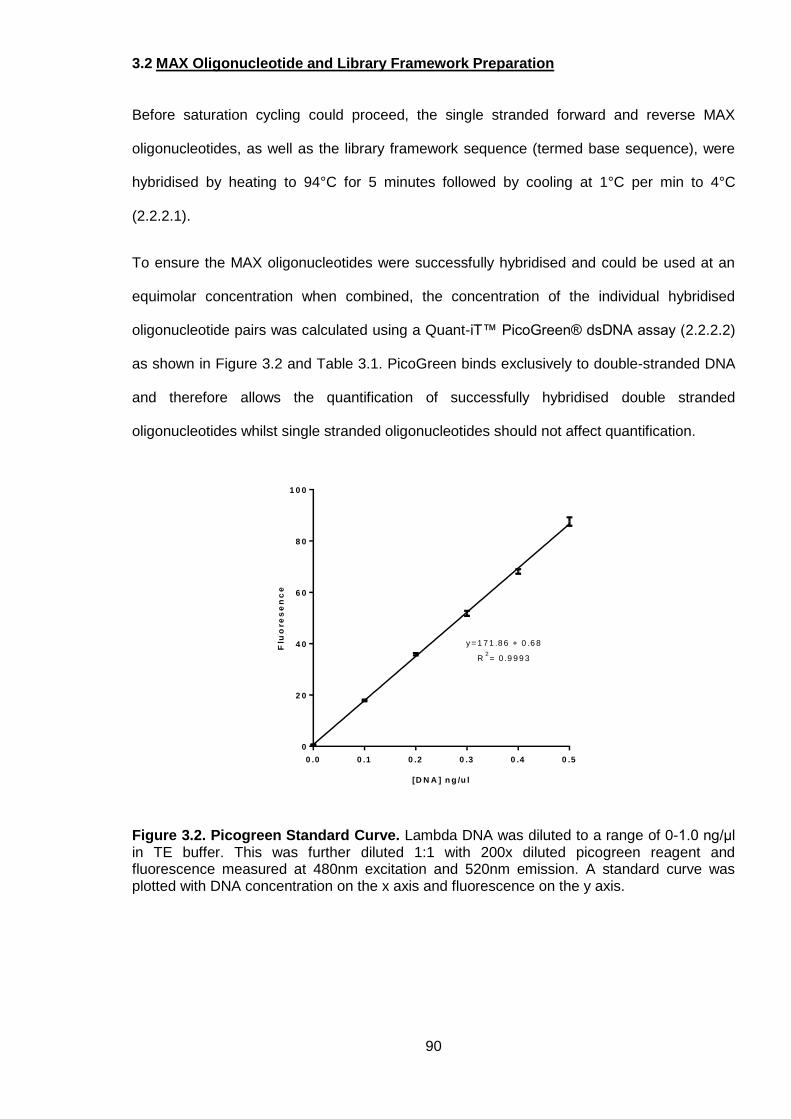
90
3.2 MAX Oligonucleotide and Library Framework Preparation
Before saturation cycling could proceed, the single stranded forward and reverse MAX
oligonucleotides, as well as the library framework sequence (termed base sequence), were
hybridised by heating to 94°C for 5 minutes followed by cooling at 1°C per min to 4°C
(2.2.2.1).
To ensure the MAX oligonucleotides were successfully hybridised and could be used at an
equimolar concentration when combined, the concentration of the individual hybridised
oligonucleotide pairs was calculated using a Quant-iT™ PicoGreen® dsDNA assay (2.2.2.2)
as shown in Figure 3.2 and Table 3.1. PicoGreen binds exclusively to double-stranded DNA
and therefore allows the quantification of successfully hybridised double stranded
oligonucleotides whilst single stranded oligonucleotides should not affect quantification.
0 .0 0 .1 0 .2 0 .3 0 .4 0 .5
0
2 0
4 0
6 0
8 0
1 0 0
[D N A ] n g /u l
Flu
ore
se
nc
e
y = 1 7 1 .8 6 + 0 .6 8
R2= 0 .9 9 9 3
Figure 3.2. Picogreen Standard Curve. Lambda DNA was diluted to a range of 0-1.0 ng/μl in TE buffer. This was further diluted 1:1 with 200x diluted picogreen reagent and fluorescence measured at 480nm excitation and 520nm emission. A standard curve was plotted with DNA concentration on the x axis and fluorescence on the y axis.
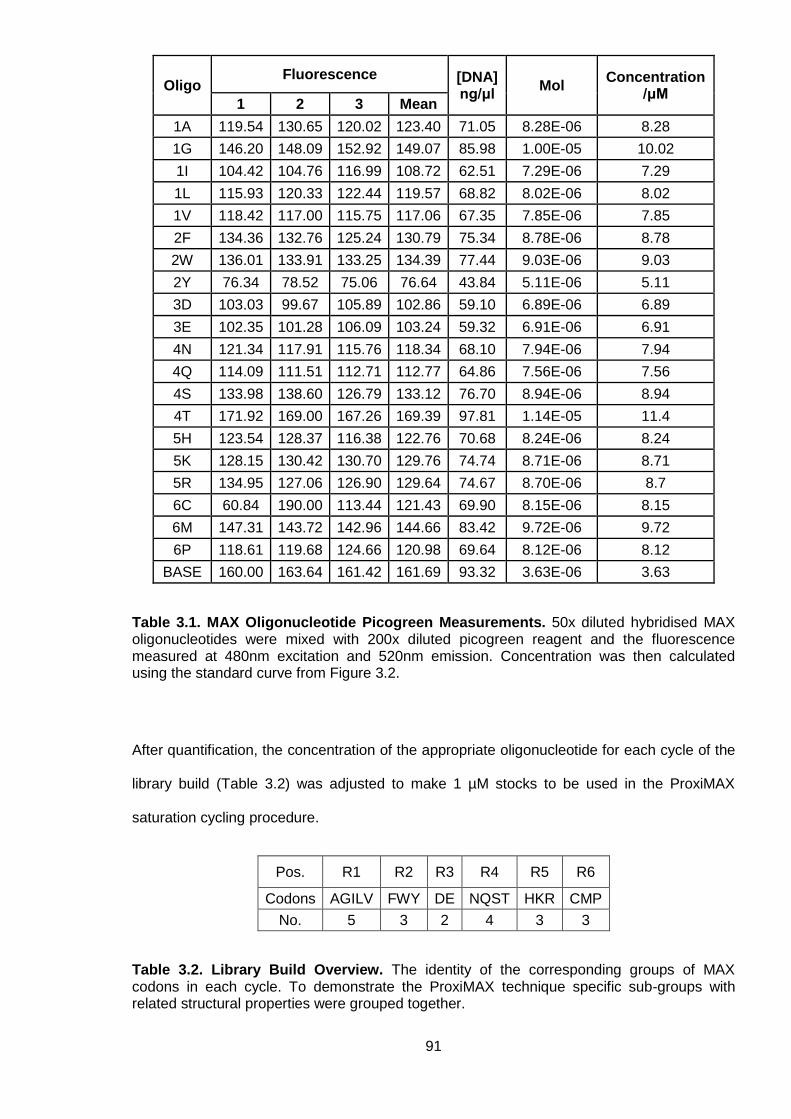
91
Oligo Fluorescence [DNA]
ng/μl Mol
Concentration /μM
1 2 3 Mean
1A 119.54 130.65 120.02 123.40 71.05 8.28E-06 8.28
1G 146.20 148.09 152.92 149.07 85.98 1.00E-05 10.02
1I 104.42 104.76 116.99 108.72 62.51 7.29E-06 7.29
1L 115.93 120.33 122.44 119.57 68.82 8.02E-06 8.02
1V 118.42 117.00 115.75 117.06 67.35 7.85E-06 7.85
2F 134.36 132.76 125.24 130.79 75.34 8.78E-06 8.78
2W 136.01 133.91 133.25 134.39 77.44 9.03E-06 9.03
2Y 76.34 78.52 75.06 76.64 43.84 5.11E-06 5.11
3D 103.03 99.67 105.89 102.86 59.10 6.89E-06 6.89
3E 102.35 101.28 106.09 103.24 59.32 6.91E-06 6.91
4N 121.34 117.91 115.76 118.34 68.10 7.94E-06 7.94
4Q 114.09 111.51 112.71 112.77 64.86 7.56E-06 7.56
4S 133.98 138.60 126.79 133.12 76.70 8.94E-06 8.94
4T 171.92 169.00 167.26 169.39 97.81 1.14E-05 11.4
5H 123.54 128.37 116.38 122.76 70.68 8.24E-06 8.24
5K 128.15 130.42 130.70 129.76 74.74 8.71E-06 8.71
5R 134.95 127.06 126.90 129.64 74.67 8.70E-06 8.7
6C 60.84 190.00 113.44 121.43 69.90 8.15E-06 8.15
6M 147.31 143.72 142.96 144.66 83.42 9.72E-06 9.72
6P 118.61 119.68 124.66 120.98 69.64 8.12E-06 8.12
BASE 160.00 163.64 161.42 161.69 93.32 3.63E-06 3.63
Table 3.1. MAX Oligonucleotide Picogreen Measurements. 50x diluted hybridised MAX oligonucleotides were mixed with 200x diluted picogreen reagent and the fluorescence measured at 480nm excitation and 520nm emission. Concentration was then calculated using the standard curve from Figure 3.2.
After quantification, the concentration of the appropriate oligonucleotide for each cycle of the
library build (Table 3.2) was adjusted to make 1 µM stocks to be used in the ProxiMAX
saturation cycling procedure.
Pos. R1 R2 R3 R4 R5 R6
Codons AGILV FWY DE NQST HKR CMP
No. 5 3 2 4 3 3
Table 3.2. Library Build Overview. The identity of the corresponding groups of MAX codons in each cycle. To demonstrate the ProxiMAX technique specific sub-groups with related structural properties were grouped together.

92
3.3 ProxiMAX Saturation Cycling
Initially a 39 bp base sequence (Table 2.1) was used as a framework on to which an
equimolar group of 31 bp cycle 1 MAX oligonucleotides (Table 2.1) were ligated (2.2.2.4) to
form a fragment with a sequence length of 70 bp. This provided an acceptor: donor complex
large enough to purify using standard spin columns whilst small enough to eventually resolve
the difference in size between cycles via electrophoresis. The first cycle contained an
equimolar mix of MAX oligonucleotides, as described in 2.2.2.4, which were ligated to the
base template sequence in a single 20 μl reaction. This ligation was subsequently amplified
(2.2.2.5) using the appropriate base and cycle primers (Table 2.1) and examined by 3%
agarose gel electrophoresis (2.2.4.1), as shown in Figure 3.3.
Figure 3.3. ProxiMAX Saturation Cycling. A: Round 1 PCR. Agarose gel image of PCR products generated from diluted round 1 ligation (A, G, I, L, V). Lanes: 1: Negative control (no template DNA); 2-3: 1/1000 ligation dilution; 4-5: 1/100 ligation dilution; 6-7: 1/10 ligation dilution. Each dilution appeared to be the correct length of 70 bp. Samples were electrophoresed on 3% agarose/TAE gel against 0.36 µg of Promega 25 bp step ladder. B: Round 1 Digestion. PCR products underwent clean-up and subsequently digested with MlyI forming two fragments of 42 bp and 28 bp respectively. Lanes: 1: Undigested PCR product; 2: Digested PCR product. Samples were electrophoresed on 3% agarose/TAE gel against 0.36 µg of Promega 25 bp step ladder.
Figure 3.3 A clearly shows a band in lanes 2-7 that is slightly smaller than the 75 bp marker,
with some slight primer dimerization occurring below the 25 bp marker. This corresponds to
the expected 70 bp size of the PCR product, with no contamination observed in the negative
A B
M 1 2 3 4 5 6 7 M M 1 2 M
25 bp
50 bp
75 bp
100 bp

93
control of lane 1, so was therefore purified and digested (2.2.2.6) according to the ProxiMAX
procedure.
Analysis of the digestion on an agarose gel (Figure 3.3 B) showed that the digestion was
successful in forming two smaller bands (lane 2) at the expected sizes of 42 bp and 28 bp,
with some undigested material still present at 70 bp. Lane 1 contained a control of
undigested PCR product as control to measure the success of the digestion. The first round
of saturation cycling appeared to be successful so the product was subsequently used in the
next cycle of ProxiMAX randomisation.
However after progressing onto the second cycle some fundamental problems manifested
themselves. An equimolar mix of cycle 2 MAX oligonucleotides were ligated to the digested
product carried through from cycle 2 and amplified in the same manner as previously
described. Cycle 2 PCR products visualised on a 3% agarose/TAE gel (2.2.4.1) showed a
product of corresponding to approximately the right size, of 73bp (lanes 2-7), however a
product of a similar size (circled) is visible in the negative control (lane 1) (Figure 3.4). The
negative control contained the same reaction components except without the template DNA
to amplify, which obviously cast doubt over the validity of the results. As well as
contamination despite the use of Nt.AlwI as nicking enzyme to prevent concatamer formation
some higher molecular weight laddering also occurred (arrowed). Even after repeated
attempts at this second cycle and the previous cycle (using different reagents) the issue of
contamination was still persistent in the same manner as previously observed. The source of
the contamination was investigated (results not shown) and it was eventually discovered that
the MAX oligonucleotide primer stocks had been unintentionally contaminated by other
workers. As new oligonucleotide stocks had to be ordered it was decided to re-design the
oligonucleotide sequences (Table 2.6) to avoid these issues in case any other reagents were
contaminated. Therefore if there was any contamination present it should no longer be
amplified up as contrastingly different primer sequences were now used.

94
Figure 3.4 Oligonucleotide Contamination and Concatemers. Agarose gel image of PCR products generated from diluted round 2 ligation (F, W, and Y). Lanes: 1: Negative control (no template DNA); 2-3: 1/1000 ligation dilution; 4-5: 1/100 ligation dilution; 6-7: 1/10 ligation dilution. Each dilution appeared to be the correct length of 73 bp with smaller molecular weight products (~50 bp) visible. Higher molecular weight concatamers (arrowed) were also visible in lanes 2-7 whilst there was contamination (circled) visible in lane 1. Samples were electrophoresed on 3% agarose/TAE gel against 0.36 µg of Promega 25 bp step ladder.
3.4 ProxiMAX Saturation Cycling with Re-designed MAX Oligonucleotides
MAX oligonucleotide sequences were re-designed to be different from that of the originals
(Table 2.2). The length of the MAX sequence was kept at 31 bp but the sequence was
altered to avoid the amplification of any previous contamination. To aid in the handling of the
DNA the conserved base sequence was extended from 39 bp to 69 bp thus meaning that a
successful ligation of a MAX sequence to it would create a product of 100 bp.
Again the new oligonucleotides were purchased as ssDNA so had to undergo hybridisation,
as described in 2.2.2.1, and quantification using a Quant-iT™ PicoGreen® dsDNA assay
(2.2.2.2) as shown in Figure 3.5 and Table 3.3. The new oligonucleotides were then ready for
saturation cycling using the same library build as described in Table 3.2.
M 1 2 3 4 5 6 7 M
25 bp 50 bp
100 bp 125 bp
75 bp

95
0 .0 0 .1 0 .2 0 .3 0 .4 0 .5
0
1 0 0
2 0 0
3 0 0
4 0 0
[D N A ] n g /u l
Flu
ore
se
nc
ey = 6 0 0 .5 7 x + 4 .0 0 5 3
R ² = 0 .9 9 8
Figure 3.5. Picogreen Standard Curve. Lambda DNA was diluted to a range of 0-1.0 ng/μl in TE buffer. This was further diluted 1:1 with 200x diluted picogreen reagent and fluorescence measured at 480 nm excitation and 520nm emission. A standard curve was plotted with DNA concentration on the x axis and fluorescence on the y axis.

96
Oligo Fluorescence [DNA]
ng/μl Mol
Concentration/ μM
1 2 3 Mean
A 225.69 221.95 231.48 226.37 36.97 4.31E-06 4.31
C 288.70 306.27 233.23 276.07 45.25 5.27E-06 5.27
D 186.87 195.45 188.30 190.21 30.95 3.61E-06 3.61
E 160.78 167.83 164.48 164.36 26.65 3.11E-06 3.11
F 290.57 302.80 298.81 297.39 48.80 5.69E-06 5.69
G 185.39 225.02 225.34 211.92 34.57 4.03E-06 4.03
H 249.44 295.33 277.43 274.07 44.91 5.23E-06 5.23
I 139.37 142.93 213.14 165.15 26.78 3.12E-06 3.12
K 152.94 164.71 167.01 161.55 26.18 3.05E-06 3.05
L 284.79 265.74 331.34 293.96 48.23 5.62E-06 5.62
M 225.47 223.16 220.73 223.12 36.43 4.25E-06 4.25
N 310.86 291.46 290.87 297.73 48.85 5.69E-06 5.69
P 98.78 230.79 297.98 209.18 34.11 3.98E-06 3.98
Q 224.64 256.63 224.32 235.20 38.44 4.48E-06 4.48
R 267.17 285.13 284.47 278.92 45.72 5.33E-06 5.33
S 146.75 141.38 144.01 144.05 23.27 2.71E-06 2.71
T 260.81 260.88 297.64 273.11 44.76 5.22E-06 5.22
V 301.17 318.45 315.17 311.60 51.16 5.96E-06 5.96
W 206.44 218.05 212.27 212.25 34.62 4.04E-06 4.04
Y 296.41 296.28 304.57 299.09 49.08 5.72E-06 5.72
BASE 236.08 268.37 251.1 251.85 41.22 9.05E-07 0.91
Table 3.3. Re-designed MAX Oligonucleotide Picogreen Measurements. Picogreen measurements. 50x diluted hybridised MAX oligonucleotides were mixed with 200x diluted picogreen reagent and the fluorescence measured at 480 nm excitation and 520 nm emission. Concentration was then calculated using the standard curve from Figure 3.5.
The ligation and PCR of first cycle of the library build using redesigned MAX oligonucleotide
was performed successfully (Figure 3.6 A). Importantly the negative control in lane 1 was
clear and showed no sign of the previous contamination. Lanes 2-7 showed a product
approximately 100 bp in size, albeit extremely faint in lane 2, as expected. A smaller band of
approximately 65-70 bp was also observed in lanes 2-7. Although the presence of the
secondary product could reduce the efficiency of the MAX oligonucleotides, ligation to the
base sequence in this case it was deemed suitable to continue as the concentration of MAX
oligonucleotides used was sufficiently high to cover the relatively small theoretical library
diversity of 1.08x10³, so reduced ligation efficiency should only have a minimal effect. The

97
saturation cycling was continued successfully for a further 5 cycles according to the plan
described in Table 3.2 and the resulting PCR’s visualised on 3% agarose gels (Figure 3.6 B-
F). The lower molecular weight band was present throughout the entire process.
Figure 3.6. Saturation Cycling with Re-designed MAX Oligonucleotides. Agarose gel image of PCR products generated from each cycle ligation using redesigned MAX oligonucleotides (A: Round 1: A, G, I, L, V; B: Round 2: F, W, Y; C: Round 3: D, E; D: Round 4: N, Q, S, T; E: Round 5: H, K, R; F: Round 6: C, M, P). Lanes: 1: Negative control (no template DNA); 2-3: 1/1000 ligation dilution; 4-5: 1/100 ligation dilution; 6-7: 1/10 ligation dilution. Anticipated MW of rounds 1-6 PCR products: R1: 100 bp; R2: 103 bp; R3: 106 bp; R4: 109 bp; R5: 112 bp; R6: 115 bp. Lower molecular weight products were also observed
100 bp
75 bp 50 bp
100 bp 125 bp
50 bp
125 bp
75 bp
100 bp 125 bp
A B
C D
E F
M M 1 2 3 4 5 6 7 M M 1 2 3 4 5 6 7
M M 1 2 3 4 5 6 7 M M 1 2 3 4 5 6 7
M M 1 2 3 4 5 6 7 M M 1 2 3 4 5 6 7
50 bp 75 bp

98
during some of the rounds. Samples were electrophoresed on 3% agarose/TAE gel against 0.36 µg of Promega 25 bp step ladder.
To determine whether the saturation cycling had successfully added a codon per cycle the
PCR product of every cycle was electrophoresed on a 10% polyacrylamide gel (2.2.4.3) with
the round 1 PCR product in lane 1 through to the round 6 PCR product in lane 6 (Figure 3.7).
The increase in size of the PCR product was evident from 100 bp in round 1 to 115 bp in
round 6 showing that each cycle had added a single codon. The lower molecular weight
band that was observed throughout the process was also visible and it too showed an
increase in size throughout the saturation cycling procedure.
Figure 3.7. Six Cycle Comparison of Saturation Cycling PCR Products. Agarose gel image of the PCR products generated from each round of saturation cycling. Lanes: 1: Round 1 PCR product (100 bp); 2: Round 2 PCR product (103 bp); 3: Round 3 PCR product (106 bp); 4: Round 4 PCR product (109 bp); 5: Round 5 PCR product (112 bp); 6: Round 6 PCR product (115 bp). Correct size PCR products were seen to be increasing throughout the saturation cycling process, as well as the lower molecular weight product (~55 bp-70 bp). Samples were electrophoresed on 10% polyacrylamide/TBE gel against a Promega 25 bp step ladder.
25 bp
100 bp
125 bp
M 1 2 3 4 5 6
75 bp
50 bp

99
3.5 Completed Library Analysis
In order to assess whether the ProxiMAX process had worked successfully, the cycle 6 PCR
product, that should contain the full length 6 randomised positions, was purified (2.2.4.2),
phosphorylated (2.2.1.1), blunted-end ligated into the multiple cloning site of SmaI
phosphatased pUC19 (2.1.6.1) and sent to undergo sequencing using standard M13 primers
at the University of Birmingham’s Functional Genomics, Proteomics and Metabolomics
Facility. As it was seen to be increasing in size through the process it was deemed prudent
that the lower molecular weight product, observed in Figure 3.7, was also sent for
sequencing.
The sequencing results (Figure 3.8 A & B) showed the correct sequence for the cycle 6 MAX
donator and the base acceptor within the pUC19 multiple cloning site. These regions were
flanking a series of six codons corresponding to an appropriate MAX codon per cycle. The
“wobble” in the sequence read immediately upstream of the MAX donator sequence present
in all the sequencing results was determined to be an artefact from the sequencing reaction.
The sequencing results of the smaller molecular weight product (Figure 3.8 C) again showed
the full sequence of the cycle 6 MAX donator oligonucleotide followed by the expected
codons based on the mixes that were added at each cycle. However it only showed a partial
sequence for the base acceptor suggesting that there was a secondary primer annealing site
allowing creating of the smaller product in the first cycle of PCR. Although reduced in size
this was still able to undergo the same processes as the full size product thus creating an
array of 6 randomised codons albeit on shorter DNA framework.
This showed that the process of adding a single correct codon cycle by cycle was functioning
correctly although it was noted that in this small sample there was virtually no diversity. In
fact all showed the same codons added at each cycle apart from a glutamine (CAG) present
in round 4 of Figure 3.8 B as opposed to asparagine (AAC) seen in the others. In order to
better understand diversity of the library the undigested cycle 6 PCR product was tagged
with MiSeq primers (Table 2.4) and analysed using Illumina MiSeq next-generation
sequencing.
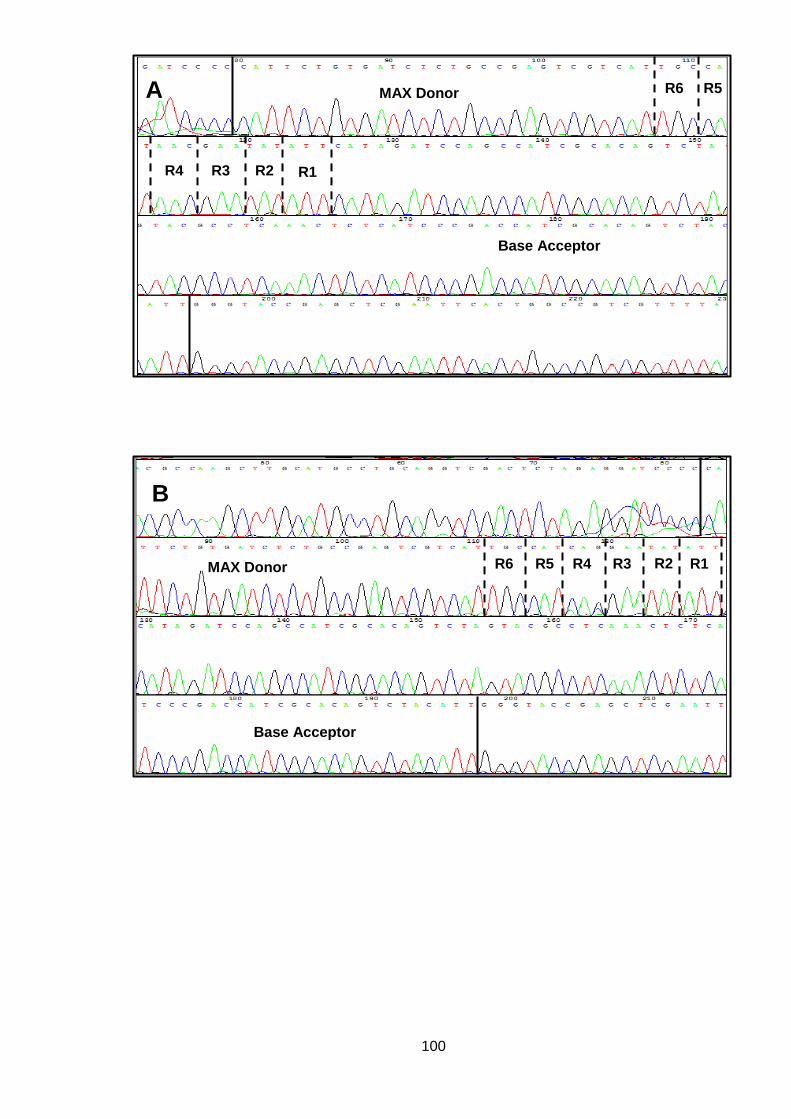
100
R6 R5
R4 R3 R2 R1
Base Acceptor
MAX Donor A
MAX Donor
Base Acceptor
B
R1 R2R3 R4 R5 R6

101
Figure 3.8. Sequencing Results Randomised Array. Round 6 PCR products were inserted into the pUC19 plasmid, transformed into Escherichia Coli DH5α and subsequently cloned. The resulting colonies were screened using colony PCR and positives were sequenced using an ABI 3730 capillary sequencer (University of Birmingham). At the 5’ end is the round 6 MAX donator region, followed by each MAX codon added by a round of saturation cycling, and the base acceptor at the 3’ end (A & B), and a partial 3’ base acceptor (C).
The MiSeq next-generation sequencing read a total of 31611 sequences with 26467 having
the correct 10 bp flanking regions. Just over 95% of those sequences were the correct length
and contained the full length library. The majority of the remaining 4.93% consisted of
sequences containing either a 1 bp deletion (4.39%) or 1 codon deletion (0.45%) (Table 3.4).
Due to the use of small subsets of codons at each cycle the theoretical expected library size
of 1.08x10³ was relatively small and the sequencing results easily covered 100% of the
library (Table 3.6).
Length Count %
18 25163 95.07%
17 1161 4.39%
15 120 0.45%
16 10 0.04%
12 6 0.02%
Table 3.4. MiSeq Library Length Distribution. The cycle 6 PCR product was tagged with MiSeq primer (Table 2.4) as described in 2.2.2.7. A total of 31611 sequences were analysed with 26467 having the correct 10 bp flanking regions. 95.07% of these sequences were the correct length with sequences containing a 1bp deletion or 1 nucleotide deletion the next highest frequency (4.39% and 0.45% respectively).
MAX Donor
Partial Base Acceptor
R6 R5 R4 R3 R2 R1
C

102
Analysis of the codon representation of each cycle however showed there was significant
bias to single codons at each position (Figure 3.9). When comparing the expected codon
representation to the observed positions 1, 2, 3 and 5 showed virtually 100% representation
of a single codon (R1: I, R2: W, R3: E, R5: H), although whilst position 4 and 6 showed
slightly more varied representation they were still significantly biased (R4: N, R6: C). Further
analysis did highlight a mistake in the R3 aspartic acid oligonucleotide explaining its
absences although all other biases appeared to be as a result of the procedure.
Figure 3.9. Codon Representation of Single Reaction Equimolar Library. Next-generation sequencing results using MiSeq tagged cycle 6 PCR products. Library was assembled as described 2.2.3 and sequenced using a MiSeq sequencer according to the manufacturer’s instructions. Data represent the analysis of 26467 sequences with the flanking region, which comprised 95.07% of correct length sequences.
Table 3.5 backed up the severe bias observed in the codon representation. A single
sequence of the library was present 16222 times (out of 25163) whereas there were only 53
unique sequences present. In total this library only represented 9.7% of its potential diversity
(Table 3.6). From this library data it was clear that although the process of codon-by-codon
additions was working correctly the library diversity and codon representation was far from
acceptable.
A
C
D
E
F
G
H
I K
L
M
N
P
Q
R
S
T V
W
Y
0%
10%
20%
30%
40%
50%
60%
70%
80%
90%
100%
Exp. Obs. Exp. Obs. Exp. Obs. Exp. Obs. Exp. Obs. Exp. Obs.
R1 R2 R3 R4 R5 R6
% C
od
on
Rep
resen
tati
on
Codon position
YWVTSRQPNMLKKIHGFEDCA

103
Occurrences Count
1 53
2 18
3 5
4 4
5 6
6 4
9 1
12 1
26 1
43 1
75 1
171 1
318 1
431 1
745 1
1315 1
4136 1
16222 1
Table 3.5. Library Sequence Diversity. The number of sequences observed and the frequency they occurred within the library. Based on a theoretical maximum diversity of 1.08x10³ and a total of 25163 read, if the library was evenly represented the most common occurrence should be ~23 copies.
Theoretical expected Library Diversity (Dmax) 1.08x10³
No. of MiSeq sequences with correct flanks & 18 nt long 25163
Expected number of variants in Sequenced library (V=Dmax(1-e^-T/Dmax))
1.08x10³
No. of different peptide sequences 105
Expected Completeness of library (V/Dmax) 100.0%
Diversity represented (No. of different sequences in library / V) 9.7%
Table 3.6. Mathematical Analysis of Library Diversity. Mathematical analysis of potential library diversity as described in (Bosley and Ostermeier, 2005). Dmax: Theoretical expected Library Diversity; V: Expected number of variants in Sequenced library.
104
3.6 Discussion
Despite the cycle-by-cycle additions working correctly the codon representation was greatly
biased. Given the theoretical library size of 1080 compared to the number of correct length
sequences read (25163), if the library was evenly represented there should be approximately
23 copies of each sequence (Table 3.5), although due to the biased codon representation
this was not the case. Due to the fact that 100% of the potential library diversity is covered by
the next generation sequencing there is no doubt that these results are correct.
Having identified the areas where codon bias, as well other issues, can be introduced it is
necessary to implement changes to the ProxiMAX process in order to minimise these. Whilst
this may initially complicate the process it is necessary in order to achieve a core goal of the
process- to produce high quality libraries with good control over codon representation.
Improvements could include, but are not limited to: 1. The use of hairpin MAX
oligonucleotides to increase stability; 2. Alternative methods of oligonucleotide quantification
to improve the accuracy of MAX oligonucleotide stock quantification; 3. Individual ligations,
rather than a single pool, of MAX oligonucleotides that are subsequently pooled after a
quantification step; 4. Optimised PCR cycle conditions to reduce the amplified bias in earlier
cycles; 5. Optimal digestion conditions to minimise any MlyI star activity; 6. A gel purification
steps after the digestion to minimise the carry-over of any unwanted products to the following
cycle. Some of these approaches will be further discussed in Chapter 4.
As this process consists of a series of sequential steps to construct the randomised regions
there are a number of specific areas the codon bias may be introduced, namely; differing
oligonucleotide quality, error in oligonucleotide concentration, T4 ligase sequence preference
during blunt end ligation, amplification bias during PCR or MlyI star activity and sequence
preference. Whilst the stock MAX oligonucleotides are supplied at a specified concentration
in truth there may be variation in the net concentration across the all the different sets. This
in combination with the likelihood that the hybridisation is not 100% efficient across the board
made it necessary to quantify the stock MAX oligonucleotides prior to use. However, error
during the quantification process can have great ramifications later and throughout the
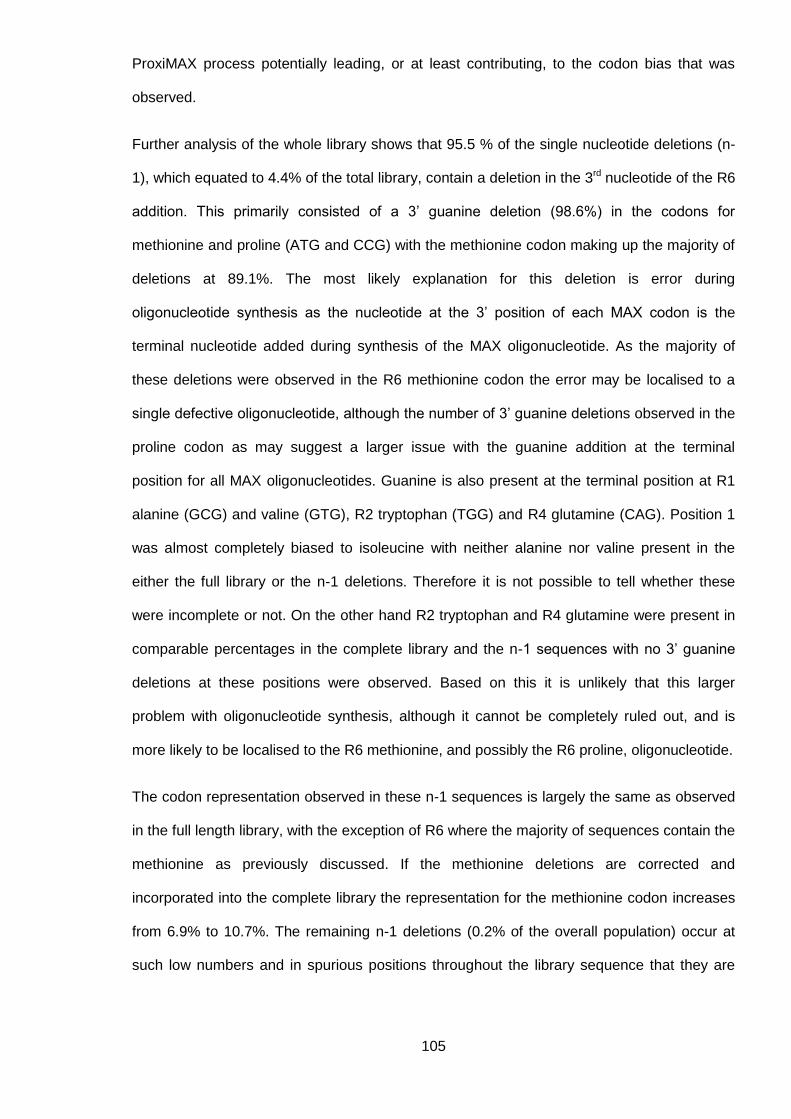
105
ProxiMAX process potentially leading, or at least contributing, to the codon bias that was
observed.
Further analysis of the whole library shows that 95.5 % of the single nucleotide deletions (n-
1), which equated to 4.4% of the total library, contain a deletion in the 3rd nucleotide of the R6
addition. This primarily consisted of a 3’ guanine deletion (98.6%) in the codons for
methionine and proline (ATG and CCG) with the methionine codon making up the majority of
deletions at 89.1%. The most likely explanation for this deletion is error during
oligonucleotide synthesis as the nucleotide at the 3’ position of each MAX codon is the
terminal nucleotide added during synthesis of the MAX oligonucleotide. As the majority of
these deletions were observed in the R6 methionine codon the error may be localised to a
single defective oligonucleotide, although the number of 3’ guanine deletions observed in the
proline codon as may suggest a larger issue with the guanine addition at the terminal
position for all MAX oligonucleotides. Guanine is also present at the terminal position at R1
alanine (GCG) and valine (GTG), R2 tryptophan (TGG) and R4 glutamine (CAG). Position 1
was almost completely biased to isoleucine with neither alanine nor valine present in the
either the full library or the n-1 deletions. Therefore it is not possible to tell whether these
were incomplete or not. On the other hand R2 tryptophan and R4 glutamine were present in
comparable percentages in the complete library and the n-1 sequences with no 3’ guanine
deletions at these positions were observed. Based on this it is unlikely that this larger
problem with oligonucleotide synthesis, although it cannot be completely ruled out, and is
more likely to be localised to the R6 methionine, and possibly the R6 proline, oligonucleotide.
The codon representation observed in these n-1 sequences is largely the same as observed
in the full length library, with the exception of R6 where the majority of sequences contain the
methionine as previously discussed. If the methionine deletions are corrected and
incorporated into the complete library the representation for the methionine codon increases
from 6.9% to 10.7%. The remaining n-1 deletions (0.2% of the overall population) occur at
such low numbers and in spurious positions throughout the library sequence that they are

106
most likely due to general error rates associated with polymerases used in PCR and
sequencing.
Error in oligonucleotide quantification may have been introduced by using the Picogreen®
assay to quantify the oligonucleotides after hybridisation. A downside to using this assay is
that the Picogreen® reagent is light sensitive and can quickly degrade, therefore
quantification measurements can be variable and may not give a true representation of the
oligonucleotide concentration. Secondly, once quantified and stored, the hybridised double-
stranded oligonucleotides may dissociate, over time, from one another causing variations in
the true concentrations of the double-stranded oligonucleotide stocks. As result of these
potential variations in oligonucleotide stock concentrations, oligonucleotides may be
comparatively over- or under-represented.
The use of T4 DNA ligase for blunt ended ligation in a single reaction of mixed
oligonucleotides was also considered as a source from which codon bias could be
introduced. As there are no apparent specificity factors involved in blunt-ended ligation one
would assume that ligase would exert itself equally on all constituent members in single
reaction of mixed oligonucleotides. However, if T4 DNA ligase demonstrates sequence
specificity and favours certain sequences/terminal codons over others this variation would be
carried through the individual cycle, and the ProxiMAX process as a whole, leading to wide
ranging codon representations and biases.
Due to the cyclical nature of PCR any bias introduced in the earlier cycles would also be
amplified exponentially during the later cycles and effectively diluting out those under
represented sequences. This may be a contributing factor to the extreme codon bias
observed in early cycles (bias in R3 due to erroneous oligonucleotide) with this reducing
slightly in the later cycles. Optimising PCR conditions and reducing the number of cycles
may help to reduce this.
Another factor that may have an effect on the procedure is the restriction digest. As is the
case with many other restriction endonucleases MlyI is susceptible to star activity/relaxed
specificity if the digestion is not carried out under optimal conditions. Factors such as high

107
enzyme concentration, ionic strength, high pH and glycerol concentration (>5%) can
contribute to star activity. In the case of MlyI it is advised by the manufacturers not to exceed
15 units/µg of DNA. Typically 10 units of MlyI were used to digest the PCR, which in turn
would typically contain ~1-5 µg of DNA, therefore as this was well within the working
guidelines star activity as a result of high enzyme concentration should be minimised. The
ionic conditions and pH should also be optimal for the digest as the PCR underwent spin
column purification prior to the digest. Finally, glycerol concentration should have minimal
effect as the final concentration in the digestion was 1% (1 µl of the enzyme, containing 50%
glycerol, in a 50 µl reaction). Taking this into account, analysis of the MiSeq data showed
that incorrect products represented <0.8% of the total library (taking in to account for the
4.2% n-1 deletions from the faulty R6 methionine oligonucleotide as previously discussed),
which is in line with general experimental error. Visual inspection of the digestions on
agarose gels showed clean digestions with no unwanted by products, although when dealing
with such short oligonucleotides an agarose gel may not be able to resolve the difference.
Therefore, based on this evidence it is unlikely that any potential star activity would have had
a significant effect on the observed codon representation, although as with any enzymatic
reaction it cannot be completely ruled out as to having a potential small contributory effect. A
more poignant question would be whether MlyI exhibits any major sequence preference
outside of its recognition sequence? Whilst due to the use of a precise recognition site, unlike
the blunt-ended ligation, it is a specific enzymatic reaction this may also be a factor that
introduces codon bias when using MlyI to digest multiple different sequences in a single
reaction.
Therefore in brief conclusion, although the process of cycle-by-cycle additions appeared to
be working correctly it was obviously necessary to further refine the process in order to
improve the codon representation at each position.

108
Chapter 4
Anti-NGF Peptide Library-ProxiMAX
Process Refinement

109
4. Chapter 4: Anti-NGF Peptide Library-ProxiMAX Process Refinement.
4.1. Introduction
An issue with the single reaction ProxiMAX method is that T4 DNA ligase appears to have
sequence preference when undertaking blunt ended ligations (Ashraf et al., 2013). Although
all enzymatic reactions may be less than 100% efficient, it was concluded that blunt ended
ligation using T4 DNA ligase was the primary enzymatic candidate for introducing codon bias
into a library as both PCR and digestion rely on specific targets (primers sequence for PCR
and recognition site for restriction digests).
Therefore, changes to the ProxiMAX methodology needed to be introduced to circumvent the
issue of ligase sequence specificity. A simple way of doing this, rather than using a single
reaction containing a mix of MAX of oligonucleotide ligating to an acceptor sequence, was to
set up multiple, single ligation reactions containing a single MAX donor that would ligate to
the acceptor. These single reactions would then be amplified separately, quantified and
mixed together at an equimolar concentration. Although this procedure may consume slightly
more time and material it was deemed beneficial.
The use of single stranded oligonucleotides was also considered to be an area where
changes could be made. Previously, after hybridisation double stranded oligonucleotides
were quantified using Quant-iT™ PicoGreen® dsDNA assay, although its sensitivity to light
may cause erroneous results. To overcome this issue, it was decided to use single stranded
oligonucleotides that would self-hybridise to form hairpins, which are subsequently quantified
by UV spectrometry. These hairpins should be more stable whilst they should also help to
reduce concatamer formation by reducing the availability of ligation positions i.e. they are
only able to ligate at one end. No nicking enzymes, to prevent concatamer formation would
be required, thus providing process simplification. The separate reaction, amplification and
quantification method should help resolve this issue too as the PCR products would be
quantified before mixing.

110
To reduce the carryover of unwanted 5’-phosphorylated products that would be suitable for
subsequent ligation, an agarose gel purification step was introduced after the MlyI digestion,
between cycles.
The refined ProxiMAX protocol is illustrated in Figure 4.1. This refined ProxiMAX protocol
was used to build a library for a monomeric anti-NGF peptide where an 11 amino acid motif
within the peptide would be targeted with different subsets of MAX codons, as described in
the following sections.
Figure 4.1. ProxiMAX Randomisation Process Illustration. Specially designed ‘MAX’ hairpins (Table 2.6) are self-hybridised. They are then individually ligated to a conserved base sequence and amplified using Phusion Hotstart II polymerase, the resulting product cleaned using QIAGEN QiaQuick kit and subsequently quantified. The cleaned products are mixed to an equimolar concentration, digested with MlyI and gel purified to remove unwanted digested material. The ligation/amplification/digestion process is repeated using the digested product of the previous cycle as the base sequence.

111
4.2. Framework and MAX Oligonucleotide Preparation
The monomeric anti-NGF peptide library was based on two anti-NGF dimeric peptides
(developed by Isogenica) shown to have a virtually identical 10 amino acid NGF-binding
motif (Figure 4.2).
Figure 4.2 Original Anti-NGF Peptide Sequence Homology. The sequence homology of the 10 amino acid NGF binding motif (exc. E before) in the original A2 and D9 peptides developed by Isogenica.
Proprietary alanine scanning and SPOT synthesis array analysis undertaken previously by
Isogenica, had identified key amino acids within both peptides that might potentially improve
the peptides’ ability to bind NGF. This proprietary data permitted a randomisation strategy,
designed in conjunction with Isogenica, as illustrated in Table 4.1 and Table 4.2 for the
production of a high affinity monomer. To aid the construction of the library it was decided to
build it concurrently in two separate fragments using both left-hand (LH) and right-hand (RH)
additions of MAX codons. The LH library had five randomised positions whilst the RH library
had six and when complete both sides would be ligated together (Figure 4.4).
Figure 4.3. Library Construction Overview. Eleven targeted randomised positions would be constructed on two separate frameworks, left and right, that were termed LH and RH respectively. ProxiMAX randomisation would be used to add an array of randomised codons to each framework (5 codons to LH and 6 codons to RH) that were ligated together to form full length library.
A2 KQEGWPAEVYEDWPSCEG
D9 EVWPAEVYQDWPFVGACG

112
LH Framework LH ProxiMAX Library
LH-6 LH-5 LH-4 LH-3 LH-2 LH-1 LH0 LH1 LH2 LH3 LH4 LH5
Codons M A A F K Q/P E GAVS WFYIVH P All (exc. C&M) NEQDKRH
No. 1 1 1 1 1 2 1 4 6 1 18 7
Table 4.1. LH Anti-NGF Peptide Library Build Overview. The identity of the corresponding groups of MAX codons using LH MAX hairpins in each cycle. The Q/P mutation added at position LH-1 was introduced by a mutagenic primer rather than ProxiMAX randomisation.
RH ProxiMAX Library RH Framework
RH6 RH5 RH4 RH3 RH2 RH1 RH0 RH-1 RH-2 RH-3
Codons VILA YWFL NEQDKRH DE WIRFY PIVL S A A A
No. 4 4 7 2 5 4 1 1 1 1
Table 4.2. RH Anti-NGF Peptide Library Build Overview. The identity of the corresponding groups of MAX codons using RH MAX hairpins in each cycle, where DNA encoding the framework sections serves as the acceptor sequence in the revised ProxiMAX process.

113
As with previous libraries, before the saturation cycling could begin, the frameworks (9.2)
needed to be prepared. The RH framework, which consisted of two full complementary single
stranded oligonucleotides of 72 bp in length, were obtained from Eurofins Genomics and
hybridised by heating to 94°C for 5 minutes followed by cooling at 1°C per min to 4°C
(2.2.2.1). The resulting product was amplified using specific primers, in a similar manner as
described in 2.2.1.4, and the amplicon subsequently gel purified (2.2.4.2.2).
However, the LH framework was required to be longer in length (152 bp), which was not
possible to create from two fully complementary single stranded oligonucleotides due to
manufacturer production limitations. In order to overcome this issue, two single stranded
oligonucleotides (90 bp and 80 bp respectively) were designed with a complementary 18 bp
at the 3’ end. These were hybridised by heating to 94°C for 5 minutes followed by cooling at
1°C per min to 4°C (2.2.2.1) and the remaining single stranded sequence filled in using DNA
Polymerase I, Large (Klenow) Fragment (2.2.1.2) (Figure 4.4). The product was amplified
using specific primers, in a similar manner as described in 2.2.1.4. In order to introduce a
point mutation at position LH-1 (Table 4.1) a second PCR reaction that was identical to the
first apart from a mutagenic primer designed to introduce the point mutation. This was
amplified alongside the first reaction under the same conditions. Both LH frameworks were
gel purified (2.2.4.2.2), quantified using a nanodrop 2000c (Thermo Scientific) and mixed to
equimolar concentrations.
Figure 4.4. LH Framework Construction Overview. RH framework was constructed by standard hybridisation of two complementary single stranded oligonucleotides (2.2.2.1) by
5’
5’
3’
3’ P
5’
5’
3’
3’ P
Left-Hand Framework

114
incubating at 94°C for 5 minutes followed by cooling at 1°C per min to 4°C. LH framework was constructed using two single stranded oligonucleotides with a 20 bp complementary region at the 3’ end, which was then filled in as described in 2.2.1.2. Frameworks were amplified by PCR (2.2.1.4) using a mutagenic primer to add the mutated position at LH-1.
To allow additions to LH and RH frameworks two different sets of MAX codon donor
oligonucleotides were required (9.2). Single stranded MAX hairpins were self-hybridised by
heating to 95°C for 2 minutes followed by ramp cooling down to 25°C over 45 minutes.
These were quantified in triplicate by UV spectrometry and diluted down to a working
concentration of 2.4 μM (Table 4.3 and Table 4.4).
Cycle 1 Cycle 2 Cycle 3
Amino Acid
Codon MW Mean ng/μl
μM Mean ng/μl
μM Mean ng/μl
μM
A GCT 26887.6 1222 45.4 1053 39.2 1057 39.3
D GAT 26886.6 1337 49.7 941 35.0 1070 39.8
E GAA 26886.6 1235 45.9 996 37.1 1010 37.6
F TTC 26886.6 1123 41.8 1001 37.2 1029 38.3
G GGC 26888.6 1098 40.8 961 35.7 1069 39.8
H CAT 26886.6 1103 41.0 987 36.7 981 36.5
I ATC 26886.6 1151 42.8 1021 38.0 1285 47.8
K AAG 26886.6 1302 48.4 1124 41.8 1279 47.6
L CTG 26887.6 1157 43.0 1010 37.6 1179 43.8
N AAC 26886.6 1143 42.5 980 36.4 1101 40.9
P CCG 26888.6 1148 42.7 939 34.9 1080 40.2
Q CAG 26887.6 1160 43.1 1000 37.2 1213 45.1
R CGT 26887.6 1132 42.1 1024 38.1 1135 42.2
S TCT 26886.6 1165 43.3 1035 38.5 1429 53.1
T ACC 26887.6 2318 86.2 1413 52.6 1284 47.8
V GTG 26887.6 2048 76.2 1061 39.5 1197 44.5
W TGG 26887.6 1830 68.1 1025 38.1 1045 38.9
Y TAC 26886.6 2074 77.1 972 36.1 1061 39.5
Table 4.3. LH Hairpin Quantification. MAX hairpins were diluted from stock to ~40 μM in 0.5x ThermoPol buffer (2.1.3.13) and self-hybridised by heating to 95°C for 2 minutes followed by ramp cooling down to 25°C over 45 minutes. Hairpins were quantified by UV spectrophotometer in triplicate and diluted down to a working concentration of 2.4 μM in 0.5x ThermoPol buffer (2.1.3.13).

115
Cycle 1 Cycle 2 Cycle 3
Amino Acid Codon MW Mean ng/μl
μM Mean ng/μl
μM Mean ng/μl
μM
A GCT 26887.6 981 36.5 1050 39.1 1010 37.5
D GAT 26887.6 1089 40.5 1213 45.1 1281 47.6
E GAA 26886.6 925 34.4 931 34.6 1063 39.5
F TTC 26886.6 992 36.9 984 36.6 1003 37.3
G GGC 26888.6 973 36.2 969 36.0 1024 38.1
H CAT 26886.6 974 36.2 1098 40.8 1058 39.3
I ATC 26886.6 933 34.7 1038 38.6 995 37.0
K AAG 26886.6 984 36.6 1024 38.1 1001 37.2
L CTG 26887.6 868 32.3 989 36.8 989 36.8
N AAC 26886.6 946 35.2 1033 38.4 1033 38.4
P CCG 26888.6 954 35.5 966 35.9 966 35.9
Q CAG 26887.6 940 35.0 1021 38.0 1021 38.0
R CGT 26887.6 908 33.8 974 36.2 974 36.2
S TCT 26886.6 987 36.7 989 36.8 989 36.8
T ACC 26887.6 934 34.7 944 35.1 944 35.1
V GTG 26887.6 858 31.9 977 36.3 977 36.3
W TGG 26887.6 948 35.3 1034 38.5 1038 38.6
Y TAC 26886.6 879 32.7 962 35.8 1079 40.1
Table 4.4. RH Hairpin Quantification. MAX hairpins were diluted from stock to ~40 μM in 0.5x ThermoPol buffer (2.1.3.13) and self-hybridised by heating to 95°C for 2 minutes followed by ramp cooling down to 25°C over 45 minutes. Hairpins were quantified by UV spectrophotometer in triplicate and diluted down to a working concentration of 2.4 μM with 0.5x ThermoPol buffer (2.1.3.13).
4.3. ProxiMAX Saturation Cycling of Anti-NGF Peptide Library
Once the MAX hairpins and library frameworks were prepared, the saturation cycling process
could begin on both library fragments. To start the LH library, the 152 bp LH framework was
ligated separately to the appropriate 36 bp MAX hairpins, according the LH library design in
Table 4.1 (2.2.3.2), to form a fragment with a sequence length of 188 bp. The individual
ligations were subsequently amplified separately (2.2.3.3) using the appropriate LH universal
and cycle primers (Table 2.6) and examined by 3% agarose gel electrophoresis (2.2.4.1), as
shown in Figure 4.5 A. Lanes 2-5 show the various MAX hairpin::LH framework PCR
products. The pixel density of the individual PCR products was analysed using ImageJ
software to give a relative concentration of each product. Based on these relative

116
concentrations, the PCR reactions were mixed at varying proportions in order to form an
equimolar mix of MAX hairpin: LH framework complexes. The equimolar mix of PCR
products was then digested with MlyI (2.2.2.6) forming two fragments with lengths 155 bp
and 33 bp respectively and the larger sized fragment was gel purified (2.2.4.2). This gel-
purified DNA fragment was used as the acceptor for the second cycle and the whole process
was continued iteratively for a total of five cycles (Figure 4.5 B-D). As illustrated in Table 4.1
the LH3 position was only a single addition (due to critical importance in the peptides’
activity) and unlike with the other cycles not quantified and hence is not shown.
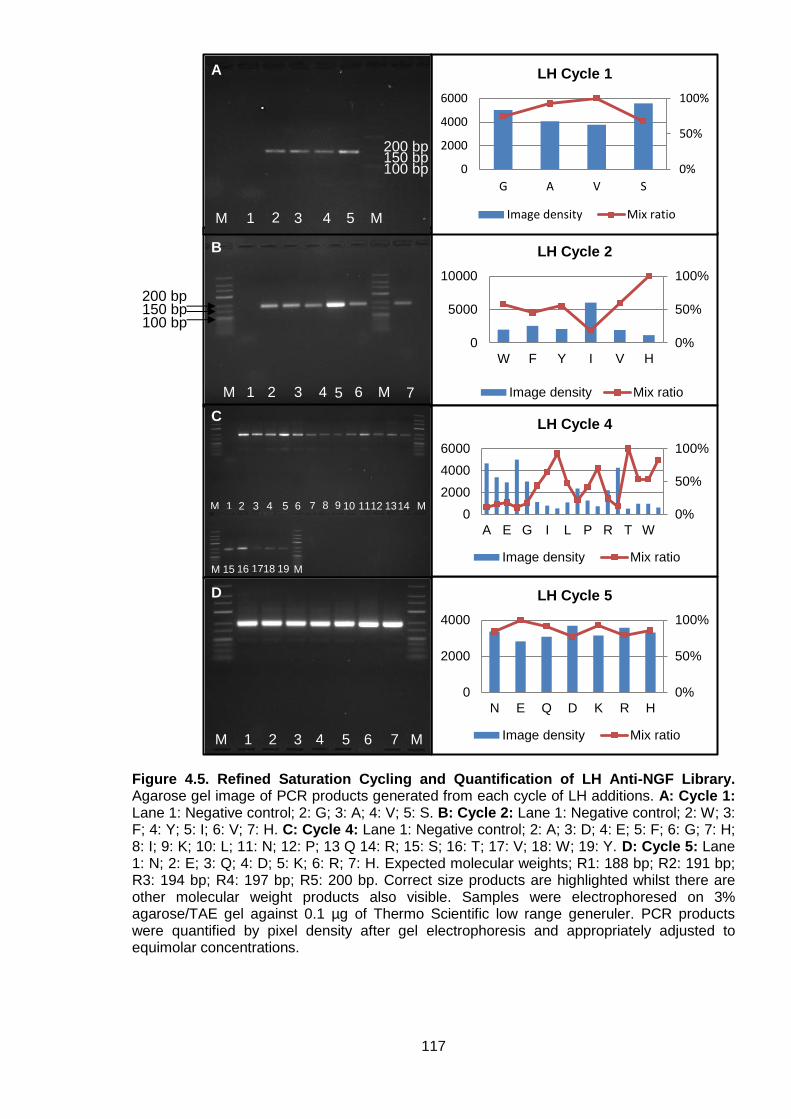
117
Figure 4.5. Refined Saturation Cycling and Quantification of LH Anti-NGF Library. Agarose gel image of PCR products generated from each cycle of LH additions. A: Cycle 1: Lane 1: Negative control; 2: G; 3: A; 4: V; 5: S. B: Cycle 2: Lane 1: Negative control; 2: W; 3: F; 4: Y; 5: I; 6: V; 7: H. C: Cycle 4: Lane 1: Negative control; 2: A; 3: D; 4: E; 5: F; 6: G; 7: H; 8: I; 9: K; 10: L; 11: N; 12: P; 13 Q 14: R; 15: S; 16: T; 17: V; 18: W; 19: Y. D: Cycle 5: Lane 1: N; 2: E; 3: Q; 4: D; 5: K; 6: R; 7: H. Expected molecular weights; R1: 188 bp; R2: 191 bp; R3: 194 bp; R4: 197 bp; R5: 200 bp. Correct size products are highlighted whilst there are other molecular weight products also visible. Samples were electrophoresed on 3% agarose/TAE gel against 0.1 µg of Thermo Scientific low range generuler. PCR products were quantified by pixel density after gel electrophoresis and appropriately adjusted to equimolar concentrations.
0%
50%
100%
0
2000
4000
N E Q D K R H
LH Cycle 5
Image density Mix ratio
0%
50%
100%
0
5000
10000
W F Y I V H
LH Cycle 2
Image density Mix ratio
0%
50%
100%
0
2000
4000
6000
G A V S
LH Cycle 1
Image density Mix ratio
0%
50%
100%
0
2000
4000
6000
A E G I L P R T W
LH Cycle 4
Image density Mix ratio
A
B
C
D
M 1 2 3 4 5 6 7
M M 1 2 3 4 5
M
M 1 2 3 4 5 6 7 9 11 13 14 M
M M 15 16 17 18 19
8 10 12
M 1 2 3 4 5 6 7 M
200 bp 150 bp 100 bp
200 bp 150 bp 100 bp

118
Both the LH and RH libraries were constructed concurrently. The RH library framework of 72
bp was ligated separately to the appropriate 36 bp MAX hairpins, according the RH library
design in Table 4.2 (2.2.3.2), to form a fragment with a sequence length of 108 bp. The
individual ligations were subsequently amplified separately (2.2.3.3) using the appropriate
RH universal and cycle primers (Table 2.6) and examined by 3% agarose gel electrophoresis
(2.2.4.1), as shown in Figure 4.6 A. Lanes 2-5 show the various MAX hairpin: RH framework
PCR products. Some minor products with higher and lower molecular weight products are
also visible. The pixel density of the individual PCR products was analysed using ImageJ
software to give a relative concentration of each product from which the PCRs reactions
were mixed at varying proportions in order to form an equimolar mix. This was then digested
with MlyI (2.2.2.6) forming two fragments with lengths 75 bp and 33 bp respectively and the
larger sized fragment was gel purified (2.2.4.2).
This gel purified DNA fragment was used as the acceptor for the second cycle and the whole
process was continued iteratively for a total of six cycles (Figure 4.6 B-F). Secondary
products of both higher and lower molecular weights were observed throughout the process
suggesting possible secondary primer annealing sites or concatamer formation although the
quantification and purification steps should negate their overall impact.

119
100 bp
0%
50%
100%
0
5000
10000
Y W F L
RH Cycle 5
Image density Mix ratio
0%
50%
100%
0
2000
4000
P I V L
RH Cycle 1
Image density Mix ratio
0%
50%
100%
0
2000
4000
W I R F Y
RH Cycle 2
Image density Mix ratio
0%
50%
100%
0
2000
4000
6000
8000
D E
RH Cycle 3
Image density Mix ratio
0%
50%
100%
0
5000
10000
N E Q D K R H
RH Cycle 4
Image density Mix ratio
0%
50%
100%
0
5000
10000
V I L A
RH Cycle 6
Image density Mix ratio
A
B
C
D
E
F
M M 1 2 3 4 5
M M 2 3 4 5 1 6
M M 2 3 1
M M 2 3 4 5 1 6 7 8
M M 2 3 4 5 1
M M 2 3 4 5 1
150 bp
75 bp 50 bp

120
Figure 4.6. Refined Saturation Cycling and Quantification of RH Anti-NGF Library. Agarose gel image of PCR products generated from each cycle of RH additions. A: Cycle 1: Lane 1: Negative control; 2: P; 3: I; 4: V; 5: L. B: Cycle 2: Lane 1: Negative control; 2: W; 3: I; 4: R; 5: F; 6: Y. C: Cycle 3: Lane 1: Negative control; 2: D; 3: E. D: Cycle 4: Lane: 1: N; 2: E; 3: Q; 4: D; 5: K; 6: R; 7: H; 8: Negative control. E: Cycle 5: Lane 1: Negative control; 2: Y; 3: W; 4: F; 5: L. B: Cycle 6: Lane 1: V; 2: I; 3: L; 4: A; 5: Negative control. Expected molecular weights; R1: 108 bp; R2: 111 bp; R3: 114 bp; R4: 117 bp; R5: 120 bp; R6: 123 bp. Correct size products are highlighted whilst there are other molecular weight products also visible. Samples were electrophoresed on 3% agarose/TAE gel against 0.1 µg of Thermo Scientific low range generuler. PCR products were quantified by pixel density after gel electrophoresis and appropriately adjusted to equimolar concentrations.
To determine whether the saturation cycling had successfully added a codon per cycle the
PCR product of every cycle was electrophoresed on a 10% polyacrylamide gel (2.2.4.3), with
the round 1 PCR product in lane 1 through to the round 6 PCR product in lane 6 (Figure 4.7
A). The increase in size of the PCR product was evident from 108 bp in cycle 1 to 120 bp in
cycle 5 showing that each cycle had added a single codon. Unfortunately the cycle 6 product
was mis-loaded and was not visible on the gel, although its size had been confirmed
previously from the agarose gel electrophoresis to be approximately correct. As these were
un-purified mixes of the PCR products some different molecular weight products are also
visible across the lanes. Unfortunately due to its larger size it was not possible to resolve a
3bp difference between LH library PCR products.
Once both LH and RH library fragments were complete they were blunt end ligated to each
other (2.2.1.3) to form a full length library sequence of 257 bp, which was amplified by PCR
(2.2.1.4) and electrophoresed (2.2.4.1) (Figure 4.7 B). This was subsequently tagged with
MiSeq primers (2.2.2.7, Table 2.5) and sent for next-generation sequencing.

121
Figure 4.7. RH 6 cycle comparison and LH+RH ligation. A: Polyacrylamide gel image of the RH PCR products from every saturation cycling round. Lanes: 1: Round 1 PCR product; 2: Round 2 PCR product; 3: Round 3 PCR product; 4: Round 4 PCR product; 5: Round 5 PCR product; 6: Round 6 PCR product. Expected molecular weights; R1: 108 bp; R2: 111 bp; R3: 114 bp; R4: 117 bp; R5: 120 bp; R6: 123 bp. The molecular weight of the PCR products is seen to be increasing the saturation cycling progresses (R6 PCR product in lane 6 was misloaded so is not visible).Samples were electrophoresed on 10% polyacrylamide/TBE gel against a Thermo Scientific low range generuler. B: Agarose gel image of ligated LH and RH library fragments. Lanes: 1: Negative control (no template DNA); 2-3: PCR products of LH + RH ligation. Samples were electrophoresed on 2% agarose/TAE gel against 0.5 µg of Thermo scientific 50 bp ladder.
4.4. Completed Anti-NGF Peptide Library Analysis
The MiSeq next-generation sequencing read a total of 321340 sequences with 281289
having the correct 10 bp flanking regions. Based on the way NGS data was analysed the
length of read corresponding to the full length library should be 72 bp. As demonstrated in
Table 4.5, only 5.0% of the correctly-flanked sequences contained the full length library (72
bp) with its corresponding 1bp deletion and 1 codon deletion equating to 0.9% and 1.7%
respectively (Table 4.5). The majority of the library consisted of truncated sequences making
up 61.4% of the sequences read with its corresponding 1 bp deletion (9.0%) or 1 codon
deletion (8.7%) the next two most frequent.
150bp
250bp
M 1 2 3 4 5 6
A
M
B
M 1 2 3 M
100bp
150bp
100bp
50bp
200bp
300bp
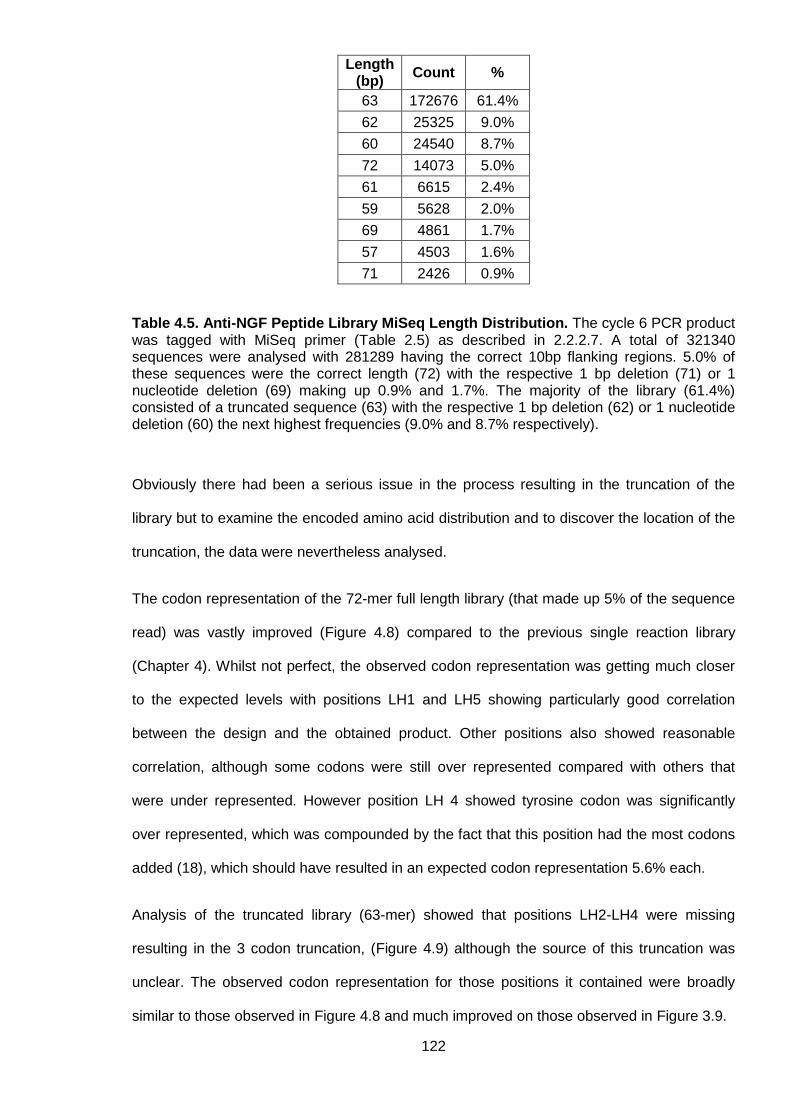
122
Length (bp)
Count %
63 172676 61.4%
62 25325 9.0%
60 24540 8.7%
72 14073 5.0%
61 6615 2.4%
59 5628 2.0%
69 4861 1.7%
57 4503 1.6%
71 2426 0.9%
Table 4.5. Anti-NGF Peptide Library MiSeq Length Distribution. The cycle 6 PCR product was tagged with MiSeq primer (Table 2.5) as described in 2.2.2.7. A total of 321340 sequences were analysed with 281289 having the correct 10bp flanking regions. 5.0% of these sequences were the correct length (72) with the respective 1 bp deletion (71) or 1 nucleotide deletion (69) making up 0.9% and 1.7%. The majority of the library (61.4%) consisted of a truncated sequence (63) with the respective 1 bp deletion (62) or 1 nucleotide deletion (60) the next highest frequencies (9.0% and 8.7% respectively).
Obviously there had been a serious issue in the process resulting in the truncation of the
library but to examine the encoded amino acid distribution and to discover the location of the
truncation, the data were nevertheless analysed.
The codon representation of the 72-mer full length library (that made up 5% of the sequence
read) was vastly improved (Figure 4.8) compared to the previous single reaction library
(Chapter 4). Whilst not perfect, the observed codon representation was getting much closer
to the expected levels with positions LH1 and LH5 showing particularly good correlation
between the design and the obtained product. Other positions also showed reasonable
correlation, although some codons were still over represented compared with others that
were under represented. However position LH 4 showed tyrosine codon was significantly
over represented, which was compounded by the fact that this position had the most codons
added (18), which should have resulted in an expected codon representation 5.6% each.
Analysis of the truncated library (63-mer) showed that positions LH2-LH4 were missing
resulting in the 3 codon truncation, (Figure 4.9) although the source of this truncation was
unclear. The observed codon representation for those positions it contained were broadly
similar to those observed in Figure 4.8 and much improved on those observed in Figure 3.9.

123
Figure 4.8. Codon Representation of Full length (72-mer) Anti-NGF Peptide Library. Next-generation sequencing results using MiSeq tagged cycle 6 PCR products. Library was assembled as described in 2.2.3 and sequenced using a MiSeq sequencer according to the manufacturer’s instructions. Expected codon representation is compared to observed codon representation and data represents the analysis of 281289 sequences with the flanking region, which comprised 5.0% of correct length sequences.
A
A
A D D D
D
E
E E
E
F
F
F F
G
G H
H
H H
I
I I
I
I
K
K K L
L
L L
N
N N
P
P
P P
Q
Q
Q Q
R
R R
R
S
S
T
V
V
V V V
W
W
W
W
Y
Y
Y Y
0.0%
10.0%
20.0%
30.0%
40.0%
50.0%
60.0%
70.0%
80.0%
90.0%
100.0%
Exp Obs Exp Obs Exp Obs Exp Obs Exp Obs Exp Obs Exp Obs Exp Obs Exp Obs Exp Obs Exp Obs Exp Obs
LH-1 LH R1 LH R2 LH R3 LH R4 LH R5 RH R6 RH R5 RH R4 RH R3 RH R2 RH R1
% C
od
on
Re
pre
se
nta
tio
n
Codon Position
Y
W
V
T
S
R
Q
P
N
M
L
K
I
H
G
F
E
D
C
A

124
Figure 4.9. Codon Representation of Truncated (63-mer) Anti-NGF Peptide Library. Next-generation sequencing results using MiSeq tagged cycle 6 PCR products. Library was assembled as described in 2.2.3 and sequenced using a MiSeq sequencer according to the manufacturer’s instructions. Expected codon representation is compared to observed codon representation and data represents the analysis of 281289 sequences with the flanking region, which comprised 61.4% of correct length sequences.
A A
D D
D E E
E
F F
G H H I
I
I
K K
L
L L
N N
P
P
Q Q Q
R R
R
S
V V V
W
W
Y Y
0%
10%
20%
30%
40%
50%
60%
70%
80%
90%
100%
Exp Obs Exp Obs Exp Obs Exp Obs Exp Obs Exp Obs Exp Obs Exp Obs Exp Obs Exp Obs Exp Obs Exp Obs
LH-1 LH1 LH2 LH3 LH4 LH5 RH6 RH5 RH4 RH3 RH2 RH1
% C
od
on
Re
pre
se
nta
tio
n
Codon Position
Y
W
V
T
S
R
Q
P
N
M
L
K
I
H
G
F
E
D
C
A

125
Mathematical analysis of the sequencing data suggested that the full length (72-mer) library
represented close to 87% diversity in those sequences read (Table 4.6), although the 14073
sequences that corresponded to this only covered 0.1% of the theoretical diversity of the
library. In contrast, even by adjusting the theoretical diversity of the truncated library to take
into account for those missing positions the diversity represented was only 42.7% (Table
4.6). Finally, just fewer than 92% of the sequences that corresponded to the full length
occurred only once compared to 70% for the truncated library (Table 4.7).
72-mer 63-mer
Theoretical expected Library Diversity (Dmax) 2.70x10⁷ 2.51x10⁵
No. of MiSeq sequences with correct flanks & 72/63 nt long 14073 172676
Expected number of variants in Sequenced library (V=Dmax(1-e^-T/Dmax))
1.41x10⁴ 1.25x10⁵
No. of different peptide sequences 12228 53341
Expected Completeness of library (V/Dmax) 0.1% 49.8%
Diversity represented (No. of different sequences in library / V) 86.9% 42.7%
Table 4.6. Mathematical Analysis of Anti-NGF Peptide Library Diversity. Mathematical analysis of potential library diversity as described in (Bosley and Ostermeier, 2005). Dmax: Theoretical expected Library Diversity; V: Expected number of variants in Sequenced library.
72-mer 63-mer
Occurrences Count Percentage Count Percentage
1 11238 91.9% 37641 70.6%
2 663 5.4% 6101 11.4%
3 164 1.3% 2665 5.0%
4 60 0.5% 1511 2.8%
5 35 0.3% 1017 1.9%
6 21 0.2% 729 1.4%
7 15 0.1% 515 1.0%
Table 4.7. Anti-NGF Peptide Library Sequence Diversity for 72-mer and 63-mer. The number of times the same sequence was observed and the frequency they occurred within the library.

126
The truncation was not observed during the library build because the difference in size was
too large to resolve on either agarose or polyacrylamide gel electrophoresis. To overcome
the issue of resolving power and to investigate where/when the truncation had occurred, an
LH internal primer was designed for use in analytical gels. When used in conjunction with the
appropriate MAX primers this would shorten the LH framework whilst keeping the saturated
portion intact thus creating a PCR product small enough to give resolution between the
difference between cycles.
PCR product from every LH cycle were amplified (2.2.1.4) with the LH internal primer an
appropriate cycle primer and was electrophoresed on a 10% polyacrylamide gel (2.2.4.3)
(Figure 4.10). Lanes: 1-2: Cycle 1 PCR product; 3-4: Cycle 2 PCR product; 5: Cycle 3 PCR
product; 6-7: Cycle 4 PCR product; 8-9: Cycle 5 PCR product. Cycles 1, 2 and 3 looked
normal (70bp, 73bp and 76bp respectively), however in cycle 4 a smaller molecular weight
product (the truncated library) appeared below the expected band and this was then
preferentially amplified in the final cycle.
Figure 4.10. LH Internal Amplification Cycle Comparison. Polyacylamide gel image of LH PCR products from each round of the saturation cycling process. To enable resolution on a polyacrylamide gel the LH framework was shortened using an internal primmer whilst leaving the randomised portion unaltered. Lanes: 1-2: Round 1 PCR product; 3-4: Round 2 PCR product; 5: Round 3 PCR product; 6-7: Round 4 PCR product; 8-9: Round 5 PCR product. Expected molecular weights; R1: 65 bp; R2: 68 bp; R3: 71 bp; R4: 74 bp; R5: 77 bp. Expected PCR products, underlined white are seen to be increasing in size throughout the process. Lower molecular weight products, underlined red, are generated in round 4 (lanes
M 1 2 3 4 5 6 7 8 9 M
50bp
75bp
100bp

127
6-7) and begin to increase in size. The products were electrophoresed on 10% polyacrylamide/TBE gel against a Thermo Scientific low range generuler. The gel was stained with a 1x TBE/ethidium bromide buffer (final concentration of 0.5 µg/ml) for 10 minutes and imaged.
4.5. ProxiMAX Saturation Cycling of Resynthesized LH Anti-NGF Peptide Library
Due to the truncation in the LH library and significant bias observed in the LH4 position of the
full length library it was decided that the LH library should be re-synthesised to overcome
these issues. Although not perfect it was decided that the RH library was at an acceptable
level of representation, so that no further action was required. Once the new LH library had
been generated, it would be ligated to the original RH library to form the complete, full-length
anti-NGF library.
Analysing the codon representation from the previous library (Figure 4.8 and Figure 4.9) it
was thought that some of the bias may be as a result of the method of quantification.
Although quantification by pixel density allows a relative comparison between bands on a
gel, error can still be introduced. This may either be from error in initial sample pipetting or
from gel loading, thus creating bias in the final library. Therefore it was decided to change the
quantification method to measuring the DNA concentration using a nanodrop 2000c.
Once again, the 152 bp LH framework was ligated separately to the appropriate 36 bp MAX
hairpins, according the LH library design in Table 4.1 (2.2.3.2), to form a fragment with a
sequence length of 188 bp. The individual ligations were subsequently amplified separately
(2.2.3.3) using the appropriate LH universal and cycle primers (Table 2.6) and examined by
3% agarose gel electrophoresis (2.2.4.1) (Figure 4.5). Based on the concentrations
determined by nanodrop analysis, the PCR reactions were mixed at varying proportions in
order to form an equimolar mix of MAX hairpin: LH framework complexes (Figure 4.11). The
equimolar mix of PCR products was then digested with MlyI (2.2.2.6) forming two fragments
with lengths 155 bp and 33 bp respectively and the larger sized fragment was gel purified
(2.2.4.2). This gel purified DNA fragment was used as the acceptor for the second cycle and
the whole process was continued iteratively for a total of five cycles (Figure 4.5 B-D).

128
0%
20%
40%
60%
80%
100%
0
5
10
15
20
25
G A V S
[DN
A]
ng
/ul
Codon
LH Cycle 1
Nanodrop ng/ul Mix ratio
0%
50%
100%
0
10
20
30
W F Y I V H
[DN
A]
ng
/ul
Codon
LH Cycle 2
Nanodrop ng/ul Mix ratio
0%
50%
100%
0
20
40
60
80
A D E F G H I K L N P Q R S T V W Y
[DN
A]
ng
/ul
Codon
LH Cycle 4
Nanodrop ng/ul Mix ratio
0%
50%
100%
0
20
40
60
80
N E Q D K R H
[DN
A]
ng
/ul
Codon
LH Cycle 5
Nanodrop ng/ul Mix ratio
LH1 LH2 LH3 LH4 LH5
A GCT 15.5 40.5
C TGC
D GAT 14.2 56.7
E GAA 24.8 38.6
F TTC 16.0 34.4
G GGC 14.7 38.4
H CAT 21.9 37.3 55.2
I ATC 15.3 27.6
K AAG 66.0 42.9
L CTG 52.9
M ATG
N AAC 41.2 33.1
P CCG 22.1 43.0
Q CAG 52.9 42.8
R CGT 55.2 57.8
S TCT 21.3 47.0
T ACC 55.0
V GTG 17.8 28.1 49.2
W TGG 19.0 36.1
Y TAC 19.7 40.2
MAX
Codons
[DNA] ng/ul
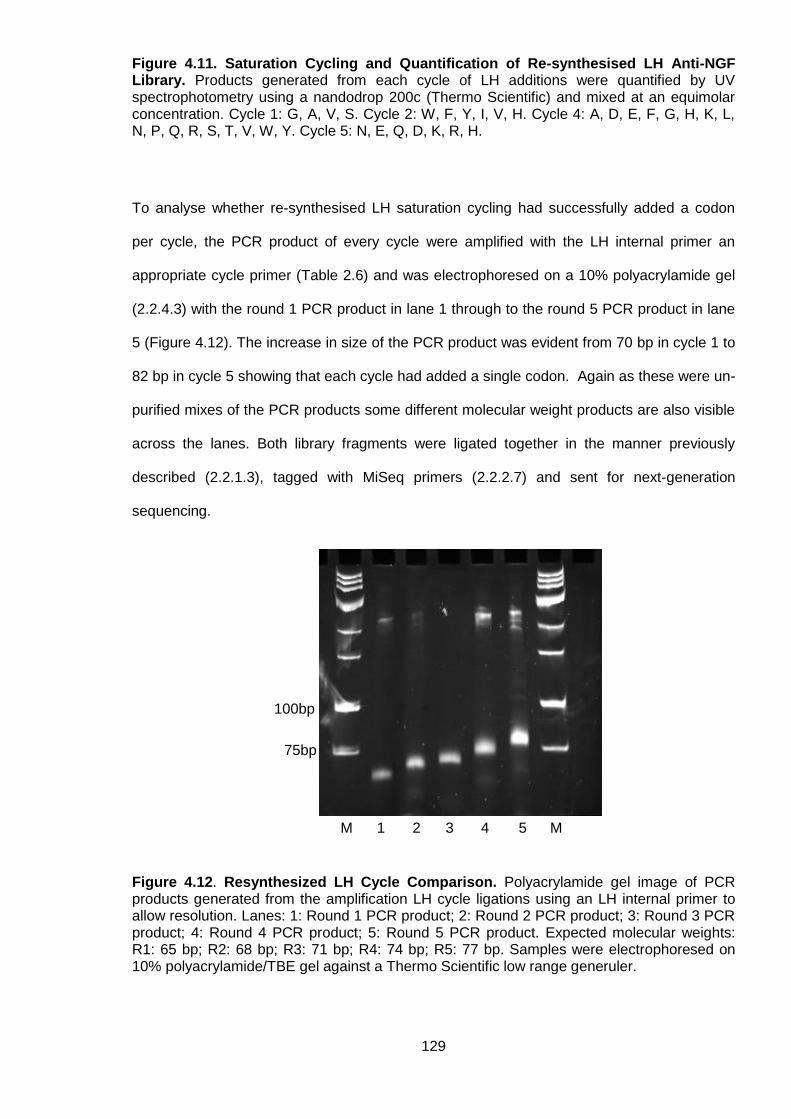
129
Figure 4.11. Saturation Cycling and Quantification of Re-synthesised LH Anti-NGF Library. Products generated from each cycle of LH additions were quantified by UV spectrophotometry using a nandodrop 200c (Thermo Scientific) and mixed at an equimolar concentration. Cycle 1: G, A, V, S. Cycle 2: W, F, Y, I, V, H. Cycle 4: A, D, E, F, G, H, K, L, N, P, Q, R, S, T, V, W, Y. Cycle 5: N, E, Q, D, K, R, H.
To analyse whether re-synthesised LH saturation cycling had successfully added a codon
per cycle, the PCR product of every cycle were amplified with the LH internal primer an
appropriate cycle primer (Table 2.6) and was electrophoresed on a 10% polyacrylamide gel
(2.2.4.3) with the round 1 PCR product in lane 1 through to the round 5 PCR product in lane
5 (Figure 4.12). The increase in size of the PCR product was evident from 70 bp in cycle 1 to
82 bp in cycle 5 showing that each cycle had added a single codon. Again as these were un-
purified mixes of the PCR products some different molecular weight products are also visible
across the lanes. Both library fragments were ligated together in the manner previously
described (2.2.1.3), tagged with MiSeq primers (2.2.2.7) and sent for next-generation
sequencing.
Figure 4.12. Resynthesized LH Cycle Comparison. Polyacrylamide gel image of PCR products generated from the amplification LH cycle ligations using an LH internal primer to allow resolution. Lanes: 1: Round 1 PCR product; 2: Round 2 PCR product; 3: Round 3 PCR product; 4: Round 4 PCR product; 5: Round 5 PCR product. Expected molecular weights: R1: 65 bp; R2: 68 bp; R3: 71 bp; R4: 74 bp; R5: 77 bp. Samples were electrophoresed on 10% polyacrylamide/TBE gel against a Thermo Scientific low range generuler.
75bp
M 1 2 3 4 5 M
100bp

130
4.6. Resynthesized LH Anti-NGF Peptide Library Analysis
The MiSeq next-generation sequencing read a total of 589734 sequences with 458911
having the correct 10 bp flanking regions. Based on the way NGS data was analysed the
length of read corresponding to the full length library should be 72 bp. This showed that
71.0% of those sequences were the correct length and contained the full length library (72
bp) with its corresponding 1 bp deletion (71 bp) and 1 codon deletion (69 bp) equating to
13.2% and 5.2% of total flanked sequences respectively (Table 4.8).
Length (bp)
Frequency %
72 326047 71.0%
71 60684 13.2%
69 23743 5.2%
70 14080 3.1%
68 6666 1.5%
63 6628 1.4%
Table 4.8. Re-synthesised LH Anti-NGF Peptide Library MiSeq Length Distribution. The cycle 6 PCR product was tagged with MiSeq primer (Table 2.5) as described in 2.2.2.7. A total of 589734 sequences were analysed with 458911 having the correct 10bp flanking regions. 71.0% of these sequences were the correct length with sequences containing a 1bp deletion or 1 nucleotide deletion the next highest frequency (13.2% and 5.2% respectively).
As the same RH library was used as in the previous full-length library construction (4.4) the
codon representation for the RH section remained the same. Codon representation in the LH
library was improved Figure 4.13) when compared to previous libraries, with the exception of
LH-1 position. Position LH4 showed much a better balance in observed codon representation
between the 18 used and was in general closer to the expected values. Positions LH1, 2,
and 5 were also showed improvement although they showed a remarkable similarity in the
codon bias to those seen in Figure 4.8, albeit in reduced levels.

131
Figure 4.13. Codon Representation of Re-synthesised LH Anti-NGF Peptide Library. Next-generation sequencing results using MiSeq tagged cycle 6 PCR products. Library was assembled as described 2.2.3 and sequenced using a MiSeq sequencer according to the manufacturer’s instructions. Expected codon representation is compared to observed codon representation and data represents the analysis of 589734 sequences with the flanking region, which comprised 71.0% of correct length sequences.
A
A
A D D D
D
E
E E
E
F
F
F F
G
G H
H
H H
I
I I
I
I
K
K K L
L
L L
N
N N
P
P
P P
Q
Q
Q Q
R
R R
R
S
S
T
V
V
V V V
W
W
W
W
Y
Y
Y Y
0%
10%
20%
30%
40%
50%
60%
70%
80%
90%
100%
Exp Obsv Exp Obsv Exp Obsv Exp Obsv Exp Obsv Exp Obsv Exp Obsv Exp Obsv Exp Obsv Exp Obsv Exp Obsv Exp Obsv
LH-1 LH1 LH2 LH3 LH4 LH5 RH6 RH5 RH4 RH3 RH2 RH1
% C
od
on
Re
pre
se
nta
tio
n
Codon Position
Y
W
V
T
S
R
Q
P
N
M
L
K
I
H
G
F
E
D
C
A

132
Mathematical analysis of the sequencing data suggested that the full length (72-mer) library
represented 69.1% diversity (Table 4.9), with the 326047 sequences that corresponding to
1.2% coverage of the theoretical diversity of the library. Within the library 81.3% of the
sequences that corresponded to the full length occurred only once (Table 4.10) with
duplicate (10. 5%) and triplicate (3.5%) sequence occurrences the next frequent.
Theoretical expected Library Diversity (Dmax) 2.70x10⁷
No. of MiSeq sequences with flanks & 72 nt long 326047
Expected number of variants in Sequenced library (V=Dmax(1-e^-T/Dmax))
3.24x10⁵
No. of different peptide sequences 222683
Expected Completeness of library (V/Dmax) 1.2%
Diversity represented (No. of different sequences in library / V) 68.7%
Table 4.9. Mathematical Analysis of Re-syntehesisied LH Anti-NGF Peptide Library Diversity. Mathematical analysis of potential library diversity as described in (Bosley and Ostermeier, 2005). Dmax: Theoretical expected Library Diversity; V: Expected number of variants in Sequenced library.
Occurrences Count Percentage
1 181014 81.3%
2 23278 10.5%
3 7832 3.5%
4 3542 1.6%
5 2078 0.9%
Table 4.10. Re-synthesised LH Anti-NGF Peptide Library Sequence Diversity. The number of times the same sequence was observed and the frequency they occurred within the LH library.
133
4.7. Discussion
Despite the truncation in the first attempt of building the ant-NGF peptide library the observed
codon representation was greatly improved compared to the previous library (chapter 3),
which showed that refinement of the ProxiMAX process had been largely successful.
The truncation observed in Figure 4.9 appeared to be caused by the carry-over of un-
digested material from the first cycle product through cycles 2 and 3. The sequential use of 3
sets of MAX oligonucleotides (Cycle1: set 1; Cycle 2: set 2; Cycle 3: set 3; Cycle 4: set 1;
Cycle 5: set 2) meant that in cycle 4 this (cycle 1) sequence was amplified (Figure 4.10)
when its complementary primers were introduced. This was still only present in low
concentrations after PCR in cycle 4 due to dilution through the cycles 2 and 3. This truncated
product would then have been digested in cycle 4 and the process resumed for the position 5
codon to be added. Despite the gel purification of the MlyI digestion, due to a lack of
resolving power from agarose gels there was obviously come carryover. PAGE purification
may be a more appropriate purification method when dealing with such small size
differences.
Despite an extremely biased LH4 position, with a represented library diversity of 86.9%
(Table 4.6) the full length 72-mer library results from the initial synthesis (4.4) looked
extremely encouraging. However as these sequences only made up 5% of all the sequences
read (Table 4.5) it only equated to 0.1% coverage of the library, so should considered with
caution. In contrast, the truncated library was poor, showing a represented diversity of 49.8%
with 42.7% coverage (Table 4.7), when taking into account for a reduced library size of
2.51x10⁵. With a higher percentage of library coverage these results can be taken as more
accurate representation, although the codon representation for those positions present in
both the 72-mer and 63-mer showed reasonable similarity.
In contrast, the represented diversity of the final anti-NGF peptide library (Table 4.9) was
good (68.7%) with 1.2% of the potential library covered. In this case the bias observed in the
LH-1 position is due to an error introducing a primer- directed randomised codon rather than
using ProxiMAX randomisation. However, the RH portion of this library was the same as that

134
in the truncated 63-mer and both show remarkable similarity adding validity to the
consistency of sequencing data.
In both libraries the percentage of n-1 deletions are the high end of what is
expected/accepted with a combined 9.9% for the 63/72mer library and 13.2% for the final
library. Whilst broadly similar, the increased n-1 percentage in the final library may be in part
due to use of first RH library portion that had been in storage whilst the new LH portion was
synthesised. This increased time in storage may have facilitated the deterioration of some
the sequences leading to increase n-1 sequences when the two library portions were ligated.
Having said that, the high percentages in both libraries could also indicate the stock
oligonucleotides, whether them being framework oligonucleotides or MAX oligonucleotides,
may contain truncated. The most likely source is the LH library framework due to the filling-
out reactions used to generate it (Figure 4.4), although it may be the case that other
oligonucleotides contained errors introduced during their synthesis.
Interestingly, while the use of separate ligation reactions did help negate the influence of T4
DNA ligase sequence preference allowing the observed and expected codon representations
to align more closely there was still variations observed throughout the library (in particular
the LH portion of Figure 4.13). Therefore the poignant question is whether these differences
are down to general experimental error or are they indicative larger problems associated with
other areas of the process where this bias may be introduced? Obviously once the individual
PCR products are quantified and pooled there is the chance for the MlyI digestion to
potentially introduce codon bias, either through <100% reaction efficiency or possible
sequence preference, that is then carried through to the following cycle. However, the
sporadic nature of these variations in codon representations from cycle to cycle do not seem
to follow an obvious pattern (unlike the sequence preference observed for T4 DNA ligase
(Ashraf et al., 2013)). For example, in Figure 4.13 valine at position LH1 shows +8.4% over
representations compared to only +1.1% at position LH2. Whilst these differences are not
vast, unlike those observed in Figure 3.9, this seems to be typical range of variation once
ligase preference accounted for. Visual analysis of the codon representation presented in

135
Ashraf et al. shows a similar situation to that of the codon representation in Figure 4.13, in
that whilst there is some variation in the percentage codon representation there is no obvious
pattern with some codons showing some over representation at one position and not at
others. Furthermore, these types of variations are also observed in Frigotto et al. using a
version of ProxiMAX that has undergone further optimisation. Therefore I am inclined to
surmise that these variations are due to minor experimental error associated with factors
such liquid handling, oligonucleotide quantification, <100% reaction efficiencies rather than
larger issues such as MlyI sequence preference.
In conclusion, although not perfect, the final anti-NGF peptide library showed that ProxiMAX
could be undertaken in a normal laboratory using standard molecular biology techniques
without the need for specialist equipment. As the library was to an acceptable standard it was
now taken forward to undergo CIS display in order to screen for novel mutants.

136
Chapter 5
Recombinant Human Nerve Growth
Factor Expression, Purification and
Activity Testing in an Escherichia Coli
Expression System
137
5. Chapter 5: Recombinant Human Nerve Growth Factor Expression, Purification and
Activity Testing in an Escherichia Coli Expression System
5.1. Introduction
An immobilised target for the anti-NGF peptide library was required for the selection and
screening process of CIS display. Therefore it was necessary to express biologically active
NGF in sufficient yield for use in CIS display.
As NGF contains three disulfide bonds with non-consecutive cysteine pairs, expression of
recombinant human NGF (rhNGF) is usually performed eukaryote cell lines such as murine
myeloma derived NSO. However mammalian cell culture can be costly and produces
relatively low yields. Expression of rhNGF has previously been attempted in the periplasm of
E.coli. (Fujimori et al., 1992, Negro et al., 1992), although these formed aggregates and after
subsequent solubilisation and refolding the yield of biologically active rhNGF was low. NGF
has been expressed in the periplasm of E.coli using co-expression of disulfide bond
formation proteins (Dsb’s) (Kurokawa et al., 2001).
With the advances in cell line engineering it is possible to attempt bacterial cytoplasmic
expression using the NEB E.coli SHuffle cell line. E.coli SHuffle are an
engineered E.coli K12 cell line that constitutively expresses a chromosomal copy of the
disulfide bond isomerase DsbC (which lacks its signal sequence, retaining it in the
cytoplasm) designed to promote disulfide bond formation in the cytoplasm. DsbC promotes
the correction of mis-oxidized proteins into their correct form (Bessette et al., 1999, Levy et
al., 2001) and is also a chaperone that can assist in the folding of proteins that do not require
disulfide bonds (Chen et al., 1999).
As well as expressing DsbC the E.coli SHuffle cell line has deletions in the genes for
glutaredoxin reductase and thioredoxin reductase that allows disulfide bonds to form in the
cytoplasm. The lethality of this combination of mutations is suppressed by a mutation in the
peroxiredoxin enzyme (ahpC*).
138
NGF is physiologically processed from a pre-pro peptide to give a 13.5 kDa protein with no
other posttranslational processing. It contains an 18 amino acid signal peptide (1-18)
followed by a 103 amino acid pro-sequence (19-121), which contains two glycosylation
points (positions 69 and 114). The active subunit (βNGF) is 120 amino acids (122-241) and
forms an active homodimer (Rattenholl et al., 2001b). Therefore, as expression would
attempted in a prokaryote system it was decided to express the β subunit.
5.2. Expression and purification of β-NGF using pJ434
The β-NGF gene was synthesised and inserted into the bacterial expression vector by DNA
2.0. The plasmid map of this vector is illustrated in Figure 5.1. This is a low copy number
vector that is IPTG inducible, contains an ampicillin resistance gene for selectivity and the β-
NGF was cloned downstream of a T7 promoter.
Initially pJ434-NGF_optEc (2.1.6.2) was transformed into SHuffle® T7 Competent E.coli
(2.1.5.3). To start with expression conditions such as temperature, incubation time and IPTG
concentration were varied to determine the optimal conditions for expression. Final
expression conditions were established as IPTG induction concentration of 0.6 mM and
incubation of 16°C overnight (2.2.9.1.1) (data not shown). To lyse the cell pellet both
chemical lysis, using BugbusterTM (2.2.9.1.3), and sonication (2.2.9.1.2) were used to analyse
which was the most efficient lysis method It was decided that sonication was more efficient at
lysing large cell pellets although chemical lysis provided a better quality lysate with less
degradation. Cleared cell lysate was then purified using Ni-NTA his tag affinity purification
(Figure 5.2 A).

139
Figure 5.1 pJ434-NGF_optEc Plasmid Map. pJ434-NGF_optEc was purchased from and synthesised by DNA 2.0. It contains: the T7lac promoter for high-level, IPTG-inducible expression of the gene of interest in E.coli; Ampicillin resistance gene for selection in E.coli; N-terminal polyhistidine (6xHis) tag for detection and purification of recombinant fusion proteins.

140
Figure 5.2. pJ434-β-NGF Expression and Purification. A: SDS-PAGE gel image of protein generated in 2.2.9.1.1 and subsequently purified in 2.2.9.1.2 and 2.2.9.1.4. Lanes 1: Raw cleared lysate; 2: Column flow through; 3-4: Column washes; 5-8: Column eluent. Expected molecular weight of β-NGF is ~13.5 KDa (appropriate size area is boxed). Samples were electrophoresed on 15% polyacrylamide gel. B: Western blot of the SDS-PAGE gel (A) using an anti-His antibody. Lanes 1: Raw cleared lysate; 2: Column flow through; 3-4: Column washes; 5-8: Column eluent. Smudging in lanes 1 and 2 resulted from blotting procedure.
Whilst some extremely faint bands that were approximately the correct size (~13.5 KDa)
were visible in the eluted fractions (lanes 5-8) analysis by western blot, as described in
2.2.4.6 using HisG mouse monoclonal antibody-HRP conjugate (Figure 5.2 B) showed that
these were not the correct protein, although lanes 5-6 did show bands at higher molecular
weight. As there appeared that there was no significant yield of the correct protein present in
KDa
15
25 35
40
15
M 4 5 6 1 3 2 7 M 8
B
A KDa
25
35
40
M 4 5 6 1 3 2 7 M 8

141
the soluble fraction it was decided to modify the expression system in order to improve
solubility.
5.3. β-NGF Sub-Cloning into pETSUMO
In order to try and improve the solubility it was decided to express β-NGF as a C-terminal
fusion with a small ubiquitin-related modifier (SUMO) purchased from Life Technologies,
which is claimed to increase expression and solubility of recombinant SUMO fusion proteins.
The SUMO protein is cleaved by SUMO protease, a cysteine protease that specifically
recognises its tertiary structure (Li and Hochstrasser, 1999, Mossessova and Lima, 2000).
This results in the production of native protein with no extra amino acids between the protein
and the cleavage site (Figure 5.3).
Figure 5.3. pETSUMO Plasmid Map (taken from Champion™ pET SUMO Protein Expression System manual, Invitrogen). Champion™ pET SUMO Expression System was purchased from Life Technologies. It contains: the T7 lac promoter for high-level, IPTG-inducible expression of the gene of interest in E.coli; Kanamycin resistance gene for selection in E.coli; N-terminal polyhistidine (6xHis) tag for detection and purification of recombinant fusion proteins; N-terminal SUMO fusion protein for increased expression and solubility of recombinant fusion proteins and generation of native protein following cleavage by SUMO Protease; lacI gene encoding the lac repressor to reduce basal transcription from the T7lac promoter in the pET SUMO vector and from the lacUV5 promoter in the E.coli host chromosome; pBR322 origin for low-copy replication and maintenance in E.coli.

142
The βNGF gene was amplified out of pJ434-NGF_optEc using Taq polymerase, as described
in 2.2.9.2.1, to add single 3’ A overhangs (Figure 5.4). Lane 1 showed a clean negative
control whilst lane 2 showed a band corresponding the βNGF gene with the correct size of
360 bp.
Figure 5.4. β-NGF TA Cloning. Agarose gel image of the amplified βNGF gene to be used in pET SUMO TA cloning. βNGF gene was amplified out of pJ434-NGF_optEc and inserted into pETSUMO plasmid using TA cloning with specific primers to amplify the β-NGF gene as described in 2.2.9.2.1. Expected molecular weight of the βNGF gene is 360 bp. Lanes: 1: Negative control; 2: β-NGF gene. The products were electrophoresed on 1.5% agarose/TAE gel.
The amplified βNGF gene was subsequently ligated into pETSUMO (2.1.6.3) and cloned into
One Shot® Mach1™-T1R Competent Cells (2.1.5.2) as described in 2.2.5.2. Alongside this
ligation various controls were also undertaken to analyse the effectiveness of the
transformation (Table 5.1).
300 bp
400 bp
500 bp
200 bp
M M 2 1

143
Colonies
βNGF ligation 623
Self-ligation ~1000
Linear pETSUMO 8
Transformation Control (pUC19) ~1500
No vector (+ Kanamycin) 0
No vector (- Kanamycin) Lawn
Table 5.1. pETSUMO-βNGF Cloning. Amplified βNGF gene was ligated into pETSUMO with a 3:1 insert: vector molar ratio at 16°C overnight. The pET SUMO-βNGF was transformed into One Shot® Mach1™-T1R Competent Cells (2.1.5.2) and plated onto LB agar+Kan along with relevant controls.
Colonies were picked and analysed by colony PCR (as described in 2.2.2.3) using a forward
external primer (complementary to SUMO) and a reverse internal primer (complementary to
βNGF) to ensure the gene was in the correct orientation (Figure 5.5). All lanes showed a
product of the correct size although the quality was varied and the secondary products were
also visible in (lanes 4, 6 and 7 especially). Several of the best looking clones were picked,
purified by miniprep (2.2.6) and sequenced using forward and reverse sequencing primers by
Eurofins Genomics (9.7, Figure 5.6). Clones showing the correct sequences in the correct
reading frame could then be used for expression.
Figure 5.5. pETSUMO-βNGF Colony Screening. Agarose gel image of the PCR products generated from pETSUMO-βNGF colony screening. Products were generated using an external primer, complementary to pETSUMO, and an internal primer commentary to βNGF. Expected molecular weight of the PCR products from clone containing the correct vector and insert is ~490 bp. The products were electrophoresed on 1.5% agarose/TAE gel. Lanes: 1-12: Individual clones.
9 M M 1 2 3 4 5 6 7 8 10 11 12
300 bp 400 bp
500 bp 600 bp

144
>Eco57MI
AvaII >AcuI
Psp03I
VpaK11AI >AceIII >HaeIV
| | | |
C TTC ATG GCT GGA TCG GAC CCT GAA GAT TTG GAC ATG GAG GAT AAC GAT ATT ATT GAG GCT CAC AGA GAA CAG ATT GGT GGT AGC AGC TCG CAC CCG ATC < 100
F M A G S D P E D L D M E D N D I I E A H R E Q I G G S S S H P I
G AAG TAC CGA CCT AGC CTG GGA CTT CTA AAC CTG TAC CTC CTA TTG CTA TAA TAA CTC CGA GTG TCT CTT GTC TAA CCA CCA TCG TCG AGC GTG GGC TAG
10 20 30 40 50 60 70 80 90
<PspOMII
<BseYI
Tth111I AlwNI <GsaI
| | | |
TTT CAT CGT GGC GAG TTC TCT GTC TGC GAC TCC GTC AGC GTC TGG GTG GGC GAT AAG ACC ACC GCG ACG GAC ATT AAA GGC AAA GAG GTC ATG GTG CTG G < 200
F H R G E F S V C D S V S V W V G D K T T A T D I K G K E V M V L G
AAA GTA GCA CCG CTC AAG AGA CAG ACG CTG AGG CAG TCG CAG ACC CAC CCG CTA TTC TGG TGG CGC TGC CTG TAA TTT CCG TTT CTC CAG TAC CAC GAC C
110 120 130 140 150 160 170 180 190
>FalI BstBI NruI ClaI
| | | |
GC GAG GTG AGC ATT AAC AAC TCC GTC TTT AAG CAA TAC TTT TTC GAA ACC AAA TGT CGC GAT CCG AAC CCT GTG GAC AGC GGT TGT CGT GGT ATC GAT AG < 300
E V S I N N S V F K Q Y F F E T K C R D P N P V D S G C R G I D S
CG CTC CAC TCG TAA TTG TTG AGG CAG AAA TTC GTT ATG AAA AAG CTT TGG TTT ACA GCG CTA GGC TTG GGA CAC CTG TCG CCA ACA GCA CCA TAG CTA TC
210 220 230 240 250 260 270 280 290
>StsI
>FokI
NcoI
BtgI
<CjePI >BtsCI
>Tth111II >Bsp24I >CspCI
| | | | |
C AAA CAC TGG AAC AGC TAT TGC ACC ACT ACC CAT ACG TTC GTT AAG GCA CTG ACC ATG GAT GGT AAA CAA GCG GCG TGG CGC TTT ATC CGT ATT GAC ACG < 400
K H W N S Y C T T T H T F V K A L T M D G K Q A A W R F I R I D T
G TTT GTG ACC TTG TCG ATA ACG TGG TGA TGG GTA TGC AAG CAA TTC CGT GAC TGG TAC CTA CCA TTT GTT CGC CGC ACC GCG AAA TAG GCA TAA CTG TGC
310 320 330 340 350 360 370 380 390
<Bpu10I <SfaNI
NspI HindIII <BscAI
| | | |
GCG TGC ATG TGT GTT CTG AGC CGC AAG GCG GTT CGT CGC GCC AGA CAA GCT TAG GTA TTT ATT CGG CGC AAA GTG CGT CGG GTG ATG CTG CCA ACT TAG T < 500
A C M C V L S R K A V R R A R Q A * V F I R R K V R R V M L P T * S
CGC ACG TAC ACA CAA GAC TCG GCG TTC CGC CAA GCA GCG CGG TCT GTT CGA ATC CAT AAA TAA GCC GCG TTT CAC GCA GCC CAC TAC GAC GGT TGA ATC A
410 420 430 440 450 460 470 480 490
BsiHKAI BstYI BlpI
| | |
CG AGC ACC ACC ACC ACC ACC ACT GAG ATC CGG CTG CTA ACA AAG CCC GAA AGG AAG CTG AGT TGG CTG CTG CCA CCG CTG AGC AAT AAC TAG CAT AAC CC < 600
S T T T T T T E I R L L T K P E R K L S W L L P P L S N N * H N P
GC TCG TGG TGG TGG TGG TGG TGA CTC TAG GCC GAC GAT TGT TTC GGG CTT TCC TTC GAC TCA ACC GAC GAC GGT GGC GAC TCG TTA TTG ATC GTA TTG GG
510 520 530 540 550 560 570 580 590
EcoO109I >BpuEI
PssI SmlI BspEI >BsmFI SfcI
| | | | |
C TTG GGG CCT CTA AAC GGG TCT TGA GGG GTT TTT TGC TGA AAG GAG GAA CTA TAT CCG GAT TGG CGA ATG GGA CGC GCC CTG TAG CGG CGC ATT AAG CGC < 700
L G P L N G S * G V F C * K E E L Y P D W R M G R A L * R R I K R
G AAC CCC GGA GAT TTG CCC AGA ACT CCC CAA AAA ACG ACT TTC CTC CTT GAT ATA GGC CTA ACC GCT TAC CCT GCG CGG GAC ATC GCC GCG TAA TTC GCG
610 620 630 640 650 660 670 680 690
NaeI
BsrFI
NgoMIV
<TsoI Tsp45I >BsrBI >HpyAV >NmeDI
| | | | |
GGC GGG TGT GGT GGT TAC GCG CAG CGT GAC CGC TAC ACT TGC CAG CGC CCT AGC GCC CGC TCC TTT CGC TTT CTT CCC TTC CTT TCT CGC CAC GTT CGC C < 800
G G C G G Y A Q R D R Y T C Q R P S A R S F R F L P F L S R H V R R
CCG CCC ACA CCA CCA ATG CGC GTC GCA CTG GCG ATG TGA ACG GTC GCG GGA TCG CGG GCG AGG AAA GCG AAA GAA GGG AAG GAA AGA GCG GTG CAA GCG G
710 720 730 740 750 760 770 780 790
BanII BanI
| |
GG CTT TCC CCG TCA AGC TCT AAA TCG GGG GCT CCC TTT AGG GTT CCG ATT TAG TGC TTT ACG GCA CCT CGA CCC CAA AAA ACT TGA TTA GGG TGA TGG TT < 900
L S P S S S K S G A P F R V P I * C F T A P R P Q K T * L G * W F
CC GAA AGG GGC AGT TCG AGA TTT AGC CCC CGA GGG AAA TCC CAA GGC TAA ATC ACG AAA TGC CGT GGA GCT GGG GTT TTT TGA ACT AAT CCC ACT ACC AA
810 820 830 840 850 860 870 880 890
<PpiI
<MmeI
BsaAI <BtgZI HpyCH4III DrdI <AloI >BsbI
| | | | | || |
C ACG TAG TGG GCC ATC GCC CCT GAT AGA CGG TTT TTC GCC CTT TGA CGT TGG AGT CCA CGT TCC TTT ATA GTG GAC TCT TGT TCC AAA CTG GAA CAA CAC < 1000
T * W A I A P D R R F F A L * R W S P R S F I V D S C S K L E Q H
G TGC ATC ACC CGG TAG CGG GGA CTA TCT GCC AAA AAG CGG GAA ACT GCA ACC TCA GGT GCA AGG AAA TAT CAC CTG AGA ACA AGG TTT GAC CTT GTT GTG
910 920 930 940 950 960 970 980 990
Tsp509I EaeI
PsiI ApoI >GdiII
| | | |
TCA ACC CTA TCT CCG GTC TAT TCT TTT GAT TTA TAA GGG AAT TTT GCC GAT TTC GGC CAT ATT GGA < 1066
S T L S P V Y S F D L * G N F A D F G H I G
AGT TGG GAT AGA GGC CAG ATA AGA AAA CTA AAT ATT CCC TTA AAA CGG CTA AAG CCG GTA TAA CCT
1010 1020 1030 1040 1050 1060
Figure 5.6. pETSUMO-βNGF Sequencing. Good quality clones that showed the insert in the correct orientation were used to inoculate fresh LB+Kan (2.1.2.1) and grown overnight at 37 °C. Plasmid DNA was extracted and purified by miniprep (2.2.6) and sent for sequencing at Eurofins Genomics. βNGF gene is highlighted in green, C-terminal of SUMO in blue and the plasmid backbone in yellow.

145
5.4. pETSUMO-βNGF Expression Optimisation in E.coli Bl21.
After sequence verification pETSUMO-βNGF was transformed into E.coli Bl21 cells (2.1.5.4)
as described in2.2.5.2. Initial optimisation was undertaken in this cell line as these were
supplied with the Champion™ pET SUMO Expression System kit (Life Technologies). Once
the initial expression parameters for the SUMO-βNGF fusion were deduced different cell
lines could be used. The expression control vector pETSUMO/CAT (9.6) was also
transformed and expressed in parallel to pETSUMO-βNGF.
Initially, overnight precultures of both pETSUMO/CAT and pETSUMO-βNGF were diluted 50-
fold in fresh 10 ml LB+50 μg/ml Kanamycin (2.1.2.1), and when cultures had reached
OD600nm 0.4-0.8, induced with 0.4mM IPTG (2.1.4.7) and grown at 30°C (to potentially aid
solubility) for 4 hours. Whole cell protein was analysed by boiling the pellets for each time
point in 1x SDS sample buffer (2.1.3.3, 2.1.3.4) (Figure 5.7). Lanes 1-3 show un-induced
expression samples at times 0, 2 and 4 hours while lanes 4-6 show induced expression
samples at times 0, 2 and 4 hours. The expression levels of the control pETSUMO/CAT were
at reasonable levels in the induced samples while there was little/or no expression observed
in the un-induced samples across the time course (Figure 5.7 A). There was little non-
specific expression of pETSUMO-βNGF in the un-induced samples, with a small amount
visible across the time course in the induced samples (Figure 5.7 B). Therefore it was
concluded that expression conditions would need to be further optimised in order to improve
the yield of SUMO-βNGF fusion.

146
Figure 5.7 Initial pETSUMO-β-NGF Expression in E.coli Bl21. SDS-PAGE gel image of whole cell protein generated in 2.2.9.2.2. A: Positive expression control pETSUMO/CAT (9.6) Lanes: 1: Un-induced, 0 hours; 2: Un-induced 2 hours; 3: Un-induced 4 hours; 4: Induced, 0 hours; 5: Induced 2 hours; 6: Induced 4 hours; B: pETSUMO-βNGF: Lanes: 1: Un-induced, 0 hours; 2: Un-induced 2 hours; 3: Un-induced 4 hours; 4: Induced, 0 hours; 5: Induced 2 hours; 6: Induced 4 hours. Expected molecular weight of SUMO-βNGF and pET SUMO/CAT is ~30 KDa and ~39 KDa respectively (appropriate size area is boxed). Samples were electrophoresed on 15% polyacrylamide gel alongside a Thermo Scientific 10-100 kDa pageruler and stained with instant blue stain (Expedeon).
100
30
25 20
15
10
M M M 1 2 3 4 5 6
A KDa
M M M 1 2 3 4 5 6
10
15
20 25
30
B 100
KDa

147
A point noted from the first expression was that due to the 50-fold dilution of the precultures,
prior to induction, was that it took a considerable time for them to reach the lower induction
threshold of OD600nm 0.4, meaning that the cells were induced at the low end of the range.
Therefore for it was decided to only dilute the precultures 10-fold, thus reducing the time
taken to reach an OD600nm 0.4-0.8 and the likelihood the cells were in log phase. The
concentration of IPTG (2.1.4.7) used for induction was increased from 0.4mM to 1.0mM.
Lanes 1-3 show un-induced expression samples at times 0, 2 and 4 hours while lanes 4-6
show induced expression samples at times 0, 2 and 4 hours. Once again the expression
levels of the control pETSUMO/CAT were at reasonable levels in the induced samples while
there was little/or no expression observed in the un-induced samples across the time course
(Figure 5.8 A), although overall protein levels increased as result of increased cell numbers.
Similarly, there was little non-specific expression of pETSUMO-βNGF in the un-induced
samples, but under this alternative protocol, there was much improved expression of the
SUMO-βNGF fusion in the induced samples (Figure 5.8 B, lanes 5 & 6).
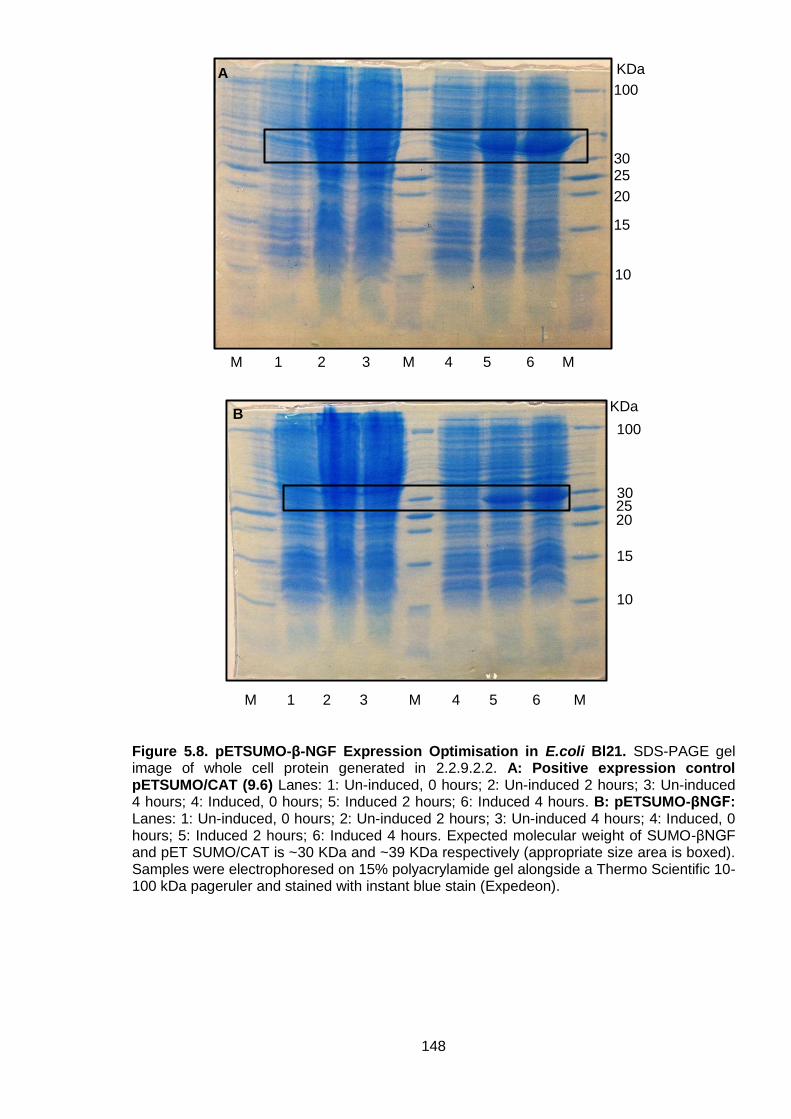
148
Figure 5.8. pETSUMO-β-NGF Expression Optimisation in E.coli Bl21. SDS-PAGE gel image of whole cell protein generated in 2.2.9.2.2. A: Positive expression control pETSUMO/CAT (9.6) Lanes: 1: Un-induced, 0 hours; 2: Un-induced 2 hours; 3: Un-induced 4 hours; 4: Induced, 0 hours; 5: Induced 2 hours; 6: Induced 4 hours. B: pETSUMO-βNGF: Lanes: 1: Un-induced, 0 hours; 2: Un-induced 2 hours; 3: Un-induced 4 hours; 4: Induced, 0 hours; 5: Induced 2 hours; 6: Induced 4 hours. Expected molecular weight of SUMO-βNGF and pET SUMO/CAT is ~30 KDa and ~39 KDa respectively (appropriate size area is boxed). Samples were electrophoresed on 15% polyacrylamide gel alongside a Thermo Scientific 10-100 kDa pageruler and stained with instant blue stain (Expedeon).
KDa
KDa
100
30 25 20
15
10
M M M 1 2 3 4 5 6
B
100
30 25
20
15
10
M M M 1 2 3 4 5 6
A

149
5.5. pETSUMO-βNGF Expression and Purification in E.coli SHuffle.
As the expression levels of the fusion appeared reasonable in E.coli BL21 it was decided to
move onto expression in the NEB E.coli SHuffle cell line (2.1.5.3). This time pETSUMO-
βNGF was transformed into the E.coli SHuffle cell line as described in 2.2.5.2. Overnight
precultures were diluted 10-fold into fresh LB+50 μg/ml Kananmycin (2.1.2.1), induced with
1.0mM IPTG (2.1.4.7) when cultures had reached OD600nm 0.4-0.8 and grown at 30°C (Figure
5.9 A) for 4 hours. Lanes 1-3 show un-induced expression samples at times 0, 2 and 4 hours
while lanes 4-6 show induced expression samples at times 0, 2 and 4 hours. The expression
levels observed in the induced pETSUMO-βNGF were good while there was little/ expression
observed in the un-induced samples across the time course, although once again overall
protein levels increased as result of increased cell numbers. To ensure that the protein being
expressed was the SUMO-βNGF fusion a western blot using HisG mouse monoclonal
antibody-HRP conjugate was performed as described in 2.2.4.6 (Figure 5.9 B). Once again
lanes 1-3 show un-induced expression samples at times 0, 2 and 4 hours while lanes 4-6
show induced expression samples at times 0, 2 and 4 hours. This showed bright band at the
correct size corresponding to the SUMO-βNGF fusion. There was a constant background
expression of the fusion visible in the un-induced samples but there was a distinct increase in
the intensity of the bands in the induced samples across the time course.

150
Figure 5.9. pETSUMO-βNGF Expression Optimisation in E.coli Shuffle. A: SDS-PAGE gel image of whole cell protein generated in 2.2.9.2.2. Lanes: 1: Un-induced, 0 hours; 2: Un-induced 2 hours; 3: Un-induced 4 hours; 4: Induced, 0 hours; 5: Induced 2 hours; 6: Induced 4 hours. Expected molecular weight of SUMO-βNGF is ~30 KDa (appropriate size area is boxed). Samples were electrophoresed on 15% polyacrylamide gel alongside a Thermo Scientific 10-100 kDa pageruler and stained with instant blue stain (Expedeon). B: Western blot of the SDS-PAGE gel (A) using an anti-His antibody. Lanes: 1: Un-induced, 0 hours; 2: Un-induced 2 hours; 3: Un-induced 4 hours; 4: Induced, 0 hours; 5: Induced 2 hours; 6: Induced 4 hours.
KDa
30
25
20
15
10
M M M 1 2 3 4 5 6
KDa
50
35
25
20
1 2 3 4 5 6 M M
A
B
M

151
Once the expression of the SUMO-βNGF fusion had been optimised in the E.coli SHuffle cell
line the process was up scaled for 500 ml expressions and the resulting cultures pelleted. In
order to undergo purification the cell pellets were lysed using BugbusterTM (Merck Millipore)
(2.2.9.1.3) and the soluble fraction was purified using Ni-NTA resin for His-tag affinity
purification as described in 2.2.9.2.3 (Figure 5.10 A). Unfortunately little/or no protein
corresponding to the correct size of the fusion (~30 KDa) was observed in the column eluent
(lanes 5-8) along with little visible in the un-purified soluble fraction (lane 1), column flow
through (lane 2) and column washes (lanes 3-4). This suggested that the expressed fusion
was still not soluble but in order to confirm this hypothesis the insoluble and soluble fractions
were analysed by SDS-PAGE (2.2.4.4) (Figure 5.10 B). A band of the correct size was visible
(arrowed) in the insoluble fraction (lane 1) whilst very little was observed in the soluble
fraction (lane 2). Despite the best attempts (i.e. expressing as fusion and using specialised
cell lines) it seemed clear that it would be difficult to express soluble protein the cytoplasm.
Therefore it was decided to express the SUMO-βNGF fusion in the insoluble fraction and
attempt to solubilise, purify and refold it

152
Figure 5.10. pETSUMO-βNGF Soluble Fraction Purification. A: SDS-PAGE gel image of whole cell protein generated in 2.2.9.2.2 that subsequently underwent purification as described in 2.2.9.2.3. Lanes: 1: Un-induced, 0 hours; 2: Un-induced 2 hours; 3: Un-induced 4 hours; 4: Induced, 0 hours; 5: Induced 2 hours; 6: Induced 4 hours. Expected molecular weight of SUMO-βNGF is ~30 KDa (appropriate size area is boxed). Lanes: 1: Un-purified soluble fraction; 2: Column flow through; 3-4: Wash 1-2; 5-8: Elution 1-4. B: SDS-PAGE gel image of soluble and insoluble protein generated in 2.2.9.2.2. Lanes: 1: Un-purified insoluble fraction; 2: Un-purified soluble fraction. SUMO-βNGF is indicated in the insoluble fraction (lane 1) by arrow. Samples were electrophoresed on 4-12% polyacrylamide gel.
5.6. Preparation, Purification and Refolding of Insoluble SUMO-βNGF
Two methods were initially examined for purifying the insoluble fraction; purification under
denaturing conditions (2.2.9.2.4) and inclusion body purification using BugbusterTM
(2.2.9.2.5).
Purification under denaturing conditions meant that the whole cell protein (soluble and
insoluble fractions) was denatured and then purified by Ni-NTA his tag affinity purification
(Figure 5.11 A). Unbound and low affinity proteins were washed away and bound protein was
eluted down a pH gradient. A large band corresponding to the correct size of the SUMO-
βNGF fusion was visible in the un-purified denatured lysate (lane 2) with low levels present
during the wash and first elution steps (lanes 5-6 and 7-10 respectively). The second elution
M 1 2
KDa
100
30
25 20
10
M 1 2 3 4 5 6 7 8 M
6
14 17
28
38
49
62
KDa A B

153
at pH 4.5 (lanes 11-14) showed a larger proportion of the fusion being eluted, especially in
the first 2 fractions at this pH. Although the purification process had worked fairly well, non-
specific binders were still present in the majority of the fractions.
Purification of inclusion bodies involved the same initial cell lysis procedure as used when
purifying the soluble fraction (2.2.9.2.3), although the insoluble fraction was kept whilst the
soluble fraction could be discarded. The inclusion bodies where then washed (2.2.9.2.5),
solubilised (2.2.9.2.6) and purified (2.2.9.2.7) (Figure 5.11 B). Again a large band
corresponding to the SUMO-βNGF fusion was observed in the solubilised inclusion body
fraction (lane 1) with traces visible in the column flow through (lane 2) and column washes
(lanes 3-4). SUMO-βNGF levels started to increase in the first elution fractions (lanes 5-7)
whilst by the second elution significant levels were visible (lanes 8-10). Finally to note was
that the fractions produced by inclusion body purification seemed to contain significantly
fewer contaminating proteins and was cleaner in general. Therefore it was decided that this
was the preferred method of purification.

154
Figure 5.11. pETSUMO-βNGF Insoluble Fraction Purification. A: SDS-PAGE gel image of whole cell protein generated in 2.2.9.2.2 and purified under denaturing conditions as described in 2.2.9.2.4. Lanes: 1: Cell pellet prior to resuspension in denaturing buffer; 2: Denatured un-purified lysate; 3: Remaining pelleted material post resuspension in denaturing buffer; 4: Denatured column flow through; 5-6: Column washes (pH 6.3); 7-10: Column elution buffer 1 (pH 5.9); 11-14: Column elution buffer 2 (pH 4.5). B: SDS-PAGE gel image of inclusion bodies generated from soluble lysate production, (2.2.9.2.3), prepared (2.2.9.2.5) solubilised (2.2.9.2.6) and purified as described in 2.2.9.2.7. Lanes: 1: Solubilised inclusion bodies; 2: Column flow through; 3-4: Column wash (pH 6.3); 5-7: Column elution buffer 1 (pH 5.9); 8-10: Column elution buffer 2 (pH 4.5). Expected molecular weight of SUMO-βNGF is ~30 KDa (appropriate size area is boxed). In both A & B samples were electrophoresed on 4-12% polyacrylamide gel.
28
38
17 14
49
M 4 5 6 7 8 9 10 11 12 13 14
62
KDa
1 2 3
A
M
28
38
17
49
14
1 2 3 4 5 6 7 8 9 10
62
KDa B

155
Once the solubilised fusion was purified it was necessary to refold it. After discussions with
colleagues who had previous success with a similar method it was decided to attempt a
hybrid refolding method of solid phase and dilution refolding. Solid phase refolding has the
advantage of proteins being spatially separated from each other during refolding (thus
reducing aggregation) whilst dilution refolding reduces the time for potential unwanted
intermediate products to form (Arakawa and Ejima, 2014).
In this case proteins would be bound to a solid phase of Ni-NTA followed by dilution in a
specific refolding buffer as described in 2.2.9.2.8 (Figure 5.12). L-Arg and a 10:1 ratio of
GSH: GSSG was included in the refolding buffer to aid disulfide formation. A portion of
denatured SUMO-βNGF fusion was still present in the column flow through prior to refolding
(lane 1) meaning that the binding capacity of the resin had been exceeded. The post
refolding showed no obvious protein present (lane 3). The elution fractions containing
refolded soluble protein in native (non-denaturing) buffer (lanes 5-8) showed high levels of
protein corresponding to the correct size if the SUMO-βNGF fusion, although there was
significantly less visible in the first fraction (lane 5) possibly due to equilibration to the new
buffer. There was still a significant amount of protein that remained bound the resin (lane 9).
Finally, as a check to see whether the refolding process had been successful, the same
elution fractions as observed in lanes 5-8 were electrophoresed in SDS sample buffer
without the reducing agent (lanes 10-13). βNGF normally acts as a homodimer so should
bind to itself, as observed in the higher molecular weight products observed in these
fractions.

156
Figure 5.12. SUMO-βNGF Refolding. SDS-PAGE gel image of refolded SUMO-βNGF generated in 2.2.9.2.8 and purified under denaturing conditions as described in 2.2.9.2.4. Lanes: 1: Column flow through prior to refolding; 2: Denaturing wash; 3: Post-refolding flow through; 4: Native column wash; 5-8: Native elution’s (reducing conditions); 9: Ni-NTA resin; 10-13: Native elution’s (non-reducing conditions). Expected molecular weight of SUMO-βNGF is ~30 KDa (appropriate size area is boxed). Samples were electrophoresed on 4-12% polyacrylamide gel.
As there appeared to be soluble SUMO-βNGF it was necessary to quantify the concentration
to allow the subsequent activity testing later in the process. The method of quantification
chosen was the BCA assay (Thermo Scientific) (2.2.9.3) and the concentration of the
refolded fraction were measured compared to BSA standard curve (Figure 5.13 and Table
5.2).
M
28
17
14
M
38
1 2 3 4 5 6 7 8 9 10 11 12 13
49
62
KDa

157
0 1 2 3 4 5
0 .0 0
0 .0 5
0 .1 0
0 .1 5
0 .2 0
[B S A ] u g /m l
A5
62
nm
y = -0 .0 0 0 3 x4 + 0 .0 0 1 1 x
3 + 0 .0 0 3 4 x
2 + 0 .0 1 7 x + 0 .0 0 0 2
R ² = 0 .9 9 9 6
Figure 5.13. BCA Assay BSA Standard Curve. BSA was diluted to an initial range of 0-100 μg/ml. This was further diluted 21-fold with BCA working reagent and incubated at 37 °C for 30 min. The plate was then cooled to room temperature and the absorbance measured at 562nm.
A562nm [Dilution]
ug/ml [Refolded]
ug/ml 1 2 3 Mean Blank
Corrected Mean
RF1 0.147 0.150 0.153 0.150 0.084 2.8 59.2
RF2 0.168 0.166 0.171 0.168 0.102 3.3 69.3
RF3 0.137 0.140 0.139 0.139 0.072 2.5 53.1
Table 5.2. SUMO-βNGF BCA Assay Quantification. SUMO-βNGF samples were diluted 21-fold with BCA working reagent and incubated at 37 °C for 30 min. They were then cooled to room temperature and the absorbance measured at 562nm. Concentration of each sample was then calculated using BSA standard curve.

158
5.7. SUNO-βNGF Activity Testing
Once the SUMO-βNGF fusion had been refolded and quantified it was necessary to cleave
the SUMO tag from βNGF. One unit of SUMO protease was added per 5 μg SUMO-βNGF
fusions with 1x SUMO protease buffer (2.1.3.20.11) whilst NaCl concentration was kept
between 100 mM and 300 mM for optimal reaction conditions. The reaction was incubated at
30°C for 6 hours (Figure 5.14 A). Lane 1 shows undigested SUMO-βNGF fusion with a
molecular weight of ~30 KDa whereas lane 2 shows digested fusion. A small amount of
undigested material is visible at ~30 KDa with two small fragments appearing close to the 14
and 17 KDa markers (βNGF and SUMO respectively).
In order to purify the two proteins from one another it was necessary to undergo Ni-NTA his
tag affinity purification again (2.2.9.1.4). The tag was present at the N-terminal of SUMO so
this should bind to the resin while βNGF should be eluted in the column flow through (Figure
5.14 B). However no protein was present in the column flow through (lane 1) or column
washes (lanes 2-3). SUMO was visible when protein bound to the column was eluted (lanes
4-7) although βNGF was not. By boiling a sample of the Ni-NTA with 1x SDS sample buffer
(2.1.3.8) and it showed that the βNGF was bound to the resin (lane 8). This was repeatable
and despite different elution conditions the βNGF would not elute from the column.

159
Figure 5.14. SUMO-βNGF Digestion and Purification. A: SDS-PAGE gel image of SUMO-βNFG cleavage after treatment with SUMO protease (2.2.9.4). Lanes: 1: Undigested SUMO-βNGF fusion; 2: Digested SUMO-βNGF fusion. Expected molecular weight of SUMO-βNGF is ~30 KDa whereas cleaved SUMO is ~16 KDa and βNGF is ~14 KDa. Some undigested SUMO-βNGF fusion is still present in the cleaved sample in lane 2. B: SDS-PAGE gel image of Ni-NTA purified cleaved SUMO-βNGF fusion (2.2.9.1.4). Lanes: 1: Column flow through; 2-3: Column washes; 4-7: Column elutions; 8: Ni-NTA resin. Expected molecular weight of SUMO-βNGF is ~30 KDa (appropriate size area is boxed). In both A & B samples were electrophoresed on 4-12% polyacrylamide.
As it was not possible to separate the cleaved SUMO-βNGF fusion as originally intended it
was decided to test whether the cleaved un-purified βNGF was active before more
purification attempts were made. This was undertaken using a TrkA binding assay (2.2.9.5)
where TrkA, a receptor for NGF, was immobilised and the un-purified βNGF cleavage (as
well as relevant controls) were washed over it and the binding was assessed using a
monoclonal mouse human βNGF antibody (Figure 5.15).
M
49
62
14 17
28
38
1 2 3 4 5 6 7 8 M
KDa KDa
M
62
49
14 17
28
38
1 2
A B

160
PB
S
rhB
-NG
F
Un
-cle
aved
fu
sio
n
Cle
aved
SU
MO
New
Cle
avag
e
Old
Cle
avag
e
0 .0
0 .5
1 .0
1 .5
2 .0
A4
50
* * * *
* * * *
* * * *
* * * *
* * * ** * * *
Figure 5.15. β-NGF Activity Assay. Expressed NGF activity was tested using a NGF-TrkA binding assay as described in 2.2.9.5. PBS was used as a negative control and rh-βNGF (purchased from R&D systems) as a positive control. The activity of un-cleaved and cleaved fusions were tested as well as purified SUMO (-βNGF). Each compound tested (right column) was analysed alongside a background binding control where no TrkA was bound (left column). Statistical analysis was conducted in GraphPad Prism 6.0. A two- way ANOVA was used (* p < 0.05, ** p < 0.01, *** p < 0.001, **** p < 0.0001).

161
With each sample analysed (right column), a negative control using blocked plastic with no
TrkA was used (left column) to measure non-specific binding to the well itself. A negative
control of PBS (+/- TrkA) was used to analyse background absorbance from TkA alone. A
positive control of recombinant human β-NGF (rhβ-NGF) purchased from R&D systems was
used as a benchmark for TrkA binding. Un-cleaved fusion and purified SUMO were tested
alongside two cleavage reactions (an old cleavage that had been stored at 4°C and new
fresh cleavage) to test as many different variants as possible. Two way ANOVA statistical
analyses were used to assess the significance of any differences between different groups.
The negative controls PBS +/-TrkA showed low levels of absorption at 450nm with no
significant difference observed between the two. rhβ-NGF+TrkA showed a significant
difference between both rhβ-NGF-TrkA and PBS+TrkA thus giving a good positive control
and so demonstrating that the assay was working correctly. There was a significant
difference observed between rhB-NGF+/-TrkA bars for the un-cleaved fusion, cleaved fusion,
new cleavage and old cleavage respectively. No significant difference between +TrkA and -
TrkA for the un-cleaved fusion, cleaved fusion, new cleavage and old cleavage was
observed. This data showed that the expressed βNGF appeared to have little or no activity in
binding to its receptor TrkA.
5.8. Discussion
Although apparently showing optimal expression, albeit not producing soluble protein, based
on the results of the TrkA binding assay it was obvious that the expressed βNGF was not
active (Figure 5.15). Two way ANOVA statistical analysis showed that the rhβ-NGF was
bound to TrkA significantly compared to when there was no TrkA present (p < 0.0001).
Likewise there was a significant difference observed between rhβ-NGF+TrkA and the
cleaved fusions +TrkA, whilst there was no significant difference observed between cleaved
fusions +/-TrkA. There may be a few reasons why the expressed βNGF showed no biological
activity.

162
To begin with, to attempt cytoplasmic expression may have been a factor in its lack of
activity. Cytoplasmic expression was attempted because NGF was required for not only the
selection process but also other crystallization studies and due to the amount required
cytoplasmic expression, if successful, was deemed the most appropriate for scaling up due
to the low and inactive yields generated from periplasmic expression previously. (Fujimori et
al., 1992, Negro et al., 1992, Rattenholl et al., 2001a). Whilst expression in a prokaryotic
system meant that there was no post-translational modification such as glycosylation
possible, this should not have been a factor as there are no glycosylation sites of the β-NGF
subunit. If the pro-form of NGF was being expressed the lack of post translational
modification would have then been an issue as there are two glycosylation points (Asp69 and
Asp114), although as previously stated these are outside the desired β-NGF subunit.
Ultimately although the cell line co-expressed disulfide bond isomerase (DsbC), to aid
disulfide bond formation, and mutations to allow disulfide formation in the cytoplasm they
were not enough to allow the formation of soluble protein resulting in the formation of
inclusion bodies. While cytoplasmic expression may have been a factor in protein solubility it
was ultimately null and void due to this formation insoluble aggregate which subsequently
had to undergo solubilisation, meaning that the disulfide bonds formed during expression had
to be broken, and refolding. Therefore the more likely explanation for the expressed NGFs
lack of biological activity is mis-folding during the refolding process.
The refolding procedure itself may have caused the protein to refold incorrectly. The dilution
method of refolding was chosen over the dialysis method as this reduces the time for
aggregates to form, and has been successfully used for other members of the neurotrophin
family. Whilst L-Arg and GSSG/GSH was used to help the formation of disulfide bond
refolding whilst immobilised on Ni-NTA may have interfered with correct refolding as the
protein may bind the resin through multiple sites (Arakawa and Ejima, 2014), thus restricting
refolding. In hindsight it may have proved more successful if refolding was undertaken whilst
free in solution rather than while Immobilised. In the end refolding by dilution may have
produced better results allowing longer timespan for disulfide bond formation, although
ultimately all refolding methods will involve some form of compromise, be it the amount of

163
active protein generated or the time taken. Mis-folding of the SUMO-NGF fusion would
explain the higher order aggregates in Figure 5.12. β-NGF contains three intra-monomer
disulfide bonds (Cys136- Cys201, Cys179- Cys229, Cys189- Cys231) that form the cysteine
knot. The presence of the higher order aggregates in Figure 5.12 could be as a result of
inter-monomer disulfide bonds strongly suggesting that the NGF monomers are incorrectly
folded. This inter-monomer folding may have been reduced by increasing the
dilution/lowering the protein concentration to reduce the proximity of the molecules during
refolding. Apart from possible mis-folding due to the methodology, there is also evidence to
show that the pro sequence of NGF can aid the correct folding of mature βNGF (Rattenholl et
al., 2001b). Pro-NGF acts as an intramolecular chaperone for βNGF, through hydrophobic
interaction of tryptophan residues, by facilitating oxidative folding. Therefore, ultimately by
attempting to express mature βNGF it may have reduced the likelihood of generating
correctly folded βNGF. Finally it is worth noting that it is stated in the manual that SUMO
protease recognises the tertiary structure of the SUMO protein and as this was digested
successfully it would suggest that SUMO, at least, was folded correctly.
Despite not being able to express active βNGF it was necessary to carry on to the screening
and selection process. In order undertake this it would be necessary to purchase rh-βNGF
and use particularly tight conditions in order to maximise the efficiency of the selection
process as large quantity of rh-βNGF would not be available.

164
Chapter 6
Anti-NGF Peptide Selection, Screening
and Testing

165
6. Chapter 6: Anti-NGF Peptide Selection, Screening and Testing.
6.1. Introduction
Whilst it is important to produce the highest quality DNA library, a natural bottleneck in the
mutagenesis process is the ability to efficiently screen the resulting libraries. There are a
number of different methods that can be used as described in chapter 1. In this case CIS
display (proprietary technology of Isogenica) was chosen for selections and screening of the
anti-NGF peptide library created in chapter 4
CIS display utilises the ability of the bacterial replication initiator protein RepA to bind to
DNA. Downstream of the RepA gene are two elements named Cis and Ori. Having
transcribed RepA, RNA polymerase stalls on Cis, which is a non-coding region that contains
a rho-dependent transcriptional terminator. This delay allows nascent RepA protein to be
produced by the ribosome, whilst the mRNA is still bound, albeit transiently, to Cis via the
stalled RNA polymerase (Praszkier and Pittard, 1999, Praszkier et al., 2000). The translated
RepA protein is subsequently able to bind non-covalently to the downstream ori region (a
plasmid origin of replication) (Odegrip and Haggard-Ljungquist, 2001), thus creating a
phenotype to genotype relationship. Thus by fusing a library in frame, upstream of the repA
sequence, the expressed protein, fused to RepA protein, which in turn is physically linked to
the DNA that encoded it via the RepA/Ori interaction. The DNA library undergoes in vitro
transcription/translation to form a pool of protein–DNA complexes and the library pool then is
incubated with an immobilized target. Non-binding peptides are washed away and the
remaining DNA is eluted and amplified by PCR to form a DNA library ready for the next
round of selection. After several rounds of selection recovered DNA is cloned for the
identification of individual target binding peptide sequences (Odegrip et al., 2004, Eldridge et
al., 2009). DNA-based systems have the advantage that they are considerably more resilient,
than other selection systems, to nucleases and can be generated quickly using normal PCR
procedures. This process is illustrated in Figure 6.1.

166
Figure 6.1. CIS Display Overview. CIS display (Isogenica, UK) is an in vitro DNA based screening method that creates a genotype to phenotype link between a peptide and the nucleic acid that encodes it (Odegrip et al., 2004). During transcription the RNA polymerase stalls on the non-coding Cis region, downstream of the repA sequence. Nascent RepA protein non-covalently binds to the downstream ori region creating a phenotype to genotype relationship. By placing a library upstream of the repA sequence the expressed protein will be attached to RepA protein, linking it to the DNA that encoded it. The library pool is incubated with an immobilized target, non-binding peptides are washed away and the remaining DNA is eluted and amplified by PCR to form a DNA library ready for the next round of selection. After several rounds of selection recovered DNA is cloned for the identification of individual target binding peptide sequences.
6.2. Biotinylation of rh-βNGF
As it was not possible at this time to successfully produce biologically active (chapter 5) rh-
βNGF was purchased from R&D systems for use as an immobilised target.
In order to be used as a streptavidin-immobilised target for CIS display the rh-βNGF needed
to be biotinylated. This was achieved using EZ-Link™Sulfo-NHS-Biotin (Thermo Scietific)
with free biotin subsequently removed by dialysis (2.2.10.1). Due to limited amount rh-βNGF
it was decided to assess the efficiency of the biotinylation process using matrix assisted laser

167
desorption ionization (MALDI) coupled to time of flight (TOF) mass spectrometry (Figure 6.2),
which only required a small volume of the biotinylated rh-βNGF compared to traditional
biotinylation assays e.g. HABA assay.
As shown in Figure 6.2 A, native rh-βNGF was used as a control, which showed a high peak
at 13580.46 Da. Peaks approximately half the size were also observed as a result of double
charged molecules. An increase in the molecular weight of biotinylated rh-βNGF was
observed (Figure 6.2B) with an obvious difference size difference between native rh-βNGF
(red) and biotinylated rh-βNGF (blue) in Figure 6.2C. A single biotin (with linker) adds ~339.5
Da to the molecular weight of the protein. Further analysis of the observed peaks in the
biotinylated sample showed that the most of the rh-βNGF had 4-5 biotins attached with an
overall range of 2-6 biotins observed (Figure 6.2 D). Therefore it was deemed the rh-βNGF
was sufficiently biotinylated and could be used for CIS display.

168
Figure 6.2. rh-βNGF Biotinylation. EZ-Link™Sulfo-NHS-Biotin (Thermo Scietific) was added to rhβ-NGF (R&D systems) at a 20-fold molar excess. This was incubated on ice for 2 hours and the reaction was stopped with the addition of 250 μl 1M Tris-HCl (pH 7.4). Free biotin was removed by dialysis using a Slide-A-Lyzer dialysis cassette (MWCO 3KDa) with PBS as an exchange buffer. Exchange buffer was replaced after 2 hours (twice) followed by overnight at 4°C. Biotinylation of samples was then assessed using MALDI-TOF mass spectrometry.
A
B
C
14999.67
15231.05
14539.25
2 3 4 5 6
D
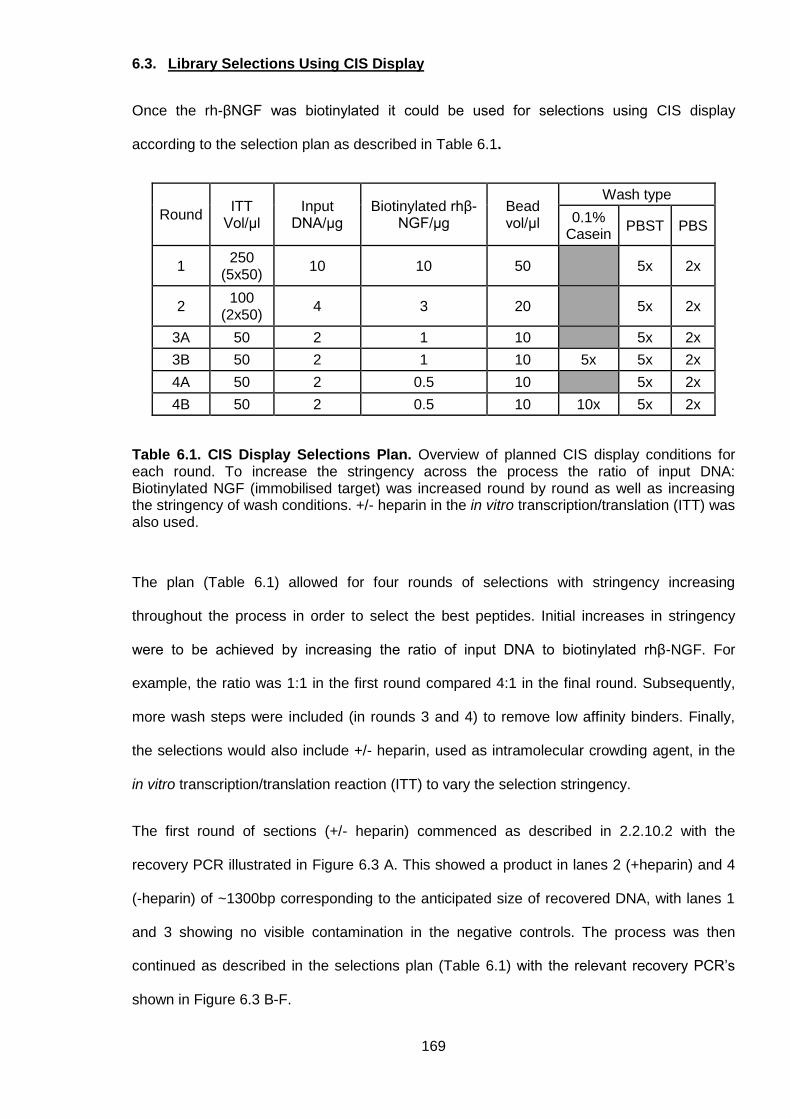
169
6.3. Library Selections Using CIS Display
Once the rh-βNGF was biotinylated it could be used for selections using CIS display
according to the selection plan as described in Table 6.1.
Round ITT
Vol/μl Input
DNA/μg Biotinylated rhβ-
NGF/μg Bead vol/μl
Wash type
0.1% Casein
PBST PBS
1 250
(5x50) 10 10 50 5x 2x
2 100
(2x50) 4 3 20 5x 2x
3A 50 2 1 10 5x 2x
3B 50 2 1 10 5x 5x 2x
4A 50 2 0.5 10 5x 2x
4B 50 2 0.5 10 10x 5x 2x
Table 6.1. CIS Display Selections Plan. Overview of planned CIS display conditions for each round. To increase the stringency across the process the ratio of input DNA: Biotinylated NGF (immobilised target) was increased round by round as well as increasing the stringency of wash conditions. +/- heparin in the in vitro transcription/translation (ITT) was also used.
The plan (Table 6.1) allowed for four rounds of selections with stringency increasing
throughout the process in order to select the best peptides. Initial increases in stringency
were to be achieved by increasing the ratio of input DNA to biotinylated rhβ-NGF. For
example, the ratio was 1:1 in the first round compared 4:1 in the final round. Subsequently,
more wash steps were included (in rounds 3 and 4) to remove low affinity binders. Finally,
the selections would also include +/- heparin, used as intramolecular crowding agent, in the
in vitro transcription/translation reaction (ITT) to vary the selection stringency.
The first round of sections (+/- heparin) commenced as described in 2.2.10.2 with the
recovery PCR illustrated in Figure 6.3 A. This showed a product in lanes 2 (+heparin) and 4
(-heparin) of ~1300bp corresponding to the anticipated size of recovered DNA, with lanes 1
and 3 showing no visible contamination in the negative controls. The process was then
continued as described in the selections plan (Table 6.1) with the relevant recovery PCR’s
shown in Figure 6.3 B-F.

170
Figure 6.3. CIS Display Recovery PCR. Agarose gel image of the recovery PCR products generated from the eluted selection DNA. A: Round 1: Lane 1: Negative control; 2:+Heparin; 3: Negative control; 4:-Heparin. B: Round 2: Lane 1: +Heparin; 2:-Heparin. C: Round 3A: Lane 1: Negative control; 2:+Heparin; 3: Negative control; 4:-Heparin. D: Round 3B: Lane 1: +Heparin; 2:-Heparin. E: Round 4A: Lane 1: +Heparin; 2:-Heparin. F: Round 4B: Lane 1: Negative control; 2:+Heparin; 3: -Heparin. Expected molecular weight of the recovery PCR product is ~1400 bp. The products were electrophoresed on 3% agarose/TAE gel.
1400bp
A B
C D
E F
M M M M M 1 2 3 4 1 2
1 2 M M 3 4 1 2 M M
1 2 M M 1 2 M M 3
1200bp 1000bp
1400bp 1200bp 1000bp
1400bp 1200bp 1000bp

171
The PCR products in the recovery PCR of each round of selections were the correct size
(~1400 bp) and there was no contamination observed in the negatives controls (where
shown). PCR products in Figure 6.3 F appear faint due to residual ethanol from purification
causing poor loading of the agarose gel. However, this product was subsequently deemed
acceptable when determined by nanodrop quantification.
6.4. Cloning of Selection Output
To allow for subsequent screening the output from the selection process need to be cloned in
to an appropriate expression vector. To allow this the restriction site for NotI was
reintroduced using a mutagenic primer with a 1 nucleotide substitution, which also shortened
the PCR product by removing the now redundant sequence that was needed for the
selections (Figure 6.4). The appropriate negative controls in lanes 1, 3, 5, and 7 showed no
sign of contamination whilst a PCR product (~225bp) for each stringency from the last round
of selections was present in lanes 2, 4, 6, and 8.
Figure 6.4. Selection Output Amplification and Re-introduction of Restriction Site. Agarose gel image of the PCR products generated as a result of reintroducing NcoI/NotI restriction sites necessary for subsequent cloning. Lanes: 1: Negative control; 2: Round 4A (+heparin) selection output; 3: Negative control; 4: Round 4A (-heparin) selection output; 5: Negative control; 6: Round 4B (+heparin) selection output; 7: Negative control; 8: Round 4B
M 1 3 2 4 M 5 7 6 8
200 bp 250 bp 300 bp

172
(-heparin) selection output. Expected molecular weight of the recovery PCR product is ~225 bp. The products were electrophoresed on 1.5% agarose/TAE gel.
Both the shortened selection output and the phagemid into which it would be cloned were
then digested with NcoI and NotI (2.2.1.5) to allow subsequent cloning. Figure 6.5 A shows
the digested vector with uncut plasmid in lane 1, followed by NcoI and NotI linearised
plasmid in lanes 2 and 3 respectively and finally NcoI/NotI double digested plasmid in lanes
4. The anticipated linearized phagemid size of ~5.7 Kbp corresponded to the bands observed
in lanes 2 and 3, with a smaller band of ~5 Kbp present in the double digest in lane 4.
The digestions of selection output are shown in Figure 6.5 B with lanes 1, 3, 5 and 7
corresponding to undigested PCR product while lanes 2, 4, 6, and 8 correspond to NcoI/NotI
digested PCR product. Residual ethanol from the purification buffer led to poor loading and
hence faint bands for the digests.
Figure 6.5. NcoI/NotI Cloning Digestion. An agarose gel image of NcoI/NotI digests for subsequent cloning; an Isogenica proprietary phagemid vector (pHEN) (A) and the output from the final round of selections (B). A: pHEN digestion. Lanes: 1: Uncut pHEN; 2: NcoI cut pHEN; 3: NotI cut pHEN; 4: NcoI/NotI cut pHEN. B: Selection output digestion. Lanes: 1: Uncut round 4A (+heparin); 2: NcoI/NotI cut round 4A (+heparin); 3: Uncut round 4A (-heparin); 4: NcoI/NotI cut round 4A (-heparin); 5: Uncut round 4B (+heparin); 6: NcoI/NotI cut round 4B (+heparin); 7: Uncut round 4B (-heparin); 8: NcoI/NotI cut round 4B (-heparin). Expected molecular weight of the recovery PCR product is ~125 bp. The products were electrophoresed on 1% (A) and 2% (B) agarose/TAE gels respectively.
10
M
8 6 5 4 3
1 2 3 4
Kbp A
200 bp
M M 1 2 3 4 5 6 7 8
B
250 bp 300 bp
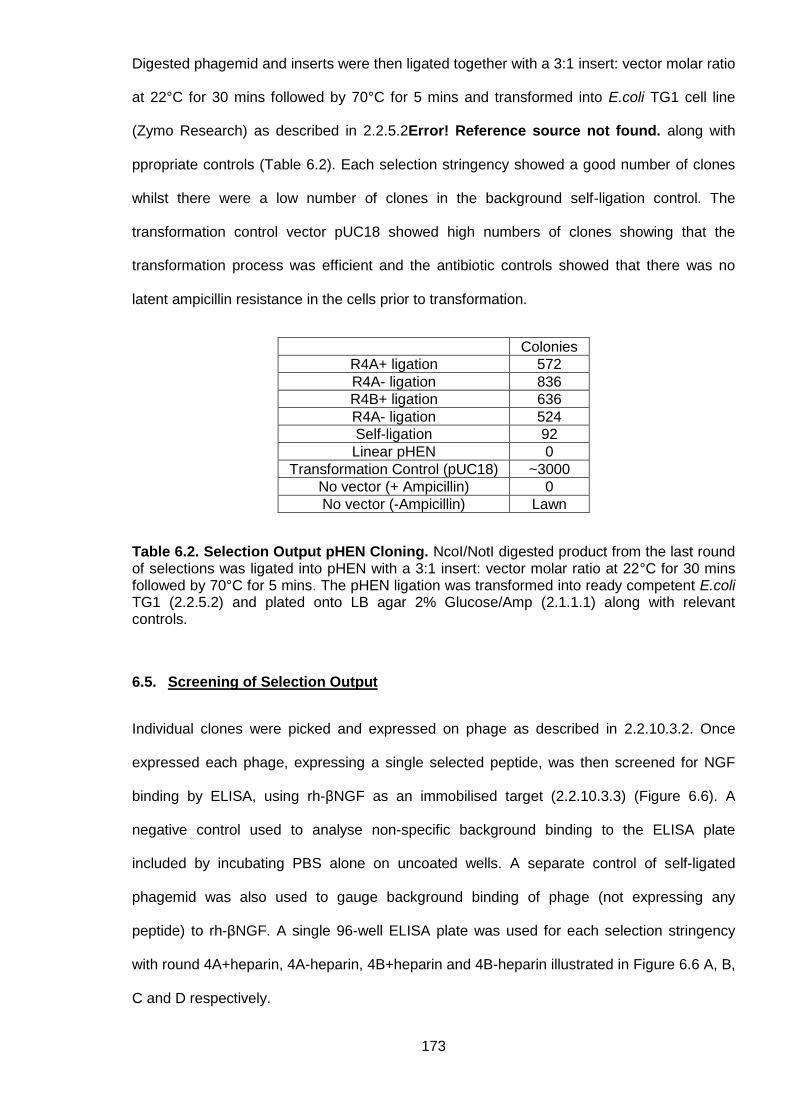
173
Digested phagemid and inserts were then ligated together with a 3:1 insert: vector molar ratio
at 22°C for 30 mins followed by 70°C for 5 mins and transformed into E.coli TG1 cell line
(Zymo Research) as described in 2.2.5.2Error! Reference source not found. along with
ppropriate controls (Table 6.2). Each selection stringency showed a good number of clones
whilst there were a low number of clones in the background self-ligation control. The
transformation control vector pUC18 showed high numbers of clones showing that the
transformation process was efficient and the antibiotic controls showed that there was no
latent ampicillin resistance in the cells prior to transformation.
Colonies
R4A+ ligation 572
R4A- ligation 836
R4B+ ligation 636
R4A- ligation 524
Self-ligation 92
Linear pHEN 0
Transformation Control (pUC18) ~3000
No vector (+ Ampicillin) 0
No vector (-Ampicillin) Lawn
Table 6.2. Selection Output pHEN Cloning. NcoI/NotI digested product from the last round of selections was ligated into pHEN with a 3:1 insert: vector molar ratio at 22°C for 30 mins followed by 70°C for 5 mins. The pHEN ligation was transformed into ready competent E.coli TG1 (2.2.5.2) and plated onto LB agar 2% Glucose/Amp (2.1.1.1) along with relevant controls.
6.5. Screening of Selection Output
Individual clones were picked and expressed on phage as described in 2.2.10.3.2. Once
expressed each phage, expressing a single selected peptide, was then screened for NGF
binding by ELISA, using rh-βNGF as an immobilised target (2.2.10.3.3) (Figure 6.6). A
negative control used to analyse non-specific background binding to the ELISA plate
included by incubating PBS alone on uncoated wells. A separate control of self-ligated
phagemid was also used to gauge background binding of phage (not expressing any
peptide) to rh-βNGF. A single 96-well ELISA plate was used for each selection stringency
with round 4A+heparin, 4A-heparin, 4B+heparin and 4B-heparin illustrated in Figure 6.6 A, B,
C and D respectively.
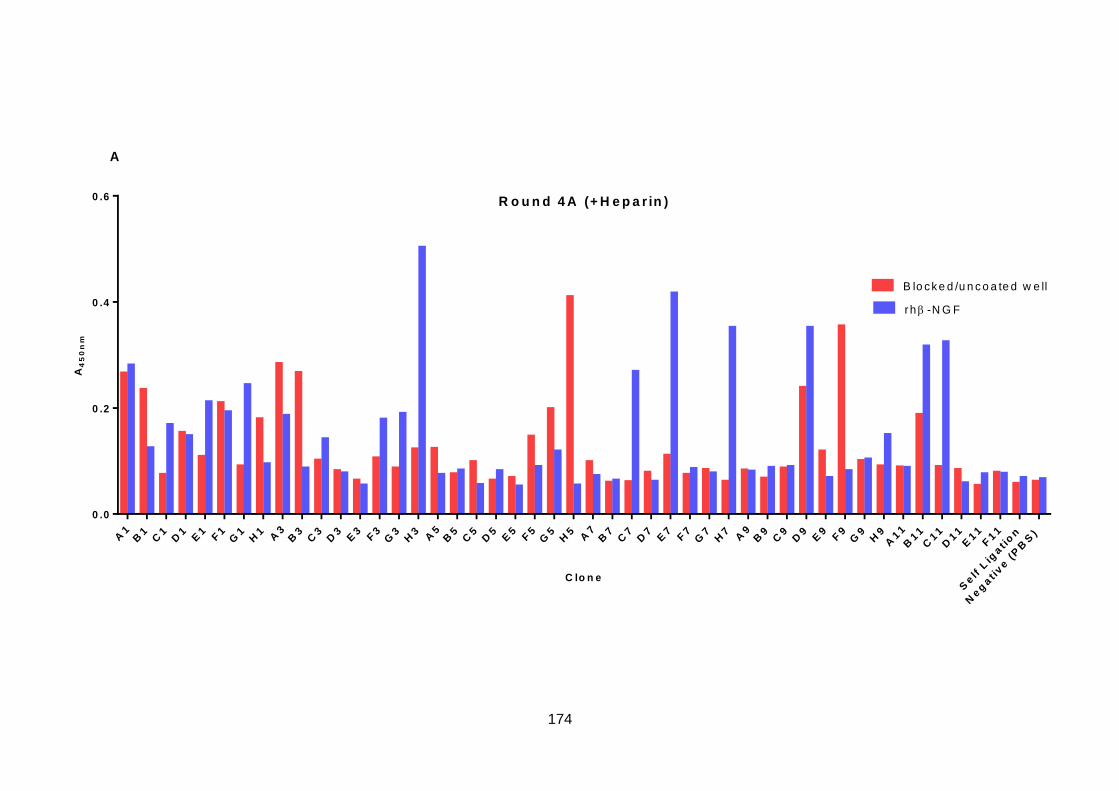
174
A1
B1
C1
D1
E1
F1
G1
H1
A3
B3
C3
D3
E3
F3
G3
H3
A5
B5
C5
D5
E5
F5
G5
H5
A7
B7
C7
D7
E7
F7
G7
H7
A9
B9
C9
D9
E9
F9
G9
H9
A11
B11
C11
D11
E11
F11
Self
Lig
at i
on
Neg
ati
ve (
PB
S)
0 .0
0 .2
0 .4
0 .6 R o u n d 4 A (+ H e p a r in )
C lo n e
A4
50
nm
B lo c k e d /u n c o a te d w e ll
r h -N G F
A
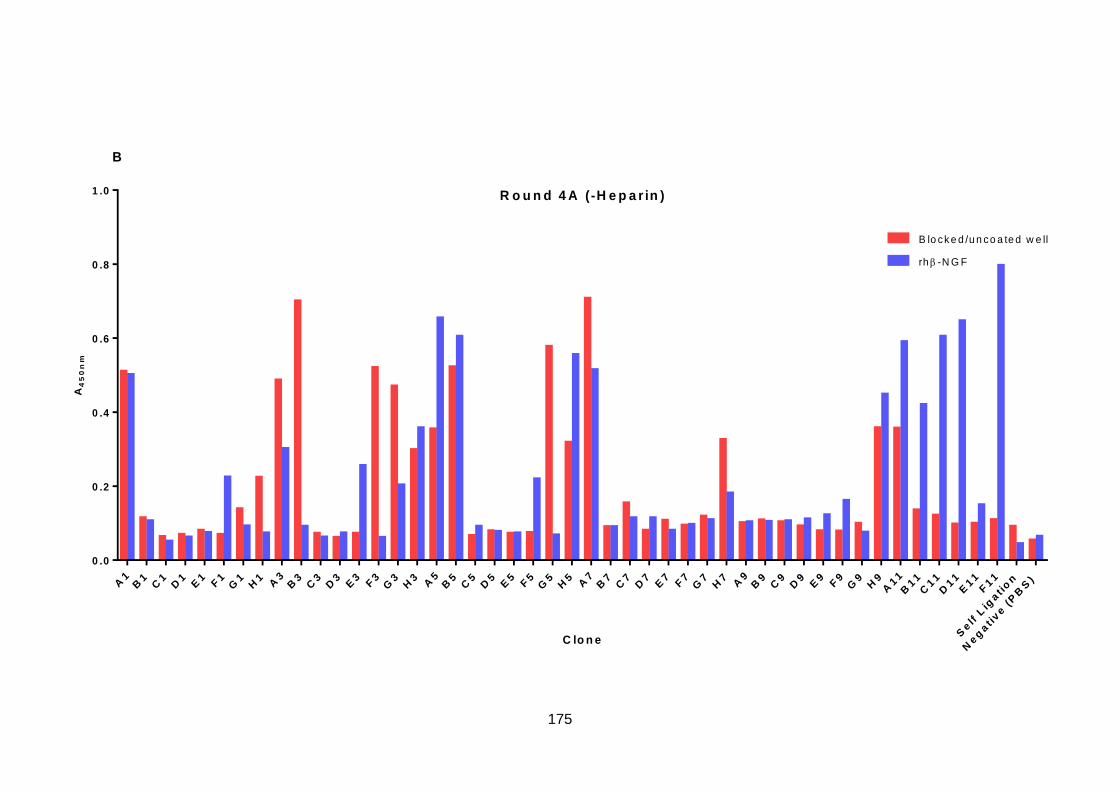
175
A1
B1
C1
D1
E1
F1
G1
H1
A3
B3
C3
D3
E3
F3
G3
H3
A5
B5
C5
D5
E5
F5
G5
H5
A7
B7
C7
D7
E7
F7
G7
H7
A9
B9
C9
D9
E9
F9
G9
H9
A11
B11
C11
D11
E11
F11
Self
Lig
at i
on
Neg
ati
ve (
PB
S)
0 .0
0 .2
0 .4
0 .6
0 .8
1 .0 R o u n d 4 A (-H e p a r in )
C lo n e
A4
50
nm
B lo ck e d /u n co a te d w e ll
rh -N G F
B
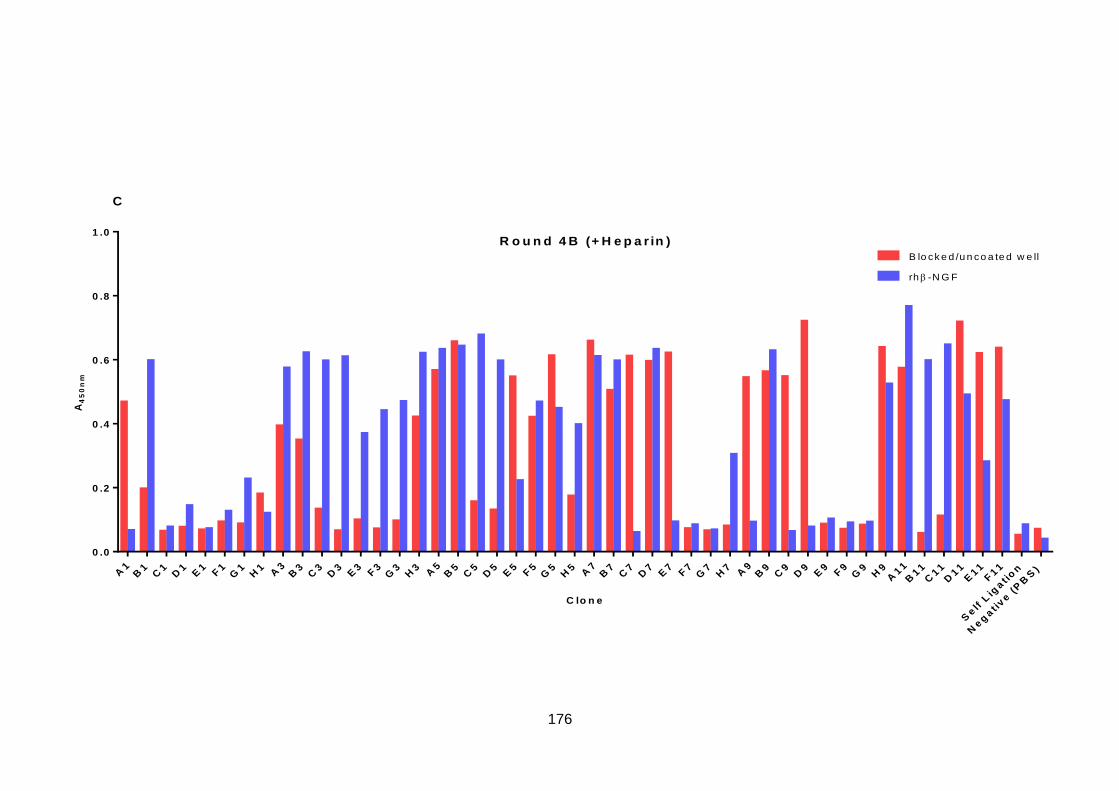
176
A1
B1
C1
D1
E1
F1
G1
H1
A3
B3
C3
D3
E3
F3
G3
H3
A5
B5
C5
D5
E5
F5
G5
H5
A7
B7
C7
D7
E7
F7
G7
H7
A9
B9
C9
D9
E9
F9
G9
H9
A11
B11
C11
D11
E11
F11
Self
Lig
at i
on
Neg
ati
ve (
PB
S)
0 .0
0 .2
0 .4
0 .6
0 .8
1 .0R o u n d 4 B (+ H e p a r in )
C lo n e
A4
50
nm
B lo ck e d /u n co a te d w e ll
rh -N G F
C

177
A1
B1
C1
D1
E1
F1
G1
H1
A3
B3
C3
D3
E3
F3
G3
H3
A5
B5
C5
D5
E5
F5
G5
H5
A7
B7
C7
D7
E7
F7
G7
H7
A9
B9
C9
D9
E9
F9
G9
H9
A11
B11
C11
D11
E11
F11
Self
Lig
at i
on
Neg
ati
ve (
PB
S)
0 .0
0 .2
0 .4
0 .6
0 .8
1 .0 R o u n d 4 B (-H e p a r in )
C lo n e
A4
50
nm
B lo ck e d /u n co a te d w e ll
rh -N G F
D

178
H3
C7
E7
H7
D11
Self
Lig
at i
on
Neg
ati
ve (
PB
S) F
1E
3F
5
C11
D11
E11
G11
Self
Lig
at i
on
Neg
ati
ve (
PB
S)
B1
C3
D3
E3
F3
G3
C5
D5
H7
C11
D11
Self
Lig
at i
on
Neg
ati
ve (
PB
S)
H1
C3
D3
F3
G3
D11
E11
F11
G11
Self
Lig
at i
on
Neg
ati
ve (
PB
S)
0 .0
0 .2
0 .4
0 .6
0 .8
1 .0
A4
50
B lo c k e d /u n c o a te d w e ll
r h -N G F
A + A - B + B -
E
P h a g e S c r e e n in g O u tp u t S u m m a r y

179
Figure 6.6. Selection Output Screening. The output from the selection process underwent ELISA screening, with an immobilised target of rh-BNGF, as described in 2.2.10.3. Negative phage expression controls of self-ligated vector (no insert) and PBS were used. Every expressed peptide was tested –NGF (red) and +NGF (blue). A: Round 4A (+heparin); B: Round 4A (-heparin); C: Round 4B (+heparin); D: Round 4B (-heparin). E: Phage screening summary.
In general the number of binders from the more stringent rounds of selection (4B+/-heparin)
appeared to higher than the numbers observed in the less stringent (4A+/-heparin).
Additional specificity testing using BSA as a non-specific target (results not shown) narrowed
down the number of potential NGF binding peptides to those that exhibited the best NGF
binding affinity compared to non-specific binding, as illustrated in Figure 6.6 E.
6.6. Sequencing of Screening Output
After screening it was necessary to sequence the positive screening hits in order to verify
constituent amino acid sequence to ensure they fell within the original library design. To do
this the glycerol stocks of the positively screened clones were amplified using colony PCR
(as undertaken in 2.2.2.3) as illustrated in Figure 6.7. The negative control in lane 1 showed
no contamination while a sample of the PCR products from positively screen clones for each
selection stringency showed clean single bands at the anticipated molecular weight (Lanes:
2-4: Round 4A (+heparin) colonies; 5-7: Round 4A (-heparin) colonies; 8-10: Round 4B
(+heparin) colonies; 11-13: Round 4A (+heparin) colonies).

180
Figure 6.7. Colony Screening. Agarose gel image of the products generated from screening of positive identified from Figure 6.6. Lanes: 1: Negative control; 2-4: Round 4A (+heparin) colonies; 5-7: Round 4A (-heparin) colonies; 8-10: Round 4B (+heparin) colonies; 11-13: Round 4A (+heparin) colonies. Expected molecular weight of ~290 bp. The products were electrophoresed on 1.5% agarose/TAE gel.
The colony PCR products were sent for sequencing at Beckman-Coulter using standard M13
sequencing primers. In total 32 clones, spanning the 4 selection stringencies, were
sequenced with 12 unique correct sequences returned (Figure 6.8 A). The 12 unique correct
sequences activity could be tested using a TrkA inhibition ELISA. A number of the
sequences returned that were not correct, according to the original library design, consisted
of n-1 deletions (Figure 6.8 B) with some n-2, n-3, repeated sequences and nonsense
sequences completing the set. Firstly, these peptides may have originally been correct NGF
binders but deletions may have been introduced by either the glycerol stock colony PCR or
the sequencing reaction. These n-1 sequences were re-sequenced with some returned as
correct sequences whilst others still contained a deletion. A second hypothesis is that the n-1
deletions were introduced prior to the selections process and subsequently pulled through
300 bp 200 bp
400 bp
M M 2 3 4 5 6
7 8 9 10 11 12 13
1
M M
400 bp 300 bp 200 bp

181
the selections due to the presence of the cysteine potentially interacting with those present in
rh-βNGF. Interestingly, as a result of the subsequent frameshift caused by the deletion a
number of the n-1 sequences contained a poly-arginine tail. Those peptides with the poly-R
tail all came from selections with heparin, so it may have been possible that there was some
charge interaction that may have promoted binding. However, as these did not conform to
the original library they were not taken on for further testing although could be an interesting
lead for future work. To note, B+C3 contained a single nucleotide deletion in the 3’
framework rather than the saturated library, meaning that the frameshift did not cause a
cysteine to be translated.
Figure 6.8. Screening Output Sequencing. PCR products amplified from colony glycerol stocks were sent for sequencing at Beckman-Coulter using M13 sequencing primers. Sequencing results returned full correct sequences (A) with the remaining, consisting of n-1,-
n-1
n-2
n-3
Incomplete
2 3 1 4 5 6 7 8 9 10 11 A
B

182
2, -3 and incomplete sequences (B). Correct sequences are compared to the original library build (Table 4.1 and Table 4.2) and the original anti-NGF peptides (A2 and D9).
6.7. Anti-NGF Peptide Testing
The 12 peptides (with the original A2 and D9 controls) pulled through the selection and
screening process were synthesised by Alta Biosciences (Table 6.3) and quantified by UV
spectrometry. These would be tested alongside a set of anti-NGF peptides containing
unnatural amino acid substitutions obtained from Isogenica (Table 6.4). Based on original
spot analysis the 11 amino acid motif was saturated. Although the termini showed no
significant effect on activity they were optimised to the most preferred from the SPOT
analysis. On request of Isogenica additional amino acids were added to flanking regions of
the randomised section in an effort to encourage additional ionic interactions and hydrogen
bonding. The cysteine present at the C-terminal was hypothesized to allow the peptides to
work as dimers. As the purpose of this library was to find a high affinity monomer this was
removed, hence some design differences from the original peptides.
Name MW/ Da Sequence
A2 2110.3 KQEGWPAEVYEDWPSCEG
D9 2053.3 EVWPAEVYQDWPFVGACG
A-E3 2332.7 MAAFKPEAVPSHVLHDWPSAAA
B-F11 2261.6 MAAFKPEAVPSHVLHDIVSAAA
A-G11 2325.7 MAAFKPEAVPTNVLHDWVSAAA
A-C11 2285.7 MAAFKPEAVPLKALEDRVSAAA
B+F3 2329.7 MAAFKPEAIPQNALHEYVSAAA
B+C5 2226.6 MAAFKPEGVPAQALHDFPSAAA
B+H7 2377.8 MAAFKPEGYPKQALRDRVSAAA
B-D11 2405.8 MAAFKPEGHPTRILHDWVSAAA
B-G11 2406.8 MAAFKPESHPVHILDDWISAAA
A-F5 2356.7 MAAFKQESIPVHALHDYVSAAA
B-G3 2374.8 MAAFKPEVVPTHLLHDRISAAA
B-F3 2492.0 MAAFKPEVIPKRLYNDWLSAAA
Table 6.3. Library Peptide Identity and Sequences. Synthesised by Alta Biosciences and quantified by UV spectrometry.

183
Name MW/ Da
Sequence Unnatural Amino Acid
Identity
D9 1929.5 KQEGWPAEV1EDWPSA 1=Tic
E4 1859.9 KQ5GWP2EVY2DWPSA
E5 1888.0 KQE2WPA2VYE2WPSA 2=Aib
E7 1906.4 KQEG3PAEVYEDWPSA
E9 1929.5 KQEGWPAEV3EDWPSA
E10 1906.4 KQEGWPAEVYED1PSA 3=(D-Tic)
E11 1906.4 KQEGWPAEVYED3PSA
F1 1944.5 KQEGWPAEVYED4PSA 4=(1-Nal)
F2 1944.5 KQEGWPAEVYED5PSA
F3 1944.5 KQEG4PAEVYEDWPSA
F4 1944.5 KQEG5PAEVYEDWPSA 5=(2-Nal)
F6 1906.4 KQEG1PAEVYEDWPSA
G8 1932.0 KQE2WP2EVY2DWPSA 6=(L-Hyp)
H5 1949.4 KQEGW6AEVYEDWPSA
H7 1908.5 KQEGWPAEVYED7PSA
H8 1993.5 KQEGWPAEV8EDWPSA 7=alpha-methyl-L-PheOH
H9 1931.5 KQEGWPSEV7EDWPSA
H10 1970.5 KQEG8PAEVYEDWPSA 8=(D-Dip)
H11 1908.5 KQEG7PAEVYEDWPSA
H12 1970.5 KQEGWPAEVYED8PSA
Table 6.4. Unnatural Amino Acid Peptide Identity and Sequences. Tic: L-1,2,3,4-Tetrahydroisoquinoline- 3-carboxylic acid; Aib: α-Aminoisobutyric acid; (L-Hyp): L-Hydroxyproline; (1-Nal): β-(1-Naphthyl)-L-alanyl; (2-Nal): β-(2-Naphthyl)-L-alanyl; (D-Tic) D-1,2,3,4-Tetrahydroisoquinoline- 3-carboxylic acid; (D-DIP): D-3,3-Diphenylalanine.
Both sets of peptide were tested using a TrkA inhibition ELISA (2.2.11) with the aim that
active peptides should bind to rh-βNGF and in so doing prevent its binding to its immobilised
receptor TrkA. TrkA was coated to a 96-well ELISA plate and then a mix of rh-βNGF and

184
peptides, at differing concentrations, were incubated on the plate. Non-binders were washed
away and rh-βNGF was assessed using a monoclonal biotinylated anti-human β-NGF
antibody and streptavidin-HRP. A simple schematic of this is illustrated in Figure 6.9.
Figure 6.9. Simplified TrkA Inhibition ELISA Illustration. TrkA-Fc chimera was coated on a NUNC F96 Maxisorp plate. Recombinant human β-NGF was mixed with appropriate peptide concentrations separately and then transferred into the NUNC Maxisorp plate and non-binders subsequently washed away. Binders would then be detected using biotinylated anti-human β-NGF antibody and streptavidin-HRP followed by ELISA development using TMB reagent.
To aid interpretation an example of the anticipated results from a TrkA inhibition ELISA is
illustrated in Figure 6.10. To ensure that results would be obtained a number of controls
would also be run alongside the peptide testing. The first negative control would not contain
any TrkA, NGF or peptide, and so effectively a measure of background absorbance from an
empty well. A second negative control would measure any absorbance of TrkA alone without
NGF or peptide. Finally, a third negative control would measure background binding of NGF
to the plate without the TrkA or any peptide present. All of these should show low levels of
absorbance at 450nm. A positive control using NGF and TrkA (with no peptide) would
measure un-inhibited NGF binding and should result in a high absorbance. For every peptide
used a control to measure binding for the NGF-peptide complex without TrkA present was
conducted, which should give a low level of absorbance at 450nm. Finally when testing the
activity of each peptide the absorbance, indicating the NGF-TrkA binding, should decrease
as the peptide concentration increases.
TrkA
Peptide
Strep-HRP
Biotinylated anti-human β-NGF antibody

185
0 .0
0 .5
1 .0
1 .5
A4
50
nm
N e g a tiv e C o n tro l 1 ( -T rk A /-N G F /-P e p tid e )
N e g a tiv e C o n tro l 2 (+ T rk A /-N G F /-P e p tid e )
N e g a tiv e C o n tro l 3 (-T rk A /+ N G F /-P e p tid e )
P o s itiv e C o n tro l 1 (+ T rk A /+ N G F /-P e p tid e )
C o n tro l ( -T rk A /+ N G F /+ P e p tid e )
L o w P e p tid e C o n c e n tra tio n
M e d iu m P e p ttid fe C o n c e n tra tio n
N o N G F b ind ing :
L o w b a c kg ro u n d
a b s o rb a n c e a t 4 5 0 n m
H ig h P e p tid e C o n c e n tra tio n
Fu
ll N
GF
bin
din
g:
Hig
h a
bs
orb
an
ce
at
45
0n
m
No
NG
F b
ind
ing
:
Lo
w b
ac
kg
rou
nd
ab
so
rba
nc
e a
t
45
0n
m
Min
ima
l N
GF
bin
din
g i
nh
ibit
ion
:
Hig
h a
bs
orb
an
ce
at
45
0n
m
Pa
rtia
l N
GF
bin
din
g i
nh
ibit
ion
:
Re
du
ce
d a
bs
orb
an
ce
at
45
0n
m
Hig
h N
GF
bin
din
g i
nh
ibit
ion
:
Min
ima
l a
bs
orb
an
ce
at
45
0n
m
Figure 6.10. Example TrkA Inhibition ELISA Results. Expected results of the TrkA inhibition ELISA. Low background absorbance’s would be expected from the negative controls whilst high absorbance from the positive control. Absorbance would decrease as peptide concentration was increased due to their inhibitory effect on NGF-TrkA binding.
The original A2 and D9 peptides showed a working concentration range of 2nM-100nM, so it
was deemed prudent to use this as a starting reference point for the concentration at which
the new peptides would be tested (Figure 6.11). Positive and negative controls of rh-βNGF
+/-TrkA without any peptide were included. As expected, the A2 and D9 controls showed
activity by inhibiting rh-βNGF binding over this concentration range whereas the library
peptides showed little, if any, inhibition (Figure 6.11 A). The unnatural amino acid peptides
performed marginally better with some show a low level of inhibition (e.g.F4 and G8)
although inhibition levels were not nearly as strong as A2 and D9 controls (Figure 6.11B).
Therefore it was decided to test a broader concentration range in order to determine the
peptides working concentration range.

186
Neg
ati
ve C
on
tro
l 1
Neg
ati
ve C
on
tro
l 2
Neg
ati
ve C
on
tro
l 3
Po
sit
ive C
on
tro
l 1 A
2D
9
A-E
3
B-F
11
A-G
11
A-C
11
B+F
3
B+C
5
B+H
7
B-D
11
B-G
11
A-F
5
B-G
3
B-F
3
0 .0
0 .5
1 .0
1 .5
2 .0
P e p tid e
A4
50
nm
C o n tro ls -T rk A /+ N G F /+ P e p tid e
2nM
2 0nM
1 0 0 n M (+ T rk A )
N e g a tive C o n tro l 1 : -T rkA /-N G F /-P e p tide
N e g a tive C o n tro l 2 : +T rkA /-N G F /-P e p tide
N e g a tive C o n tro l 3 : -T rkA /+ N G F /-P e p tide
P o s itiv e C o n tro l 1 : + T rk A /+ N G F /-P e p tid e
A

187
Neg
ati
ve C
on
tro
l 1
Neg
ati
ve C
on
tro
l 2
Neg
ati
ve C
on
tro
l 3
Po
sit
ive C
on
tro
l 1 D
9E
4E
5E
7E
9E
10
E11
F1
F2
F3
F4
F6
G8
H5
H7
H8
H10
H12
0 .0
0 .5
1 .0
1 .5
2 .0
P e p tid e
A4
50
nm
C o n tro ls -T rk A /+ N G F /+ P e p tid e
2nM
20nM
1 0 0 nM (+ T rkA )
N e g a tive C o n tro l 1 : -T rkA /-N G F /-P e p tide
N e g a tive C o n tro l 2 : +T rkA /-N G F /-P e p tide
N e g a tive C o n tro l 3 : -T rkA /+ N G F /-P e p tide
P o s itiv e C o n tro l 1 : + T rk A /+ N G F /-P e p tid e
B

188
Figure 6.11. Initial Peptide Testing. The peptides identified in screening process underwent ELISA testing, with an immobilised target of TrkA, as described in 2.2.11. Controls as illustrated in Figure 6.10 were used to ensure experimental validity. Every expressed peptide was tested –TrkA (red) and +TrkA (blue). A: Library peptides; B: Unnatural amino acid peptides.
As the peptides showed little activity at a 2-100nM concentration range it was decided to
broaden the testing range to 10µM-1mM. Once again the different peptides were tested
using a TrkA inhibition ELISA (2.2.11) as shown in Figure 6.12. This time over the broader
concentration range inhibition of rh-βNGF binding to TrkA was observed with the library
peptides Figure 6.12A). Due to the limited reagents values were not repeated so values are
variable but for peptides A-C11, B+F3, B+C5, B+H7 and B-G3 a working concentration range
of 100µM-1mM was observed. The other peptides show no inherent activity at this range.
The unnatural amino acid peptides likewise showed better activity over this broader range
with a selection (F4-H8) showing activity over the 10µM-1mM range (Figure 6.12B). Once a
working range had been established for those peptides exhibiting activity it was necessary to
further test their activity over a narrower range with repeats to ensure validity. The peptides
taken forward for further evaluation are illustrated in Figure 6.12 C.

189
Neg
ati
ve C
on
tro
l 1
Neg
ati
ve C
on
tro
l 2
Neg
ati
ve C
on
tro
l 3
Po
sit
ive C
on
tro
l 1
A-E
3
B-F
11
A-G
11
A-C
11
B+F
3
B+C
5
B+H
7
B-D
11
B-G
11
A-F
5
B-G
3
B-F
3
0 .0
0 .5
1 .0
1 .5
P e p tid e
A4
50
nm
C o n tro ls -T rk A /+ N G F /+ P e p tid e
1 0 0 nM
1uM
1 0uM
1 0 0 uM
1m M
N e g a tive C o n tro l 1 : -T rkA /-N G F /-P e p tide
N e g a tive C o n tro l 2 : +T rkA /-N G F /-P e p tide
N e g a tive C o n tro l 3 : -T rkA /+ N G F /-P e p tide
P o s itiv e C o n tro l 1 : + T rk A /+ N G F /-P e p tid e
A

190
Neg
ati
ve C
on
tro
l 1
Neg
ati
ve C
on
tro
l 2
Neg
ati
ve C
on
tro
l 3
Po
sit
ive C
on
tro
l 1 D
9E
4E
5E
7E
9E
10
E11
F1
F2
F3
F4
F6
G8
H5
H7
H8
H10
0 .0
0 .5
1 .0
1 .5
2 .0
P e p tid e
A4
50
nm
C o n tro ls -T rk A /+ N G F /+ P e p tid e
1 0 0 nM
1uM
1 0uM
1 0 0 uM
1m M
N e g a tive C o n tro l 1 : -T rkA /-N G F /-P e p tide
N e g a tive C o n tro l 2 : +T rkA /-N G F /-P e p tide
N e g a tive C o n tro l 3 : -T rkA /+ N G F /-P e p tide
P o s itiv e C o n tro l 1 : + T rk A /+ N G F /-P e p tid e
B

191
A-C
11
B+F
3
B+C
5
B+H
7
B-G
3F
4F
6G
8H
5H
7H
8
0 .0
0 .5
1 .0
1 .5
A4
50
nm
-T rk A /+ N G F /+ P e p tid e
100nM
1uM
10uM
100uM
1m M
L ib ra ry P e p tid e s U n n a tu ra l A m in o A c id P e p tid e s
C
Figure 6.12. Broad Concentration Range Peptide Testing. The peptides identified in screening process underwent ELISA testing, with an immobilised target of TrkA, over a broader concentration range as described in 2.2.11 Controls as illustrated in Figure 6.10 were used to ensure experimental validity. Every expressed peptide was tested –TrkA (red) and +TrkA (blue). A: Library peptides; B: Unnatural amino acid peptides; C: Summary.
Most of the peptides showed activity in inhibiting rh-βNGF-TrkA binding over a concentration
range of 10 µM-1 mM, apart from unnatural amino acid peptide H5 which showed activity of a
range of 1-100 µM. Due to the high peptide concentrations needed it was not possible to
analyse a full inhibition curve, therefore it was decided to test activity of the peptides at
incremental steps over their apparent linear ranges. To ensure the validity of these results
they were taken in triplicate. Selected library peptides are shown in Figure 6.13 while
unnatural amino acid peptides are shown in Figure 6.14. Although not measured at the time
the data previously gathered for the A2 and D9 control peptides are shown in Figure 6.13 for
reference, although as this is pooled data from different experiments the variability is high.

192
1 0 -91 0 -81 0 -7
-0 .4
-0 .2
0 .0
0 .2
0 .4
0 .6
0 .8
1 .0 A 2
L o g 1 0 [P e p tid e ] (M )
A4
50
nm
A
1 0 -91 0 -81 0 -7
-0 .4
-0 .2
0 .0
0 .2
0 .4
0 .6
0 .8
1 .0
1 .2D 9
L o g 1 0 [P e p tid e ] (M )
A4
50
nm
B
1 0 -61 0 -51 0 -41 0 -31 0 -2
0 .0
0 .2
0 .4
0 .6
0 .8
1 .0 A -C 1 1
L o g 1 0 [P e p tid e ] (M )
A4
50
nm
C
1 0 -61 0 -51 0 -41 0 -31 0 -2
0 .0
0 .2
0 .4
0 .6
0 .8
1 .0 B + C 5
L o g 1 0 [P e p tid e ] (M )
A4
50
nm
D
1 0 -61 0 -51 0 -41 0 -31 0 -2
0 .0
0 .2
0 .4
0 .6
0 .8
1 .0 B + H 7
L o g 1 0 [P e p tid e ] (M )
A4
50
nm
E
1 0 -61 0 -51 0 -41 0 -31 0 -2
0 .0
0 .2
0 .4
0 .6
0 .8
1 .0 B -G 3
L o g 1 0 [P e p tid e ] (M )
A4
50
nm
F
Figure 6.13. Library Peptide Dose Curves. The inhibitory effect of the library peptides was tested using a NGF inhibition assay as described in 2.2.11. Peptides were tested over a range of 10 μM to 1 mM (1mM, 600 μM, 400 μM, 200 μM, 100 μM, and 10 μM), with the higher inhibitory concentration limited by resources. A: A2 (control); B: D9 (control); C: A-C11; D: B+C5; E: B+H7; F: B-G3.
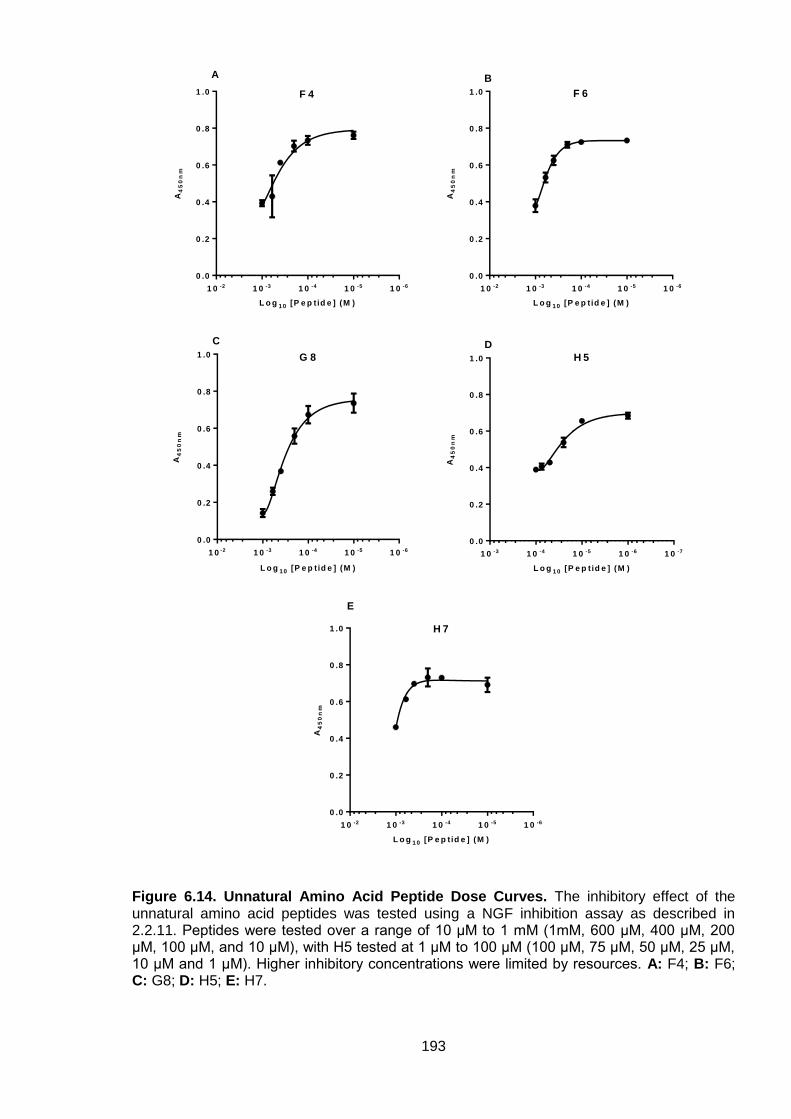
193
1 0 -61 0 -51 0 -41 0 -31 0 -2
0 .0
0 .2
0 .4
0 .6
0 .8
1 .0 F 4
L o g 1 0 [P e p tid e ] (M )
A4
50
nm
A
1 0 -61 0 -51 0 -41 0 -31 0 -2
0 .0
0 .2
0 .4
0 .6
0 .8
1 .0 F 6
L o g 1 0 [P e p tid e ] (M )
A4
50
nm
B
1 0 -61 0 -51 0 -41 0 -31 0 -2
0 .0
0 .2
0 .4
0 .6
0 .8
1 .0 G 8
L o g 1 0 [P e p tid e ] (M )
A4
50
nm
C
1 0 -71 0 -61 0 -51 0 -41 0 -3
0 .0
0 .2
0 .4
0 .6
0 .8
1 .0 H 5
L o g 1 0 [P e p tid e ] (M )
A4
50
nm
D
1 0 -61 0 -51 0 -41 0 -31 0 -2
0 .0
0 .2
0 .4
0 .6
0 .8
1 .0 H 7
L o g 1 0 [P e p tid e ] (M )
A4
50
nm
E
Figure 6.14. Unnatural Amino Acid Peptide Dose Curves. The inhibitory effect of the unnatural amino acid peptides was tested using a NGF inhibition assay as described in 2.2.11. Peptides were tested over a range of 10 μM to 1 mM (1mM, 600 μM, 400 μM, 200 μM, 100 μM, and 10 μM), with H5 tested at 1 μM to 100 μM (100 μM, 75 μM, 50 μM, 25 μM, 10 μM and 1 μM). Higher inhibitory concentrations were limited by resources. A: F4; B: F6; C: G8; D: H5; E: H7.

194
As anticipated from the broad peptide concentration range TrkA inhibition ELISA (Figure
6.12) both sets of peptides showed a reasonable downward trend of rh-βNGF binding as the
peptide concentration increased, with minimal error seen across most of the data points. The
minimal error ensures the validity of the inhibition observed.
All the library peptides showed inhibition of some form Figure 6.13 with some plateauing
(B+H7, Figure 6.13 E) at the lowest peptide concentrations. Once again, due to the
concentration needed it was not possible to test inhibition at concentrations greater than
1mM although based on the data it would suggest that higher concentrations still are needed
for full inhibition of NGF binding to TrkA. B+C5 and B+H7 (Figure 6.13 D and E respectively)
had showed the greatest inhibitory response suggesting that these were the most potent of
the library peptides.
Once again as expected the unnatural amino acid peptides were seen to be in the active with
F4 and F6 showing similar levels of inhibition (Figure 6.14 A and B). Based on Figure 6.12
G8 appeared to be the second most potent NGF inhibitor, behind H5, however based on the
higher absorbance observed at 100 µM it was decided to test 100 µM-mM peptide
concentration range in Figure 6.14, although in hindsight it may have been more prudent to
test over the same range all the other peptides. Whilst H5 (Figure 6.14 D) does not
necessarily show the most inhibition it must be noted that this was using a peptide
concentration scale 10-fold lower than the other peptides tested due to the better levels of
inhibition previously shown. It would also appear that H7 (Figure 6.14 E) was at the limits of
activity with its inhibitory effects starting to plateau past 400 µM.

195
6.8. Discussion
6.8.1. Biotinylation
The biotinylation process was successful with 4-5 biotins attached to the majority of
molecules although ideally a biotinylation level of 1-2 biotins per molecule would have been
sufficient, as the increased numbers of biotin may interfere with potential peptide binding.
Increased biotins on rh-βNGF may have caused some structural changes depending on
where they have attached with a possible seven free amines available. However, owing to
the limited amount of rh-βNGF available and that any peptides pulled through as a result of
binding to structurally different rh-βNGF would be screened out by later testing, the achieved
level of biotinylation was deemed acceptable.
6.8.2. Library Screening
Initial inspection of the sequencing results from the screened selection output (Figure 6.8)
suggests little, if any amino acid preference at positions 1, 4 and 6 (LH1, 4 and RH6
respectively), whilst valine is preferred at position 2 (LH2) and proline was fixed at position 3
(LH3). Meanwhile, histidine appears to be a preference at position 5 (LH5) and leucine and
histidine are preferred at positions 7 (RH5) and 8 (RH4) respectively, whilst aspartic acid,
tryptophan and valine are preferred at positions 9, 10 and 11 respectively, within the anti-
NGF peptide. However, as discussed in section 1.5.2, all screens assume equal
concentrations of library components and thus screening outcomes may be influenced by
actual (rather than designed) library composition. In the current data set for example, the
over-representation of leucine and histidine at positions 5 & 7 and aspartic acid at position 9
in the original library (Chapter 4) may have influenced subsequent screening results
disproportionately.
Therefore, to take into account any bias introduced from variation between designed and
observed codon representation, the codon representation before and after selection were
compared (Figure 6.15).

196
Figure 6.15. Changes in Amino Acid Representation Before and After Selection for NGF Binding. Percentages were calculated by subtracting the percentage codon representation in the original library (Figure 4.13) for each amino acid, at each position in the anti-NGF gene, from amino acid representation in the pool of peptides selected via NGF binding.

197
The results of the differences before and after suggest that alanine or glycine are preferred at
position1, whilst both valine is preferred at position 2. At position 4, interpretation is less
straightforward. Here, 18 amino acids were encoded since Isogenica’s proprietary SPOT
analysis showed no overall preference and whilst lysine, serine, threonine and valine show
increased representation at position 4 after screening, phenylalanine, asparagine, proline
and tyrosine appear to be selected against. Thus there is no clear chemical preference at
position 4; selected residues include positive charge (lysine), OH-containing (serine,
threonine) and hydrophobic (valine). At position 5, histidine and asparagine are preferred
(both can form H-bonds), whilst interestingly, both aspartic acid and lysine at position 5 show
large decreases in representation at this position after selection. At position 6 leucine is
selected against, whereas it is preferred at position 7. Positions 8 shows a weak preference
for histidine or glutamic acid (opposite charges), whereas positions 9 and 10 show lower
relative selectivity once representation in the original library is taken into account. This is
particularly relevant for position 9, where initial inspection of the sequencing data (Figure 6.8)
would suggest that aspartic acid is strongly-preferred over glutamic acid. However, when
library representation is taken into account at that position, the difference is minor. Finally at
position 11, based on Isogenica’s original, SPOT analysis, position 11 (RH1) was saturated
with the hydrophobic amino acids isoleucine, leucine, proline and valine. Of these, valine,
which dominated the raw sequencing data, is actually selected against when codon
representation is taken into account, whilst there are again minor preferences for structurally-
similar leucine and isoleucine. These collective findings are summarised in Table 6.5
Position 1 2 3
(fixed) 4 5 6 7 8 9 10 11
Amino acid
A/G V P K/S/T/V
H/N I/V
(weak) L
E/H (weak)
D (weak)
W (weak)
I/L (weak)
Table 6.5 Consensus of Amino Acid Preferences in Anti-NGF Peptide Monomers After Taking Library Composition into Account.
Obviously, with n=1 for each of the 12 selected full-length peptides, it is difficult to conduct
meaningful statistical analysis of the above interpretations which should therefore be treated

198
with caution. Nonetheless, this small, post-selection population does show some interesting
patterns with amino acids particularly favoured (>+15%) at positions 1, 2, 5, and 7. Leucine
preference at position 7 is particularly interesting as this backs the sequencing results that
leucine is favoured and not just an artefact of biased codon representation with the
constructed library.
6.8.3. Peptide Testing - ELISA Results
The activities of the library and unnatural amino acid peptides were not as potent as the
dimeric A2 and D9 controls. Although such findings are potentially discouraging, they are not
entirely surprising since the control peptides are hypothesised to be dimeric whereas the full-
length tested peptides are incapable of forming dimers via disufide bridges (cysteine is
omitted from all positions). As mentioned in chapter 1 NGF and TrkA binding operates
through two distinct patches (conserved and specific patches), as illustrated in Figure 6.16
with the conserved patch (red) and specificity patch (orange) circled, although it is not
currently known where the peptides target precisely.
Figure 6.16. NGF-TrkA-d5 binding pocket (original image taken from Wiesmann et al. (Wiesmann et al., 1999)). Conserved and specificity patches are circled red and orange respectively.
Thus, the results herein suggest that the dimeric properties (or at least cysteine content) of
the control peptides are important in the effective inhibition of NGF-TrkA binding. Such

199
increased potency of the dimeric control peptides could be due to the presence of two NGF
binding motifs (through the dimerization of two peptides containing a single binding motif
respectively). On the other hand, only a single binding motif in the dimer may be required but
the increased length of the dimerized peptides could physically block the binding patches of
NGF.
In this regard, it is particularly interesting that several n-1 genes were selected, with
substantial enhancement, when considering the original library composition. The original
library encoded 71.0% full-length peptides just 13.2% frameshift mutations caused by n-1
deletions in the genes. Yet after screening, 6 of the 18 returned sequences were of n-1
frameshifted mutants and of these, 5 contained one or more cysteine residues (27.8%).
These results suggest that cysteine, although undesirable in terms of manufacturing, may be
of importance in NGF binding, either via dimerization or else via direct interaction with either
TrkA or NGF, in a manner which inhibits TrkA-NGF binding. Having said this, the presence of
the cysteines in the n-1 sequences somehow pulling them through the selection process may
also be a misnomer. Due to the one nucleotide deletion the reading frame shifted causing the
translation of a poly-arginine tail in the peptides. All of these poly-R n-1 sequences originated
from selection reactions containing heparin, whereas none were observed from the
selections that did not contain heparin. Whilst this could just be a coincidence it may also
have been possible that the n-1 peptides were preferentially selected due to a charge
interaction between heparin and heir poly-R tail. However, this would have only occurred
during the in vitro transcription/translation step at the beginning of each round of selections.
In order to be recovered at the end of each round there had to have been some affinity of rh-
βNGF as the selections underwent a series of wash steps to remove non-specific binders.
Based on the broad peptide concentration range testing (Figure 6.12) it appeared that most
of the monomeric peptides showed a minimum inhibition of rh-βNGF at approximately 100
μM, with H5 from the unnatural amino acid set showing a minimum inhibition at
approximately 1-10 μM. It was not possible to acquire IC50 values, since at the highest
peptide concentrations that it was possible to analyse. All of the library peptides had a range

200
of activity over the 100 µM-1 mM ranges with B+C5 and B+H7 (Figure 6.13 D and E)
appearing to have the highest inhibitory effect over this range. Interestingly both B+C5 and
B+H7 contained glycine at position 1, proline (fixed) at position 3, glutamine at position 5,
alanine at position 6, leucine at position 7 and aspartic acid at position 9 suggesting possible
importance (54.5% sequence homology across the randomised region) as well as basic
residues at position 8.
In the case of the unnatural amino acid peptides G8 and H5 (Figure 6.14 C and D) were the
most potent NGF inhibitors, with H5 showing comparable activity (in relation to the
appearance of the plot) to those other peptides tested but at 10-fold lower concentrations. In
the case of H5 the proline at position 3, which is critical for peptide activity, is replaced with
L-Hydroxyproline, a post-translationally hydroyxylated proline, only. With only a single
substitution this peptide is the most similar of all the tested peptides to dimeric A2 control,
despite which still showed comparative drop in inhibitive activity.
Although disappointingly the monomeric peptides showed a reduced inhibitory effect these
results do raise some interesting questions about their overall mechanism of action. In the
case of the inhibition of binding events it is easy to assume that the area of action is at the
point of binding (in this case the TrkA-NGF interface), although it is possible that
conformational changes as a result of inhibitor binding elsewhere on the complex may
prevent interaction. As previously mentioned there are two interfaces for NGF to bind a
single TrkA, with the NGF homodimer binding two TrkA receptors. Therefore, in this case do
the anti-NGF (NGF-binding) peptides block the interaction of NGF and TrkA at their interface
or do they bind to the NGF homodimer subsequently interfering with the NGF-TrkA
interaction?
The fact that the monomeric peptides show reduced potency than the dimeric versions could
suggest some conformational restriction is crucial for inhibition of the complex. Both
monomeric and dimeric peptides share the NGF binding motif, albeit with potential
optimisation through mutagenesis in the monomeric peptides, so the question is why are two
peptides that are linked through a disulfide bond more potent than two single, unlinked
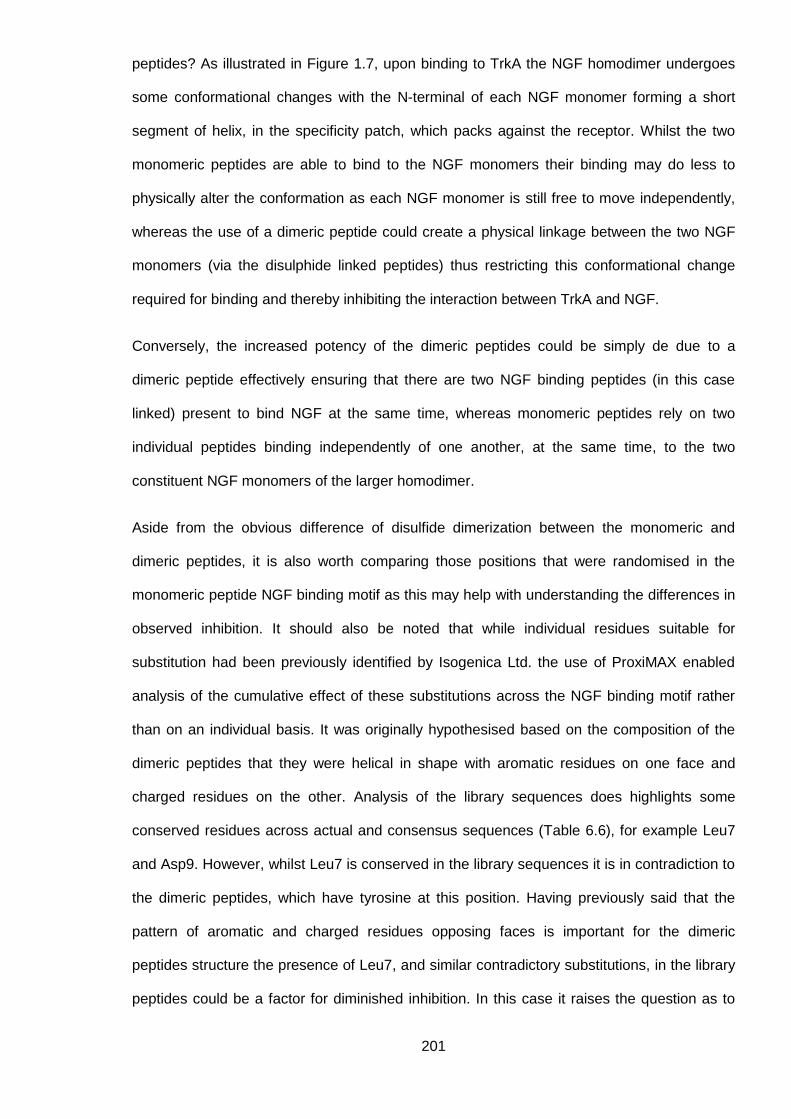
201
peptides? As illustrated in Figure 1.7, upon binding to TrkA the NGF homodimer undergoes
some conformational changes with the N-terminal of each NGF monomer forming a short
segment of helix, in the specificity patch, which packs against the receptor. Whilst the two
monomeric peptides are able to bind to the NGF monomers their binding may do less to
physically alter the conformation as each NGF monomer is still free to move independently,
whereas the use of a dimeric peptide could create a physical linkage between the two NGF
monomers (via the disulphide linked peptides) thus restricting this conformational change
required for binding and thereby inhibiting the interaction between TrkA and NGF.
Conversely, the increased potency of the dimeric peptides could be simply de due to a
dimeric peptide effectively ensuring that there are two NGF binding peptides (in this case
linked) present to bind NGF at the same time, whereas monomeric peptides rely on two
individual peptides binding independently of one another, at the same time, to the two
constituent NGF monomers of the larger homodimer.
Aside from the obvious difference of disulfide dimerization between the monomeric and
dimeric peptides, it is also worth comparing those positions that were randomised in the
monomeric peptide NGF binding motif as this may help with understanding the differences in
observed inhibition. It should also be noted that while individual residues suitable for
substitution had been previously identified by Isogenica Ltd. the use of ProxiMAX enabled
analysis of the cumulative effect of these substitutions across the NGF binding motif rather
than on an individual basis. It was originally hypothesised based on the composition of the
dimeric peptides that they were helical in shape with aromatic residues on one face and
charged residues on the other. Analysis of the library sequences does highlights some
conserved residues across actual and consensus sequences (Table 6.6), for example Leu7
and Asp9. However, whilst Leu7 is conserved in the library sequences it is in contradiction to
the dimeric peptides, which have tyrosine at this position. Having previously said that the
pattern of aromatic and charged residues opposing faces is important for the dimeric
peptides structure the presence of Leu7, and similar contradictory substitutions, in the library
peptides could be a factor for diminished inhibition. In this case it raises the question as to

202
why these types of substitutions would be enriched if they reduce the inhibitory effect. This
may be an effect of the selection process where peptides were selected on their ability to
bind NGF resulting in the enrichment sequences that improve NGF binding but do not
necessarily effect TrkA inhibition. Interestingly the net charge may also be a factor to be
considered with both control peptide showing net negative charge in the binding motif
whereas the active library peptides are either neutral or positively charged. Ultimately there is
in-sufficient data (when n=12) to truly make firm conclusions regarding consensus
sequences, as highlighted by the presence of Gln5 in both actual most active library peptides
but not in either consensus sequence.
Position 1 2 3
(fixed) 4 5 6 7 8 9 10 11
A2 G W P A E V Y E D W P
D9 V W P A E V Y Q D W P
Non-compensated
None V P None H A L H D W R I/V
Compensated A G V P K V S T H N I/V
L E H D W I/L
B+C5 G V P A Q A L H D F P
B+H7 G Y P K Q A L R D R V
Table 6.6. Comparison of Consensus and Actual Peptide Sequences. The two library peptides that showed the best inhibition of NGF-TrkA binding compared to the non-compensated consensus sequence, generated from the sequencing data, and the compensated consensus sequence, accounting for codon bias observed in the anti-NGF peptide library as well as the two dimeric control peptides. Amino acids are highlighted on their structural features: basic, non-polar, polar, uncharged, and acidic.

203
Chapter 7
Discussion and Conclusions

204
7. Chapter 7: Discussion and Conclusions
7.1. Summary of Results
The initial aim of this project was to analyse the ProxiMAX process, by producing a generic
randomised library, from which changes could be implemented to improve factors such as
codon representation and library quality. This improved process could then be used to
generate a randomised library with the aim of engineering a high-affinity, monomeric anti-
NGF peptide, which was based on the maturation of two dimer peptides that exhibited a
conserved NGF binding motif. This library would then be screened using CIS display, a cell
free display technique, in order to evaluate the power of new techniques in protein
engineering that combine the production of high quality non-degenerate libraries with robust
high capacity cell-free display techniques.
To start with the aim was to ligate an equimolar mix of MAX oligonucleotides to an acceptor
sequence in a single reaction in order to test the method. A total of six cycles were
undertaken using codon subsets in each cycle. Molecular weight comparison of the PCR
products from each cycle showed an increase in size throughout the process that suggested
the sequential addition of codons cycle-by-cycle had worked correctly. Capillary sequencing
of small number of samples confirmed that the additions were successful showing the
expected six randomised codons with the correct codons from each set in the right positions.
Library diversity and codon representation was analysed by next-generation sequencing,
which showed that there was significant bias to single sequence that made up 64.47% of the
entire library. Whilst this representation was obviously an issue with the process it is not only
limited to the ProxiMAX methodology but is a common theme in many non-degeneration
saturation mutagenesis methods including trinucleotide phosphoramidites. As a result the
process was analysed in order to determine area where this bias may have been introduced.
This concluded that oligonucleotide quality/quantification and blunt ended ligations using T4
DNA ligase were two critical areas that can greatly affect the outcome.

205
The use of partially complementary oligonucleotide (5’overhang on forward strand) that
required hybridisation lead to the use of the Quant-iT™ PicoGreen® dsDNA assay in order to
quantify double stranded DNA in the presence of un-hybridised ssDNA. However, due to
light-sensitivity this reagent was liable to degrade quickly that in turn may lead to erroneous
quantification. Variations in hybridised MAX oligonucleotide concentration would therefore
bias the oligonucleotide mix that would then be carried throughout the process. After initial
hybridisation the oligonucleotides may also dissociate from one another whilst in storage
causing variations in the true concentrations of the double-stranded oligonucleotide stock.
The use of single stranded self-complementary oligonucleotides to form hairpins, which could
then be quantified by UV spectrometry, was introduced to improve oligonucleotide stability
and improve quantification.
T4 DNA ligase appears to show sequence specificity favouring sequences with codons such
as the histidine codon 5’-CAT-3’ at the 3’ end whilst discriminating against others such lysine
and threonine (Ashraf et al., 2013), although the exact point at which sequence preference is
inferred is not yet known. In the long term, detailed knowledge of why T4 DNA ligase shows
sequences specificity is interesting and could be used to potentially improve the process
(and is now the subject of another, ongoing study), in the short term it was necessary to
mechanistically circumvent this issue in order to improve the library quality. Ligase
preference was addressed by using separate ligations of individual MAX oligonucleotides
that would then be amplified, quantified and then mixed at an equimolar level.
Based on Isogenica’s proprietary alanine scanning and SPOT analysis of two maturated ant-
NGF peptides, a 10 amino acid motif was identified. The pattern of substitutions showed the
aromatics at W, Y, W (positions 2, 7 and 10) on one side and the charged residues on the
other, so as a result it was postulated that the peptides were helical and dimerize through the
C-terminal cysteine (common with dimeric peptides (Liu et al., 2009, Wu et al., 2012)) to
inhibit NGF binding to TrkA. Based on these peptides, a library for a high affinity monomer
peptide was designed, in conjunction with Isogenica, with 11 randomised positions based
around the binding motif highlighted from Isogenica’s proprietary alanine scanning and SPOT

206
analysis. Whilst this library was being constructed, the changes in the ProxiMAX procedure
with regard to regards to quantification and T4 DNA ligase were incorporated.
Two libraries consisting of 5 and 6 randomised regions (LH and RH respectively) were
constructed and ligated together to form the complete library with 11 contiguous randomised
positions. NGS analysis showed that over 61% of the read sequences were truncated by 3
codons with only 5% showing the complete library. Despite the truncation, the observed
codon representation was much improved, although some positions showed codon bias with
the most serious (position LH4) showing significant bias.
Analysis using an internal primer (in order to shorten the LH library framework), followed by
polyacrylamide gel electrophoresis suggested that the truncation was introduced by the
carry-over of un-digested material from the first cycle product through cycles 2 and 3, which
was subsequently re-amplified in cycle 4 when the sequential use of 3 sets of MAX
oligonucleotides meant its complementary primer was present. Due to the lower resolving
power of agarose gels it was not possible to visualise the difference in size of the different
products. Rather than using agarose gel purification, gel purification from PAGE could be
used in order to reliably resolve and purify the MlyI digests each cycle. The full length 72-mer
library represented library diversity of 86.9% although the low number of correct length
sequences only equated to 0.1% coverage so should considered with caution. When taking
into account for a reduced library size of 2.51x10⁵ the truncated library showed poor diversity
(49.8%) with 42.7% coverage.
The combination of the truncation and biased LH4 position meant that the LH portion of the
library had to be resynthesized. For the re-synthesis it was decided that the PCR
quantification, prior to mixing, should be assessed by nanodrop rather than pixel density after
gel electrophoresis. This was due to potential error in quantification being introduced as
result in variation in gel loading and running conditions.
The resynthesized LH library was ligated to the existing RH library and NGS analysis
resulted 71% of the sequences read containing the full length library. Using the adjusted
quantification method also resulted in further improvements in the codon representation. In

207
contrast to the first anti-NGF peptide library, the represented diversity of the final anti-NGF
peptide library was good (68.7%) with 1.2% of the potential library covered.
There was remarkable similarity between the RH portion of the final library and the RH
portion of both previous anti-NGF libraries and as this was the same all the anti-NGF peptide
libraries it validates the consistency of sequencing data. The calculated diversity of the first
72-mer library highlight the need for as large a sample number as possible in order to make
the results as statistically accurate as possible. Although the 72-mer library shows a large
bias in the LH4 position it had a calculated diversity of 86.9% with only 0.1% coverage of all
possible sequences. However, the final anti-NGF peptide library had 68.7% diversity from
1.2% library coverage despite a far improved codon representation at position LH4. A
mitigating factor for this drop in diversity, despite the improved representation in the final
library can attributed to a failure in the primer introduced mutation at position LH-1, although
as is the case in all statistics, the larger the sample size the more faith in the accuracy of the
results.
Recombinant human βNGF (rh- βNGF), purchased from R&D systems, was biotinylated,
using EZ-Link™Sulfo-NHS-Biotin (Thermo Scietific), in order to be used as a streptavidin-
immobilised target for CIS display. The anti-NGF peptide library then underwent four rounds
of CIS display with selection stringency increasing throughout the process.
Library selections and screening are discussed at length in section Chapter 6, Section 6.8.
The theoretical library diversity of the ProxiMAX-produced anti-NGF peptide library (2.7x10⁷)
is well within the screening capacity of CIS display, which can screen libraries with up to 1014
members (Odegrip et al., 2004). In order to pre-evaluate the selections, the CIS display
output DNA sequences were cloned, expressed as phage fusions and subsequently
screened for peptides that exhibited NGF affinity using an ELISA assay with immobilised
NGF. Phage display may be considered a bottleneck in the process due to the limited ability
to effectively express and screen the clones, but is valuable in that it allows elimination of
peptide sequences that do not exhibit the required specificity (in this case for NGF).
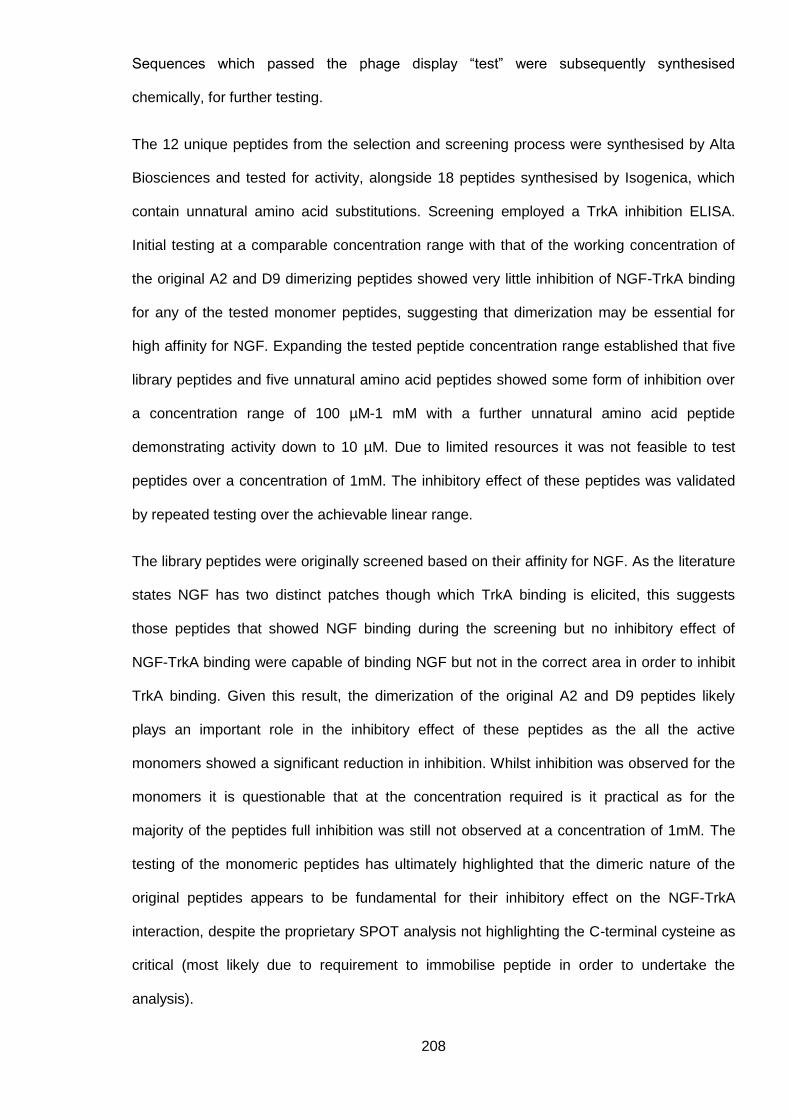
208
Sequences which passed the phage display “test” were subsequently synthesised
chemically, for further testing.
The 12 unique peptides from the selection and screening process were synthesised by Alta
Biosciences and tested for activity, alongside 18 peptides synthesised by Isogenica, which
contain unnatural amino acid substitutions. Screening employed a TrkA inhibition ELISA.
Initial testing at a comparable concentration range with that of the working concentration of
the original A2 and D9 dimerizing peptides showed very little inhibition of NGF-TrkA binding
for any of the tested monomer peptides, suggesting that dimerization may be essential for
high affinity for NGF. Expanding the tested peptide concentration range established that five
library peptides and five unnatural amino acid peptides showed some form of inhibition over
a concentration range of 100 µM-1 mM with a further unnatural amino acid peptide
demonstrating activity down to 10 µM. Due to limited resources it was not feasible to test
peptides over a concentration of 1mM. The inhibitory effect of these peptides was validated
by repeated testing over the achievable linear range.
The library peptides were originally screened based on their affinity for NGF. As the literature
states NGF has two distinct patches though which TrkA binding is elicited, this suggests
those peptides that showed NGF binding during the screening but no inhibitory effect of
NGF-TrkA binding were capable of binding NGF but not in the correct area in order to inhibit
TrkA binding. Given this result, the dimerization of the original A2 and D9 peptides likely
plays an important role in the inhibitory effect of these peptides as the all the active
monomers showed a significant reduction in inhibition. Whilst inhibition was observed for the
monomers it is questionable that at the concentration required is it practical as for the
majority of the peptides full inhibition was still not observed at a concentration of 1mM. The
testing of the monomeric peptides has ultimately highlighted that the dimeric nature of the
original peptides appears to be fundamental for their inhibitory effect on the NGF-TrkA
interaction, despite the proprietary SPOT analysis not highlighting the C-terminal cysteine as
critical (most likely due to requirement to immobilise peptide in order to undertake the
analysis).

209
7.2. Discussion and Conclusions
7.2.1. ProxiMAX Randomisation
The generation and refinement of DNA libraries using standard molecular biology techniques
and equipment has demonstrated a core principle of ProxiMAX randomisation; its relative
simplicity compared to other non-degenerate saturation mutagenesis techniques. In theory
this process can be undertaken in any standard lab with access to standard molecular
biology techniques, whereas other methods such as trinucleotide phosphoramidites require
more specialist knowledge and equipment that are not easily put to use.
Whilst trying to the praise the virtues of ProxiMAX randomisation there is as ever a caveat to
this which is, as is the case with many methodologies there is a correct time and place for
their use, very few can truly be used universally. Even though MAX oligonucleotides can be
reused for multiple libraries, with only the framework oligonucleotides specific to each library,
the initial start-up cost is greater than other methods although this would obviously be
counteracted the more libraries the MAX oligonucleotides are used to create. The use of
iterative cycles of ligation, PCR and digestion, along with purification steps, also make
ProxiMAX randomisation quite labour intensive, especially compared to non-degenerate
mutagenic primer methods Aside from the cost, both in money and time, if only a few
positions at particularly disparate parts of a protein are targeted then ProxiMAX is not
suitable as the library diversity would be a minor issue not to warrant its use and there would
be more efficient methods of achieving this goal. Having highlighted some the downsides to
ProxiMAX it is also worth saying that there are times when it would also be the best
candidate. ProxiMAX has been successfully used in the randomisation of antibody loops
where long segments of amino acids have been randomised. As the number of residues
targeted increases factors such as library diversity/bias for degenerate mutagenesis, and
practicality (i.e. number of primers needed) for non-degenerate methods start to take effect
making the use other mutagenesis methods less viable. This is where the ability of ProxiMAX
to be selectively choose smaller groups of amino acid to randomise helps maximise the

210
efficiency of library production by maintaining high diversity across many randomised
positions.
This project has further expanded the repertoire for the use of ProxiMAX randomisation by
using it to mutagenize peptides, which is potentially easier to undertake than antibody loop
mutagenesis, as the whole peptide sequence can be encompassed by the libraries
frameworks rather than having to insert back, in-frame, in to an antibody’s sequence. Not
only this but the mechanisms for subsequent screening processes, such as CIS display, can
also be included in the peptides library frameworks rather than sub-cloning into the
necessary vectors after the insertions of the randomised portion.
There are still areas of the ProxiMAX process that can be improved in order to increase the
quality of the libraries and improve codon representation. For example, current studies into
the exact mechanisms that confer sequence preference to T4 DNA ligase will be beneficial,
since in the long term, better knowledge this could help to simplify the process back to single
reaction with even codon representation, which would reduce costs and process time. Whilst
work undertaken in this project has shown improved codon representation in the generated
libraries, further work outside of this project has shown that adjustment of donor sequences
(rather than the equimolar concentrations of donors used in this study) can be used to
compensate for sequence preferences of T4 ligase, to generate a near-equal ratio of codons
within the randomised gene (Ashraf et al., 2013). Followed on from this ProxiMAX has also
been further optimised to improve codon representation whilst also automating the process
and thus removing some the labour intensive steps required to improve codon representation
(Frigotto et al., 2015). Obviously the automation process takes the feasibility of use away
from the standard laboratory as specialised equipment is required, but the core simplicity of
the iterative process remains the same.

211
7.2.2. CIS Display
As the title to this work suggest, the aim was not only to use ProxiMAX randomisation to
generate libraries, but to use it combination with CIS display to screen the resulting libraries.
The combination of these modern methods of library generation and screening is meant to
highlight the optimisation of modern protein engineering away from more traditional methods
such as NNN saturation mutagenesis and phage display. As highlighted in chapter 1, the
natural choke point of the whole process is not the ability to generate the libraries but the
ability to select and screen them.
CIS display appears to present a viable alternative to these traditional methods by
circumventing the drawbacks of both in vivo (transformation efficiency) and in vitro (complex
instability) display technologies. In my experience of using the process it is relatively simple
to learn and quick to undertake, both desirable factors for such technologies. The need to
transform the selection output for screening may be considered a bottleneck in this process
because of the feasibility of picking/growing and tested individual colonies, similar to the
drawbacks of phage display. However the important difference is that the library has already
undergone selections with desirable sequences enriched and undesirable sequences
removed, meaning that the transformations are undertaken with a higher quality pool of DNA
and therefore hopefully increasing the chances of finding novel mutants.
Although not used for this work, CIS display is now also routinely used in conjunction with
next generation sequencing to allow analysis of sequence enrichment throughout the
selection process. However, while this is useful information this does not remove the need
for subsequent library screening as the enriched sequences may not necessarily show the
desired function, for example in this project peptides were initially selected for their ability to
bind to NGF with the ultimate goal to find peptides that caused TrkA inhibition, through
binding NGF. Next generation sequencing of the selection output may show enrichment of
peptides sequences that bind to NGF but do not necessarily inhibit its interaction with TrkA,
hence why the subsequent screening process is still vital.

212
7.2.3. Peptides: Therapeutics, Interactions and Optimisation
As already highlighted in chapter one (1.7) peptides are becoming increasing favoured for
therapeutic use due to their excellent safety, tolerability and efficacy profiles, like that of
larger proteins, with the lower production complexity and costs normally associated with
small molecules. Although over 7000 naturally occurring peptides have been identified many
of these are necessarily suitable of pharmaceutical use due to weaknesses such as short
circulation plasma half-life, aggregation, physical and chemical stability (Fosgerau and
Hoffmann, 2015). Therefore these weaknesses make peptides ideal candidates for protein
engineering using saturation mutagenesis techniques, especially ProxiMAX randomisation.
Based on the either the crystal structure or molecular models of known peptides rationally
designed libraries can be designed with the view of identifying essential residues with the
peptides in order to counteract their know weaknesses, for example the elimination
hydrophobic patches by substitutions or N-methylation of amino acids in order to reduce
peptide aggregation. This is of particular importance as, in general, the ultimate goal in to
produce liquid drug formulations because of the acidic and enzymatic degradation
experienced by oral peptide drugs. Due to their small size this identification, design and
substitution process should be comparatively simple and easier to predict compared to that
of larger proteins where changes could make much larger conformational changes. However,
whilst making all these changes it is obviously important to maintain the pharmacokinetic
properties that make the peptides desirable targets to begin with.
As mentioned in 7.2.1, peptides are ideal candidates for ProxiMAX randomisation due to
their short length. Once the identification of key residues for activity have been identified
through alanine scanning ProxiMAX can be used to quickly substitute residues within the
peptides for a group of others that could benefit it pharmaceutically. This would allow the
cumulative effect of multiple randomised positions to be analysed and the generation of
potentially novel peptides far more efficiently. An example of where ProxiMAX could be used
to further improve a peptides function is the therapeutic use of glucagon. This is normally
used in the treatment of hypoglycaemia and is only available in a kit as a lyophilized peptide

213
powder, which requires reconstitution and agitation. Obviously this is a less than ideal
situation where time is critical, so ProxiMAX could potentially be used to improve the stability
and solubility in order for glucagon to remain in solution for long periods of time (Fosgerau
and Hoffmann, 2015).
In the case of the anti-NGF peptides, either structural studies, such as crystallography, or
molecular modelling would help with understanding the mechanics of the inhibitory process
of the dimers and would shed light on whether the increased inhibitory effects are due to the
presence of two of the binding motifs or whether a single binding motif is required but the
increased length of the dimer causes physical obstruction of NGF-TrkA binding. As
hypothesised in chapter 6 (6.8.3) I now believe it is more likely that the dimeric peptides bind
to the NGF monomers and prevent/limit the structural reordering required for the NGF
homodimer to bind to TrkA, rather than physical competition at the NGF-TrkA interface,
hence why the dimer peptides show more significant inhibition than the monomeric peptides.
C-terminal truncations of the dimeric A2 peptide to remove the cysteine would also help to
validate the importance of the C-terminal cysteine for activity, whilst testing dimeric peptides
in the presence of a reducing agent would prove or disprove the necessity of the disulphide
bond. Conversely, a C-terminal cysteine could be introduced to the active library peptides to
enable comparison between the randomised binding motif and the WT, without dimerization
becoming a limiting influence. If it was determined that the dimeric peptides restrict the NGF
reordering it would also be interesting to design and test a single longer monomeric peptide
with two NGF binding motifs, one at each terminal, to see whether this had a similar
inhibitory profile. Due to the iterative nature of the ProxiMAX it would be feasible to use on
such peptides as there is no physical limit to how many randomised codons can be added,
just the theoretical limits based on sequence space and the ability to screen such a library. It
may also be iterating to substitute the disulfide link for other means of dimerization such as
Cys-maleimide thioether, triazoles or amides, as these may affect the stability, and
subsequent activity, of the dimer.

214
Quantitative binding studies, such as surface plasmon resonance, of those dimer and
monomer peptides that show NGF-TrkA could help characterise the peptides affinity for NGF
binding, whilst in vitro neurite outgrowth inhibition assays would help demonstrate the
physiological effect of the peptides activity. Finally, a simple test to attempt to establish the
peptide area of inhibition on NGF could be to their inhibitory effects on other neurotrophins
and their respective receptors thus establishing or precluding NGF specificity.

215
Chapter 8
References

216
8. References
Abdiche, Y. N., Malashock, D. S. & Pons, J. 2008. Probing the binding mechanism and
affinity of tanezumab, a recombinant humanized anti‐NGF monoclonal antibody,
using a repertoire of biosensors. Protein Science, 17, 1326-1335.
Aloe, L., Braccilaudiero, L., Bonini, S. & Manni, L. 1997. The expanding role of nerve growth
factor: from neurotrophic activity to immunologic diseases. Allergy, 52, 883-894.
Aloe, L., Rocco, M. L., Bianchi, P. & Manni, L. 2012. Nerve growth factor: from the early
discoveries to the potential clinical use. J Transl Med, 10, 239-239.
Arakawa, T. & Ejima, D. 2014. Refolding Technologies for Antibody Fragments. Antibodies,
3, 232-241.
Ashraf, M., Frigotto, L., Smith, M. E., Patel, S., Hughes, M. D., Poole, A. J., Hebaishi, H. R.
M., Ullman, C. G. & Hine, A. V. 2013. ProxiMAX randomization: a new technology for
non-degenerate saturation mutagenesis of contiguous codons. Biochemical Society
transactions, 41, 1189-94.
Baxter, D., Ullman, C. G. & Mason, J. M. 2014. Library construction, selection and
modification strategies to generate therapeutic peptide-based modulators of protein-
protein interactions. Future Medicinal Chemistry, 6, 2073-2092.
Beghetto, E. & Gargano, N. 2011. Lambda-Display: A Powerful Tool for Antigen Discovery.
Molecules, 16, 3089-3105.
Bertschinger, J. & Neri, D. 2004. Covalent DNA display as a novel tool for directed evolution
of proteins in vitro. Protein Engineering Design & Selection, 17, 699-707.
Bessette, P. H., Aslund, F., Beckwith, J. & Georgiou, G. 1999. Efficient folding of proteins
with multiple disulfide bonds in the Escherichia coli cytoplasm. Proceedings of the
National Academy of Sciences of the United States of America, 96, 13703-13708.
Bessette, P. H., Rice, J. J. & Daugherty, P. S. 2004. Rapid isolation of high-affinity protein
binding peptides using bacterial display. Protein Engineering Design & Selection, 17,
731-739.

217
Bosley, A. D. & Ostermeier, M. 2005. Mathematical expressions useful in the construction,
description and evaluation of protein libraries. Biomolecular Engineering, 22, 57-61.
Bradshaw, R. A., Murrayrust, J., Ibanez, C. F., Mcdonald, N. Q., Lapatto, R. & Blundell, T. L.
1994. Nerve growth-factor- structure-function-relationships. Protein Science, 3, 1901-
1913.
Buchwald, H., Dorman, R. B., Rasmus, N. F., Michalek, V. N., Landvik, N. M. & Ikramuddin,
S. 2014. Effects on GLP-1, PYY, and leptin by direct stimulation of terminal ileum and
cecum in humans: implications for ileal transposition. Surgery for Obesity and Related
Diseases, 10, 780-786.
Chao, M. V. 1992. Neurotrophin receptors: a window into neuronal differentiation. Neuron, 9,
583-593.
Chen, J., Song, J. L., Zhang, S., Wang, Y., Cui, D. F. & Wang, C. C. 1999. Chaperone
activity of DsbC. Journal of Biological Chemistry, 274, 19601-19605.
Clary, D. O. & Reichardt, L. F. 1994. An alternatively spliced form of the nerve growth factor
receptor TrkA confers an enhanced response to neurotrophin 3. Proceedings of the
National Academy of Sciences, 91, 11133-11137.
Craik, D. J., Fairlie, D. P., Liras, S. & Price, D. 2013. The Future of Peptide-based Drugs.
Chemical Biology & Drug Design, 81, 136-147.
Daugherty, P. S. 2007. Protein engineering with bacterial display. Current Opinion in
Structural Biology, 17, 474-480.
Derbyshire, K. M., Salvo, J. J. & Grindley, N. D. 1986. A simple and efficient procedure for
saturation mutagenesis using mixed oligodeoxynucleotides. Gene, 46, 145-152.
Diao, L. & Meibohm, B. 2013. Pharmacokinetics and Pharmacokinetic-Pharmacodynamic
Correlations of Therapeutic Peptides. Clinical Pharmacokinetics, 52, 855-868.
Doi, N., Takashima, H., Wada, A., Oishi, Y., Nagano, T. & Yanagawa, H. 2007.
Photocleavable linkage between genotype and phenotype for rapid and efficient
recovery of nucleic acids encoding affinity-selected proteins. Journal of
Biotechnology, 131, 231-239.

218
Edwards, R., Selby, M., Mobley, W., Weinrich, S., Hruby, D. & Rutter, W. 1988. Processing
and secretion of nerve growth factor: expression in mammalian cells with a vaccinia
virus vector. Molecular and cellular biology, 8, 2456-2464.
Eldridge, B., Cooley, R. N., Odegrip, R., Mcgregor, D. P., Fitzgerald, K. J. & Ullman, C. G.
2009. An in vitro selection strategy for conferring protease resistance to ligand
binding peptides. Protein Engineering Design & Selection, 22, 691-698.
Fernandez-Gacio, A., Uguen, M. & Fastrez, J. 2003. Phage display as a tool for the directed
evolution of enzymes. Trends in Biotechnology, 21, 408-414.
Fosgerau, K. & Hoffmann, T. 2015. Peptide therapeutics: current status and future directions.
Drug Discovery Today, 20, 122-128.
Frade, J. M., Rodríguez-Tébar, A. & Barde, Y.-A. 1996. Induction of cell death by
endogenous nerve growth factor through its p75 receptor. Nature, 383, 166-168.
Frigotto, L., Smith, M. E., Brankin, C., Sedani, A., Cooper, S. E., Kanwar, N., Evans, D.,
Svobodova, S., Baar, C., Ullman, C. G., Glanville, J. & Hine, A. V. 2015. Codon-
Precise, Synthetic, Antibody Fragment Libraries Built Using Automated Hexamer
Codon Additions and Validated through Next Generation Sequencing. Antibodies
(2073-4468), 4, 88-102.
Fujimori, K., Fukuzono, S., Kotomura, N., Kuno, N. & Shimizu, N. 1992.
OVERPRODUCTION OF BIOLOGICALLY-ACTIVE HUMAN NERVE GROWTH-
FACTOR IN ESCHERICHIA-COLI. Bioscience Biotechnology and Biochemistry, 56,
1985-1990.
Gai, S. A. & Wittrup, K. D. 2007. Yeast surface display for protein engineering and
characterization. Current Opinion in Structural Biology, 17, 467-473.
Gaytan, P., Contreras-Zambrano, C., Ortiz-Alvarado, M., Morales-Pablos, A. & Yanez, J.
2009. TrimerDimer: an oligonucleotide-based saturation mutagenesis approach that
removes redundant and stop codons. Nucleic Acids Research, 37.
Gaytan, P., Yanez, J., Sanchez, F., Mackie, H. & Soberon, X. 1998. Combination of DMT-
mononucleotide and Fmoc-trinucleotide phosphoramidites in oligonucleotide

219
synthesis affords an automatable codon-level mutagenesis method. Chemistry &
Biology, 5, 519-527.
Ghilardi, J. R., Freeman, K. T., Jimenez‐Andrade, J. M., Coughlin, K. A., Kaczmarska, M. J.,
Castaneda‐Corral, G., Bloom, A. P., Kuskowski, M. A. & Mantyh, P. W. 2012.
Neuroplasticity of sensory and sympathetic nerve fibers in a mouse model of a painful
arthritic joint. Arthritis & Rheumatism, 64, 2223-2232.
Giordano, C., Marchio, M., Timofeeva, E. & Biagini, G. 2014. Neuroactive peptides as
putative mediators of antiepileptic ketogenic diets. Frontiers in neurology, 5, 63.
Hallböök, F., Ibáñez, C. F. & Persson, H. 1991. Evolutionary studies of the nerve growth
factor family reveal a novel member abundantly expressed in Xenopus ovary.
Neuron, 6, 845-858.
Hammond, P. W., Alpin, J., Rise, C. E., Wright, M. & Kreider, B. L. 2001. In vitro selection
and characterization of Bcl-X-L-binding proteins from a mix of tissue-specific mRNA
display libraries. Journal of Biological Chemistry, 276, 20898-20906.
Hanes, J., Jermutus, L., Schaffitzel, C. & Pluckthun, A. 1999. Comparison of Escherichia coli
and rabbit reticulocyte ribosome display systems. Febs Letters, 450, 105-110.
Hanes, J. & Pluckthun, A. 1997. In vitro selection and evolution of functional proteins by
using ribosome display. Proceedings of the National Academy of Sciences of the
United States of America, 94, 4937-4942.
He, L. B., Wang, Y., Wang, G., Chen, C. & Cao, S. G. 2007. Expression and purification of
active recombinant human nerve growth factor from Escherichia coli. Chemical
Research in Chinese Universities, 23, 237-240.
He, M. & Taussig, M. J. 2002. Ribosome display: Cell-free protein display technology.
Briefings in Functional Genomics & Proteomics, 1, 204-212.
He, M. Y. & Taussig, M. J. 1997. Antibody-ribosome-mRNA (ARM) complexes as efficient
selection particles for in vitro display and evolution of antibody combining sites.
Nucleic Acids Research, 25, 5132-5134.
Hoess, R. H. 2001. Protein design and phage display. Chemical Reviews, 101, 3205-3218.

220
Hu, J. C., O'shea, E. K., Kim, P. S. & Sauer, R. T. 1990. Sequence requirements for coiled-
coils: analysis with lambda repressor-GCN4 leucine zipper fusions. Science, 250,
1400-1403.
Hughes, M. D., Nagel, D. A., Santos, A. F., Sutherland, A. J. & Hine, A. V. 2003. Removing
the redundancy from randomised gene libraries. Journal of Molecular Biology, 331,
973-979.
Hughes, M. D., Zhang, Z. R., Sutherland, A. J., Santos, A. F. & Hine, A. V. 2005. Discovery
of active proteins directly from combinatorial randomized protein libraries without
display, purification or sequencing: identification of novel zinc finger proteins. Nucleic
Acids Research, 33.
Iacaruso, M. F., Galli, S., Martí, M., Villalta, J. I., Estrin, D. A., Jares-Erijman, E. A. &
Pietrasanta, L. I. 2011. Structural model for p75 NTR–TrkA intracellular domain
interaction: a combined FRET and bioinformatics study. Journal of Molecular Biology,
414, 681-698.
Ibáñez, C. F., Ebendal, T., Barbany, G., Murray-Rust, J., Blundell, T. L. & Persson, H. 1992.
Disruption of the low affinity receptor-binding site in NGF allows neuronal survival and
differentiation by binding to the trk gene product. Cell, 69, 329-341.
Ji, R.-R., Samad, T. A., Jin, S.-X., Schmoll, R. & Woolf, C. J. 2002. p38 MAPK activation by
NGF in primary sensory neurons after inflammation increases TRPV1 levels and
maintains heat hyperalgesia. Neuron, 36, 57-68.
Jimenez-Andrade, J. M., Ghilardi, J. R., Castaneda-Corral, G., Kuskowski, M. A. & Mantyh,
P. W. 2011. Preventive or late administration of anti-NGF therapy attenuates tumor-
induced nerve sprouting, neuroma formation, and cancer pain. Pain, 152, 2564-2574.
Kahle, P., Burton, L. E., Schmelzer, C. & Hertel, C. 1992. The amino terminus of nerve
growth factor is involved in the interaction with the receptor tyrosine kinase p140trkA.
Journal of Biological Chemistry, 267, 22707-22710.
Kaplan, D. R. & Miller, F. D. 1997. Signal transduction by the neutrophin receptors. Current
opinion in cell biology, 9, 213-221.

221
Kayushin, A., Korosteleva, M. & Miroshnikov, A. 2000. Large-scale solid-phase preparation
of 3 '-unprotected trinucleotide phosphotriesters - Precursors for synthesis of
trinucleotide phosphoramidites. Nucleosides Nucleotides & Nucleic Acids, 19, 1967-
1976.
Kayushin, A., Korosteleva, M., Miroshnikov, A., Kosch, W., Zubov, D., Piel, N., Weichel, W. &
Krenz, U. 1999. A new approach to the synthesis of trinucleotide phosphoramidites -
Synthons for the generation of oligonucleotide/peptide libraries. Nucleosides &
Nucleotides, 18, 1531-1533.
Kayushin, A. L., Korosteleva, M. D., Miroshnikov, A. I., Kosch, W., Zubov, D. & Piel, N. 1996.
A convenient approach to the synthesis of trinucleotide phosphoramidites - Synthons
for the generation of oligonucleotide/peptide libraries. Nucleic Acids Research, 24,
3748-3755.
Kille, S., Acevedo-Rocha, C. G., Parra, L. P., Zhang, Z. G., Opperman, D. J., Reetz, M. T. &
Acevedo, J. P. 2013. Reducing Codon Redundancy and Screening Effort of
Combinatorial Protein Libraries Created by Saturation Mutagenesis. Acs Synthetic
Biology, 2, 83-92.
Koewler, N. J., Freeman, K. T., Buus, R. J., Herrera, M. B., Jimenez‐Andrade, J. M., Ghilardi,
J. R., Peters, C. M., Sullivan, L. J., Kuskowski, M. A. & Lewis, J. L. 2007. Effects of a
monoclonal antibody raised against nerve growth factor on skeletal pain and bone
healing after fracture of the C57BL/6J mouse femur. Journal of Bone and Mineral
Research, 22, 1732-1742.
Kraulis, P. J. 1991. MOLSCRIPT: a program to produce both detailed and schematic plots of
protein structures. Journal of Applied Crystallography, 24, 946-950.
Krumpe, L. R., Schumacher, K. M., Mcmahon, J. B., Makowski, L. & Mori, T. 2007.
Trinucleotide cassettes increase diversity of T7 phage-displayed peptide library. Bmc
Biotechnology, 7.
Kurokawa, Y., Yanagi, H. & Yura, T. 2001. Overproduction of bacterial protein disulfide
isomerase (DsbC) and its modulator (DsbD) markedly enhances periplasmic

222
production of human nerve growth factor in Escherichia coli. Journal of Biological
Chemistry, 276, 14393-14399.
Lamballe, F., Klein, R. & Barbacid, M. 1991. trkC, a new member of the trk family of tyrosine
protein kinases, is a receptor for neurotrophin-3. Cell, 66, 967-979.
Levi-Montalcini, R. & Hamburger, V. 1951. Selective growth stimulating effects of mouse
sarcoma on the sensory and sympathetic nervous system of the chick embryo. The
Journal of experimental zoology, 116, 321-61.
Levin, A. M. & Weiss, G. A. 2006. Optimizing the affinity and specificity of proteins with
molecular display. Molecular Biosystems, 2, 49-57.
Levy, R., Weiss, R., Chen, G., Iverson, B. L. & Georgiou, G. 2001. Production of correctly
folded Fab antibody fragment in the cytoplasm of Escherichia coli trxB gor mutants
via the coexpression of molecular chaperones. Protein Expression and Purification,
23, 338-347.
Li, S. J. & Hochstrasser, M. 1999. A new protease required for cell-cycle progression in
yeast. Nature, 398, 246-251.
Li, S. W., Millward, S. & Roberts, R. 2002. In vitro selection of mRNA display libraries
containing an unnatural amino acid. Journal of the American Chemical Society, 124,
9972-9973.
Liu, S., Zhou, L., Chen, L., Dastidar, S. G., Verma, C., Li, J., Tan, D. & Beuerman, R. 2009.
Effect of structural parameters of peptides on dimer formation and highly oxidized
side products in the oxidation of thiols of linear analogues of human β‐defensin 3 by
DMSO. Journal of Peptide Science, 15, 95-106.
Lowe, E., Anand, P., Terenghi, G., Williams‐Chestnut, R., Sinicropi, D. & Osborne, J. 1997.
Increased nerve growth factor levels in the urinary bladder of women with idiopathic
sensory urgency and interstitial cystitis. British journal of urology, 79, 572-577.
Ma, S. Y., Saaem, I. & Tian, J. D. 2012. Error correction in gene synthesis technology.
Trends in Biotechnology, 30, 147-154.

223
Makela, A. R. & Oker-Blom, C. 2008. The baculovirus display technology - An evolving
instrument for molecular screening and drug delivery. Combinatorial Chemistry &
High Throughput Screening, 11, 86-98.
Makowski, L. & Soares, A. 2003. Estimating the diversity of peptide populations from limited
sequence data. Bioinformatics, 19, 483-489.
Mantyh, W. G., Jimenez-Andrade, J. M., Stake, J. I., Bloom, A. P., Kaczmarska, M. J.,
Taylor, R. N., Freeman, K. T., Ghilardi, J. R., Kuskowski, M. A. & Mantyh, P. W. 2010.
Blockade of nerve sprouting and neuroma formation markedly attenuates the
development of late stage cancer pain. Neuroscience, 171, 588-598.
Mattheakis, L. C., Bhatt, R. R. & Dower, W. J. 1994. An in vitro polysome display system for
identifying ligands from very large peptide libraries. Proceedings of the National
Academy of Sciences, 91, 9022-9026.
Mcdonald, N. Q., Lapatto, R., Rust, J. M., Gunning, J., Wlodawer, A. & Blundell, T. L. 1991.
New protein fold revealed by a 2.3-Å resolution crystal structure of nerve growth
factor.
Meldolesi, J., Sciorati, C. & Clementi, E. 2000. The p75 receptor: first insights into the
transduction mechanisms leading to either cell death or survival. J. Biol. Chem, 274,
2597-2600.
Miller, L. J., Fischer, K. A., Goralnick, S. J., Litt, M., Burleson, J. A., Albertsen, P. & Kreutzer,
D. L. 2002. Nerve growth factor and chronic prostatitis/chronic pelvic pain syndrome.
Urology, 59, 603-608.
Millward, S. W., Fiacco, S., Austin, R. J. & Roberts, R. W. 2007. Design of cyclic peptides
that bind protein surfaces with antibody-like affinity. Acs Chemical Biology, 2, 625-
634.
Mossessova, E. & Lima, C. D. 2000. Ulp1-SUMO crystal structure and genetic analysis
reveal conserved interactions and a regulatory element essential for cell growth in
yeast. Molecular Cell, 5, 865-876.
Mossner, E. & Pluckthun, A. 2001. Directed evolution with fast and efficient selection
technologies. Chimia, 55, 325-329.

224
Naismith, J. H. & Sprang, S. R. 1998. Modularity in the TNF-receptor family. Trends in
Biochemical Sciences, 23, 74-79.
Nakamura, Y., Gojobori, T. & Ikemura, T. 2000. Codon usage tabulated from international
DNA sequence databases: status for the year 2000. Nucleic Acids Research, 28,
292-292.
Negro, A., Martini, I., Bigon, E., Cazzola, F., Minozzi, C., Skaper, S. D. & Callegaro, L. 1992.
SYNTHESIS OF THE BIOLOGICALLY-ACTIVE BETA-SUBUNIT OF HUMAN
NERVE GROWTH-FACTOR IN ESCHERICHIA-COLI. Gene, 110, 251-256.
Nemoto, N., Miyamotosato, E., Husimi, Y. & Yanagawa, H. 1997. In vitro virus: Bonding of
mRNA bearing puromycin at the 3'-terminal end to the C-terminal end of its encoded
protein on the ribosome in vitro. Febs Letters, 414, 405-408.
Oddiah, D., Anand, P., Mcmahon, S. B. & Rattray, M. 1998. Rapid increase of NGF, BDNF
and NT‐3 mRNAs in inflamed bladder. Neuroreport, 9, 1455-1458.
Odegrip, R., Coomber, D., Eldridge, B., Hederer, R., Kuhlman, P. A., Ullman, C., Fitzgerald,
K. & Mcgregor, D. 2004. CIS display: In vitro selection of peptides from libraries of
protein-DNA complexes. Proceedings of the National Academy of Sciences of the
United States of America, 101, 2806-2810.
Odegrip, R. & Haggard-Ljungquist, E. 2001. The two active-site tyrosine residues of the A
protein play non-equivalent roles during initiation of rolling circle replication of
bacteriophage P2. Journal of Molecular Biology, 308, 147-163.
Ono, A., Matsuda, A., Zhao, J. & Santi, D. V. 1995. The synthesis of blocked triplet-
phosphoramidites and their use in mutagenesis. Nucleic Acids Research, 23, 4677-
4682.
Padhi, A., Sengupta, M., Sengupta, S., Roehm, K. H. & Sonawane, A. 2014. Antimicrobial
peptides and proteins in mycobacterial therapy: Current status and future prospects.
Tuberculosis, 94, 363-373.
Pattanaik, S., Werkman, J. R., Kong, Q. & Yuan, L. 2010. Site-directed mutagenesis and
saturation mutagenesis for the functional study of transcription factors involved in

225
plant secondary metabolite biosynthesis. Plant Secondary Metabolism Engineering.
Springer.
Patwardhan, R. P., Lee, C., Litvin, O., Young, D. L., Pe'er, D. & Shendure, J. 2009. High-
resolution analysis of DNA regulatory elements by synthetic saturation mutagenesis.
Nature Biotechnology, 27, 1173-1175.
Praszkier, J., Murthy, S. & Pittard, A. J. 2000. Effect of CIS on activity in trans of the
replication initiator protein of an IncB plasmid. Journal of Bacteriology, 182, 3972-
3980.
Praszkier, J. & Pittard, A. J. 1999. Role of CIS in replication of an IncB plasmid. Journal of
Bacteriology, 181, 2765-2772.
Rattenholl, A., Lilie, H., Grossmann, A., Stern, A., Schwarz, E. & Rudolph, R. 2001a. The
pro-sequence facilitates folding of human nerve growth factor from Escherichia coli
inclusion bodies. European Journal of Biochemistry, 268, 3296-3303.
Rattenholl, A., Ruoppolo, M., Flagiello, A., Monti, M., Vinci, F., Marino, G., Lilie, H., Schwarz,
E. & Rudolph, R. 2001b. Pro-sequence assisted folding and disulfide bond formation
of human nerve growth factor. Journal of Molecular Biology, 305, 523-533.
Reetz, M. T. 2013. Biocatalysis in organic chemistry and biotechnology: past, present, and
future. Journal of the American Chemical Society, 135, 12480-12496.
Reetz, M. T., Bocola, M., Carballeira, J. D., Zha, D. X. & Vogel, A. 2005. Expanding the
range of substrate acceptance of enzymes: Combinatorial active-site saturation test.
Angewandte Chemie-International Edition, 44, 4192-4196.
Reetz, M. T. & Carballeira, J. D. 2007. Iterative saturation mutagenesis (ISM) for rapid
directed evolution of functional enzymes. Nature Protocols, 2, 891-903.
Reetz, M. T., D Carballeira, J. & Vogel, A. 2006a. Iterative saturation mutagenesis on the
basis of B factors as a strategy for increasing protein thermostability. Angewandte
Chemie-International Edition, 45, 7745-7751.
Reetz, M. T., Kahakeaw, D. & Lohmer, R. 2008. Addressing the numbers problem in directed
evolution. Chembiochem, 9, 1797-1804.

226
Reetz, M. T., Wang, L. W. & Bocola, M. 2006b. Directed evolution of enantioselective
enzymes: Iterative cycles of CASTing for probing protein-sequence space.
Angewandte Chemie-International Edition, 45, 1236-1241.
Reiersen, H., Lobersli, I., Loset, G. A., Hvattum, E., Simonsen, B., Stacy, J. E., Mcgregor, D.,
Fitzgerald, K., Welschof, M., Brekke, O. H. & Marvik, O. J. 2005. Covalent antibody
display - an in vitro antibody-DNA library selection system. Nucleic Acids Research,
33.
Roberts, R. W. & Szostak, J. W. 1997. RNA-peptide fusions for the in vitro selection of
peptides and proteins. Proceedings of the National Academy of Sciences of the
United States of America, 94, 12297-12302.
Robinson, S. D., Safavi-Hemami, H., Mcintosh, L. D., Purcell, A. W., Norton, R. S. &
Papenfuss, A. T. 2014. Diversity of Conotoxin Gene Superfamilies in the Venomous
Snail, Conus victoriae. Plos One, 9.
Rockberg, J., Lofblom, J., Hjelm, B., Uhlen, M. & Stahl, S. 2008. Epitope mapping of
antibodies using bacterial surface display. Nature Methods, 5, 1039-1045.
Rydén, M., Hempstead, B. & Ibáñez, C. F. 1997. Differential modulation of neuron survival
during development by nerve growth factor binding to the p75 neurotrophin receptor.
Journal of Biological Chemistry, 272, 16322-16328.
Rydén, M. & Ibáñez, C. F. 1997. A second determinant of binding to the p75 neurotrophin
receptor revealed by alanine-scanning mutagenesis of a conserved loop in nerve
growth factor. Journal of Biological Chemistry, 272, 33085-33091.
Samuelson, P., Gunneriusson, E., Nygren, P. A. & Stahl, S. 2002. Display of proteins on
bacteria. Journal of Biotechnology, 96, 129-154.
Schneider, R. & Schweiger, M. 1991. A novel modular mosaic of cell adhesion motifs in the
extracellular domains of the neurogenic trk and trkB tyrosine kinase receptors.
Oncogene, 6, 1807-1811.
Schofield, M. J. & Hsieh, P. 2003. DNA mismatch repair: Molecular mechanisms and
biological function. In: ORNSTON, L. N. (ed.) Annual Review of Microbiology. Volume
57.
227
Sevcik, M. A., Ghilardi, J. R., Peters, C. M., Lindsay, T. H., Halvorson, K. G., Jonas, B. M.,
Kubota, K., Kuskowski, M. A., Boustany, L., Shelton, D. L. & Mantyh, P. W. 2005.
Anti-NGF therapy profoundly reduces bone cancer pain and the accompanying
increase in markers of peripheral and central sensitization. Pain, 115, 128-141.
Shih, A., Laramee, G. R., Schmelzer, C. H., Burton, L. E. & Winslow, J. W. 1994.
Mutagenesis identifies amino-terminal residues of nerve growth factor necessary for
Trk receptor binding and biological activity. Journal of Biological Chemistry, 269,
27679-27686.
Shimizu, Y., Inoue, A., Tomari, Y., Suzuki, T., Yokogawa, T., Nishikawa, K. & Ueda, T. 2001.
Cell-free translation reconstituted with purified components. Nature Biotechnology,
19, 751-755.
Shimizu, Y., Kanamori, T. & Ueda, T. 2005. Protein synthesis by pure translation systems.
Methods, 36, 299-304.
Sidhu, S. S. & Kossiakoff, A. A. 2007. Exploring and designing protein function with restricted
diversity. Current opinion in chemical biology, 11, 347-354.
Sidhu, S. S., Lowman, H. B., Cunningham, B. C. & Wells, J. A. 2000. Phage display for
selection of novel binding peptides. Applications of Chimeric Genes and Hybrid
Proteins, Pt C, 328, 333-363.
Siloto, R. M. & Weselake, R. J. 2012. Site saturation mutagenesis: methods and applications
in protein engineering. Biocatalysis and Agricultural Biotechnology, 1, 181-189.
Smith, G. P. 1985. Filamentous fusion phage- Novel expression vectors that display cloned
antigens on the virion surface. Science, 228, 1315-1317.
Smith, J. D., Mcmanus, K. F. & Fraser, H. B. 2013. A novel test for selection on cis-
regulatory elements reveals positive and negative selection acting on mammalian
transcriptional enhancers. Molecular biology and evolution, mst134.
Snider, W. D. 1994. Functions of the neurotrophins during nervous system development:
what the knockouts are teaching us. Cell, 77, 627-638.

228
Sondek, J. & Shortle, D. 1992. A general strategy for random insertion and substitution
mutagenesis: substoichiometric coupling of trinucleotide phosphoramidites.
Proceedings of the National Academy of Sciences, 89, 3581-3585.
Stein, A. T., Ufret-Vincenty, C. A., Hua, L., Santana, L. F. & Gordon, S. E. 2006.
Phosphoinositide 3-kinase binds to TRPV1 and mediates NGF-stimulated TRPV1
trafficking to the plasma membrane. The Journal of general physiology, 128, 509-522.
Takahashi, T. T., Austin, R. J. & Roberts, R. W. 2003. mRNA display: ligand discovery,
interaction analysis and beyond. Trends in Biochemical Sciences, 28, 159-165.
Tang, L. X., Gao, H., Zhu, X. C., Wang, X., Zhou, M. & Jiang, R. X. 2012. Construction of
"small-intelligent" focused mutagenesis libraries using well-designed combinatorial
degenerate primers. Biotechniques, 52, 149-+.
Tang, L. X., Wang, X., Ru, B. B., Sun, H. F., Huang, J. & Gao, H. 2014. MDC-Analyzer: A
novel degenerate primer design tool for the construction of intelligent mutagenesis
libraries with contiguous sites. Biotechniques, 56, 301-+.
Tawfik, D. S. & Griffiths, A. D. 1998. Man-made cell-like compartments for molecular
evolution. Nature Biotechnology, 16, 652-656.
Tian, J. D., Gong, H., Sheng, N. J., Zhou, X. C., Gulari, E., Gao, X. L. & Church, G. 2004.
Accurate multiplex gene synthesis from programmable DNA microchips. Nature, 432,
1050-1054.
Ugolini, G., Marinelli, S., Covaceuszach, S., Cattaneo, A. & Pavone, F. 2007. The function
neutralizing anti-TrkA antibody MNAC13 reduces inflammatory and neuropathic pain.
Proceedings of the National Academy of Sciences, 104, 2985-2990.
Ullman, C. G., Frigotto, L. & Cooley, R. N. 2011. In vitro methods for peptide display and
their applications. Briefings in Functional Genomics, 10, 125-134.
Ultsch, M. H., Wiesmann, C., Simmons, L. C., Henrich, J., Yang, M., Reilly, D., Bass, S. H. &
De Vos, A. M. 1999. Crystal structures of the neurotrophin-binding domain of TrkA,
TrkB and TrkC. Journal of Molecular Biology, 290, 149-159.

229
Urfer, R., Tsoulfas, P., Soppet, D., Escandon, E., Parada, L. & Presta, L. 1994. The binding
epitopes of neurotrophin-3 to its receptors trkC and gp75 and the design of a
multifunctional human neurotrophin. The EMBO journal, 13, 5896.
Valetti, F. & Gilardi, G. 2013. Improvement of biocatalysts for industrial and environmental
purposes by saturation mutagenesis. Biomolecules, 3, 778-811.
Van Den Brulle, J., Fischer, M., Langmann, T., Horn, G., Waldmann, T., Arnold, S.,
Fuhrmann, M., Schatz, O., O'connell, T., O'connell, D., Auckenthaler, A. & Schwer, H.
2008. A novel solid phase technology for high-throughput gene synthesis.
Biotechniques, 45, 340-343.
Virnekas, B., Ge, L. M., Pluckthun, A., Schneider, K. C., Wellnhofer, G. & Moroney, S. E.
1994. Trinucleotide phosphormaidites-Ideal reagents for the synthesis of mixed
oligonucleotides for random mutagenesis. Nucleic Acids Research, 22, 5600-5607.
Wang, H. H., Isaacs, F. J., Carr, P. A., Sun, Z. Z., Xu, G., Forest, C. R. & Church, G. M.
2009. Programming cells by multiplex genome engineering and accelerated
evolution. Nature, 460, 894-898.
Watson, J. J., Fahey, M. S., Van Den Worm, E., Engels, F., Nijkamp, F. P., Stroemer, P.,
Mcmahon, S., Allen, S. J. & Dawbarn, D. 2006. TrkAd5: A novel therapeutic agent for
treatment of inflammatory pain and asthma. Journal of Pharmacology and
Experimental Therapeutics, 316, 1122-1129.
Wiesmann, C. & De Vos, A. 2001. Nerve growth factor: structure and function. Cellular and
Molecular Life Sciences CMLS, 58, 748-759.
Wiesmann, C., Ultsch, M. H., Bass, S. H. & De Vos, A. M. 1999. Crystal structure of nerve
growth factor in complex with the ligand-binding domain of the TrkA receptor. Nature,
401, 184-188.
Wilson, D. S., Keefe, A. D. & Szostak, J. W. 2001. The use of mRNA display to select high-
affinity protein-binding peptides. Proceedings of the National Academy of Sciences of
the United States of America, 98, 3750-3755.
Winston, J., Toma, H., Shenoy, M. & Pasricha, P. J. 2001. Nerve growth factor regulates VR-
1 mRNA levels in cultures of adult dorsal root ganglion neurons. Pain, 89, 181-186.
230
Wu, C., Leroux, J.-C. & Gauthier, M. A. 2012. Twin disulfides for orthogonal disulfide pairing
and the directed folding of multicyclic peptides. Nature chemistry, 4, 1044-1049.
Yagodkin, A., Azhayev, A., Roivainen, J., Antopolsky, M., Kayushin, A., Korosteleva, M.,
Miroshnikov, A., Randolph, J. & Mackie, H. 2007. Improved synthesis of trinucleotide
phosphoramidites and generation of randomized oligonucleotide libraries.
Nucleosides Nucleotides & Nucleic Acids, 26, 473-497.
Yano, H. & Chao, M. V. 2000. Neurotrophin receptor structure and interactions.
Pharmaceutica acta Helvetiae, 74, 253-60.
Zahnd, C., Spinelli, S., Luginbuhl, B., Amstutz, P., Cambillau, C. & Pluckthun, A. 2004.
Directed in vitro evolution and crystallographic analysis of a peptide-binding single
chain antibody fragment (scFv) with low picomolar affinity. Journal of Biological
Chemistry, 279, 18870-18877.
Zhu, Y., Colak, T., Shenoy, M., Liu, L., Pai, R., Li, C., Mehta, K. & Pasricha, P. J. 2011.
Nerve growth factor modulates TRPV1 expression and function and mediates pain in
chronic pancreatitis. Gastroenterology, 141, 370-377.

231
Chapter 9
Appendices
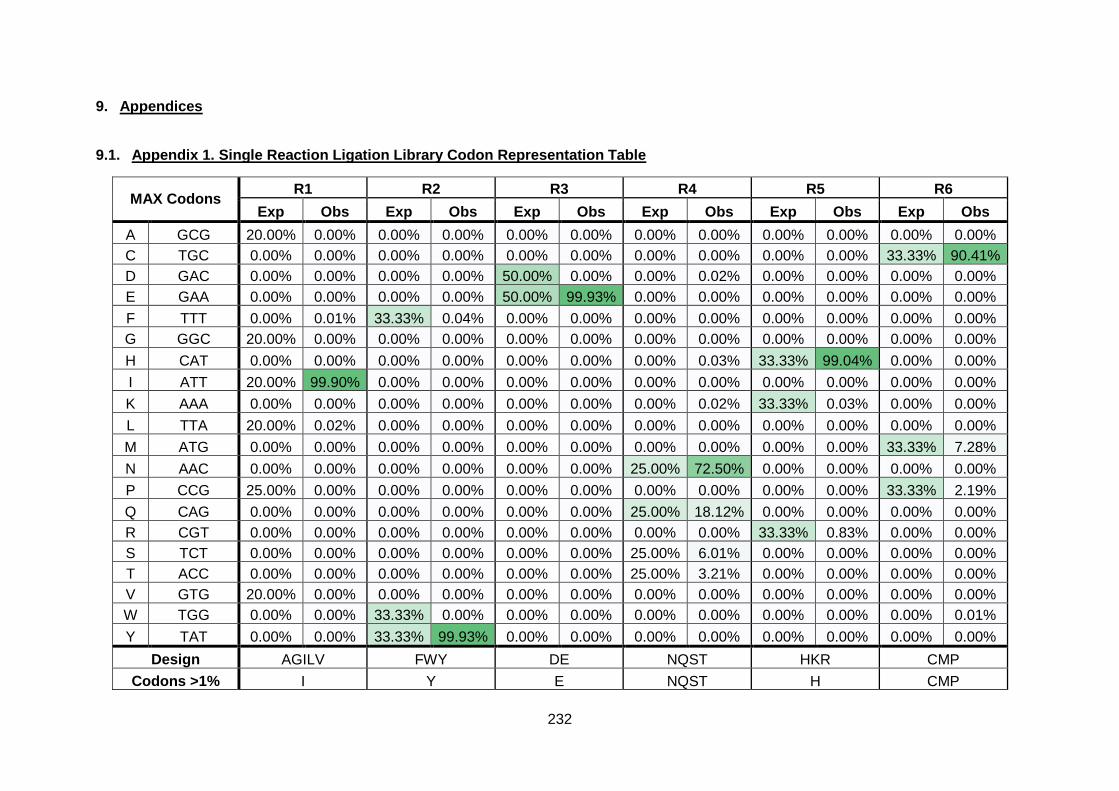
232
9. Appendices
9.1. Appendix 1. Single Reaction Ligation Library Codon Representation Table
MAX Codons R1 R2 R3 R4 R5 R6
Exp Obs Exp Obs Exp Obs Exp Obs Exp Obs Exp Obs
A GCG 20.00% 0.00% 0.00% 0.00% 0.00% 0.00% 0.00% 0.00% 0.00% 0.00% 0.00% 0.00%
C TGC 0.00% 0.00% 0.00% 0.00% 0.00% 0.00% 0.00% 0.00% 0.00% 0.00% 33.33% 90.41%
D GAC 0.00% 0.00% 0.00% 0.00% 50.00% 0.00% 0.00% 0.02% 0.00% 0.00% 0.00% 0.00%
E GAA 0.00% 0.00% 0.00% 0.00% 50.00% 99.93% 0.00% 0.00% 0.00% 0.00% 0.00% 0.00%
F TTT 0.00% 0.01% 33.33% 0.04% 0.00% 0.00% 0.00% 0.00% 0.00% 0.00% 0.00% 0.00%
G GGC 20.00% 0.00% 0.00% 0.00% 0.00% 0.00% 0.00% 0.00% 0.00% 0.00% 0.00% 0.00%
H CAT 0.00% 0.00% 0.00% 0.00% 0.00% 0.00% 0.00% 0.03% 33.33% 99.04% 0.00% 0.00%
I ATT 20.00% 99.90% 0.00% 0.00% 0.00% 0.00% 0.00% 0.00% 0.00% 0.00% 0.00% 0.00%
K AAA 0.00% 0.00% 0.00% 0.00% 0.00% 0.00% 0.00% 0.02% 33.33% 0.03% 0.00% 0.00%
L TTA 20.00% 0.02% 0.00% 0.00% 0.00% 0.00% 0.00% 0.00% 0.00% 0.00% 0.00% 0.00%
M ATG 0.00% 0.00% 0.00% 0.00% 0.00% 0.00% 0.00% 0.00% 0.00% 0.00% 33.33% 7.28%
N AAC 0.00% 0.00% 0.00% 0.00% 0.00% 0.00% 25.00% 72.50% 0.00% 0.00% 0.00% 0.00%
P CCG 25.00% 0.00% 0.00% 0.00% 0.00% 0.00% 0.00% 0.00% 0.00% 0.00% 33.33% 2.19%
Q CAG 0.00% 0.00% 0.00% 0.00% 0.00% 0.00% 25.00% 18.12% 0.00% 0.00% 0.00% 0.00%
R CGT 0.00% 0.00% 0.00% 0.00% 0.00% 0.00% 0.00% 0.00% 33.33% 0.83% 0.00% 0.00%
S TCT 0.00% 0.00% 0.00% 0.00% 0.00% 0.00% 25.00% 6.01% 0.00% 0.00% 0.00% 0.00%
T ACC 0.00% 0.00% 0.00% 0.00% 0.00% 0.00% 25.00% 3.21% 0.00% 0.00% 0.00% 0.00%
V GTG 20.00% 0.00% 0.00% 0.00% 0.00% 0.00% 0.00% 0.00% 0.00% 0.00% 0.00% 0.00%
W TGG 0.00% 0.00% 33.33% 0.00% 0.00% 0.00% 0.00% 0.00% 0.00% 0.00% 0.00% 0.01%
Y TAT 0.00% 0.00% 33.33% 99.93% 0.00% 0.00% 0.00% 0.00% 0.00% 0.00% 0.00% 0.00%
Design AGILV FWY DE NQST HKR CMP
Codons >1% I Y E NQST H CMP

233
9.2. Appendix 2. Anti-NGF PeptideLibrary Framework Sequences
LH Acceptor (Q) 5'-CGGCGGTTAGAACGCGGCTACAATTAATACATAACCCCATCCCC CTGTGACAATTAATCATCGGCTCGTATAATGTGTGGAATTGTGAG-3'
LH Acceptor RC 5'-PHO-TTCCTGTTTAAACGCCGCCATGGCCATGGTAGATCCTGTTT CCTGTGTGAAATTGTTATCCGCTCACAATTCCACACATT-3'
LH Acceptor PCR Primer (Q)
5'-PHO-TTCCTGTTTAAACGCCGC-3'
LH Acceptor PCR Primer(P)
5'-PHO-TTCCGGTTTAAACGCCGC-3'
LH Universal RC Primer
5'-CGG-CGGTTAGAACGCGGC-3'
RH acceptor 5'-PHO-TCTGCGGCGGCGGGCAGCGGTTCTAGTCTAGCGGCCCCA ACTGATCTTCACCAAACGGAGACCTGTACCGGC-3'
RH acceptor RC 5'-GCCGGTACAGGTCTCCGTTTGGTGAAGATCAGTTGGGGCCGCTA GACTAGAACCGCTGCCCGCCGCCGCAGA-3'
RH Universal RC Primer
5'-GCCGGTACAGGTCTCCGT-3'

234
9.3. Appendix 3. 72-mer Anti-NGF Peptide Library Codon Representation Tables
MAX Codons LH R1 LH R2 LH R3 LH R4 LH R5
Exp Obs Exp Obs Exp Obs Exp Obs Exp Obs
A GCT 25.0% 25.6% 0.0% 0.0% 0.0% 0.0% 5.6% 0.2% 0.0% 0.0%
C TGC 0.0% 0.0% 0.0% 0.0% 0.0% 0.0% 0.0% 0.0% 0.0% 0.0%
D GAT 0.0% 0.1% 0.0% 0.0% 0.0% 0.0% 5.6% 0.3% 14.3% 10.1%
E GAA 0.0% 0.0% 0.0% 0.0% 0.0% 0.0% 5.6% 0.0% 14.3% 3.7%
F TTC 0.0% 0.0% 16.7% 6.0% 0.0% 0.0% 5.6% 0.8% 0.0% 0.0%
G GGC 25.0% 13.9% 0.0% 0.0% 0.0% 0.0% 5.6% 0.4% 0.0% 0.0%
H CAT 0.0% 0.0% 16.7% 17.8% 0.0% 0.0% 5.6% 0.3% 14.3% 28.6%
I ATC 0.0% 0.0% 16.7% 43.4% 0.0% 0.0% 5.6% 6.4% 0.0% 0.0%
K AAG 0.0% 0.0% 0.0% 0.0% 0.0% 0.0% 5.6% 1.1% 14.3% 18.0%
L CTG 0.0% 0.0% 0.0% 0.0% 0.0% 0.1% 5.6% 6.3% 0.0% 0.0%
M ATG 0.0% 0.0% 0.0% 0.0% 0.0% 0.0% 0.0% 0.1% 0.0% 0.0%
N AAC 0.0% 0.0% 0.0% 0.0% 0.0% 0.0% 5.6% 10.9% 14.3% 10.8%
P CCG 0.0% 0.0% 0.0% 0.0% 100.0% 98.1% 5.6% 1.5% 0.0% 0.0%
Q CAG 0.0% 0.0% 0.0% 0.0% 0.0% 0.3% 5.6% 0.3% 14.3% 18.5%
R CGT 0.0% 0.0% 0.0% 0.0% 0.0% 0.0% 5.6% 0.0% 14.3% 9.8%
S TCT 25.0% 39.5% 0.0% 0.0% 0.0% 0.0% 5.6% 1.1% 0.0% 0.0%
T ACC 0.0% 0.0% 0.0% 0.0% 0.0% 0.0% 5.6% 0.8% 0.0% 0.0%
V GTG 25.0% 20.3% 16.7% 12.8% 0.0% 0.0% 5.6% 2.6% 0.0% 0.0%
W TGG 0.0% 0.0% 16.7% 12.3% 0.0% 0.0% 5.6% 1.0% 0.0% 0.0%
Y TAC 0.0% 0.0% 16.7% 6.9% 0.0% 0.0% 5.6% 65.4% 0.0% 0.0%
Design GAVS WFYIVH P 18 codons NEQDKRH
Codons >1% AGSV FHIVWY P ILNPSVY DEHKNQR
Other Codons 0.6% 0.7% 1.5% 0.5% 0.4%

235
MAX Codons RH R6 RH R5 RH R4 RH R3 RH R2 RH R1
Exp Obs Exp Obs Exp Obs Exp Obs Exp Obs Exp Obs
A GCT 25.0% 51.6% 0.0% 0.0% 0.0% 0.0% 0.0% 0.0% 0.0% 0.0% 0.0% 0.2%
C TGC 0.0% 0.0% 0.0% 0.0% 0.0% 0.0% 0.0% 0.0% 0.0% 0.0% 0.0% 0.0%
D GAT 0.0% 0.2% 0.0% 0.0% 14.3% 12.7% 50.0% 88.1% 0.0% 0.0% 0.0% 0.1%
E GAA 0.0% 0.0% 0.0% 0.0% 14.3% 2.3% 50.0% 11.6% 0.0% 0.0% 0.0% 0.1%
F TTC 0.0% 0.0% 25.0% 6.2% 0.0% 0.0% 0.0% 0.0% 20.0% 8.0% 0.0% 0.1%
G GGC 0.0% 0.0% 0.0% 0.0% 0.0% 0.0% 0.0% 0.0% 0.0% 0.0% 0.0% 0.0%
H CAT 0.0% 0.0% 0.0% 0.0% 14.3% 60.2% 0.0% 0.0% 0.0% 0.0% 0.0% 0.0%
I ATC 25.0% 13.7% 0.0% 0.0% 0.0% 0.0% 0.0% 0.0% 20.0% 8.5% 25.0% 9.8%
K AAG 0.0% 0.0% 0.0% 0.0% 14.3% 1.7% 0.0% 0.0% 0.0% 0.0% 0.0% 0.0%
L CTG 25.0% 18.9% 25.0% 78.1% 0.0% 0.0% 0.0% 0.0% 0.0% 0.0% 25.0% 4.3%
M ATG 0.0% 0.2% 0.0% 0.2% 0.0% 0.0% 0.0% 0.0% 0.0% 0.0% 0.0% 0.0%
N AAC 0.0% 0.0% 0.0% 0.0% 14.3% 5.2% 0.0% 0.0% 0.0% 0.0% 0.0% 0.0%
P CCG 0.0% 0.0% 0.0% 0.0% 0.0% 0.0% 0.0% 0.0% 0.0% 0.0% 25.0% 17.1%
Q CAG 0.0% 0.0% 0.0% 0.0% 14.3% 6.9% 0.0% 0.0% 0.0% 0.0% 0.0% 0.1%
R CGT 0.0% 0.0% 0.0% 0.0% 14.3% 10.7% 0.0% 0.0% 20.0% 24.5% 0.0% 0.0%
S TCT 0.0% 0.3% 0.0% 0.0% 0.0% 0.0% 0.0% 0.0% 0.0% 0.0% 0.0% 0.0%
T ACC 0.0% 0.0% 0.0% 0.0% 0.0% 0.0% 0.0% 0.0% 0.0% 0.0% 0.0% 0.0%
V GTG 25.0% 14.6% 0.0% 0.1% 0.0% 0.0% 0.0% 0.0% 0.0% 0.0% 25.0% 67.4%
W TGG 0.0% 0.0% 25.0% 6.0% 0.0% 0.0% 0.0% 0.0% 20.0% 36.0% 0.0% 0.1%
Y TAC 0.0% 0.0% 25.0% 9.0% 0.0% 0.0% 0.0% 0.0% 20.0% 22.4% 0.0% 0.0%
Design VILA YWFL NEQDKRH DE WIRFY PIVL
Codons >1% AILV FLWY DEHKNQR DE FIRWY ILPV
Other Codons 0.5% 0.5% 0.4% 0.3% 0.5% 0.6%

236
9.4. Appendix 4. 63-mer Anti-NGF Peptide Library Codon Representation Tables
MAX Codons LH1 LH2 LH3 LH4 LH5
Exp Obs Exp Obs Exp Obs Exp Obs Exp Obs
A GCT 25.0% 11.6% 0.0% 0.0%
C TGC 0.0% 0.2% 0.0% 0.0%
D GAT 0.0% 0.0% 14.3% 11.2%
E GAA 0.0% 0.0% 14.3% 5.1%
F TTC 0.0% 0.0% 0.0% 0.2%
G GGC 25.0% 45.9% 0.0% 0.0%
H CAT 0.0% 0.0% 14.3% 24.5%
I ATC 0.0% 0.0% 0.0% 1.3%
K AAG 0.0% 0.0% 14.3% 17.7%
L CTG 0.0% 0.0% 0.0% 0.0%
M ATG 0.0% 0.0% 0.0% 0.0%
N AAC 0.0% 0.0% 14.3% 11.6%
P CCG 0.0% 0.0% 0.0% 0.3%
Q CAG 0.0% 0.0% 14.3% 12.5%
R CGT 0.0% 0.0% 14.3% 14.0%
S TCT 25.0% 11.9% 0.0% 0.0%
T ACC 0.0% 0.0% 0.0% 0.0%
V GTG 25.0% 29.3% 0.0% 0.5%
W TGG 0.0% 0.0% 0.0% 0.3%
Y TAC 0.0% 0.0% 0.0% 0.2%
Design GAVS WFYIVH P 18 codons NEQDKRH
Codons >1% AGSV DEHIKNQR
Other Codons 1.0% 0.5%

237
MAX Codons RH6 RH5 RH4 RH3 RH2 RH1
Exp Obs Exp Obs Exp Obs Exp Obs Exp Obs Exp Obs
A GCT 25.0% 46.9% 0.0% 0.0% 0.0% 0.0% 0.0% 0.1% 0.0% 0.0% 0.0% 0.2%
C TGC 0.0% 0.0% 0.0% 0.0% 0.0% 0.0% 0.0% 0.0% 0.0% 0.0% 0.0% 0.0%
D GAT 0.0% 0.1% 0.0% 0.0% 14.3% 12.6% 50.0% 87.6% 0.0% 0.0% 0.0% 0.1%
E GAA 0.0% 0.0% 0.0% 0.0% 14.3% 2.6% 50.0% 11.6% 0.0% 0.0% 0.0% 0.1%
F TTC 0.0% 0.0% 25.0% 6.2% 0.0% 0.0% 0.0% 0.0% 20.0% 8.1% 0.0% 0.1%
G GGC 0.0% 0.0% 0.0% 0.0% 0.0% 0.0% 0.0% 0.0% 0.0% 0.0% 0.0% 0.0%
H CAT 0.0% 0.0% 0.0% 0.0% 14.3% 58.8% 0.0% 0.1% 0.0% 0.0% 0.0% 0.0%
I ATC 25.0% 13.2% 0.0% 0.1% 0.0% 0.0% 0.0% 0.1% 20.0% 8.9% 25.0% 10.4%
K AAG 0.0% 0.0% 0.0% 0.0% 14.3% 1.9% 0.0% 0.0% 0.0% 0.0% 0.0% 0.0%
L CTG 25.0% 21.9% 25.0% 75.2% 0.0% 0.1% 0.0% 0.1% 0.0% 0.1% 25.0% 4.1%
M ATG 0.0% 0.1% 0.0% 0.2% 0.0% 0.0% 0.0% 0.0% 0.0% 0.0% 0.0% 0.0%
N AAC 0.0% 0.0% 0.0% 0.1% 14.3% 5.9% 0.0% 0.0% 0.0% 0.0% 0.0% 0.0%
P CCG 0.0% 2.0% 0.0% 0.0% 0.0% 0.0% 0.0% 0.0% 0.0% 0.0% 25.0% 16.5%
Q CAG 0.0% 0.0% 0.0% 0.0% 14.3% 7.1% 0.0% 0.0% 0.0% 0.0% 0.0% 0.1%
R CGT 0.0% 0.0% 0.0% 0.0% 14.3% 10.5% 0.0% 0.0% 20.0% 25.0% 0.0% 0.0%
S TCT 0.0% 0.3% 0.0% 0.0% 0.0% 0.0% 0.0% 0.0% 0.0% 0.0% 0.0% 0.0%
T ACC 0.0% 0.0% 0.0% 0.0% 0.0% 0.0% 0.0% 0.0% 0.0% 0.0% 0.0% 0.0%
V GTG 25.0% 14.9% 0.0% 0.1% 0.0% 0.0% 0.0% 0.1% 0.0% 0.0% 25.0% 67.5%
W TGG 0.0% 0.0% 25.0% 6.0% 0.0% 0.0% 0.0% 0.0% 20.0% 35.7% 0.0% 0.1%
Y TAC 0.0% 0.0% 25.0% 11.4% 0.0% 0.0% 0.0% 0.0% 20.0% 21.4% 0.0% 0.0%
Design VILA YWFL NEQDKRH DE WIRFY PIVL
Codons >1% AILPV FLWY DEHKNQR DE FIRWY ILPV
Other Codons 0.6% 0.5% 0.4% 0.4% 0.7% 0.7%

238
9.5. Appendix 5. Re-Synthesised Final Anti-NGF Peptide Library Codon Representation Tables
MAX Codons LH1 LH2 LH3 LH4 LH5
Exp Obsv Exp Obsv Exp Obsv Exp Obsv Exp Obsv
A GCT 25.0% 25.1% 0.0% 0.0% 0.0% 0.0% 5.6% 4.1% 0.0% 0.0%
C TGC 0.0% 0.0% 0.0% 0.0% 0.0% 0.0% 0.0% 0.0% 0.0% 0.0%
D GAT 0.0% 0.0% 0.0% 0.0% 0.0% 0.0% 5.6% 0.0% 14.3% 15.2%
E GAA 0.0% 0.0% 0.0% 0.0% 0.0% 0.0% 5.6% 0.7% 14.3% 3.3%
F TTC 0.0% 0.0% 16.7% 16.0% 0.0% 0.0% 5.6% 7.5% 0.0% 0.0%
G GGC 25.0% 15.0% 0.0% 0.0% 0.0% 0.0% 5.6% 2.7% 0.0% 0.0%
H CAT 0.0% 0.0% 16.7% 12.3% 0.0% 0.0% 5.6% 3.5% 14.3% 21.6%
I ATC 0.0% 0.0% 16.7% 33.3% 0.0% 0.0% 5.6% 0.5% 0.0% 0.0%
K AAG 0.0% 0.0% 0.0% 0.0% 0.0% 0.0% 5.6% 4.3% 14.3% 19.2%
L CTG 0.0% 0.0% 0.0% 0.0% 0.0% 0.0% 5.6% 8.0% 0.0% 0.0%
M ATG 0.0% 0.0% 0.0% 0.0% 0.0% 0.0% 0.0% 0.1% 0.0% 0.0%
N AAC 0.0% 0.0% 0.0% 0.0% 0.0% 0.0% 5.6% 9.4% 14.3% 7.9%
P CCG 0.0% 0.0% 0.0% 0.0% 100.0% 99.3% 5.6% 5.3% 0.0% 0.0%
Q CAG 0.0% 0.0% 0.0% 0.0% 0.0% 0.1% 5.6% 6.6% 14.3% 13.3%
R CGT 0.0% 0.0% 0.0% 0.0% 0.0% 0.0% 5.6% 1.5% 14.3% 19.0%
S TCT 25.0% 25.9% 0.0% 0.0% 0.0% 0.0% 5.6% 8.8% 0.0% 0.0%
T ACC 0.0% 0.0% 0.0% 0.0% 0.0% 0.0% 5.6% 10.9% 0.0% 0.0%
V GTG 25.0% 33.4% 16.7% 17.8% 0.0% 0.0% 5.6% 10.7% 0.0% 0.0%
W TGG 0.0% 0.0% 16.7% 2.3% 0.0% 0.0% 5.6% 3.7% 0.0% 0.0%
Y TAC 0.0% 0.0% 16.7% 17.7% 0.0% 0.0% 5.6% 11.2% 0.0% 0.0%
Design GAVS WFYIVH P 18 codons exc C&M NEQDKRH
Codons >1% AGSV FHIVWY P AFGHKLNPQRSTVWY DEHKNQR
Other Codons 0.5% 0.4% 0.5% 0.8% 0.5%

239
MAX Codons RH6 RH5 RH4 RH3 RH2 RH1
Exp Obsv Exp Obsv Exp Obsv Exp Obsv Exp Obsv Exp Obsv
A GCT 25.0% 39.4% 0.0% 0.0% 0.0% 0.0% 0.0% 0.0% 0.0% 0.0% 0.0% 0.2%
C TGC 0.0% 0.0% 0.0% 0.0% 0.0% 0.0% 0.0% 0.0% 0.0% 0.0% 0.0% 0.0%
D GAT 0.0% 0.1% 0.0% 0.0% 14.3% 13.2% 50.0% 88.0% 0.0% 0.0% 0.0% 0.1%
E GAA 0.0% 0.0% 0.0% 0.0% 14.3% 2.6% 50.0% 11.7% 0.0% 0.0% 0.0% 0.1%
F TTC 0.0% 0.0% 25.0% 8.2% 0.0% 0.0% 0.0% 0.0% 20.0% 8.8% 0.0% 0.1%
G GGC 0.0% 0.0% 0.0% 0.0% 0.0% 0.0% 0.0% 0.0% 0.0% 0.0% 0.0% 0.0%
H CAT 0.0% 0.0% 0.0% 0.0% 14.3% 57.2% 0.0% 0.0% 0.0% 0.0% 0.0% 0.0%
I ATC 25.0% 17.8% 0.0% 0.0% 0.0% 0.0% 0.0% 0.0% 20.0% 9.0% 25.0% 10.4%
K AAG 0.0% 0.0% 0.0% 0.0% 14.3% 2.1% 0.0% 0.0% 0.0% 0.0% 0.0% 0.0%
L CTG 25.0% 26.0% 25.0% 73.2% 0.0% 0.0% 0.0% 0.0% 0.0% 0.0% 25.0% 4.1%
M ATG 0.0% 0.1% 0.0% 0.1% 0.0% 0.0% 0.0% 0.0% 0.0% 0.0% 0.0% 0.0%
N AAC 0.0% 0.0% 0.0% 0.0% 14.3% 5.8% 0.0% 0.0% 0.0% 0.0% 0.0% 0.0%
P CCG 0.0% 0.0% 0.0% 0.0% 0.0% 0.0% 0.0% 0.0% 0.0% 0.0% 25.0% 16.7%
Q CAG 0.0% 0.0% 0.0% 0.0% 14.3% 7.3% 0.0% 0.0% 0.0% 0.0% 0.0% 0.1%
R CGT 0.0% 0.0% 0.0% 0.0% 14.3% 11.4% 0.0% 0.0% 20.0% 24.2% 0.0% 0.0%
S TCT 0.0% 0.1% 0.0% 0.0% 0.0% 0.0% 0.0% 0.0% 0.0% 0.0% 0.0% 0.0%
T ACC 0.0% 0.0% 0.0% 0.0% 0.0% 0.0% 0.0% 0.0% 0.0% 0.0% 0.0% 0.0%
V GTG 25.0% 16.2% 0.0% 0.0% 0.0% 0.0% 0.0% 0.0% 0.0% 0.0% 25.0% 67.5%
W TGG 0.0% 0.0% 25.0% 7.0% 0.0% 0.0% 0.0% 0.0% 20.0% 35.4% 0.0% 0.2%
Y TAC 0.0% 0.0% 25.0% 11.0% 0.0% 0.0% 0.0% 0.0% 20.0% 22.1% 0.0% 0.0%
Design VILA YWFL NEQDKRH DE WIRFY PIVL
Codons >1% AILV FLWY DEHKNQR DE FIRWY ILPV
Other Codons 0.5% 0.4% 0.3% 0.2% 0.5% 0.6%

240
9.6. Appendix 6. pET SUMO/CAT Positive Expression Control Plasmid Map (taken
from Champion™ pET SUMO Protein Expression System manual, Invitrogen)
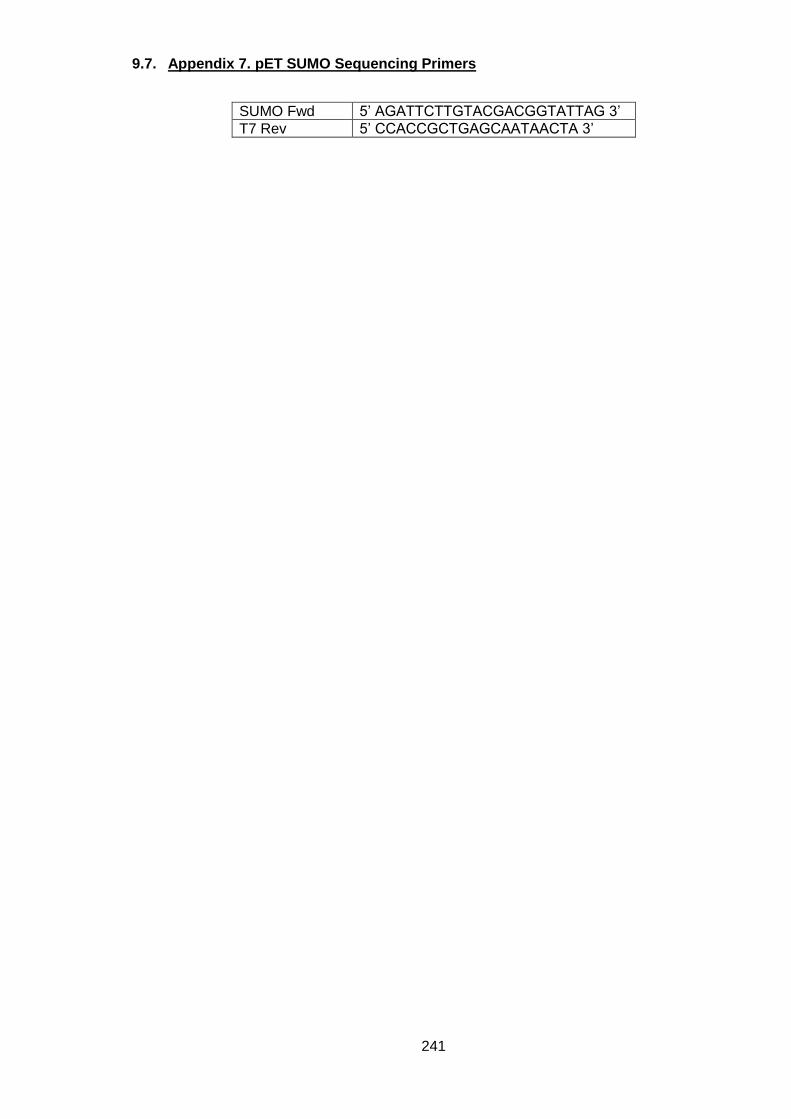
241
9.7. Appendix 7. pET SUMO Sequencing Primers
SUMO Fwd 5’ AGATTCTTGTACGACGGTATTAG 3’
T7 Rev 5’ CCACCGCTGAGCAATAACTA 3’