![THE STRUGGLE TO GOVERN THE COMMONS - …...W03-17 7/3/03 THE STRUGGLE TO GOVERN THE COMMONS by Thomas Dietz, Elinor Ostrom, and Paul C. Stern [order TBD] In 1968, Garrett Hardin (1968)](https://static.fdocuments.us/doc/165x107/5e9d46a00cca0645621668b9/the-struggle-to-govern-the-commons-w03-17-7303-the-struggle-to-govern-the.jpg)
Some Observations on Garrett of the Commons” · Some Observations on Garrett Hardin’s...
66
Some Observations on Garrett Hardin’s “Tragedy of the Commons” Stephen Malpezzi [email protected] http://smalpezzi.marginalq.com/ http://wisconsinviewpoint.blogspot.com/
Transcript of Some Observations on Garrett of the Commons” · Some Observations on Garrett Hardin’s...

Some Observations on Garrett Hardin’s “Tragedy of the Commons”
Stephen [email protected]
http://smalpezzi.marginalq.com/http://wisconsinviewpoint.blogspot.com/

Some examples of “commons”


A few examples of common property/free rider problems in urban development
• Infrastructure• Police and fire protection• Tenants‐in‐common• Condominiums• Mortgage backed securities• Land use and development regulation
– Through government– Through private covenants
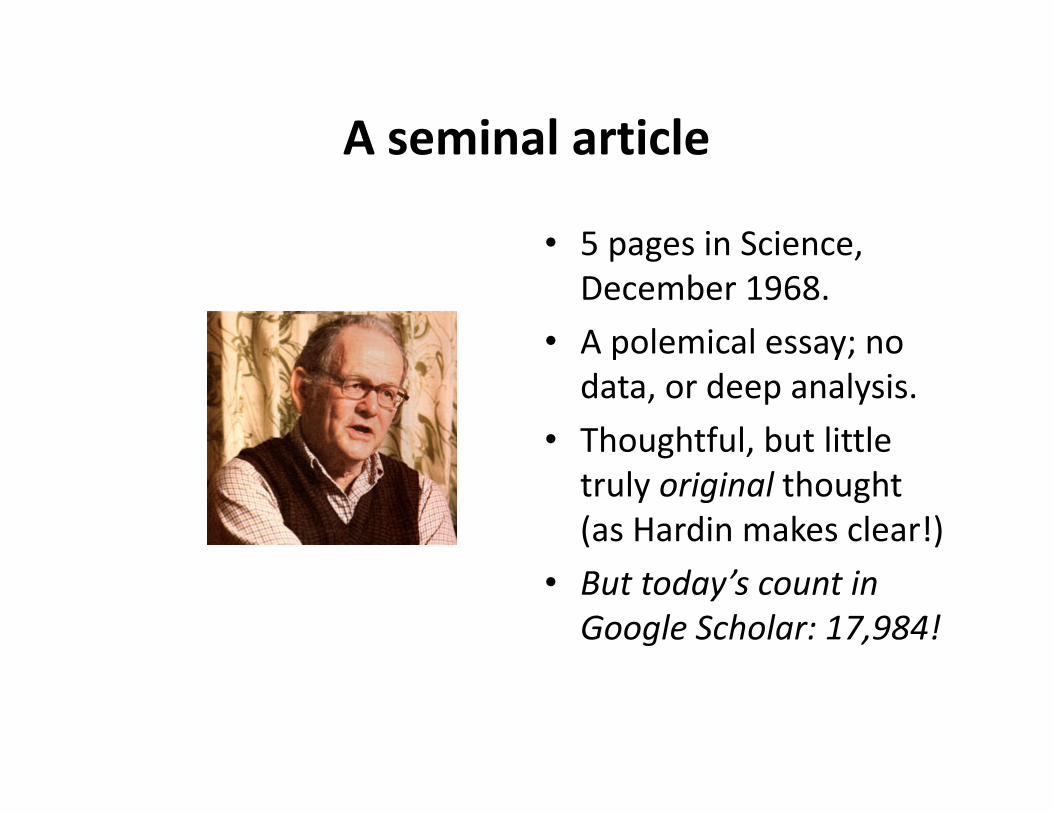
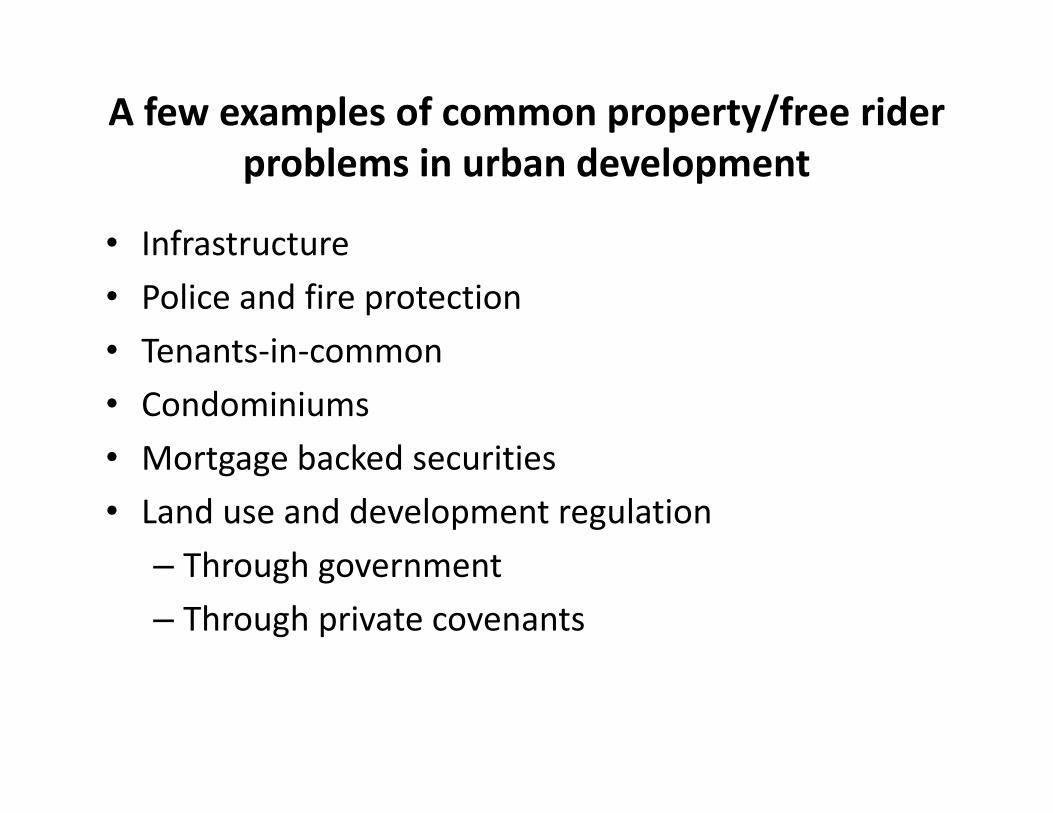
A seminal article
• 5 pages in Science, December 1968.
• A polemical essay; no data, or deep analysis.
• Thoughtful, but little truly original thought (as Hardin makes clear!)
• But today’s count in Google Scholar: 17,984!

Hardin’s #1 “commons” problem
• Population. Hardin adopts a neo‐Malthusian outlook.
• “A finite world can support only a finite population; therefore population growth must eventually equal zero.”
• “’Space’ is no escape.”• “There is no prosperous population in the world today that has, and has had for some time, a growth rate of zero.”
• “Freedom to breed is intolerable.”
Land use problems stem from Problem #1
• When we don’t have many people, we don’t have as many conflicts over land use.
• See Ester Boserup, Almen Alchian, others on how and why increasing population changes optimal property rights.
• Corollary: there is no single answer to private property “versus” the commons.
Some important insights from Hardin
• Population growth generates externalities and other market failures (in econo‐speak).– Land use, water, many resource issues are important cases.
• Markets often have difficulties solving these problems. (Hence the term “market failure.”)
• Societies involve tradeoffs. “When men mutually agreed to pass laws against robbing, mankind became more free, not less so.”

Hardin’s potential solutions
• Improved values or morality, conscience• “Privatization”• Allocation through queues, first come‐first serve, or (shudder!) prices
• Coercion• “An alternative to the commons need not be perfect just to be preferable.”
• Today, we’re focusing on the second: private property, the commons, or something else?
Solutions to the commons?• Laissez faire and coercion are corner solutions. Other
instruments available!– Government interventions
• Delineation and enforcement of property rights• Taxes• Subsidies• Regulation• Direct public provision
– Social “mores and folkways”– “Marketing,” psychology– “Third way” common property institutions (Elinor Ostromand others)

Urban Examples of Ostrom's Characteristics of Long‐Enduring CPR Institutions
Condo‐miniums
Mortgage‐Backed
Securities
Local Land Use
Regulations
Private Land Use
CovenantsClearly defined boundaries Yes Yes ? ?Congruent rules and local conditions Often Sometimes ? ?Collective choice can change operational rules Yes Difficult ? ?Accountable monitoring Yes No ? ?Graduated sanctions Yes No ? ?Effective conflict resolution mechanisms Often
Apparently not ? ?
Rights to organize (legitimacy) Yes Yes ? ?Complexity => nested enterprises NA? No ? ?
Homogeneity of users and uses High Unclear Often low Often low
Characteristics Adapted from Table 3.1 of E. Ostrom, Governing the Commons

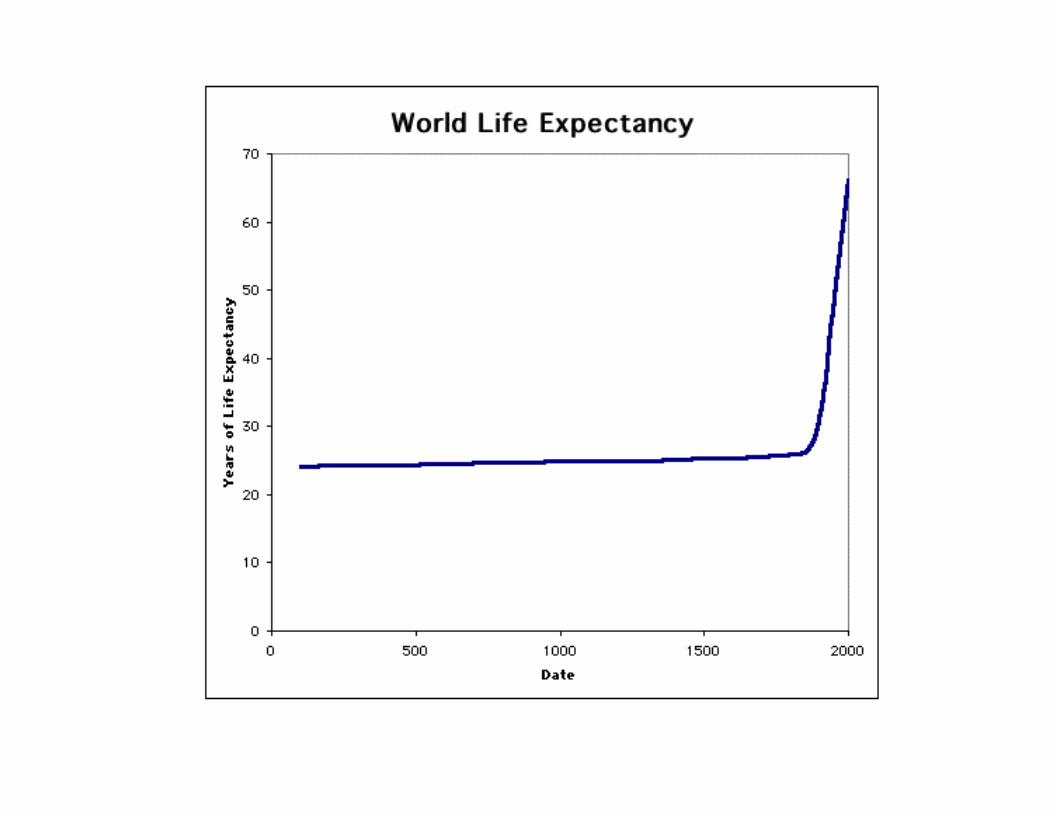
What do we know that Hardin didn’t?
• Hardin did not foresee that rational individuals (families) would reduce their population growth willingly as standards of living rose and risks like infant and child mortality fell, social security systems beyond productive children were put in place.
• Hardin apparently did not internalize some key ideas of economics involving technical change and substitution.

‐0.5%
0.0%
0.5%
1.0%
1.5%
2.0%
2.5%
3.0%
1955 1965 1975 1985 1995 2005 2015 2025 2035 2045 2055 2065 2075 2085 2095
Population Growth Rates, Four Major RegionsActual, and UN Medium Variant Forecasts
Africa Asia Europe LAC

‐
1,000,000
2,000,000
3,000,000
4,000,000
5,000,000
6,000,000
1950 1960 1970 1980 1990 2000 2010 2020 2030 2040 2050 2060 2070 2080 2090 2100
Population (1000s) by Major RegionActual, and UN Medium Variant Forecasts
Africa Asia Europe LAC

Thinking spatially
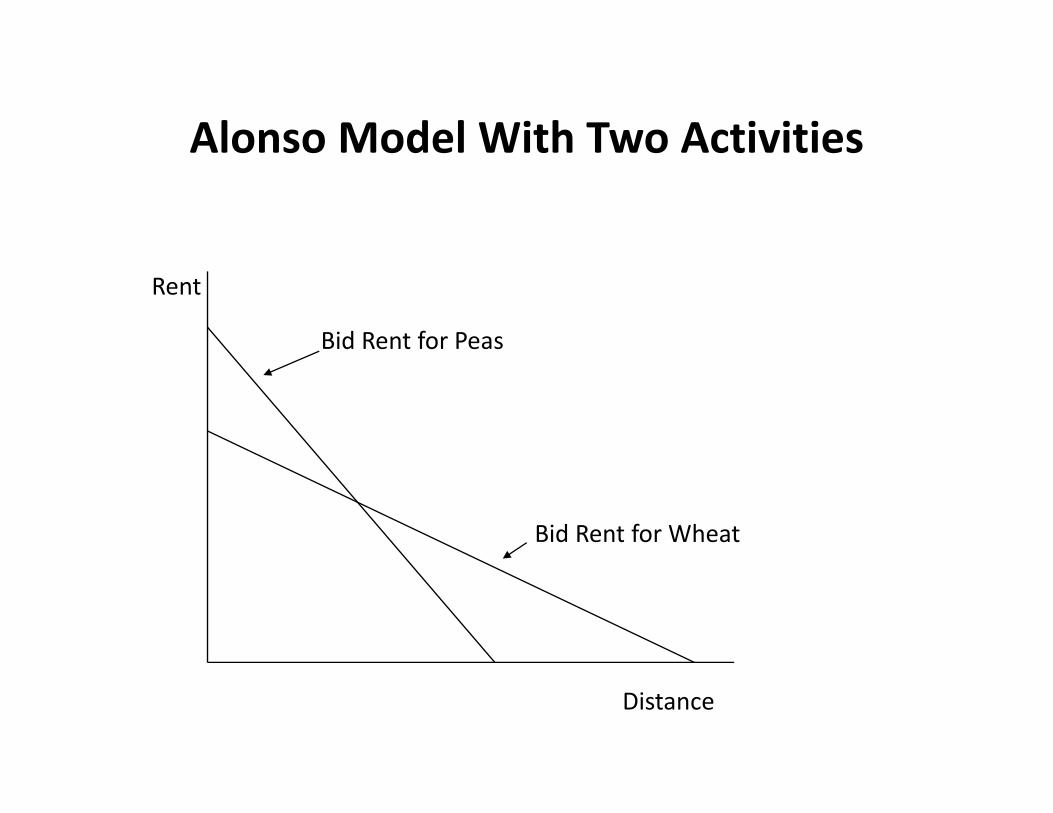
Alonso Model With Two Activities
Rent
Distance
Bid Rent for Peas
Bid Rent for Wheat

Bid Rent Model With Many Activities
Rent
Distance
Envelope of Many Individual Bid Rent Functions

0
50
100
150
200
250
300
0 2 4 6 8 10 12 14 16
Person
s per Hectare
Kilometers from CBD
Marseille
0
20
40
60
80
100
120
140
160
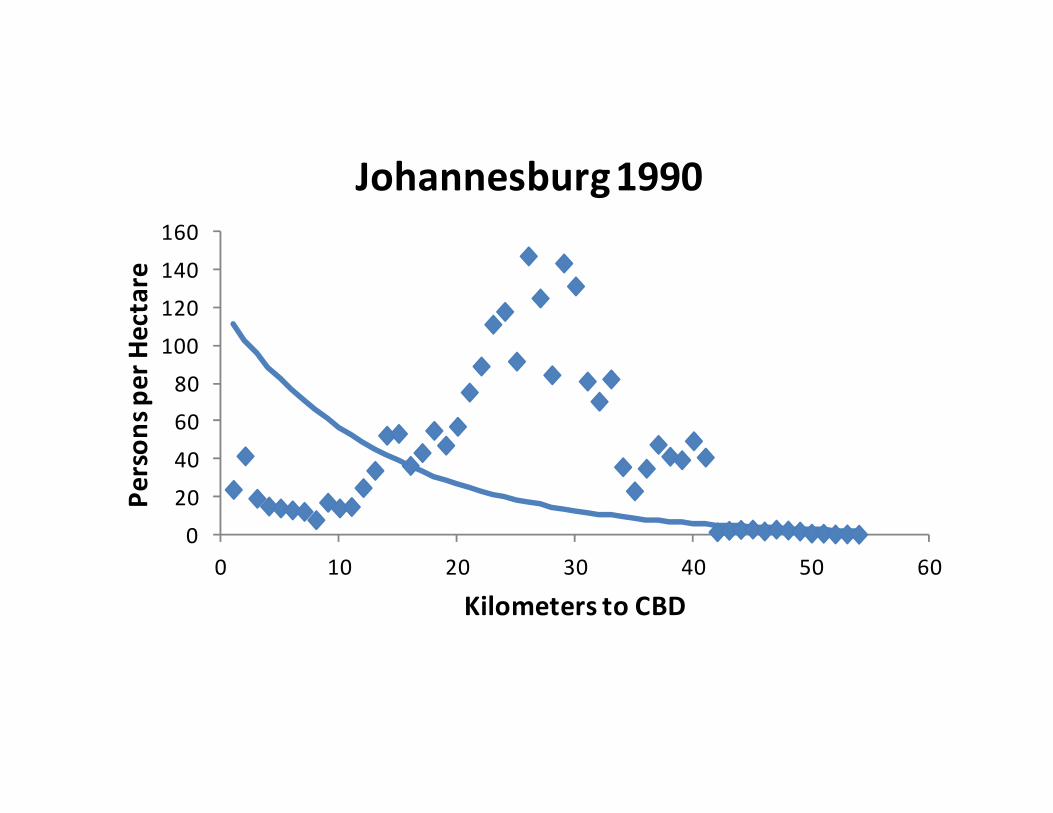
0 10 20 30 40 50 60
Person
s per Hectare
Kilometers to CBD
Johannesburg 1990
Some initial take‐aways
• Density patterns within a city aren’t just an urban economist’s curiosity, but rather a diagnostic for transportation, commuting, welfare, local public finance.
• Some cities have especially problematic distributions:– Capetown and Johannesburg– Moscow and St Petersburg– Brasilia and Curitiba

Are economists all named Dr. Pangloss?
No. Just because Hardin got some things wrong doesn’t mean we don’t have real problems.
• Water and sanitation• Nutrition• Education (especially girls!)• Traffic, congestion• Energy• Air pollution, including carbon

We have serious work to do• Global warming: what’s your loss function?• Renew the Green Revolution. (Don’t forget cassava this time!)• What’s the best way to accelerate vaccination, fight malaria,
improve childhood nutrition?• Stop doing stupid stuff.
– Ethanol from corn. Seriously?• Take the focus away from “Peter Pan” solutions like high
speed rail, and towards things that work like carbon taxes.• Peacekeeping and conflict resolution.• Prices, prices, prices. Fix them!

James A. Grasskamp
“Man really is the only animal that builds his terrarium around him as he goes, and real estate is really the business of building that terrarium. So we have a tremendous ethical content, tremendous social purpose”

31
1
10
100
1,000
10,000
-10000 -8000 -6000 -4000 -2000 0 2000
Mill
ions
(Log
Sca
le)
World Population Estimates(10,000 BCE to 2050; Census, various Historical Sources)
Min Estimate Average Estimate Max Estimate

32
World Population Growth Rate
-0.5%
0.0%
0.5%
1.0%
1.5%
2.0%
2.5%
-10000 -8000 -6000 -4000 -2000 0 2000
Ave
rag
e G
row
th R
ate
(Sm
ooth
ed)

© 1999, Stephen MalpezziAll Rights Reserved


Source: Rowlands et al. 2011
Results for a recent study of multiple global warming scenarios

Simplified loss function from human‐induced climate change, and mitigation policies
Policy Action State of the WorldNo human‐induced global warming
Humans increaseglobal warming
Mitigate Incur unnecessary costs
Status quo ex ante
Don’t Mitigate Status quo ex ante Catastrophe

What do carbon prices mean in practice?
37
Carbon tax, 2010 Increase, price of energy, US
[$/tC] GasolineAll energy
expenditures
Kyoto: global average $2 0.2% 0.3%"Optimal" 35 3.3% 5.4%Climate constrained 50 4.8% 7.7%Gore/Stern 200 19.0% 30.7%
Source: William NordhausNote: total energy expenses are circa 8% of US GDP recently.(See next slide).


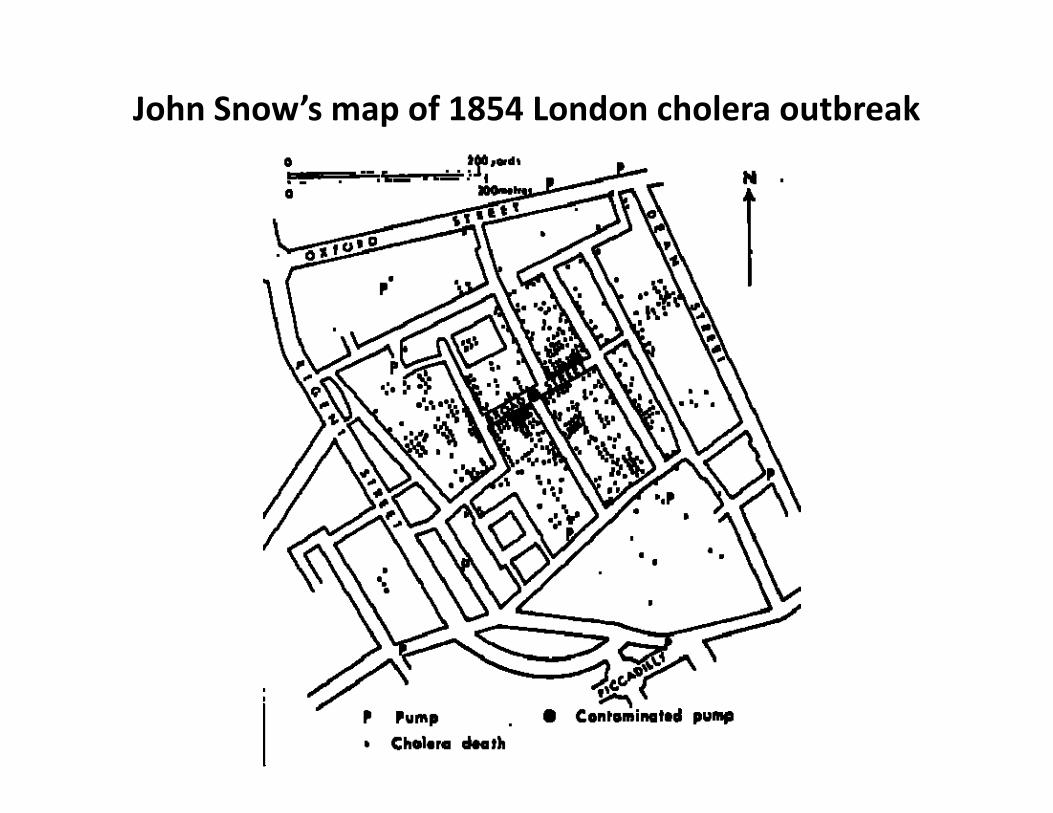
John Snow’s map of 1854 London cholera outbreak


http://www.nature.com/ngeo/journal/v5/n4/full/ngeo1430.html
• Broad range of 2050 warming from an observationally constrained large climate model ensemble
• Daniel J. Rowlands, David J. Frame, Duncan Ackerley, Tolu Aina,Ben B. B. Booth, Carl Christensen, Matthew Collins, Nicholas Faull,Chris E. Forest, Benjamin S. Grandey, Edward Gryspeerdt,Eleanor J. Highwood, William J. Ingram, Sylvia Knight,Ana Lopez, Neil Massey, Frances McNamara,
Nicolai Meinshausen, Claudio Piani, Suzanne M. Rosier,Benjamin M. Sanderson, Leonard A. Smith, Dáithí A. Stone, Milo Thurston, Kuniko Yamazaki, Y. Hiro Yamazaki & Myles R. Allen Show fewer authors
• AffiliationsContributionsCorresponding author• Nature Geoscience 5, 256–260 (2012) doi:10.1038/ngeo1430• Received 11 August 2011 Accepted 23 February 2012 Published online 25
March 2012

Three questions
• Can a framework like Ostrom’s be used as a practical tool to help us design better urban institutions? – Better land use regulation, financial systems, etc.
• Application of the second best: when does a marginal improvement in one characteristic move us in the expected direction?
• How do we make the nested choices of broad approach, then the details in which the devil resides?

Ester Boserup

Readings
• Boserup, E. 1965. The Conditions of Agricultural Growth: The Economics of Agrarian Change under Population Pressure. Chicago: Aldine. London: Allen & Unwin.

Little correlation between countries’ population growth, and GDP growth (1975 to 2005)

We recently hit 7 billion population.It took only 12 years to go from 6 to 7.
Population growth rates are falling.Population should stabilize circa 2050.

Current thinking about population growth and development
• The simple Malthusian view that reducing population is a key to improving standards of living has been thoroughly discredited.
• Nevertheless, there are many important links between population growth – and its structure – and economic development.
• Hypothesis: countries that have a large cohort of population entering their workforce can receive a “demographic dividend.”


0
0.1
0.2
0.3
0.4
0.5
0.6
0.7
0.8
0.9
1
0
20
40
60
80
100
120
140
1‐46
1‐48
1‐50
1‐52
1‐54
1‐56
1‐58
1‐60
1‐62
1‐64
1‐66
1‐68
1‐70
1‐72
1‐74
1‐76
1‐78
1‐80
1‐82
1‐84
1‐86
1‐88
1‐90
1‐92
1‐94
1‐96
1‐98
1‐00
1‐02
1‐04
1‐06
1‐08
1‐10
$2008 pe
r Barrel
Real Oil PricesWest Texas Intermediate Crude in $2008 per barrel
What economists know, that Malthus and Ehrlich did not
• People respond to changes in relative prices!• “Consumer substitution in response to changes in relative prices.” On the demand side, when prices rise, people start to consume less of the goods that are relatively more expensive.
• “Endogenous technical change.” On the supply side, when prices rise, people start to work harder to lower costs, use less of that particular good, find new supplies, and invent and market better substitutes.

Selected readings
• Bloom, D. E., D. Canning, et al. (2003). The demographic dividend: a new perspective on the economic consequences of population change, Rand Corp.
• Bloom, D. E. and J. G. Williamson (1998). "Demographic transitions and economic miracles in emerging Asia." The World Bank Economic Review 12(3): 419‐455.
• Borlaug, N. E. (2007). "Sixty‐two years of fighting hunger: personal recollections." Euphytica 157(3): 287‐297.
• Ehrlich, P. R. (1968). "The population bomb." New York.• Ehrlich, P. R. and A. H. Ehrlich (2009). "The population bomb
revisited." The Electronic Journal of Sustainable Development 1(3): 63‐71.

Selected readings• Ejeta, G. (2010). "African Green Revolution needn’t be a
mirage." Science 327(5967): 831.• Evenson, R. E. and D. Gollin (2003). "Assessing the impact of
the Green Revolution, 1960 to 2000." Science 300(5620): 758.• Fogel, R. W. (1999). "Catching up with the economy." The
American Economic Review 89(1): 1‐21.• Malthus, T. R. (1888). An essay on the principle of population:
or, A view of its past and present effects on human happiness, London, Reeves and Turner.
• Schultz, T. P. (2002). "Why governments should invest more to educate girls." World Development 30(2): 207‐225.
• Sen, Amartya, Poverty and Famines: An Essay on Entitlements and Deprivation, Oxford, Clarendon Press, 1982.
• Simon, J. L. (1998). The Ultimate Resource 2, Princeton UnivPress.

0.0
0.2
0.4
0.6
0.8
1.0
1.2
1.4
1.6
86‐1
87‐1
88‐1
89‐1
90‐1
91‐1
92‐1
93‐1
94‐1
95‐1
96‐1
97‐1
98‐1
99‐1
00‐1
01‐1
02‐1
03‐1
04‐1
05‐1
06‐1
07‐1
08‐1
09‐1
10‐1
11‐1
MBA Rate of Forelosures StartedPercent of All Loans, Not Seasonally Adjusted
57
We also have solutions
• An ever‐increasing

A mistake?
• Adam Smith “contributed to… the tendency to assume that decisions reached individually will, in fact, be the best decisions for an entire society.”
• It’s true that Smith is often cited as support for context‐free laissez faire, but read Smith’s two great works for a much more nuanced view of markets.
• For students: read P.J. O’Rourke, On the Wealth of Nations.

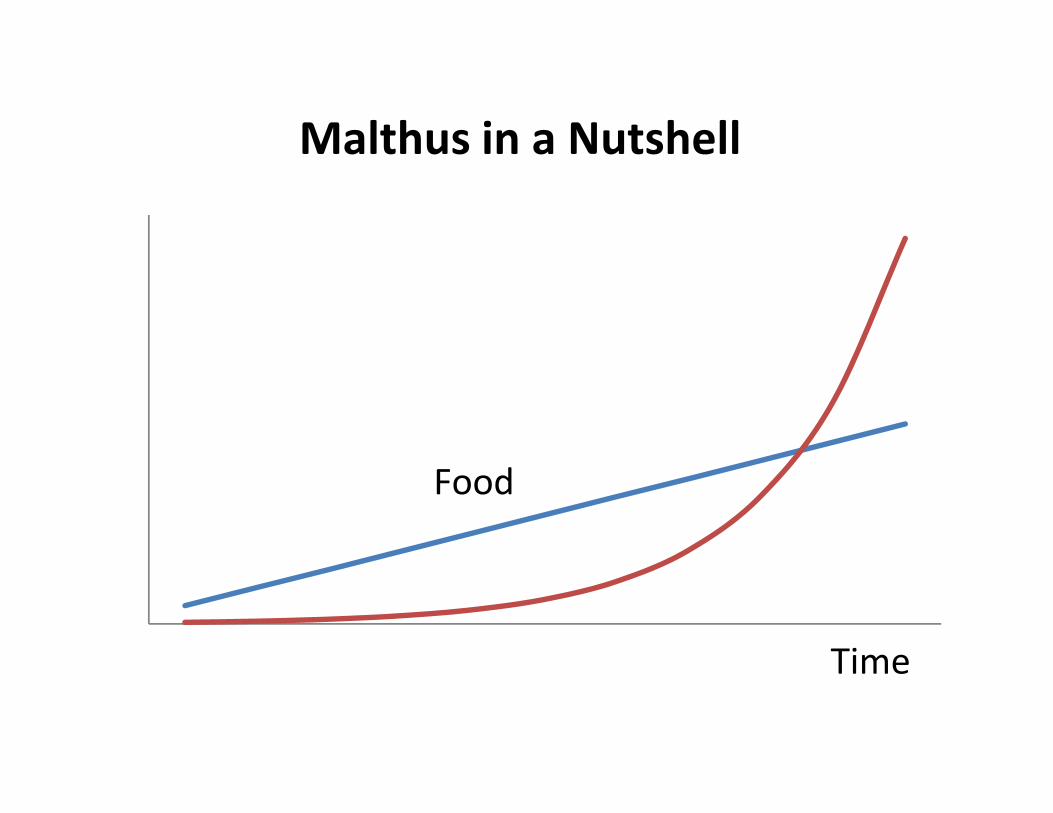
Thomas Malthus
0
50
100
150
200
250
300
350
400
450
1 2 3 4 5 6 7 8 9 10 11Time
Malthus in a Nutshell
Food


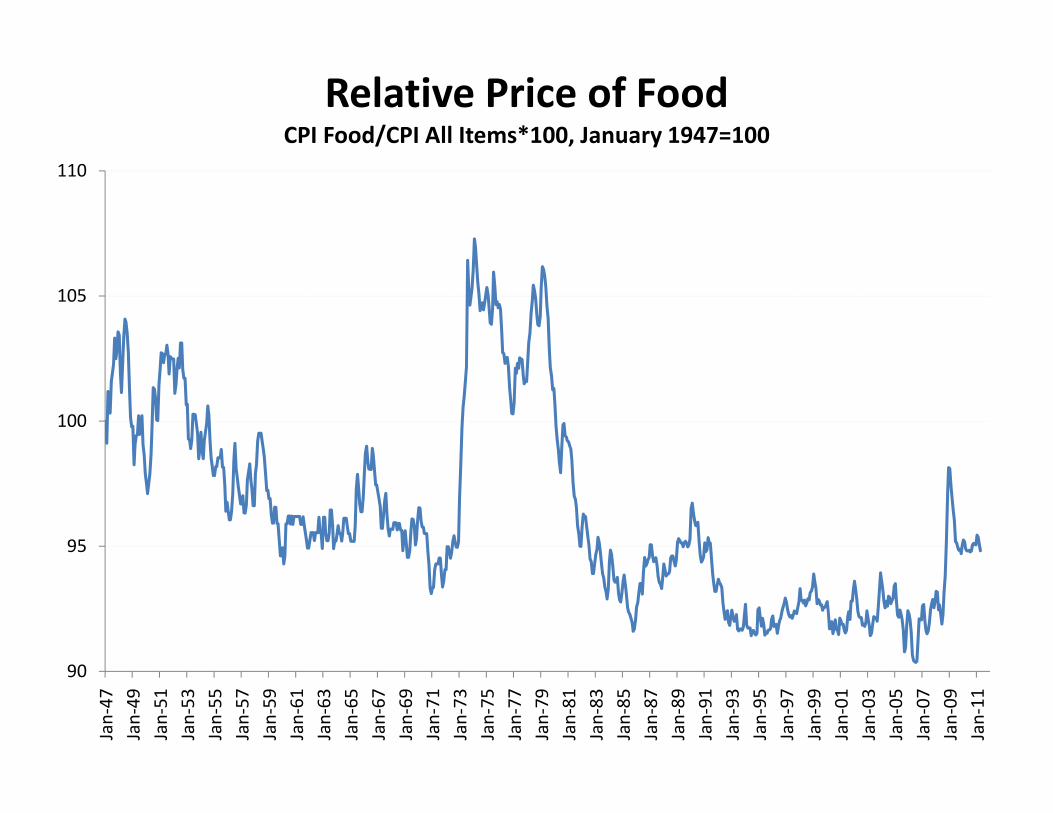
Economists look to prices as an important signal of how we’re doing
• For example, if we’re running out of food world‐wide, we’d expect to see real food prices rising.
• Real CPI for food has been rising lately – tied partly to increasing prices of oil (input to fertilizer and transportation), ethanol subsidies.
• We had a big bump up during the oil price shocks of the 70s and 80s too. But eventually food prices resumed their downward march.
• Will they do so again?

90
95
100
105
110
Jan‐47
Jan‐49
Jan‐51
Jan‐53
Jan‐55
Jan‐57
Jan‐59
Jan‐61
Jan‐63
Jan‐65
Jan‐67
Jan‐69
Jan‐71
Jan‐73
Jan‐75
Jan‐77
Jan‐79
Jan‐81
Jan‐83
Jan‐85
Jan‐87
Jan‐89
Jan‐91
Jan‐93
Jan‐95
Jan‐97
Jan‐99
Jan‐01
Jan‐03
Jan‐05
Jan‐07
Jan‐09
Jan‐11
Relative Price of FoodCPI Food/CPI All Items*100, January 1947=100

What economists know, that Malthus, Hardin and other neo‐
Malthusians did not.• People respond to changes in relative prices!
– “Consumer substitution in response to changes in relative prices.” On the demand side, when prices rise, people start to consume less of the goods that are relatively more expensive.
– “Endogenous technical change.” On the supply side, when prices rise, people start to work harder to lower costs, use less of that particular good, find new supplies, and invent and market better substitutes.