Some Myths about the Chinese Economy - Hong Kong …€¦ · · 2012-11-16Some Myths about the...
55
Some Myths about the Chinese Economy Lawrence J. Lau, Ph. D. President and Ralph and Claire Landau Professor of Economics The Chinese University of Hong Kong and Kwoh-Ting Li Professor in Economic Development, Emeritus, Stanford University First Annual International Conference on the Chinese Economy Hong Kong Institute of Monetary Research Hong Kong, 11 January 2010 Phone: (852) 2609-8600; Fax: (852) 2603-5230 Email: [email protected] ; WebPages: HTTP://WWW.CUHK.EDU.HK/VC
Transcript of Some Myths about the Chinese Economy - Hong Kong …€¦ · · 2012-11-16Some Myths about the...

Some Myths about the
Chinese EconomyLawrence J. Lau, Ph. D.
President and Ralph and Claire Landau Professor of EconomicsThe Chinese University of Hong Kong
andKwoh-Ting Li Professor in Economic Development, Emeritus, Stanford University
First Annual International Conference on the Chinese EconomyHong Kong Institute of Monetary Research
Hong Kong, 11 January 2010
Phone: (852) 2609-8600; Fax: (852) 2603-5230Email: [email protected]; WebPages: HTTP://WWW.CUHK.EDU.HK/VC

Lawrence J. Lau, The Chinese University of Hong Kong 2
Preview
Introduction
The Seven Myths about the Chinese Economy
Concluding Remarks

Lawrence J. Lau, The Chinese University of Hong Kong 3
Introduction
There are many misunderstandings and myths about the Chinese economy. But repeated often enough, and by sufficiently respectable “authorities,” they tend to become accepted as truths.
However, accepting these misunderstandings and myths as truths has serious consequences: policy makers base their decisions on these assumed “truths.” And their policies will not have the expected effects if these assumed “truths” turn out to be false.
I hope to help dispel some of the common myths about the Chinese economy.

Lawrence J. Lau, The Chinese University of Hong Kong 4
The Seven Myths about the Chinese Economy
The Yuan is Under-Valued
Chinese Trade Surpluses Caused the Global Imbalances
Chinese Economic Growth Depends Critically on Exports
The Economies of China and East Asia Cannot be De- Coupled from the U.S. and Europe
Chinese Household Savings Rates Are Too High
China Faces Labour Shortages
The World Economy is Now Dominated by G-2 (Group of Two)—the United States and China

Lawrence J. Lau, The Chinese University of Hong Kong 5
Is the Yuan Under-Valued?
A country’s currency is considered under-valued if it runs persistent surpluses in trade in goods and services combined vis-à-vis the entire World. It is considered over-valued if it runs persistent trade deficits vis-a-vis the World.
A bilateral trade surplus, even a persistent one, says nothing about whether a country’s currency is under- valued because it may still have a near zero or even negative trade balance vis-à-vis the entire world. Most non-oil producing countries have persistent bilateral trade deficits with oil-exporting countries. And that does not necessarily mean the currencies of the oil-exporting countries are under-valued.

Lawrence J. Lau, The Chinese University of Hong Kong 6
Is the Yuan Under-Valued?
The statistics on Chinese trade balances over the past three decades indicate that China has had essentially balanced trade in goods and services combined with the World until 2005 and that its trade surplus is once again approaching zero in 2010.
In contrast, the large U.S. trade deficit with the world existed since at least 1998, long before 2005. What this means is that while there is evidence that the U.S. Dollar might have been over-valued, there is no evidence that the Renminbi was under-valued prior to 2005.

Lawrence J. Lau, The Chinese University of Hong Kong 7Lawrence J. Lau, The Chinese University of Hong Kong 7
Chinese Monthly Exports, Imports and Trade Balance, Goods Only, US$
Monthly Chinese Exports, Imports and Trade Balance of Goods, in U.S. Dollars
-10
0
10
20
30
40
50
60
70
80
90
100
110
120
130
140
150
Jan-
92A
pr-9
2Ju
l-92
Oct
-92
Jan-
93A
pr-9
3Ju
l-93
Oct
-93
Jan-
94A
pr-9
4Ju
l-94
Oct
-94
Jan-
95A
pr-9
5Ju
l-95
Oct
-95
Jan-
96A
pr-9
6Ju
l-96
Oct
-96
Jan-
97A
pr-9
7Ju
l-97
Oct
-97
Jan-
98A
pr-9
8Ju
l-98
Oct
-98
Jan-
99A
pr-9
9Ju
l-99
Oct
-99
Jan-
00A
pr-0
0Ju
l-00
Oct
-00
Jan-
01A
pr-0
1Ju
l-01
Oct
-01
Jan-
02A
pr-0
2Ju
l-02
Oct
-02
Jan-
03A
pr-0
3Ju
l-03
Oct
-03
Jan-
04A
pr-0
4Ju
l-04
Oct
-04
Jan-
05A
pr-0
5Ju
l-05
Oct
-05
Jan-
06A
pr-0
6Ju
l-06
Oct
-06
Jan-
07A
pr-0
7Ju
l-07
Oct
-07
Jan-
08A
pr-0
8Ju
l-08
Oct
-08
Jan-
09A
pr-0
9Ju
l-09
Oct
-09
Jan-
10
USD
bill
ions Exports, fob
Imports, cif
Trade Balance

Lawrence J. Lau, The Chinese University of Hong Kong 8
Monthly Chinese Surplus and U.S. Deficit with the World, Trade in Goods, Bill. US$
Monthly Chinese Surplus and U.S. Deficit with the World, Trade in Goods, Billion US$
-20
0
20
40
60
80
100
M1
1979
M7
1979
M1
1980
M7
1980
M1
1981
M7
1981
M1
1982
M7
1982
M1
1983
M7
1983
M1
1984
M7
1984
M1
1985
M7
1985
M1
1986
M7
1986
M1
1987
M7
1987
M1
1988
M7
1988
M1
1989
M7
1989
M1
1990
M7
1990
M1
1991
M7
1991
M1
1992
M7
1992
M1
1993
M7
1993
M1
1994
M7
1994
M1
1995
M7
1995
M1
1996
M7
1996
M1
1997
M7
1997
M1
1998
M7
1998
M1
1999
M7
1999
M1
2000
M7
2000
M1
2001
M7
2001
M1
2002
M7
2002
M1
2003
M7
2003
M1
2004
M7
2004
M1
2005
M7
2005
M1
2006
M7
2006
M1
2007
M7
2007
M1
2008
M7
2008
M1
2009
M7
2009
M1
2010
US$
Bill
ions
Chinese Trade Surplus in Goods
U.S. Trade Deficit in Goods

Lawrence J. Lau, The Chinese University of Hong Kong 9
Annual Chinese Surplus and U.S. Deficit with the World, Goods & Services, US$
Figure 2: Chinese Surplus and U.S. Deficit with the World, Trade in Goods and Services
-100
0
100
200
300
400
500
600
700
800
1979
1980
1981
1982
1983
1984
1985
1986
1987
1988
1989
1990
1991
1992
1993
1994
1995
1996
1997
1998
1999
2000
2001
2002
2003
2004
2005
2006
2007
2008
USD
bill
ions
Chinese Trade Surplus
U.S. Trade Deficit

Lawrence J. Lau, The Chinese University of Hong Kong 10
Is the Yuan Under-Valued?
In July 2005, the Renminbi was allowed to appreciate and rose 20 percent in nominal terms and 25 percent in real terms by the end of 2008.
The Chinese trade surplus vis-à-vis the world, which began rising in 2005, reached a peak in 2007 and began to decline in 2008. For 2009, it has declined more than 30%. It has continued to fall and has turned negative in 2010M3.
The long-term goal of the Chinese Government is to reduce the Chinese trade surplus vis-à-vis the World to zero. If the current trend continues, the goal of zero annual trade balance can probably be achieved by 2011, without necessarily any large adjustment in the nominal Yuan/U.S. Dollar exchange rate.

Lawrence J. Lau, The Chinese University of Hong Kong 11Lawrence J. Lau, The Chinese University of Hong Kong 11
The Nominal and Real Yuan/US$ Exchange Rates
The Nominal and Real Exchange Rates (1994 prices), Yuan/US$
5.0
5.5
6.0
6.5
7.0
7.5
8.0
8.5
9.0
Jan-
94A
pr-9
4Ju
l-94
Oct
-94
Jan-
95A
pr-9
5Ju
l-95
Oct
-95
Jan-
96A
pr-9
6Ju
l-96
Oct
-96
Jan-
97A
pr-9
7Ju
l-97
Oct
-97
Jan-
98A
pr-9
8Ju
l-98
Oct
-98
Jan-
99A
pr-9
9Ju
l-99
Oct
-99
Jan-
00A
pr-0
0Ju
l-00
Oct
-00
Jan-
01A
pr-0
1Ju
l-01
Oct
-01
Jan-
02A
pr-0
2Ju
l-02
Oct
-02
Jan-
03A
pr-0
3Ju
l-03
Oct
-03
Jan-
04A
pr-0
4Ju
l-04
Oct
-04
Jan-
05A
pr-0
5Ju
l-05
Oct
-05
Jan-
06A
pr-0
6Ju
l-06
Oct
-06
Jan-
07A
pr-0
7Ju
l-07
Oct
-07
Jan-
08A
pr-0
8Ju
l-08
Oct
-08
Jan-
09A
pr-0
9Ju
l-09
Oct
-09
Jan-
10
Yua
n pe
r U
.S. D
olla
r The Nominal Exchange Rate, Yuan/US$
The Real Exchange Rate, Yuan/US$

Lawrence J. Lau, The Chinese University of Hong Kong 12
Did the Chinese Trade Surpluses Cause the Global Imbalances ?
Global imbalances are blamed as a major cause of the current global financial crisis. However, the large U.S. trade deficit with the World existed since 1998, long before China began to have a significant trade surplus vis-à-vis the world. In 2000, U.S. trade deficit was US$380 billion whereas the Chinese trade surplus was only less than US$30 billion. Thus, the Chinese trade surpluses could not possibly have been the source of the global imbalances that supposedly fed the global liquidity that ultimately “enabled” the current global financial crisis.

Lawrence J. Lau, The Chinese University of Hong Kong 13
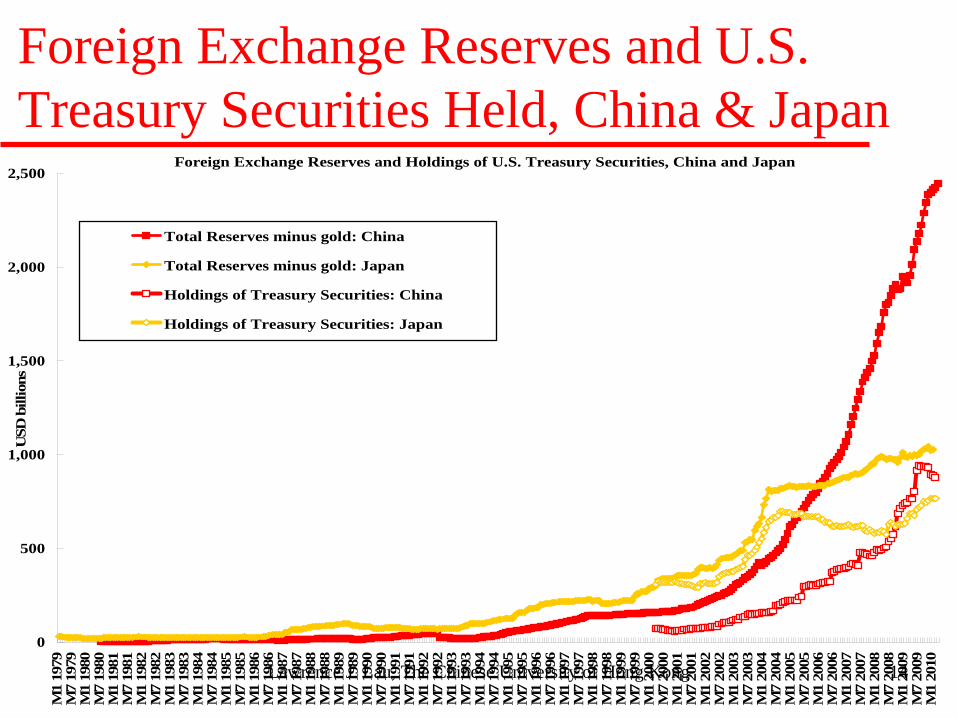
Did the Chinese Trade Surpluses Caused the Global Imbalances ?
Japan and the oil exporting countries accounted for most of the trade surpluses vis-à-vis the world, and hence the global imbalances, since 2000. Japan had the largest foreign exchange reserves in the World until it was overtaken by China in 2006, and the Bank of Japan consistently held the largest amount of U.S. Treasury securities until the last quarter of 2008, when holdings of the People’s Bank of China exceeded the Bank of Japan’s for the first time.
In fact, the Case-Shiller U.S. Home Price Index, which can be taken as a proxy for the speculative asset price inflation caused by the growth of the sub-prime mortgage loans in the U.S., correlates almost perfectly with the U.S. trade deficit with the World but not with the Chinese trade surplus, demonstrating yet once again that the Chinese trade surpluses could not have been responsible for the global imbalances.
Lawrence J. Lau, The Chinese University of Hong Kong 14
Foreign Exchange Reserves and U.S. Treasury Securities Held, China & Japan
Foreign Exchange Reserves and Holdings of U.S. Treasury Securities, China and Japan
0
500
1,000
1,500
2,000
2,500
M1
1979
M7
1979
M1
1980
M7
1980
M1
1981
M7
1981
M1
1982
M7
1982
M1
1983
M7
1983
M1
1984
M7
1984
M1
1985
M7
1985
M1
1986
M7
1986
M1
1987
M7
1987
M1
1988
M7
1988
M1
1989
M7
1989
M1
1990
M7
1990
M1
1991
M7
1991
M1
1992
M7
1992
M1
1993
M7
1993
M1
1994
M7
1994
M1
1995
M7
1995
M1
1996
M7
1996
M1
1997
M7
1997
M1
1998
M7
1998
M1
1999
M7
1999
M1
2000
M7
2000
M1
2001
M7
2001
M1
2002
M7
2002
M1
2003
M7
2003
M1
2004
M7
2004
M1
2005
M7
2005
M1
2006
M7
2006
M1
2007
M7
2007
M1
2008
M7
2008
M1
2009
M7
2009
M1
2010
USD
bill
ions
Total Reserves minus gold: China
Total Reserves minus gold: Japan
Holdings of Treasury Securities: China
Holdings of Treasury Securities: Japan

Lawrence J. Lau, The Chinese University of Hong Kong 15
Case-Shiller U.S. Home Price Index, Chinese Trade Surplus & U.S. Trade Deficit, Bill. US$
Case-Shiller Home Price Index (2000Q1=100) , U.S. Trade Deficit and Chinese Trade Surplus
60
80
100
120
140
160
180
200
220
Jan-
00A
pr-0
0Ju
l-00
Oct
-00
Jan-
01A
pr-0
1Ju
l-01
Oct
-01
Jan-
02A
pr-0
2Ju
l-02
Oct
-02
Jan-
03A
pr-0
3Ju
l-03
Oct
-03
Jan-
04A
pr-0
4Ju
l-04
Oct
-04
Jan-
05A
pr-0
5Ju
l-05
Oct
-05
Jan-
06A
pr-0
6Ju
l-06
Oct
-06
Jan-
07A
pr-0
7Ju
l-07
Oct
-07
Jan-
08A
pr-0
8Ju
l-08
Oct
-08
Jan-
09A
pr-0
9Ju
l-09
Oct
-09
Jan-
10
2000
Q1=
100
-10
0
10
20
30
40
50
60
70
80
90
100
USD
bill
ions
Case-Shiller Home Price Index
U.S. Trade Deficit with the World
Chinese Trade Surplus with the World

Lawrence J. Lau, The Chinese University of Hong Kong 16
Chinese Surplus and U.S. Deficit with the World, Trade in Goods and Services
Chinese Surplus and U.S. Deficit with the World, Trade in Goods and Services
-100
0
100
200
300
400
500
600
700
800
1979
1980
1981
1982
1983
1984
1985
1986
1987
1988
1989
1990
1991
1992
1993
1994
1995
1996
1997
1998
1999
2000
2001
2002
2003
2004
2005
2006
2007
2008
2009
USD
bill
ions
Chinese Trade Surplus
U.S. Trade Deficit

Lawrence J. Lau, The Chinese University of Hong Kong 17Lawrence J. Lau, The Chinese University of Hong Kong 17
The Nominal and Real World Prices of Oil (2009 prices)
Nominal and Real Price of Oil
0
10
20
30
40
50
60
70
80
90
100
110
120
130
Jan-
74Ju
l-74
Jan-
75Ju
l-75
Jan-
76Ju
l-76
Jan-
77Ju
l-77
Jan-
78Ju
l-78
Jan-
79Ju
l-79
Jan-
80Ju
l-80
Jan-
81Ju
l-81
Jan-
82Ju
l-82
Jan-
83Ju
l-83
Jan-
84Ju
l-84
Jan-
85Ju
l-85
Jan-
86Ju
l-86
Jan-
87Ju
l-87
Jan-
88Ju
l-88
Jan-
89Ju
l-89
Jan-
90Ju
l-90
Jan-
91Ju
l-91
Jan-
92Ju
l-92
Jan-
93Ju
l-93
Jan-
94Ju
l-94
Jan-
95Ju
l-95
Jan-
96Ju
l-96
Jan-
97Ju
l-97
Jan-
98Ju
l-98
Jan-
99Ju
l-99
Jan-
00Ju
l-00
Jan-
01Ju
l-01
Jan-
02Ju
l-02
Jan-
03Ju
l-03
Jan-
04Ju
l-04
Jan-
05Ju
l-05
Jan-
06Ju
l-06
Jan-
07Ju
l-07
Jan-
08Ju
l-08
Jan-
09Ju
l-09
Jan-
10
U.S
. Dol
lars
per
Bar
rel
Nominal Price of Oil
Real Price of Oil, in 2009M1 price

Lawrence J. Lau, The Chinese University of Hong Kong 18
Is Chinese Economic Growth Critically Dependent on Exports?
It should be clear from the fact that the Chinese economy has been growing at an average real rate of growth of approximately 10 percent per annum since 1979, and that a significant Chinese trade surplus vis-a-vis the World only began to occur in 2005, that Chinese economic growth could not possibly have been critically dependent on running export surpluses.
Chinese exports as a ratio of GDP has been heading downwards from its peak of almost 40 percent in 2006 to approximately 25 percent in 2009. While this ratio appears large, it actually exaggerates the importance of exports in the Chinese economy.

Lawrence J. Lau, The Chinese University of Hong Kong 19Lawrence J. Lau, The Chinese University of Hong Kong 19
Real Chinese GDP in US$ Since 1952 (2009 Prices)
0
500
1,000
1,500
2,000
2,500
3,000
3,500
4,000
4,500
5,000
1952
1953
1954
1955
1956
1957
1958
1959
1960
1961
1962
1963
1964
1965
1966
1967
1968
1969
1970
1971
1972
1973
1974
1975
1976
1977
1978
1979
1980
1981
1982
1983
1984
1985
1986
1987
1988
1989
1990
1991
1992
1993
1994
1995
1996
1997
1998
1999
2000
2001
2002
2003
2004
2005
2006
2007
2008
2009
Billi
ons U
S$
Chinese Real GDP, in 2009 prices

Lawrence J. Lau, The Chinese University of Hong Kong 20
Chinese Exports of Goods and Services as a Ratio of GDP, 1970-present
Chinese Exports of Goods and Services as a Ratio of GDP since 1970
0
5
10
15
20
25
30
35
40
45
1970
1971
1972
1973
1974
1975
1976
1977
1978
1979
1980
1981
1982
1983
1984
1985
1986
1987
1988
1989
1990
1991
1992
1993
1994
1995
1996
1997
1998
1999
2000
2001
2002
2003
2004
2005
2006
2007
2008
2009
Perc
ent

Lawrence J. Lau, The Chinese University of Hong Kong 21
Is Chinese Economic Growth Critically Dependent on Exports?
The domestic value-added content of Chinese exports is no more than 30 percent, that is: for every dollar of goods exported, less than 30 cents, on average, consist of domestic value-added. If we multiply the Exports/GDP ratio of say 40 percent (it is actually much lower) to the domestic value-added content of 30 percent, we obtain 12 percent, which is the maximum percentage of Chinese GDP attributable to exports.
Now, 12 percent of GDP is a large number, and no economy can afford to lose 12 percent of its GDP overnight. However, if 12 percent of GDP does not grow, or even declines by 25 percent, as long as the other 88 percent of the economy continues to grow, the economy as a whole should do all right, especially if appropriate compensatory economic stimulus measures are taken.

Lawrence J. Lau, The Chinese University of Hong Kong 22
Is Chinese Economic Growth Critically Dependent on Exports?
A 25 percent decline in Chinese exports should result in a 25 percent times 12 percent or 3 percent maximum decline in Chinese GDP, other things being equal. Thus, the reduction in exports caused by the global financial crisis should be expected to reduce the Chinese real rate of growth from 9 percent in 2008 to 6 percent in 2009. However, the 4-trillion economic stimulus programme launched by the Chinese Government in November 2008 should help make up the short-fall in aggregate demand.

Lawrence J. Lau, The Chinese University of Hong Kong 23
Is Chinese Economic Growth Critically Dependent on Exports?
Moreover, even if Chinese exports manage to grow by 25 percent per year going forward (which is most unlikely), it will lead to only 3 percent overall economic growth, which is by itself hardly enough. That is why China cannot, and will not, rely on exports as a primary source of its future economic growth.
If there were any lingering doubts on the degree of export-dependence of the Chinese economy, they should have been dispelled by the fact that the Chinese economy managed to achieve a real rate of growth of 8.7 percent in 2009, with exports down by 25 percent from 2008 and the U.S. and European economies still mired in recession.

Lawrence J. Lau, The Chinese University of Hong Kong 24
External Dependence of Mainland China
An important implication of the relatively low external dependence of Chinese GDP is that the rate of growth of Chinese real GDP is relatively stable even as Chinese exports and imports fluctuate as widely as the exports and imports of other East Asian economies. (see the following charts on the rates of growth of the exports, imports and real GDP of East Asian economies).

Lawrence J. Lau, The Chinese University of Hong Kong 25Lawrence J. Lau, The Chinese University of Hong Kong 25
Quarterly Rates of Growth of Exports of Goods: Selected East Asian Economies
Year-over-Year Quarterly Rates of Growth of Exports of Goods in US$ (Percent)
-50
-40
-30
-20
-10
0
10
20
30
40
50
Q1
1997
Q2
1997
Q3
1997
Q4
1997
Q1
1998
Q2
1998
Q3
1998
Q4
1998
Q1
1999
Q2
1999
Q3
1999
Q4
1999
Q1
2000
Q2
2000
Q3
2000
Q4
2000
Q1
2001
Q2
2001
Q3
2001
Q4
2001
Q1
2002
Q2
2002
Q3
2002
Q4
2002
Q1
2003
Q2
2003
Q3
2003
Q4
2003
Q1
2004
Q2
2004
Q3
2004
Q4
2004
Q1
2005
Q2
2005
Q3
2005
Q4
2005
Q1
2006
Q2
2006
Q3
2006
Q4
2006
Q1
2007
Q2
2007
Q3
2007
Q4
2007
Q1
2008
Q2
2008
Q3
2008
Q4
2008
Q1
2009
Q2
2009
Q3
2009
Q4
2009
Ann
ualiz
ed P
erce
nt p
er a
nnum
China,P.R.:Hong Kong IndiaIndonesia KoreaMalaysia PhilippinesSingapore ThailandChina,P.R.: Mainland JapanTaiwan Prov.of China

Lawrence J. Lau, The Chinese University of Hong Kong 26Lawrence J. Lau, The Chinese University of Hong Kong 26
Quarterly Rates of Growth of Imports of Goods: Selected East Asian Economies
Year-over-Year Quarterly Rates of Growth of Imports of Goods in US$ (Percent)
-50
-40
-30
-20
-10
0
10
20
30
40
50
60
70
Q1
1997
Q2
1997
Q3
1997
Q4
1997
Q1
1998
Q2
1998
Q3
1998
Q4
1998
Q1
1999
Q2
1999
Q3
1999
Q4
1999
Q1
2000
Q2
2000
Q3
2000
Q4
2000
Q1
2001
Q2
2001
Q3
2001
Q4
2001
Q1
2002
Q2
2002
Q3
2002
Q4
2002
Q1
2003
Q2
2003
Q3
2003
Q4
2003
Q1
2004
Q2
2004
Q3
2004
Q4
2004
Q1
2005
Q2
2005
Q3
2005
Q4
2005
Q1
2006
Q2
2006
Q3
2006
Q4
2006
Q1
2007
Q2
2007
Q3
2007
Q4
2007
Q1
2008
Q2
2008
Q3
2008
Q4
2008
Q1
2009
Q2
2009
Q3
2009
Q4
2009
Ann
ualiz
ed P
erce
nt p
er a
nnum
China,P.R.:Hong Kong IndiaIndonesia KoreaMalaysia PhilippinesSingapore ThailandChina,P.R.: Mainland JapanTaiwan Prov.of China

Lawrence J. Lau, The Chinese University of Hong Kong 27Lawrence J. Lau, The Chinese University of Hong Kong 27
Quarterly Rates of Growth of Real GDP, Y-o-Y: Selected East Asian Economies
Quarterly Rates of Growth of Real GDP, Year-over-Year, Selected East Asian Economies
-20
-15
-10
-5
0
5
10
15
20
Q1
1994
Q2
1994
Q3
1994
Q4
1994
Q1
1995
Q2
1995
Q3
1995
Q4
1995
Q1
1996
Q2
1996
Q3
1996
Q4
1996
Q1
1997
Q2
1997
Q3
1997
Q4
1997
Q1
1998
Q2
1998
Q3
1998
Q4
1998
Q1
1999
Q2
1999
Q3
1999
Q4
1999
Q1
2000
Q2
2000
Q3
2000
Q4
2000
Q1
2001
Q2
2001
Q3
2001
Q4
2001
Q1
2002
Q2
2002
Q3
2002
Q4
2002
Q1
2003
Q2
2003
Q3
2003
Q4
2003
Q1
2004
Q2
2004
Q3
2004
Q4
2004
Q1
2005
Q2
2005
Q3
2005
Q4
2005
Q1
2006
Q2
2006
Q3
2006
Q4
2006
Q1
2007
Q2
2007
Q3
2007
Q4
2007
Q1
2008
Q2
2008
Q3
2008
Q4
2008
Q1
2009
Q2
2009
Q3
2009
Q4
2009
Ann
ualiz
ed R
ates
in P
erce
nt
China,P.R.:Hong Kong IndiaIndonesia KoreaMalaysia PhilippinesSingapore ThailandChina,P.R.: Mainland JapanTaiwan Prov.of China

Lawrence J. Lau, The Chinese University of Hong Kong 28
Can the Economies of East Asia/China be De-Coupled from the U.S. and Europe?
East Asia is taken to mean the 10 ASEAN countries (Brunei, Cambodia, Indonesia, Laos, Malaysia, Myanmar, Philippines, Singapore, Thailand and Vietnam) + 3 (China (including Hong Kong, Macao and Taiwan), Japan, and South Korea), that is, approximately, everything east of Bangladesh and west of the Pacific Ocean.
The “Partial De-Coupling Hypothesis” says that while East Asia is not immune from the effects of the economic recession in North America and Europe, it can nevertheless continue growing, albeit at somewhat lower rates, even with economic contraction in North America and Europe.
Partial de-coupling is a consequence of the economic centre of gravity of the World gradually shifting to East Asia from the United States and Western Europe and within East Asia from Japan to China (but the shifts are not yet completed).

Lawrence J. Lau, The Chinese University of Hong Kong 29
The Shifting Economic Centre of Gravity
In the following charts, East Asian and Chinese GDP as percentages of World GDP are respectively presented. Both show very strong trends of growth over the past half a century.
In 1960, East Asian GDP, comprising of the GDPs of ASEAN (Brunei, Cambodia, Indonesia, Laos, Malaysia, Myanmar, Philippines, Singapore, Thailand and Vietnam) + 3 (China (Mainland only), Japan, and South Korea) was just over 10 percent of World GDP.
Today, East Asian economies account for approximately a quarter of World GDP, comparable to the size of the U.S. economy and that of the Euro Zone.

Lawrence J. Lau, The Chinese University of Hong Kong 30Lawrence J. Lau, The Chinese University of Hong Kong 30
East Asian Share of World GDP, 1960-present
East Asian Share of World GDP, 1960-present
10
12
14
16
18
20
22
24
26
1960
1961
1962
1963
1964
1965
1966
1967
1968
1969
1970
1971
1972
1973
1974
1975
1976
1977
1978
1979
1980
1981
1982
1983
1984
1985
1986
1987
1988
1989
1990
1991
1992
1993
1994
1995
1996
1997
1998
1999
2000
2001
2002
2003
2004
2005
2006
2007
2008
Perc
ent

Lawrence J. Lau, The Chinese University of Hong Kong 31
The Shifting Economic Centre of Gravity
These figures and percentages are sensitive to the exchange rates used for the conversion, but the general conclusions below are reasonably robust to the exchange rates used.
(1) The contribution of East Asia to total World GDP has increased significantly to approximately a quarter, approximately the same as the contributions of the United States and the Euro Zone;
(2) The contribution of East Asia other than Japan, especially that of China, to East Asian GDP has also increased significantly; and
(3) Japan remains for the time being the leading economy within East Asia in both aggregate and per capita terms, but China (Mainland only) will likely surpass Japan in terms of aggregate GDP around 2015.

Lawrence J. Lau, The Chinese University of Hong Kong 32
Can the Economies of East Asia/China be De-Coupled from the U.S. and Europe?
Given the current trends in rates of economic growth, East Asia will surpass the United States in terms of aggregate GDP with China perhaps contributing the highest proportion of the total by 2015.
This is what gives credence to the idea of partial “de- coupling” of the World economies—that the Chinese and East Asian economies can continue to do reasonably well despite the current economic problems in the U.S. and elsewhere.
However, China, with its GDP accounting for only 7% of the World total, and East Asia are not large enough to turn around the whole World. The talk about G-2 is pre- mature.

Lawrence J. Lau, The Chinese University of Hong Kong 33Lawrence J. Lau, The Chinese University of Hong Kong 33
China’s Share of World GDP, 1960-present
China's GDP as a Percentage of World GDP, 1960-present
0.0
0.5
1.0
1.5
2.0
2.5
3.0
3.5
4.0
4.5
5.0
5.5
6.0
6.5
7.0
7.5
1960
1961
1962
1963
1964
1965
1966
1967
1968
1969
1970
1971
1972
1973
1974
1975
1976
1977
1978
1979
1980
1981
1982
1983
1984
1985
1986
1987
1988
1989
1990
1991
1992
1993
1994
1995
1996
1997
1998
1999
2000
2001
2002
2003
2004
2005
2006
2007
2008
2009
Perc
ent

Lawrence J. Lau, The Chinese University of Hong Kong 34
The Shifting Economic Centre of Gravity
East Asian shares of World exports, imports, and international trade have also grown from approximately 10 percent in 1960 to a quarter in 2008, paralleling the growth of East Asian share of World GDP (see the following chart).
Similarly, Chinese shares of World exports, imports and international trade have also grown.
Chinese exports and imports have risen from approximately 1 percent of World exports and imports in 1960 to approximately 10 percent of World exports and imports in 2008.
China has overtaken Japan to become the largest exporting country in East Asia. China has also overtaken Japan to become the largest importing country in East Asia and the most important export market for almost all East Asian economies and runs trade deficits vis-à-vis almost every one.

Lawrence J. Lau, The Chinese University of Hong Kong 35Lawrence J. Lau, The Chinese University of Hong Kong 35
The Rising Ratio of East Asian Trade in Total World Trade, 1960-present
East Asian Share of Total World Trade, 1960-present
0
5
10
15
20
25
30
1960
1961
1962
1963
1964
1965
1966
1967
1968
1969
1970
1971
1972
1973
1974
1975
1976
1977
1978
1979
1980
1981
1982
1983
1984
1985
1986
1987
1988
1989
1990
1991
1992
1993
1994
1995
1996
1997
1998
1999
2000
2001
2002
2003
2004
2005
2006
2007
2008
2009
Perc
ent
Share of World Exports
Share of World Imports
Share of Total World Trade

Lawrence J. Lau, The Chinese University of Hong Kong 36
Rising Intra-East Asian Interdependence
The emergence of the Chinese economy on the global market was the one most important new development during the past three decades. Japan has been China’s largest trading partner for the past decade and a half and China became Japan’s largest source of imports in 2002. The recent pick-up in economic activities in Japan is due in no small parts to the Chinese demand for Japanese exports.
Practically every other East Asian economy has a trade surplus vis-à-vis China.

Lawrence J. Lau, The Chinese University of Hong Kong 37Lawrence J. Lau, The Chinese University of Hong Kong 37
The Ratio of Chinese Trade in Total World Trade, 1950-present
The Ratio of Chinese Trade to World Trade
0
1
2
3
4
5
6
7
8
9
10
1950
1951
1952
1953
1954
1955
1956
1957
1958
1959
1960
1961
1962
1963
1964
1965
1966
1967
1968
1969
1970
1971
1972
1973
1974
1975
1976
1977
1978
1979
1980
1981
1982
1983
1984
1985
1986
1987
1988
1989
1990
1991
1992
1993
1994
1995
1996
1997
1998
1999
2000
2001
2002
2003
2004
2005
2006
2007
2008
2009
Perc
ent
The ratio of Chinese Exports to World Exports
The ratio of Chinese Imports to World Imports
The ratio of Chinese Total Trade to World Total Trade

Lawrence J. Lau, The Chinese University of Hong Kong 38Lawrence J. Lau, The Chinese University of Hong Kong 38
The Ratio of Chinese Trade in Total East Asian Trade, 1952-present
The Ratio of Chinese Trade to East Asian Trade
0
5
10
15
20
25
30
35
40
1952
1953
1954
1955
1956
1957
1958
1959
1960
1961
1962
1963
1964
1965
1966
1967
1968
1969
1970
1971
1972
1973
1974
1975
1976
1977
1978
1979
1980
1981
1982
1983
1984
1985
1986
1987
1988
1989
1990
1991
1992
1993
1994
1995
1996
1997
1998
1999
2000
2001
2002
2003
2004
2005
2006
2007
2008
2009
Perc
ent
The Ratio of Chinese Exports to East Asian Exports
The Ratio of Chinese Imports to East Asian Imports
The Ratio of Chinese Total Trade to East Asian Total Trade
Lawrence J. Lau, The Chinese University of Hong Kong 39
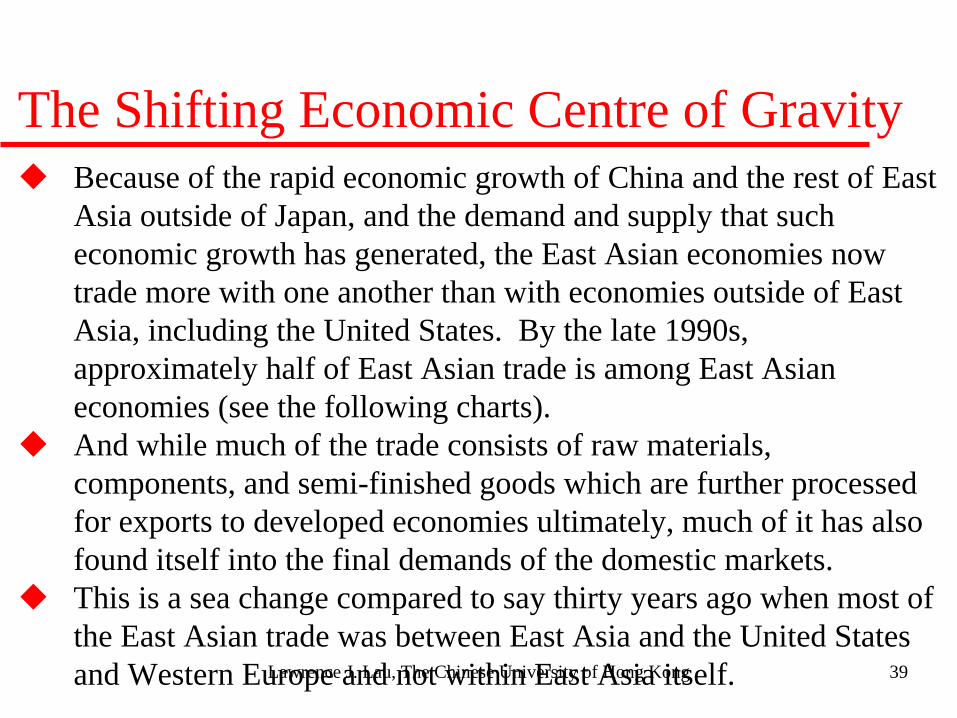
The Shifting Economic Centre of Gravity
Because of the rapid economic growth of China and the rest of East Asia outside of Japan, and the demand and supply that such economic growth has generated, the East Asian economies now trade more with one another than with economies outside of East Asia, including the United States. By the late 1990s, approximately half of East Asian trade is among East Asian economies (see the following charts).
And while much of the trade consists of raw materials, components, and semi-finished goods which are further processed for exports to developed economies ultimately, much of it has also found itself into the final demands of the domestic markets.
This is a sea change compared to say thirty years ago when most of the East Asian trade was between East Asia and the United States and Western Europe and not within East Asia itself.

Lawrence J. Lau, The Chinese University of Hong Kong 40Lawrence J. Lau, The Chinese University of Hong Kong 40
The Share of East Asian Exports Destined for East Asia
The Share of East Asian Exports Destined for East Asia
35
37
39
41
43
45
47
49
51
53
Jan-
98A
pr-9
8Ju
l-98
Oct
-98
Jan-
99A
pr-9
9Ju
l-99
Oct
-99
Jan-
00A
pr-0
0Ju
l-00
Oct
-00
Jan-
01A
pr-0
1Ju
l-01
Oct
-01
Jan-
02A
pr-0
2Ju
l-02
Oct
-02
Jan-
03A
pr-0
3Ju
l-03
Oct
-03
Jan-
04A
pr-0
4Ju
l-04
Oct
-04
Jan-
05A
pr-0
5Ju
l-05
Oct
-05
Jan-
06A
pr-0
6Ju
l-06
Oct
-06
Jan-
07A
pr-0
7Ju
l-07
Oct
-07
Jan-
08A
pr-0
8Ju
l-08
Oct
-08
Jan-
09A
pr-0
9Ju
l-09
Oct
-09
Jan-
10
%

Lawrence J. Lau, The Chinese University of Hong Kong 41Lawrence J. Lau, The Chinese University of Hong Kong 41
The Share of East Asian Imports Originated from East Asia
The Share of East Asian Imports Originated from East Asia
45
47
49
51
53
55
57
59
Jan-
98A
pr-9
8Ju
l-98
Oct
-98
Jan-
99A
pr-9
9Ju
l-99
Oct
-99
Jan-
00A
pr-0
0Ju
l-00
Oct
-00
Jan-
01A
pr-0
1Ju
l-01
Oct
-01
Jan-
02A
pr-0
2Ju
l-02
Oct
-02
Jan-
03A
pr-0
3Ju
l-03
Oct
-03
Jan-
04A
pr-0
4Ju
l-04
Oct
-04
Jan-
05A
pr-0
5Ju
l-05
Oct
-05
Jan-
06A
pr-0
6Ju
l-06
Oct
-06
Jan-
07A
pr-0
7Ju
l-07
Oct
-07
Jan-
08A
pr-0
8Ju
l-08
Oct
-08
Jan-
09A
pr-0
9Ju
l-09
Oct
-09
%

Lawrence J. Lau, The Chinese University of Hong Kong 42
The Changing Pattern of World Trade
Interdependence of the East Asian economies has been rising sharply over the years and East Asian dependence on the United States and Western Europe has declined. Interdependence of the East Asian economies will rise even further within the next five to ten years as East Asia becomes the only region with a high rate of economic growth.
The ASEAN Free Trade Area as well as its variations (+1 (China); + 3 (China, Japan and South Korea)) are rapidly becoming a reality. (There is also the more recently concluded Indo-ASEAN Free Trade Agreement.)

Lawrence J. Lau, The Chinese University of Hong Kong 43
The Savings Rates of East Asian Economies
The savings rates of East Asian economies (with the possible exception of the Philippines) have always been high and are sufficient to supply the necessary investment to enable the continued growth of these economies even as the inflows of both foreign direct and portfolio investment and of foreign loans from outside of East Asia decline.
This is in part what gives credence to the idea of “partial de-coupling” of the World economies—that the Chinese and East Asian economies can continue to do reasonably well despite the current economic problems in the U.S. and elsewhere.

Lawrence J. Lau, The Chinese University of Hong Kong 44Lawrence J. Lau, The Chinese University of Hong Kong 44
Savings Rates of Selected Asian Economies (1952-2008)
Savings Rates of Selected Asian Economies
0
10
20
30
40
50
60
1952
1953
1954
1955
1956
1957
1958
1959
1960
1961
1962
1963
1964
1965
1966
1967
1968
1969
1970
1971
1972
1973
1974
1975
1976
1977
1978
1979
1980
1981
1982
1983
1984
1985
1986
1987
1988
1989
1990
1991
1992
1993
1994
1995
1996
1997
1998
1999
2000
2001
2002
2003
2004
2005
2006
2007
2008
Year
Perc
ent
China, Mainland Hong KongIndia IndonesiaJapan KoreaMalaysia PhilippinesSingapore TaiwanThailand

Lawrence J. Lau, The Chinese University of Hong Kong 45Lawrence J. Lau, The Chinese University of Hong Kong 45
Savings Rates of Selected Asian Economies (1980-2008)
Savings Rates of Selected Asian Economies
10
15
20
25
30
35
40
45
50
55
60
1980
1981
1982
1983
1984
1985
1986
1987
1988
1989
1990
1991
1992
1993
1994
1995
1996
1997
1998
1999
2000
2001
2002
2003
2004
2005
2006
2007
2008
Year
Perc
ent
China, Mainland Hong KongIndia IndonesiaJapan KoreaMalaysia PhilippinesSingapore TaiwanThailand

Lawrence J. Lau, The Chinese University of Hong Kong 46
Chinese Household Savings RatesChinese Household Savings Rates
20
22
24
26
28
30
32
34
36
38
40
1992 1993 1994 1995 1996 1997 1998 1999 2000 2001 2002 2003 2004 2005 2006 2007
Perc
ent

Lawrence J. Lau, The Chinese University of Hong Kong 47
Savings Rates of Urban and Rural Households
Savings Rates of Urban and Rural Households
0
5
10
15
20
25
30
35
1992
1993
1994
1995
1996
1997
1998
1999
2000
2001
2002
2003
2004
2005
2006
2007
2008
Perc
ent
Household Savings Rates: Rural
Household Savings Rates: Urban

Lawrence J. Lau, The Chinese University of Hong Kong 48
Are Chinese Households Saving Too Much?
The high Chinese national savings rate, which sometimes approaches 50%, is also blamed as a cause of the Chinese trade surplus and hence the global imbalances and ultimately the global financial crisis.
It is true that China has excessive domestic savings, but China also has excessive domestic investment. China both saves too much and invests too much. The excessive savings and excessive investment were in approximate balance and thus there was no excess savings, until 2005, when China began to have a trade surplus vis-à-vis the world, but not before that time.
More recently, the Chinese trade surplus has declined significantly, reflecting the decline in export demand and the increase in domestic demand as a result of its economic stimulus programme.

Lawrence J. Lau, The Chinese University of Hong Kong 49
Are Chinese Households Saving Too Much?
The savings behaviour of Chinese households on the Mainland are no different from those in Hong Kong and Taiwan at the same level of per capita household income, with an average savings rate of approximately 30%.
The high Chinese national savings rate of almost 50% is due to (1) the much higher corporate savings rates and (2) the much lower share of GDP received by households as income; in particular, the share of labour is low in China, less than 50 percent compared to approximately 70 percent in developed economies of the West.

Lawrence J. Lau, The Chinese University of Hong Kong 50
Does the Chinese Economy Face Labour Shortages?
As long as the percentage of labour force in the primary sector (agriculture and mining) exceeds the percentage of GDP originating from the primary sector, there is little or no upward pressure on the real wage rate of unskilled, entry-level labour in the secondary and tertiary sectors.
It is exactly what Nobel Laureate in Economic Sciences Prof. Arthur Lewis said in his famous paper on surplus labour more than fifty years ago.

Lawrence J. Lau, The Chinese University of Hong Kong 51Lawrence J. Lau, The Chinese University of Hong Kong 51
The Distribution of Chinese GDP by Sector Since 1952
0%
10%
20%
30%
40%
50%
60%
70%
80%
90%
100%
1952
19
53
1954
19
55
1956
19
57
1958
19
59
1960
19
61
1962
19
63
1964
19
65
1966
19
67
1968
19
69
1970
19
71
1972
19
73
1974
19
75
1976
19
77
1978
19
79
1980
19
81
1982
19
83
1984
19
85
1986
19
87
1988
19
89
1990
19
91
1992
19
93
1994
19
95
1996
19
97
1998
19
99
2000
20
01
2002
20
03
2004
20
05
2006
20
07
2008
20
09
The Distribution of GDP by Sector
Primary Sector Secondary Sector Tertiary Sector

Lawrence J. Lau, The Chinese University of Hong Kong 52Lawrence J. Lau, The Chinese University of Hong Kong 52
The Distribution of Chinese Employment by Sector Since 1952
The Distribution of Employment by Sector
0%
20%
40%
60%
80%
100%
1952
1953
1954
1955
1956
1957
1958
1959
1960
1961
1962
1963
1964
1965
1966
1967
1968
1969
1970
1971
1972
1973
1974
1975
1976
1977
1978
1979
1980
1981
1982
1983
1984
1985
1986
1987
1988
1989
1990
1991
1992
1993
1994
1995
1996
1997
1998
1999
2000
2001
2002
2003
2004
2005
2006
2007
2008
Primary Sector Secondary Sector Tertiary Sector

Lawrence J. Lau, The Chinese University of Hong Kong 53
Is China Ready for G-2?
The United States accounts for approximately a quarter of World GDP.
China, with its GDP accounting for only 7 percent of the World total, and East Asia, with its total GDP (including China) accounting for less than 20 percent of the World total, and still very low GDP per capita, are not large enough to turn around the whole World. The talk about G-2 is pre-mature.

Lawrence J. Lau, The Chinese University of Hong Kong 54Lawrence J. Lau, The Chinese University of Hong Kong 54
China’s Share of World GDP, 1960-present
China's GDP as a Percentage of World GDP, 1960-present
0.0
0.5
1.0
1.5
2.0
2.5
3.0
3.5
4.0
4.5
5.0
5.5
6.0
6.5
7.0
7.5
1960
1961
1962
1963
1964
1965
1966
1967
1968
1969
1970
1971
1972
1973
1974
1975
1976
1977
1978
1979
1980
1981
1982
1983
1984
1985
1986
1987
1988
1989
1990
1991
1992
1993
1994
1995
1996
1997
1998
1999
2000
2001
2002
2003
2004
2005
2006
2007
2008
2009
Perc
ent
Lawrence J. Lau, The Chinese University of Hong Kong 55
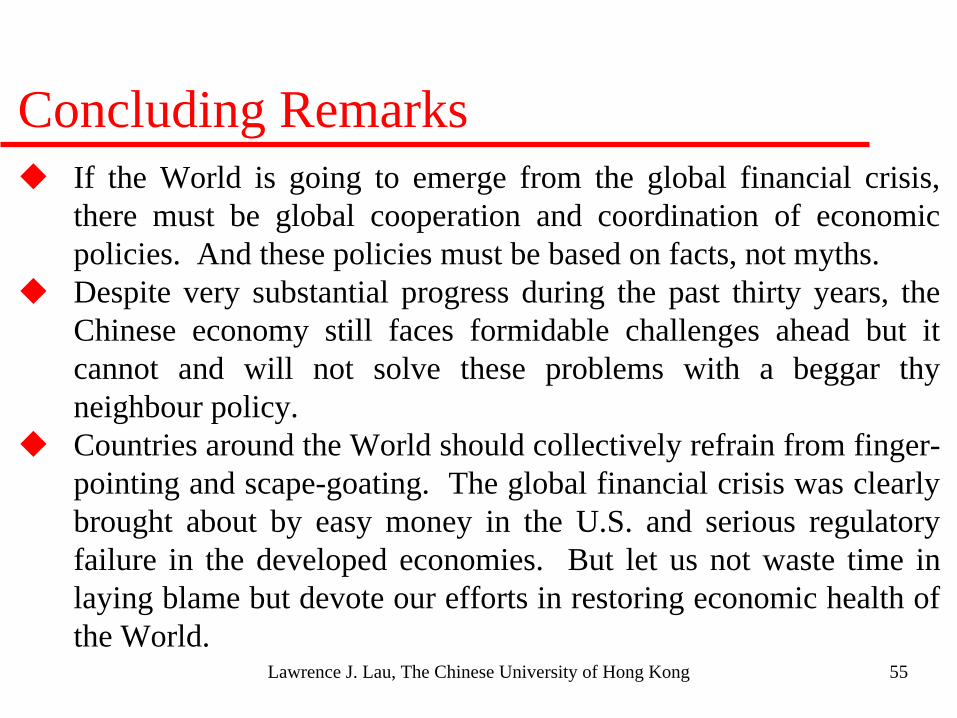
Concluding Remarks
If the World is going to emerge from the global financial crisis, there must be global cooperation and coordination of economic policies. And these policies must be based on facts, not myths.
Despite very substantial progress during the past thirty years, the Chinese economy still faces formidable challenges ahead but it cannot and will not solve these problems with a beggar thy neighbour policy.
Countries around the World should collectively refrain from finger- pointing and scape-goating. The global financial crisis was clearly brought about by easy money in the U.S. and serious regulatory failure in the developed economies. But let us not waste time in laying blame but devote our efforts in restoring economic health of the World.