Some methods of comparing sociometric matrices
64
Transcript of Some methods of comparing sociometric matrices


L I E) RARYOF THL
U N IVER.5 ITYor ILLl NOIS
370

Return this book on or before theLatest Date stamped below.
University of Illinois Library
OiX :-,,r,]0
W(f 2 5 '"l
OfC 2 2 i5|,}
L161—H41

Digitized by the Internet Archive
in 2012 with funding from
University of Illinois Urbana-Champaign
http://www.archive.org/details/somemethodsofcom05hohn


I?Gtno. 5
BUREAU OF RESEARCH AND SERVICE
College of Education
University of Illinois
Urbana, Illinois
SOME METHODS OF COMPARING SOCIOMETRIG MATRICES
Franz £. Hohn
with discus tion by
Lee J. Cronbach
Study performed under Contract N6ori-07135with tiie Office of Naval Research
Project onSocial Perception and Group Effectiveness
Technical Report No. 5January, 1953
inft UBRWV Of THF
SEP 27 1954
UNWtRS.rr Of .UiNU..


B7o
SOME METHODS OF COMPARING SOCIOMETRIC MATRICEsi'
Franz E, Hohn
Department of Mathematics, University of Illinois
Overview
An approach often used in sociometric investigations is to have each
of the members of a group of n individuals rank all the others according to
some characteristic such as vrlsdom, leadership ability, likeability, etc.,
with the object of studying, and perhaps improving, the structure of the
group vjith respect to this relationship. One of the great desiderata in
this connection is a fruitful method of comparing results obtained from
the same group (a) at different times but with respect to the same character-
istic or (b) at the same time but with respect to different characteristics.
Again, i^iien the members of two groups of the same size are in one-to-one
correspondence, it may be desirable to compare results obtained from the
two groups with respect to the same characteristic. This paper presents
two measures which may be useful in making comparisons such as these*
For the investigation of what is called here the hierarchical structure
of a group, this paper introduces first a function "h" of the ranks. This
h, called the hierarchy index, ranges from the value when the members of
—This is Technical Report No, 5^ prepared under contract No, N6ori-
07135 between the Office of Naval Research and the College of Education of
the University of Illinois,

ri.V -'i''
i,,:,
»;•«;>• ^.

-2-
the group are indicated by the data to be "equal" xjith respect to the
characteristic in question, to the value 1 when the most extreme t^-pe of
hierarchical relationship appears. Differences betv/een the h-values obtain-
ed from two sets of observations, whether from the same group or from dif-
ferent groups, may be tested for significance.
The paper next introduces a coefficient of agreement "0" as another
method of comparing the group structures associated with two sets of data
from groups of the same size. The coefficient ranges from -1 when the
data display opposite hierarchical characteristics, to +1 when they displ^
the same hierarchical characteristics.
The measures and h appear to be of considerable sensitivity. How-
ever, their usefulness in sociometric research vrill depend ultimately on
the significance of the concepts on which they are based and on the appro-
priateness of the manner in which the measures arithmetize those concepts.
These issues can be decided only by the test of actual use of the measures,
1, Assumptions and Definitions, Let as assume that in a group of n in-
dividuals, each member ranks the other n-1 members, from highest to lowest,
accordj.ng to some agreed-cn characteristic, Ilore specifici ally, we assume
that each member assigns the other members the ranks
n-1, n-2, .,,, 3, 2, 1
in some order, so that in fact no tvjo individuals are assigned the same rank
by any one member. It is convenient to assign the members of the group the
names "1", "2", ,,, "n". Then the ranking data may be recorded systemati-
cally in the form of a table:


-3-
Ratees
Raters
•112 ... n* . .—
i 1
2 :
;' !
;1
i
1
1
!
1
11nil !
Here the entries 1, 2, ...^ nin the outer column are the names of the
members assigning the ranks and the entries in the top row are the names
of the members being ranked.
It is desirable for the purposes of what follows to enter a zero
in the first row and first column, the second row and second column, and
so on throughout the table. This is as though each individual were requir-
ed to assign himself the rank zero. If we denote the entry in the jj;^ row
and k— column of the body of the table by s., then
(1.1)jk
(p if "j" assigns "k" the rank p
(
^0±£ ^ = k.
We then have the square array of ranks:
I s
'l2 'l3 • • •
'21 23• • •
Ini
'2n
s s; nl n2 n3
• .
We shall call this the data matrix S of the group viith respect to the
characteristic in question. In experimental work, it is important to
remember that this data matrix is not necessarily a stable property of the

» 4
fc- 1 «

group, but may change drastically with time. Indeed, the proper control
of such change might well be a primary objective in some circumstances.
In S \-je novr form the column totals to get the score structure "s" of S;
where
(1.2)
Id. n
s=s +s +...+S =2 s.k Ik 2k nk -5=1 jk
The total score, s , received by the k— individual will be called simply
his score . Two score structures differing at most in the order of the
integers appearing in them will be called similar .
The data matrix S associated with a given group is not uniquely de-
fined since a different assignment of "names" to the members of the group
resuLlts in a symmetrical permutation of the rows and columns of .S, It
is a m.atter of definition that this does not change the structure of the
group. For example, if n = 3j we might obtain for one method of naming the
members of the group, the data matrix
;0 2 1i
s = :2 1
2 1 Oj
If now we interchange the names of members "1" and "3", we in effect inter-
change the first and third rox-js as well as the first and third columns of S,
iVe thus obtain the data matrix
fO 1 2'1
10 2^1=
!l 2

!..,.(.
::;- Af :KM:
•Mi '^J^!^
>»^r••r "t
:
i I J,"^'
JL i -' V .' ..'U "v
viiA I ;':•:;.;.: ;to ^•'\~ xi-
ir

-6-
It will be noted that S and S , like any two data matrices differing only
because of different arrangement of the members of the group, have score
structures which are similar according to our previous definition. The
converse is not true, however. That is, the data matrices of groups having
similar score structures cannot always be transformed one into the others
simply by rearranging the individuals of the group.
From the definition of the ranking operation, it is clear that one,
2but not more than one, of the s, 's, can assume the value (n-1) = (n-l)»(n-l)
and that no higher score is attainable. Similarly, one of the s, 's,
but not more than one, can assume the value (n-1) •I vxhich is the lowest score
attainable, Ihe scores s^ have the total
(1.3) 2 s = n f(n-l) + (n.2) + ... + 2 + l] = ILlglii
since the expression in brackets is the sum of the entries in any one of
the n rows. It follovjs that each score structure is a partitioning of
n (n-l)/2 into n parts s such that
n-1 $\ ^ (n-1)^, k = 1, 2, ,,., n
2and such that not more than one s is (n-1) or (n-1).
The number of distinct data matrices S which are possible for a given
value of n is rather large even when n is small. In fact, there are (n-l)l
ways of filling the off-diagonal positions in each row, so that there are
1 (n-1) 4 J such matrices possible. For n=3, this is (21)-^ = 8, but for
n=U it is (3i)^ = 1296.
5y way of illustrating some of the ideas so far presented, we list
all possible data matrices for the case n=3. The matrices


^-
! 2 1
10 2 and
2 10
iO 1 2
2 1
12 1
each has the score structure (3^3^3)« Also, interchanging the names of
individuals 2 and 3 t^ll reduce one matrix to the other. The matrices
2 1
2 1
0',
!! 2 1
!
1
2 i;
12 0-,
10 2 1
il 2
1
2
2 1
2i |0
il
01 '2
1
1
iO 2
°J^
Il 2i
t
;i 2 qj
all have a score structure similar to (U>3^2) and again, any one may be ob-
tained from any other by symmetric permutation of the rows and columns.
This last mentioned property does not persist beyond n = 3« Indeed,
the matrices
2 3
3 2
3 2
21
3 1
!
I
1;and
3
I2 3i
;3 1
2
2
2
both have score structure (8,7^6,3) but one cannot be reduced to the other
by symmetrical permutation of the ro-js and columns. In the first the four 3's
are distributed among three individuals, i^hereas in the second they are
distributed betvxeen two individuals.

t'•-"•
«a; •..••' i
siJt .T:'*i"=<.^!!:. »••::':•'

-7-
The lar^e number of data matrices possible for given n emphasizes the
importance of the score structure as a method of condensing the information
contained in the matrices. When n = U^ we have 12^6 matrices, as noted above,
but there are only l6 score structures, as x;ill appear later.
2« The Hierarchy Index . Among the score structures two extreme cases are
of particular interest. The equcdity is the structure iri-th
(2.1) h ^2 — ^n 2
that is, the case when every member of the group has the same score.
An example of this is given by the matrix:
n-1 , > 1
1 , 2
2 1 . 3
3 2. I;
n-2 n-3 , > n-:
n-l n-2 .
At the other extreme is the score structure x-jhich we call the extreme
hierarchy. In the case of this score-structure, vje have one individual
with the highest possible score, thereafter one vjith the resulting next-
highest possible score, and so on. For example we may have


-8-
"with
(2.2)
S =
n-1 n-2
n-1 n-2
n-1 n-2
n-1 n-2 n-3
••• ••• •••
n-1 n-2 n-3
n-1 n-2 n-3
n-1 n-2 n-3
2
2
2
2
•
2
1
i
s^ = (n-1) (n-l)
s^ = (n-2) (n-2) + 1- (n-1)
s = (n-k) (n-k) + (k-1) (n - k + 1)
s = 1»1 + (n-2)* 2
I s^ = (n-1). 1
1
1
•
1I
I
I
1j
Any score struct'ore siinilar to (2,2) is also an example of the extreme
hierarchy, A little thought uill make it clear that any data matrix whose
score structure is an extreme hierarchy can be reduced to the form given
above by suitable n'ombering of the members of the group.(2.2)
In the extreme hierarchy/ v/e have s, - s, = n-2 so that the scores^ k k-i±
2of s are equally spaced n-2 units apart, beginning with (n-1) and ending
with n-1. It is thus a simple matter to write down the score structure
for an extreme hierarchy when n is given.


-9-
In order to obtain a measure of where a given score structure falls
between the equality and the extreme hierarchy, we note first that the mean
score of a score structure is
n
(2.3) i = 1 23 = Mnil
and that the variance is therefore
(2.U) Var, = 1 Z (s^ - nin^lL )2 .
The maxir/am variance of the s's will evidently be obtained when they
have the values listed in (2.2), The variance in this case is given by
^^•^^^"^max
' ^Jil
("-k)^ * (k-l)(n-k+l) - SJndjJL ^
= (n2 - l)(n-2)2/l2.
We may therefore define a hierarchy index^ h, as the ratio of the actually
observed variance to the maximum possible variance. From (2, u) and (2,5)^
we see then that
(2.6 )
This reduces without difficulty to -the form:
n(n^-l)(n-2)^ k=l^ ^ ^ ,
(2.7) h = 12 fzs, 2 - n3rn-i}£\^ ^ n(n2-l)(n-2)^ (^
^^ ^ / •
From the definition it follows at once that the minimwi value of
h is zero. This value is obtained when the score structure is the equality,
Similarly, the maximum value of h is 1, vjhich is obtained when the score
structure is an extreme hierarchy*

. N''X

-10-
It should be noted that we can have a hierarchy in the sense that
\> s^> ...>s2 7 •••'^"n*
for exar.ple, vrithout having the extreme case defined by (l.U). For such a
hierarchy, h < 1. An exariple is given by the data matrix
h
3
3
!3 h
k
h
3
3
2
2
1
2
2
1
I
i
1 !
I
l|
0!
irLth s = (l5, Ih, 10, 6, 5)^ h = Ul/hS = .^l"*"* Hoi-jever, if \-je have an extreme
hierarchy where n = 5^ the matrix has a score structure similar to
s = (l6, 13, 10, 7, U), with h=l, of course,
/jiother interesting special structure occurs only when n is even, be-
cause it takes an odd number of persons to form an equality. With an even
number of persons, we can have
^ s. = s^ = ... = s, = ("-^,f * Is^ - (n-1) J ^2 ~ ''^ ~ ••• """n
~ "T
so that if n > 2, we have one leader , the other members of the group con-
stituting among themselves an equality. Such a score-structure may be called
an extreme leadership. Denoting h by h- in this case, Xire find
h =_J1 n+1
which sqDproaches for large values of n. Even though the value of h.. is
small, an extreme leadership might have great social importance.
This demonstrates that h is not to be regarded as a measure of the
possible social importance of _a given score structure . It is only a
measure of resemblance to the extreme hierarchy.

-n-
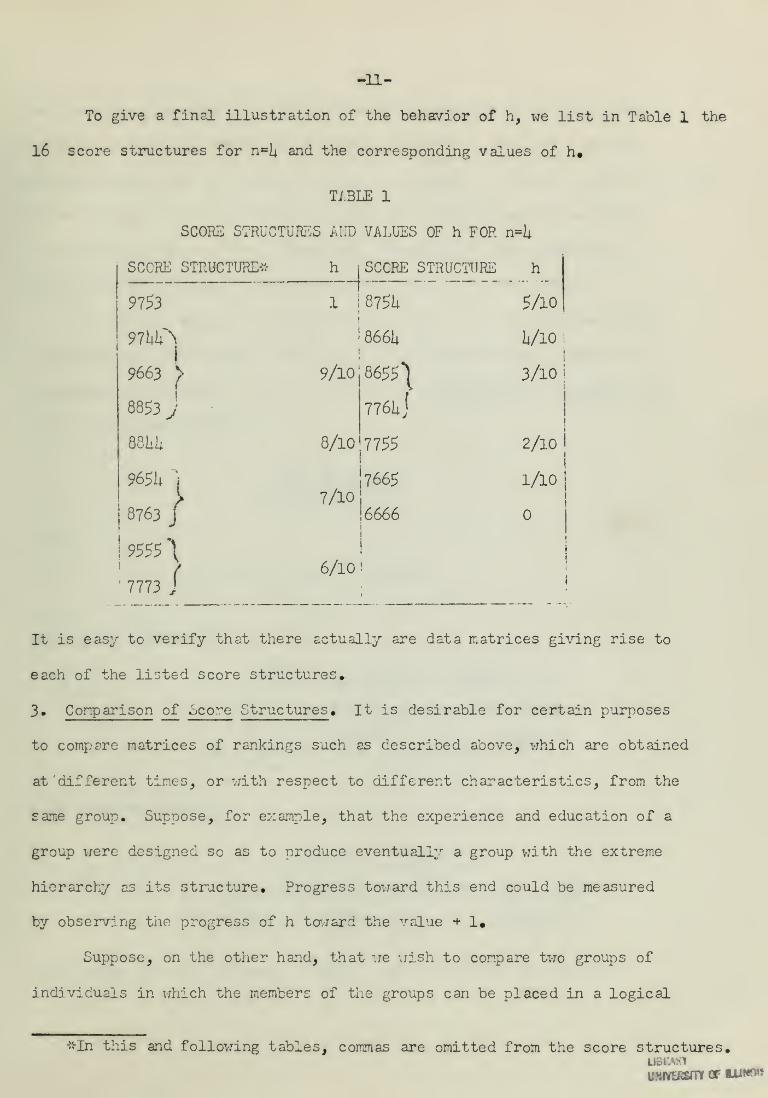
To give a final illustration of the behavior of h, we list in Table 1 the
16 score structures for n=U and the corresponding values of h«
TABLE 1
SCORE STRUCTURES AIJD VALUES OF h FOR n=
SCORE STRUCTURE-"- h j SCORE STRUCTURE
9753
hj
SCORE STRUC
I
9663 p>
8853 j
881.1;
I
8763 J
I
^^^^ \' 7773 J
1 i875Ui
i866U
9/10 86551
8/10
7/10j
776UJ
7755
7665
16666
h
5/10
U/10 :
!
3/10 i
2/10
1/10
6/10!
It is easy to verify that there actually are data matrices giving rise to
each of the listed score structures
3» Conp arisen of ocore Structures . It is desirable for certain purposes
to compsre matrices of rankings such as described above, which are obtained
at 'different times, or with respect to different characteristics, from the
same group. Suppose, for example, that the experience and education of a
group were designed so as to produce eventually a group with the extreme
hierarchy as its structure. Progress toward this end could be measured
by observing the progress of h tovrard the value + 1.
Suppose, on the other hand, that we -jish to compare two groups of
individuals in which the members of the groups can be placed in a logical
^In this and following tables, commas are omitted from the score structures.
unrvERsmf of iwwj

I

-12-
one«to-one correcpondence* Here corresponding members of the two groups
would be assigned the same number "name", of course, /,s a pair of such
groups we could use two baseball teams, for example. Then the score structures
of the two groups may be compared sirr.ply by computing the product-moment
correlations of these score structures. For fixed n, the correlation
coefficient in this case takes on one of a finite set of values.
Let s= (s- , s«, ••• s ) and s'= (s' , s^K ••• , s ' ) be two score
structures obtained from the same group or from two groups, under the
hypotheses stated above. We then define the coefficient of agreement , 9,
of the tvjo score structures to be
Q = Gov (s, s')
^Var(s).Var(s')
Sincen n2 s, = 2 s' = ^(^-^)
k=l ^ k=l ^ 2
this may be written as
(3.1)e =
which reduces readily to
(3.2)^ ^
^ ^
n3(n-l)2
Since either n or n-1 is even, r^^i^-^)^ will always be an integer.
4


-13-
If we put
we have
so that the formula (3*2), on elimiriction of Zs,s»^, may be written in the
forni:
(3.3) Zs\-HZ3^2 .ln3(n..l)^ - Zd^2 .,2
k9 =
Since the s's are ordinarily not very large, formula (3'>2) is not too in-
convenient, especially if a table of products is available, Hovjever,
(3,3) enables us to work vxith a table of squares, and even for small n
it is apt to be more convenient than (3 2) since s, may be as large as
(n-l)2.
In the event that both s and s' are similar to the score structure
of the extreme hierarchy, \ie have
Ls"^^ = Zs', = Z [(n-k) + (k-l)(n-k+l)|
= ^? (2n^ - 5n3 + 3n^ + 2n - 2) ^
Then2 _ 1
2Zs^j^ - 1 n3 (n-1)^ = ^ n (n -l)(n-2)
and 9 assumes the much simpler, special form
Q = ]_ » 6Zd^
n(n2-l)(n-2)''^ •

•r -'
.J-",'')":'"''
j{•
A'

It is interesting to note that when s is the extreme hierarchy:
s =^(n-l)^, (n-2)^ + (n-1), ... , (n-k)^ + (k-l)(n-k+l) ...j
and s* is the reverse extreme hierarchy, namely
s' = ^0^ + (n-l)*l, 1^ + (n-2)«2, ... , (k-l)^ + (n-k)*k,...J
2then 2d takes on its maximmn value wnich is in fact
,2.^^ _ n(n2-l)(n-2)^max
so that
e =1-2* —-..-1;^" --.
^ "ifiax
We complete the dexinition of as follo^js. In the event that one
or both of s, s' should ba the equality, the expression '3 •2) for is
, undefined. In order to preserve the symmetry of the distribution of
values of 9, we define to be zero in such a case.
In order now to illustrate the computation of 0, let us consider
a society of five individuals for whom are obtained the three following
score-structures, say with respect to three different characteristics:
s = (16, 13, 10, 7, U), s» - (15, lU, 10, 6, 5) and s" ^ (9, 9, 9, 9, lii)<
For s and s« we have Zd^ = h, Zs^, » 590 and 2s' ^ = 582.k k
Then
e(s,s.) = _590 ^ 582 -1000 - U __ 168 . 0.9891.
\/t2'590 - 1000)(2>5S2 - 1000) V 180.l61i

J"-
, 2 J.- !.*'_*
Vl-a) )4-^
ivrx
.C*::rji;"',
-i;,- llC-XV. "*41P 3 r
• - '• \
1.'
9W--i
:;' -.'i;
..«:•
ii-
:..! <

-15-
On the other hand, for s and s" we have Zd^ = 170, Zs ^ = 590 and
2s". = 520. Hence, in this case.k
9(s,s") , 590 ^Jg^^ioo^^jj^ = __41_ = .0.35US\/(2«590 - 1000) (2-520 - 1000) y iBo.iiO
These results seem intuitively to be quite satisfactory.
The measures 9 and h are of course related, although the formula is
not simple. From (2,7) we have, after a little manipulation,
n(n^-l)(n-2)^h „ ^Zs^ ^ n^(n-l)2^ k 2
2so that, writing a similar formula for h' in terms of 2s' , we obtain after
substitution into (3 •3):
(3.U) Q _ _l_fh + h' 6^d^k
'\/l^\^ "r.(n2-l)(n-2)2
)in the event that hh' / 0#
U. Statistical Considerations , In order to evaluate the significance of
changes in the score structure of a group, or the significance of a difference
in the score structures of two comparable groups, we need certain statistical
tables. For instance, vihen n = 3^ we consider Tables 2 and 3« In these,
the probabilities for h are computed, on the assumption that the rankings
are random phenomena.
Table 2
PROBABILITY DISTRIBUTION OF h FOR n = 3Score Number of matrices
structure with a similar scorestructure h Pr(h) Pr(h^ listed value)

. /
^- S/A
1

-16-
TABLE 3
PROBABILITY TkhlE FOR h. - h,, n
i Values of 'Ao, of p^irs
1
h of matricesgiving listedvalue of
h2 -h^
Pr(h2 -h^
Pr (h2 - h^
>. listedvalue)
-1 12 3T6
1
10 10 13T6
+1
1
12 3 315
Suppose, for exsr.iple, that as a result of training, h for a group of 3
men rises from to +1. The probability that this is the result of pure
chance rankin^^s is |_ , Suppose next the method of training applied to
five such groups results in the same change. The probability that this happens
by pure chance isj^^. 5 = 0.00023 so that we may conclude that the method^lo^
of training is effective in bringing about this change if we set the level
of significance at 0,001, for example.
For n = 3) we may also construct Table i; for testing in a similar
fashion the significance of observed values of 0,
TABLE h
PROBABILITY DISTRIBUTION OF 9 FOR n = 3
Possibleof e
values No, of pairs
of matricesgiving listedvalue of 9
Pr(9)Pr/ 9 >y lis
• value
ted^
y
-1 6 0.09375 1.0000
12 12 0.18750 0.90625
28 O.I43750 0.71875
1 12 0.16750 0.28125
1 6 0.09375 0.09375

h
1
J.
»
c~
di
r-* ...
^1
Vr

-17-
For n = U, we have Tables 5 and 6#
TAETF, 5
PROBABILITY DISTRIBUTION OF h FOR n - li
IIuiTiber of N-Jmbcr^.
Score matrices of score Pr(h_^structure with a h structures Pr(h) lie ted
sLTiilar with given value)score hstructure
9753 2U 1 21; 0»0185 0.0185
97hh 2U\9663 9/10 72 0.0556 0»07l|l
8853 2h;
88IiU 2i| 8/10 2k 0.0185 0.0926
965U8763
96^96}
7/10 192 O.II182 0.2U07
95557773 2Uj
6/10 h8 0.0370 0.2778
875U Ihlj 5/10 II4U 0.1111 0.3889
866U % U/io 96 0.07141 O.I463O
8655776U
liiU \lUU i
3/10 288 0.2222 0.6852
7755 120 2/10 120 0,0926 0.7779
7665 26U l/lO 26U 0.2037 0.9815
6666 2U 2U
1296
0.0185
1,0000
1.0000
1296

I

-18-t
TABLE 6
PROBABILITY TKBlZ FOR hg - h^, n = U
(Fop negative values cf h2 " ^f "^^-^ probabilities msy be
found by s^Tnraetr;^ c^ns:(i?rc.t^ons»)
10
__610
J10
U10
_310
2
10
h- - h ^(^2 '" ^. •Pr(h2 - h > vJluo
listec'. jr
0.0003U 0^00031
0,00i;8 0.0051
8
lO 0.013U 0*0185
^ 0.0158 0.03U3
0.0U63 0.0806
0.0336 0.1lli2
0.0686 0.1823
0.0556 0.2383
0.1070 o.3Ij53
110 0.0823 0.i;276
O.lUii? 0.572U


-19-
These last two tables are introduced primarily to give the reader
a little more feeling for the behavior of h and of differences in h's, A
similar probability table for the values of when n = U vjould not take too
long to construct.
Since experimental n's are apt tc be a good deal larger than U, the
application of statistical significance theory to h and 9 must await the
determination of suitable approximations to their distributions. Our
seems closely related to Kendall's "coefficient of concordance" W, so that
one might reasonably expect adaptations of his methods to yield useful re-
sults here.


Discussion by
Lee J. Cronbach
Sociometric methods have been given relatively little study
as a formal problem in pi3jfchometrics, although a fev/ mathematical
treatments of the problem are appearing. Since it appeared probable
that a fresh mind, acquainted with matrix algebra, could suggest
nek/ analyses of sociometric data, we asked Dr. Hohn to study reports
of sociometric studies and to explore whatever leads suggested
themselves.
His paper gives a detailed analysis of a particular approach
v/hich he calls the hierarchy index. In this comment, I desire to
relate his development to comparable procedures used in test
psychometrics, and to indicate some possible interpretations.
The first point to be noted is that h, the hierarchy index,
is a ratio of variance to maximium variance (vA'' max) . Such a ratio
v/as once oroposed by Ferguson (3) as an index of homogeneity among
test items, and is linearly related to the some^'hat more familiar
index C/C max (C being total interitem covariance) proposed by
Loevirger (6). In most studies, these are not superior to coefficientn C
aloha (n-l)V , v/uich is a general form of the Fudar-Richardson
coefficient. Alpha is an excellent measure of internal consistency(2)
.
The special formula for h is appropriate to sociometric data
where each person ranKS every other. Unlike the item-person matrix
of test research, this matrix is square and has fixed ro.j means.
Moreover, the diagonal entry is ordinarily missing. This means
that rows cannot be perfectly correlated. These properties are
considered in Dr. Kohn's development. i!o study has been made of


-2-
the degree to which, for computational purposes, h is superior or
inferior tcP^ or Kendall's J.
The suggestion that sociometric matrices be evaluated in terns
of hierarchy is of general usefulness. ,^hile the h formula no
longer applies, the same general technique may be used for matrices
where the person reports (say) his three highest and three lo^/zest
choices. This type of index has several related interpretations.
(1) h is a measure of hierarchy. As h becomes closer to 1,
the choice relations among a group aoproach a status system vi/here
eacji person prefers persons of high status and tends not to prefer
persons below him. Groups which are divided into cliques v/ill
have a lok^er degree of hierarchy than groups .vhich have a pyramidal
system, but <vill not necessarily be more hier^^rchical than the
group which has random distribuLion of choices. It may be important
to study the conditions under v/hich hierarchy develops, and the
differences in performance of groups of different hierarchy.
(2) h is a measure of the extent to »vhich persons constitute
a scale in the quality being measured (in the Guttman sense). Just
as Guttman can examine whether items can be arrayed in a continuum
which is oerceived similarly by all persons, so Hohn's index
examines v^hether persons form such a unidimensional continuum.
It is of interest to note thot some hierarchies which satisfy
Guttman 's requirements for a scale are not extreme hierarchies in
Hohn's definition.
(3) h is a measure of relialiiity. For the rectangular
matrix u^here raters need not be ratees, Horst has shovm thut OC
provides a measure of reliability or agreement of raters (5).
Cf^ estimates the correlation expected between sets of scores

i

-3-
obtained from t^w samples of raters, h performs the same function
for the square matrix of sociometric ranks. This a;3pears to meet
PepinsKy's demand for a measure of reliability of sociometrics,
in the sense of consistency over .iudges (7). No splitting of the
group into chance halves is requ-.red.
(h) h is a measure of communality of thinking among .iudges.
If a group has a large h, the raters agree on their criteria and
frames of reference, a low value of h indicates diversity in
mem.bers' perceptions. Thus Gage and Exl.ine (using the split-half
technique) find greater agreement on ratin^^s of others' ;:)roducti\'ity
than on rating of the same persons' leisure time attractiveness (h)
•
If a group has low i'^ternal consistency in ratinge of "degree to
v/hich each person contributes to the aims of the group" , this ivould
suggest the oresence of conflicting frames of referonce and .^e
might predict that such a group -vould be inefficient. Rcby has
done preliminary research of this kind. Studies of change in h
over time might reflect develooment of a common reference frame,
es )ecially if h .jere detorm.ined separately for such dimensions
as likin, and contribution to the tasK.
..e should note that, like •':^ , h depends on the size of the
group. It will tend to be larger in a larger group, other things
being equal. Therefore h must be interpi'eted vjith the size of the
group in mind, or some transformation v;ill be required such as the
"phi bar" index (2) dexdved from c^r ,
A variant of conventional internal consistency analysis also
may be profitably applied to sociometric data. The conm.on item-
test correlation has its analog in the correlation of any ro^/ nfith

I

-h-
the marginal row, i.e., v/ith the score structure. This is a measure
of the extent to v^hich the individual shares a frame of reference
v/ith other raters, one can similarly correlate the rcv; vath a
rov/ of criterion scores. Anderhalter, .jilkins, and Rigby (1)
apilj some of these aijiproached to ;.'.arine Officer Candidates, and
shovj some evidence that the person »jho agrees with the marginal
rating or with officers' ratings of the candidates, himself tends
to receive a hig-h rating. Homogeneity of these groups, as .-judged
by the mean row-marginal correlation increased »vith tire.
Hchn's 9 is not novel mathematically, being a direct application
of product-moment technique. It does, hc-.-ever, dra./ attention to
a possibly fruitful type of analysis v/hich seems not to have been
made except in studies of stability/ of sociometric scores over tLme.
Consider its possible application to a bomber crew, where each man
has a designated station. Then a crev/ where the navigator is rated
high, and the fligiit engineer average, is in bome respects different
from a crew v/here the reverse is true. Applying 9 to the score
structures of many crews would yield a correlation matrix v;hich
could perhaps be separated into several types of structure. It is
reasonable to suppose that tiiese structures might be significant
either as reflections of values vi)ithin the crevj, or as communication
networks ..hich influence effectiveness.

I

References
1. Anderhalter, 0. F., ./iikins, L. , and Rigby, ..larilyn Y..
feer Ratir^s . Technical r>i;pt. no. 2, Department of Psychology,St. Louis University, St. Louis pro.iect, 1952.
2. Cronbach, L. J. Coefficient Alpha and the internal structure of
tests. Psychor.etrika , 1551, --6, 297-33U.
3. Ferguson, G. a. The reliability of mental tests . Lender; Univ.
of London Press, 19^1.
h» Gage, N. L. and Exline, E. V. Social perception and effectivenessin discussion groups . Human Relations , in press.
5. Horst, p. ... generulizcd oxpreecicn for the reliability of
measures. Psychometrika , 19h9 , '^kj 21-31.
6. Loevinger, Jane i. systematic approach to the construction andevaluation of tests of alility. Psychol. I.lonogr . , l!?u7, 6l, No. h>
7. Pepinsky, Pauline N. The meaning of "validity" and "reliability"as applied to socicmetric tests. Educ. ps^chol. heasmt ., 191+9.
9, 39-51.

•?.::1- •^.'-


V/